Article

Creating Customer Value for Product Service Systems by Incorporating Internet of Things Technology

1
Department of Resources Engineering, National Cheng Kung University, Tainan 701, Taiwan
2
Department of Business Administration, Southern Taiwan University of Science and Technology, Tainan 710, Taiwan
*
Author to whom correspondence should be addressed.
Sustainability 2016, 8(12), 1217; https://doi.org/10.3390/su8121217
Submission received: 5 July 2016 / Revised: 6 November 2016 / Accepted: 19 November 2016 / Published: 24 November 2016
(This article belongs to the Section Economic and Business Aspects of Sustainability)

Abstract

:
Product service system (PSS) design has drawn much attention in the last decade and is expected to be affected by the fast-growing application of Internet of Things (IoT) technologies. This study proposes a six-step design method by extending visual mapping design methods for the PSSs that plan to apply IoT technologies. A new concept of “pseudo actors” that highlights the role of the objects incorporating IoT technology is introduced in plotting actors and system maps and a useful table is recommended to help evaluate alternatives of IoT technology application. An example of a battery swapping system for electric scooters is illustrated for application potential. Actors and system maps with “pseudo actors” are presented and analyzed, while IoT technologies are applied in batteries, charging stations, cell phones, and scooters. Designers could use the proposed method to select appropriate application of IoT technologies with higher customer value in a product service system design.

1. Introduction

Product service system (PSS) design has drawn much attention recently because of its important link to sustainability. Goedkoop et al. [1] argued that in a PSS service should be jointly considered with product design so that higher eco-efficiency can be achieved. A definition of PSS given by Mont [2] is “a system of products, services, supporting networks and infrastructure that is designed to be competitive, to satisfy customer needs, and to have lower environmental impact than traditional business models”. Ceschin [3], Tukker [4], and Piscicelli et al. [5] argue that PSS is a good solution for reducing overconsumption and resource depletion. Lindahl et al. [6] and Vezzoli et al. [7] mentioned that PSS could help lower resource use and achieve dematerialization. Many definitions of PSS have been given in the literature. Examples include Goedkoop et al. [1], Mont [8], Tukker [4], and Baines et al. [9]. Tukker [4] summarized eight popular types of PSS, including product-related service, advice and consultancy of product use, product lease, product renting and sharing, product pooling, activity management, pay per unit use, and functional result. A common ground of PSSs contributing to sustainability is that PSS often provides services allowing people to use products instead of actually owning them, thereby reducing resource depletion and waste generation.
In the literature many authors have discussed various design methods for PSS. Good examples include Morelli [10], Auric et al. [11], Komoto and Tomiyama [12], Mussang et al. [13] and Shih et al. [14,15]. After a thorough review of PSS design methods, Vasantha et al. [16] summarized 20 aspects that a good PSS design should cover. One key issue that was first raised by Morelli [10] is how to deliver a service, as well as identify inbound actors who are actually involved in information transmission and service delivery. A series of articles have shown how to include actors and the activities among them graphically so that further detail analysis and idea inspiration could be conducted. Examples of this type of visual mapping methods include: “Activity Modeling Cycle” (Matzen, [17]), “Customer value Chain” (Ishii, [18]), and “Service Ecology Map” (Moritz, [19]). Recently, Lindahl et al. [20] and Desai et al. [21] integrated the ideas and proposed a method with “Actors and System Maps” that was easy for designers to understand and use to communicate with each other. Especially from a PSS perspective, designers could consider actors, the flows of products, services, and information, and related activities in an integrated plot simultaneously. The advantage of the method is being able to visualize the network of actors involved in an underlined PSS and show the flows of products, services, and information among actors so that more detailed analysis and evaluation could be made accordingly. This work takes advantage of visual mapping methods and extends the latest one, a design method with actors and system maps, for further system analysis and idea inspiration by incorporating Internet of Things technology.
Internet of Things (IoT) is a concept that implies all physical objects could be connected to the Internet and thereby communicate with each other. It has become more important because of its fast growth and the great potential of digitizing things in providing new value and creating new business. Many reports have predicted the enormous potential of IoT technology in various settings, including the home, office, factory, vehicle, city, etc. For example, McKinsey Global Institute [22] predicted the potential economic impact of IoT technology application at as much as 11.1 trillion US dollars per year in 2025, while Greenough and Camhi [23] projected that more than 34 billion devices will be connected to the Internet by 2020 and private business will be the top adopter of IoT solutions. Atzori et al. [24] stated that IoT application could be a promising paradigm with integrating several technologies and communication solutions. Gubbi et al. [25] indicated that IoT technology makes interconnected objects that not only harvest information from the environment (sensing) and interact with the physical world (actuation/command/control), but also use the existing Internet to provide services for information transfer, analytics, applications, and communications. This trend would affect the design of service systems since objects (things) that apply IoT technologies may be smart and connected and have the ability to memorize, communicate, and deliver services, thereby possibly supporting or even replacing conventional human actors. It is important to find a suitable design method that could properly present and evaluate new service systems that apply IoT technologies. This study hence introduces a new concept of “pseudo actor” that describes the objects incorporating Internet of Things (IoT) technologies and uses it in the design process. The advantages of introducing the concept will be presented later.
As IoT-related hardware and technology have experienced rapid growth and improvement, how to actually apply them, generate new services, and create value become important issues. Dijkman et al. [26] studied how IoT can help in creating a new business model by using a canvas provided by Osterwalder and Pigneur [27], which includes nine building blocks. The relative importance of the options that link to IoT applications in the nine building blocks was presented through a literature review, an interview, and a survey among practitioners. Among the building blocks, value proposition plays a central role in creating a new business model. Maurya [28] proposed a lean canvas that puts more emphasis on generating a new value proposition by introducing four new blocks: problem, solution, key metrics, and unfair advantage to replace the blocks of key partner, key activity, key resource, and customer relationship. Among the blocks, the new blocks of problem and solution together with “value proposition” are highlighted and used in this study to explain how IoT could be implemented as technological “solutions” to help generate a new service design and new customer values. Bucherer and Uckelmann [29] claimed that IoT could provide more customer values since IoT technologies can help overcome some technical problems, such as finding the right information and providing access anywhere and anytime. These statements are still true for a product service system (PSS), indicating that IoT technologies may bring in new solutions for existing/hidden problems and inspire new designs.
The goals of this work are twofold, including (1) extending visual mapping methods with the concept of “pseudo actors” for detail analysis and idea inspiration; and (2) proposing a useful table to evaluate candidate applications of IoT technologies based on customers’ weightings on their unmet needs. The reasoning, ideas, and advantages of introducing the concept of “pseudo actors” and the evaluation table are presented in Section 2. Section 3 proposes a six-step method that includes the extension of the method with actors and system maps with the concept of “pseudo actors” and a useful table that helps evaluate and compare the customer value brought in by applying alternative IoT technologies. Section 4 and Section 5 present the background information for an illustrative example of a battery swapping system for electric scooters and the results of executing the proposed method.

2. Visual Mapping Methods for a PSS Design and Ideas for Proposing a New Method

Visual mapping design methods have been used in the conceptual design phase to comprehensively identify pertinent stakeholders, their relationships with each other, and their roles in the service system. This type of method enables designers to identify how value is generated in the whole network through service provision. It can also reveal opportunities to include other actors and stakeholders who are not yet considered in the current system, as well as how relationships among actors can be established. As various IoT technologies are to be included in service systems, the extension of the mapping methods can be made to identify and highlight the roles and the effects of applying them.
Section 2.1 briefly presents the latest visual mapping method, a method with actors and system maps, and Section 2.2 includes reasons to extend the method with actors and system maps. The first one introduces the concept of “pseudo actors” in the mapping method to clearly identify the effects of applying IoT technology in a service system. The second idea recommends a quantitative evaluation table to evaluate multiple alternatives of using IoT technology that is inspired by the popular quality function deployment (QFD) method and the problem-solution-value framework for the new value proposition suggested by Maurya [28].

2.1. A Visual Mapping Method: Actors and System Maps

Visual mapping methods are widely used at the start of a service system development that enables a design team to identify pertinent stakeholders and their relationships. The major advantage of those methods is to identify and visually present the stakeholders, including customers, who are involved with the effective delivery of the product or service to the customers. Good examples of the mapping methods include Matzen [17], Ishii [18], Moritz [19], Tan [30], and Donaldson et al. [31]. Recently, Lindahl et al. [20] and Desai et al. [21] proposed a new mapping method called “actors and system maps” method for PSS design that is easy to communicate with a high level of visualization and provides a clear PSS perspective by simultaneously covering actors, products, services, information, and activities. The method helps designers visualize the network of actors involved in the existing or potential PSS and explicitly show the flows of products, services, and information among them. These visualizations can be used to identify the lack of information flows, service delivery, and product flows and help find possibilities for improvement. A proposed method is presented in the next section that extends the method of “Actors and System Maps”. In this section the method is briefly described, referring to the step-by-step description in Lindahl et al. [20] and Desai et al. [21]. These steps are:
(i)
Define the PSS that will be analyzed. This includes setting up the goal and intended level for the analysis. The information collection and analysis can be done in various ways depending on the results of this step.
(ii)
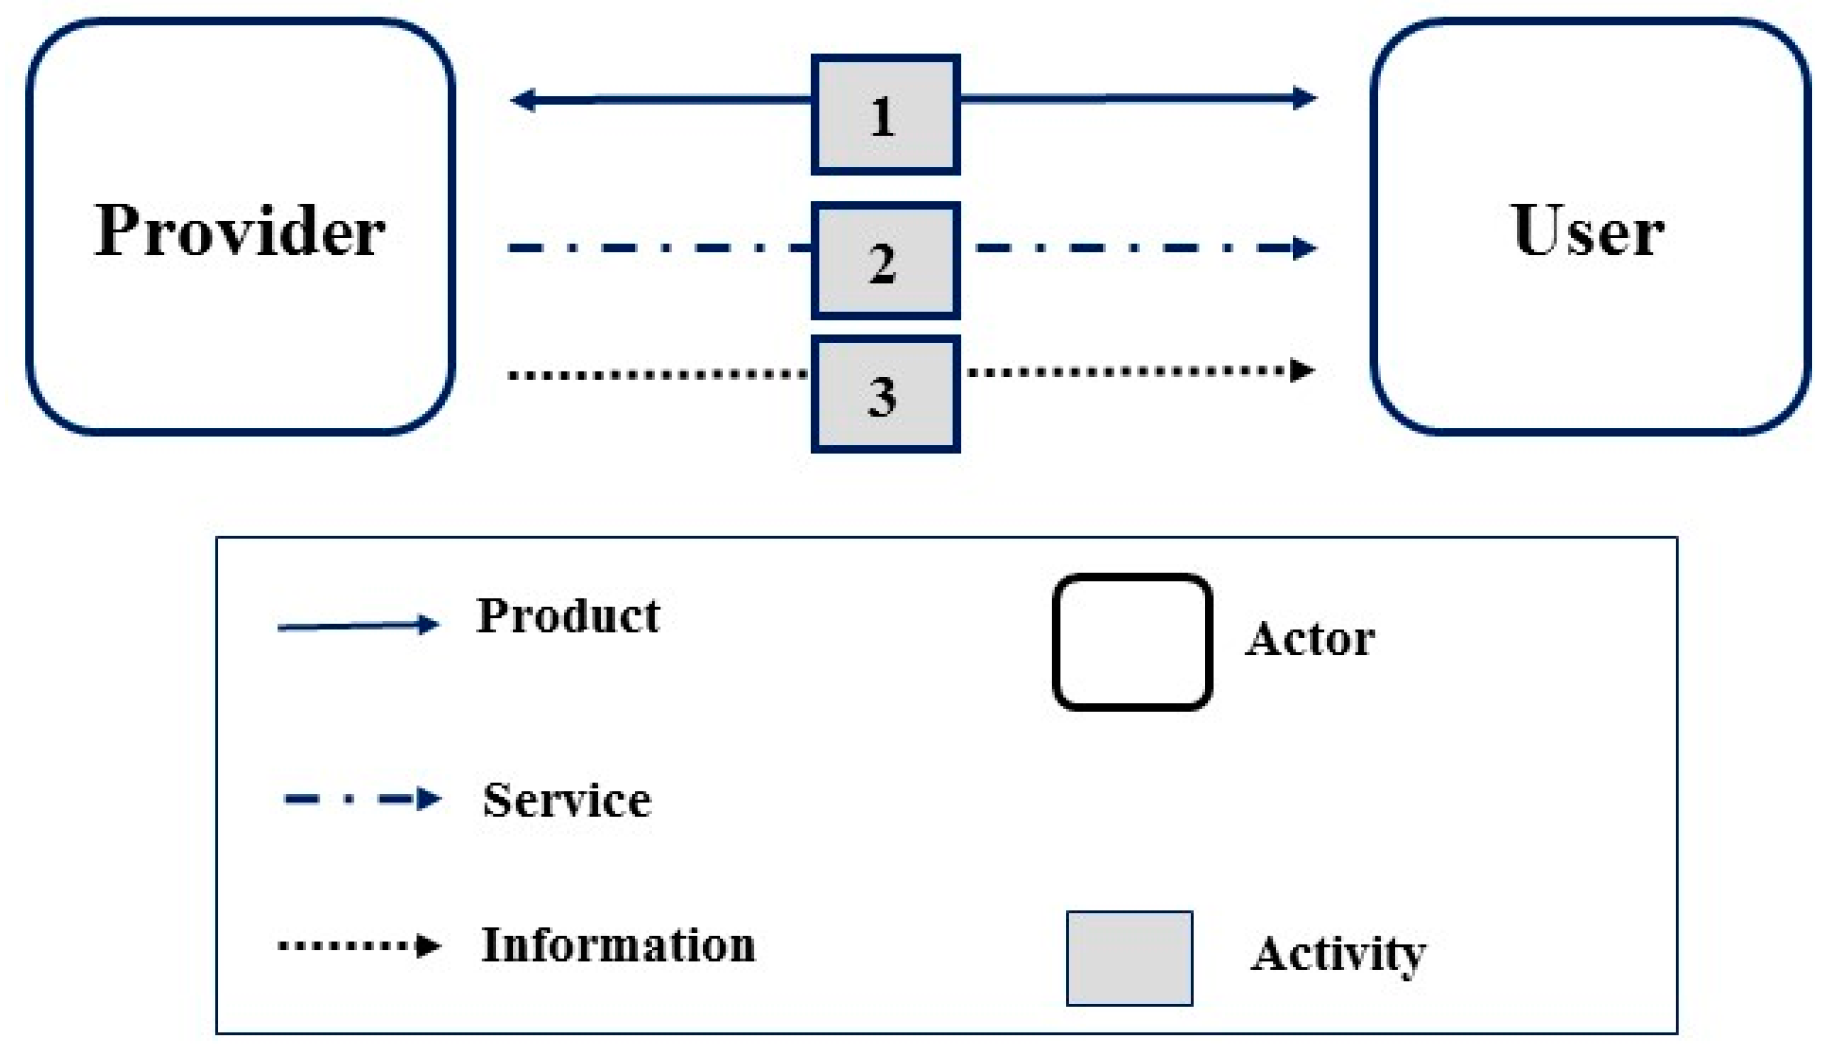
Identify the actors involved and the flows of products, services, and information among them. The first part is to identify all human actors that can be a person, a group of persons, or a department. Examples of actors are service staff, sales, information collectors, and customers. This can be confirmed by asking actors their view of how the PSS is provided. The second part of this step is to identify important interactions (flows and directions) among the actors. A product is a tangible object that is delivered from one actor to another, while service is intangible, e.g., education, support, or maintenance. When plotting out the flows between two actors, if it is a two-way or one-way interaction, the line should clearly indicate the direction of flows.
(iii)
Analyze if actors and the flows of products, services, and information are at a sufficient level of detail. Since it is common for different actors to have different perspectives, a workshop is needed to find whether the identified actors and the flows of products, services, and information are at a sufficient level of detail. Plots that are drawn from different actors can be merged into an overall actor map.
(iv)
Identify those activities that are used to manage products, services, and information. An activity is characterized by the condition in which things (e.g., flows of products, services, and information) are happening or being done. Examples of an activity include checking the quality of a delivered product, assigning a tool that may be used in service delivery, and setting the frequency of passing collected data. In the map, specific activities are spelled out and illustrated by boxes.
(v)
Analyze if the identified activities are at a sufficient level of detail. This is important when different actors have plotted their own perspectives independently and then those plots have been merged into an overall plot. This step is often done in a workshop with different actors involved, making sure that the map is at a sufficient level of detail.
(vi)
Identify improvement possibilities. This step could be done in a workshop held for Step (v) or in a separate workshop with domain experts and users. Examples of improvement possibilities include getting better information flows between two different actors, adding a new actor to enhance service quality, or providing additional channels of service delivery. Drawing two “actor and system maps” representing the system before and after the improvement possibility can help visualize and analyze the difference.

2.2. Reasons and Ideas for Proposing a New Method

As mentioned earlier, IoT technologies like identification and tracking technologies, wired and wireless sensors and actuator networks, enhanced communication protocols, and distributed intelligence for smart objects have been applied in service systems. With IoT technologies, an object may become “smart and connected” and have the ability to memorize, communicate, and deliver services, thereby possibly supporting or even replacing conventional human actors. It is important to find a suitable design method that could identify potential improvement in new service systems that apply IoT technologies. This work extends the method with actors and system maps with a novel concept called “pseudo actors” that identify the role of the objects incorporating IoT technologies in a service system. By naming the objects with “pseudo actors” and acknowledging the difference between conventional actors and pseudo actors in visual mapping methods, designers could find possible improvements and evaluate the potential of applying IoT technologies.
On the other hand, when there are multiple alternatives for incorporating IoT technologies, designers need to evaluate and choose the best alternative, which should be the one with the highest “customer value”. However, the problem is how to evaluate the alternatives of IoT technologies from users’ perspectives and whether the evaluation can be expressed quantitatively. In the following, two major ideas for proposing a new integrated method are presented.
(I) As Giusto et al. [32] mentioned, the basic idea of “Internet of Things” is the pervasive presence around us of a variety of objects—such as Radio-Frequency IDentification (RFID) tags, sensors, actuators, etc.—that are able to interact and cooperate with each other to reach common goals. Designers need to evaluate how and to what extent these “objects” can be involved and integrated into a PSS. These “things” are digitized, smart, and connected objects, very much like the actors in the “Actors and System Maps” method, where an actor is originally recognized as “an individual, a group, a function or a department”. To highlight the role of the objects that apply IoT technologies and their interaction with other actors in a service system, the concept of the “pseudo actor” is introduced. Since objects incorporating IoT technologies may well have the ability of memorizing, communicating, delivering information, and even taking some actions, they are literally acting very much like conventional actors. The word “pseudo” is used since they have less intelligence, less ability of making real-time responses to sophisticated situations, and less empathetic and spontaneous responses than human actors, which are important in direct interaction with customers. That is why the authors suggest using the term “pseudo actors,” indicating that these smart and active objects can be treated “almost” like a conventional actor. If the concept of “pseudo actors” is integrated into the plotting of “Actors and System Maps,” designers can visualize and analyze: (a) the effect of applying IoT technologies on some objects; (b) the interaction among actors and pseudo actors; and (c) the potential of service improvement due to IoT application, while the original benefits of plotting “actors and system maps” remain.
A key problem is how to identify “pseudo actors” and then present them in the actors and system maps. Since “pseudo actors” represent the objects (things) that apply IoT technologies, one can identify candidate “pseudo actors” by examining the physical objects that are involved in the service network and/or appear in the process of service provision. Taking an example of riding electric scooters, candidate “objects” may be scooters, batteries, locks, parking facilities, helmets, and even traffic control devices. Designers then want to know whether including the objects implemented with IoT technologies could help improve the service system. Typical advantages of introducing “pseudo actors” include: providing additional information flows, delivering reliable and quick responses to customers’ needs, enhancing service quality, reducing human actors’ workload, providing instant access to remote information centers, keeping use record of products, etc. Drawing actors and system maps with the candidate pseudo actors could facilitate the design process since visualizing the positions and roles of the pseudo actors and identifying the flows (interaction) between them and other actors can be helpful in understanding and describing how a service system could be enhanced or reshaped. The abovementioned steps including (a) examining potential objects; (b) applying IoT technologies on the objects (i.e., candidate pseudo actors); and (c) including “pseudo actors” and flows in actors and system maps should be conducted iteratively and on a trial and error basis. Designers could draw an actors and system map for a combination of candidate pseudo actors and evaluate the effects and improvements. Many maps with different combinations of pseudo actors may be drawn and compared before further evaluation and selection is conducted.
Since “pseudo actors” are physical objects with IoT technologies, they are different from human actors. With IoT technologies like sensors and information and communication technologies, “pseudo actors” are good at constantly monitoring operation status, generating data, summarizing and passing data, responding to inquiries, connecting with other information system, accessing information from remote (cloud) systems, etc. In general, they are accurate, fast, and work constantly without resting. However, they have weaknesses such as working with limited intelligence, not being able to respond to abrupt situations, and not being able to deliver services with understanding and empathy. These differences make identifying “pseudo actors” in the maps necessary so that designers can identify and differentiate the roles of the two types of actors and the interaction between them and make better evaluations. This is important in examining the quality of the flows that are connected with pseudo actors, especially the flows between customers and pseudo actors, and evaluating the extent of improvement made by introducing IoT technologies. With the concept of “pseudo actors,” the method of “Actors and System Maps” are modified and expanded. For example, starting from Step (ii) described in Section 2.1 to identify actors and draw system maps, potential pseudo actors should be included together with conventional actors, thereby noting down all interactions (flows of products, services, and information) among different actors and pseudo actors. In addition to adding new nodes denoting pseudo actors, new flows of services and information are presented in the maps.
(II) To choose the alternatives of IoT application for achieving higher customer value, two ideas are adopted, including (a) the link among problem-solution-value for obtaining the new value proposition in the lean Canvas proposed by Maurya [28] and (b) the QFD method to evaluate technology alternatives. To decide which objects should be chosen to incorporate IoT technologies, designer should start by identifying what are the unmet needs from customers’ perspective. The unmet needs bring on “problems” while IoT technology provides possible technological “solutions”. This study proposes a method following the sequence of identifying a “problem,” finding alternative uses of IoT technologies as solutions, and finally evaluating the “value” offered to customers with the IoT technology application. Problems or unmet needs are identified from user experiences with the current service system, while various IoT technologies that are potentially used in different objects are seen as potential technological solutions. By putting the two in one table, designers can clearly see the alternatives and hence evaluate the potential contribution of applying IoT technologies to fulfill the unmet needs of customers. For each IoT technology candidate, the contribution to solving unmet needs can be analyzed and identified by going through the expanded actors and system maps method. By observing and comparing the actors and flows in the maps drawn for the systems before and after the candidate alternative is incorporated, the improvement and contribution can be identified.
In the following sections, a useful table is recommended for preliminary assessment of implementing IoT technologies in the “objects” in PSSs to create new customer value. The content and expression of the table are inspired by the popular QFD method that relates customer voice and technology improvement (Akao, [33]). In QFD, by inputting the weightings of customer voices and a relationship matrix, one can get quantitative scores of different technology improvement alternatives. Referring to the idea of QFD, this proposed method recommends an evaluation table to obtain quantitative scores of IoT technology alternatives with input of the weightings on unmet needs.

3. A Method Proposed to Evaluate System Improvement with IoT Technology Application

In light of the two ideas mentioned in the last section, together with the method of plotting “actors and system maps,” the three major stages of creating customer value are: identifying unmet customer needs, finding available IoT technologies as solutions, and evaluating and selecting alternatives with higher customer values. A six-step procedure is recommended in the following for evaluating the potential use of IoT technologies to create new value in redesigning PSS. Besides the introduction of “pseudo actors” for better visualizing and analyzing the effect of IoT technology application, Steps 4 to 6 suggest a quantitative evaluation procedure for choosing appropriate IoT technologies. The six steps are:
(1)
Step 1. Find customers’ unmet needs or dissatisfaction. Interviewing users is helpful. The needs of other stakeholders should also be considered by following the design principles suggested in the user-centered design (Norman and Draper [34]; Shneiderman [35]; Preece et al. [36]) and the participatory design (Kensing and Blomberg [37]; Schuler and Namioka [38]; Muller et al. [39]). In other words, users should be seen in a broad sense and their goals, experiences, and needs should be carefully investigated and covered in the design process. The user journey could be recorded referring to the frequently used user experience design method so that users’ feelings, dissatisfaction, and unmet expectations can be pinpointed. Dissatisfaction or users’ unmet needs in different stages in the user journey should be carefully identified and described. If several unmet needs are found, the relative importance of these needs should be evaluated, noting the weighing factors quantitatively, such as Wi, where i denotes the ith users’ unmet need. The weighting factor with respect to an unmet need could reflect the relative “value” recognized by the customers if the need is fulfilled by applying some IoT technologies. Determination of the weighting factors could become complicated when multiple stakeholders’ interests are considered simultaneously. Negotiation and trade-off among stakeholders may be needed to determine the weightings.
(2)
Step 2. Identify candidate objects as “pseudo actors” and the potential use of IoT technologies. Identify objects (things) that either users may use (direct contact) or the service delivery may count on or involve, and treat them as candidate objects (things) that could be digitalized and connected by IoT technologies. In the PSS design (e.g., car rental), the tangible product (e.g., car) and its related facility or objects in the infrastructure (e.g., parking facility) are often considered as candidate pseudo actors. Typical IoT technologies used include digital tags, memory chips, sensors, communication devices, and actuators. These candidate objects (things) are also candidate “pseudo actors” that may store memories, sense, communicate, and even take action, thereby playing active roles in interacting with other conventional actors and contributing to service improvement.
(3)
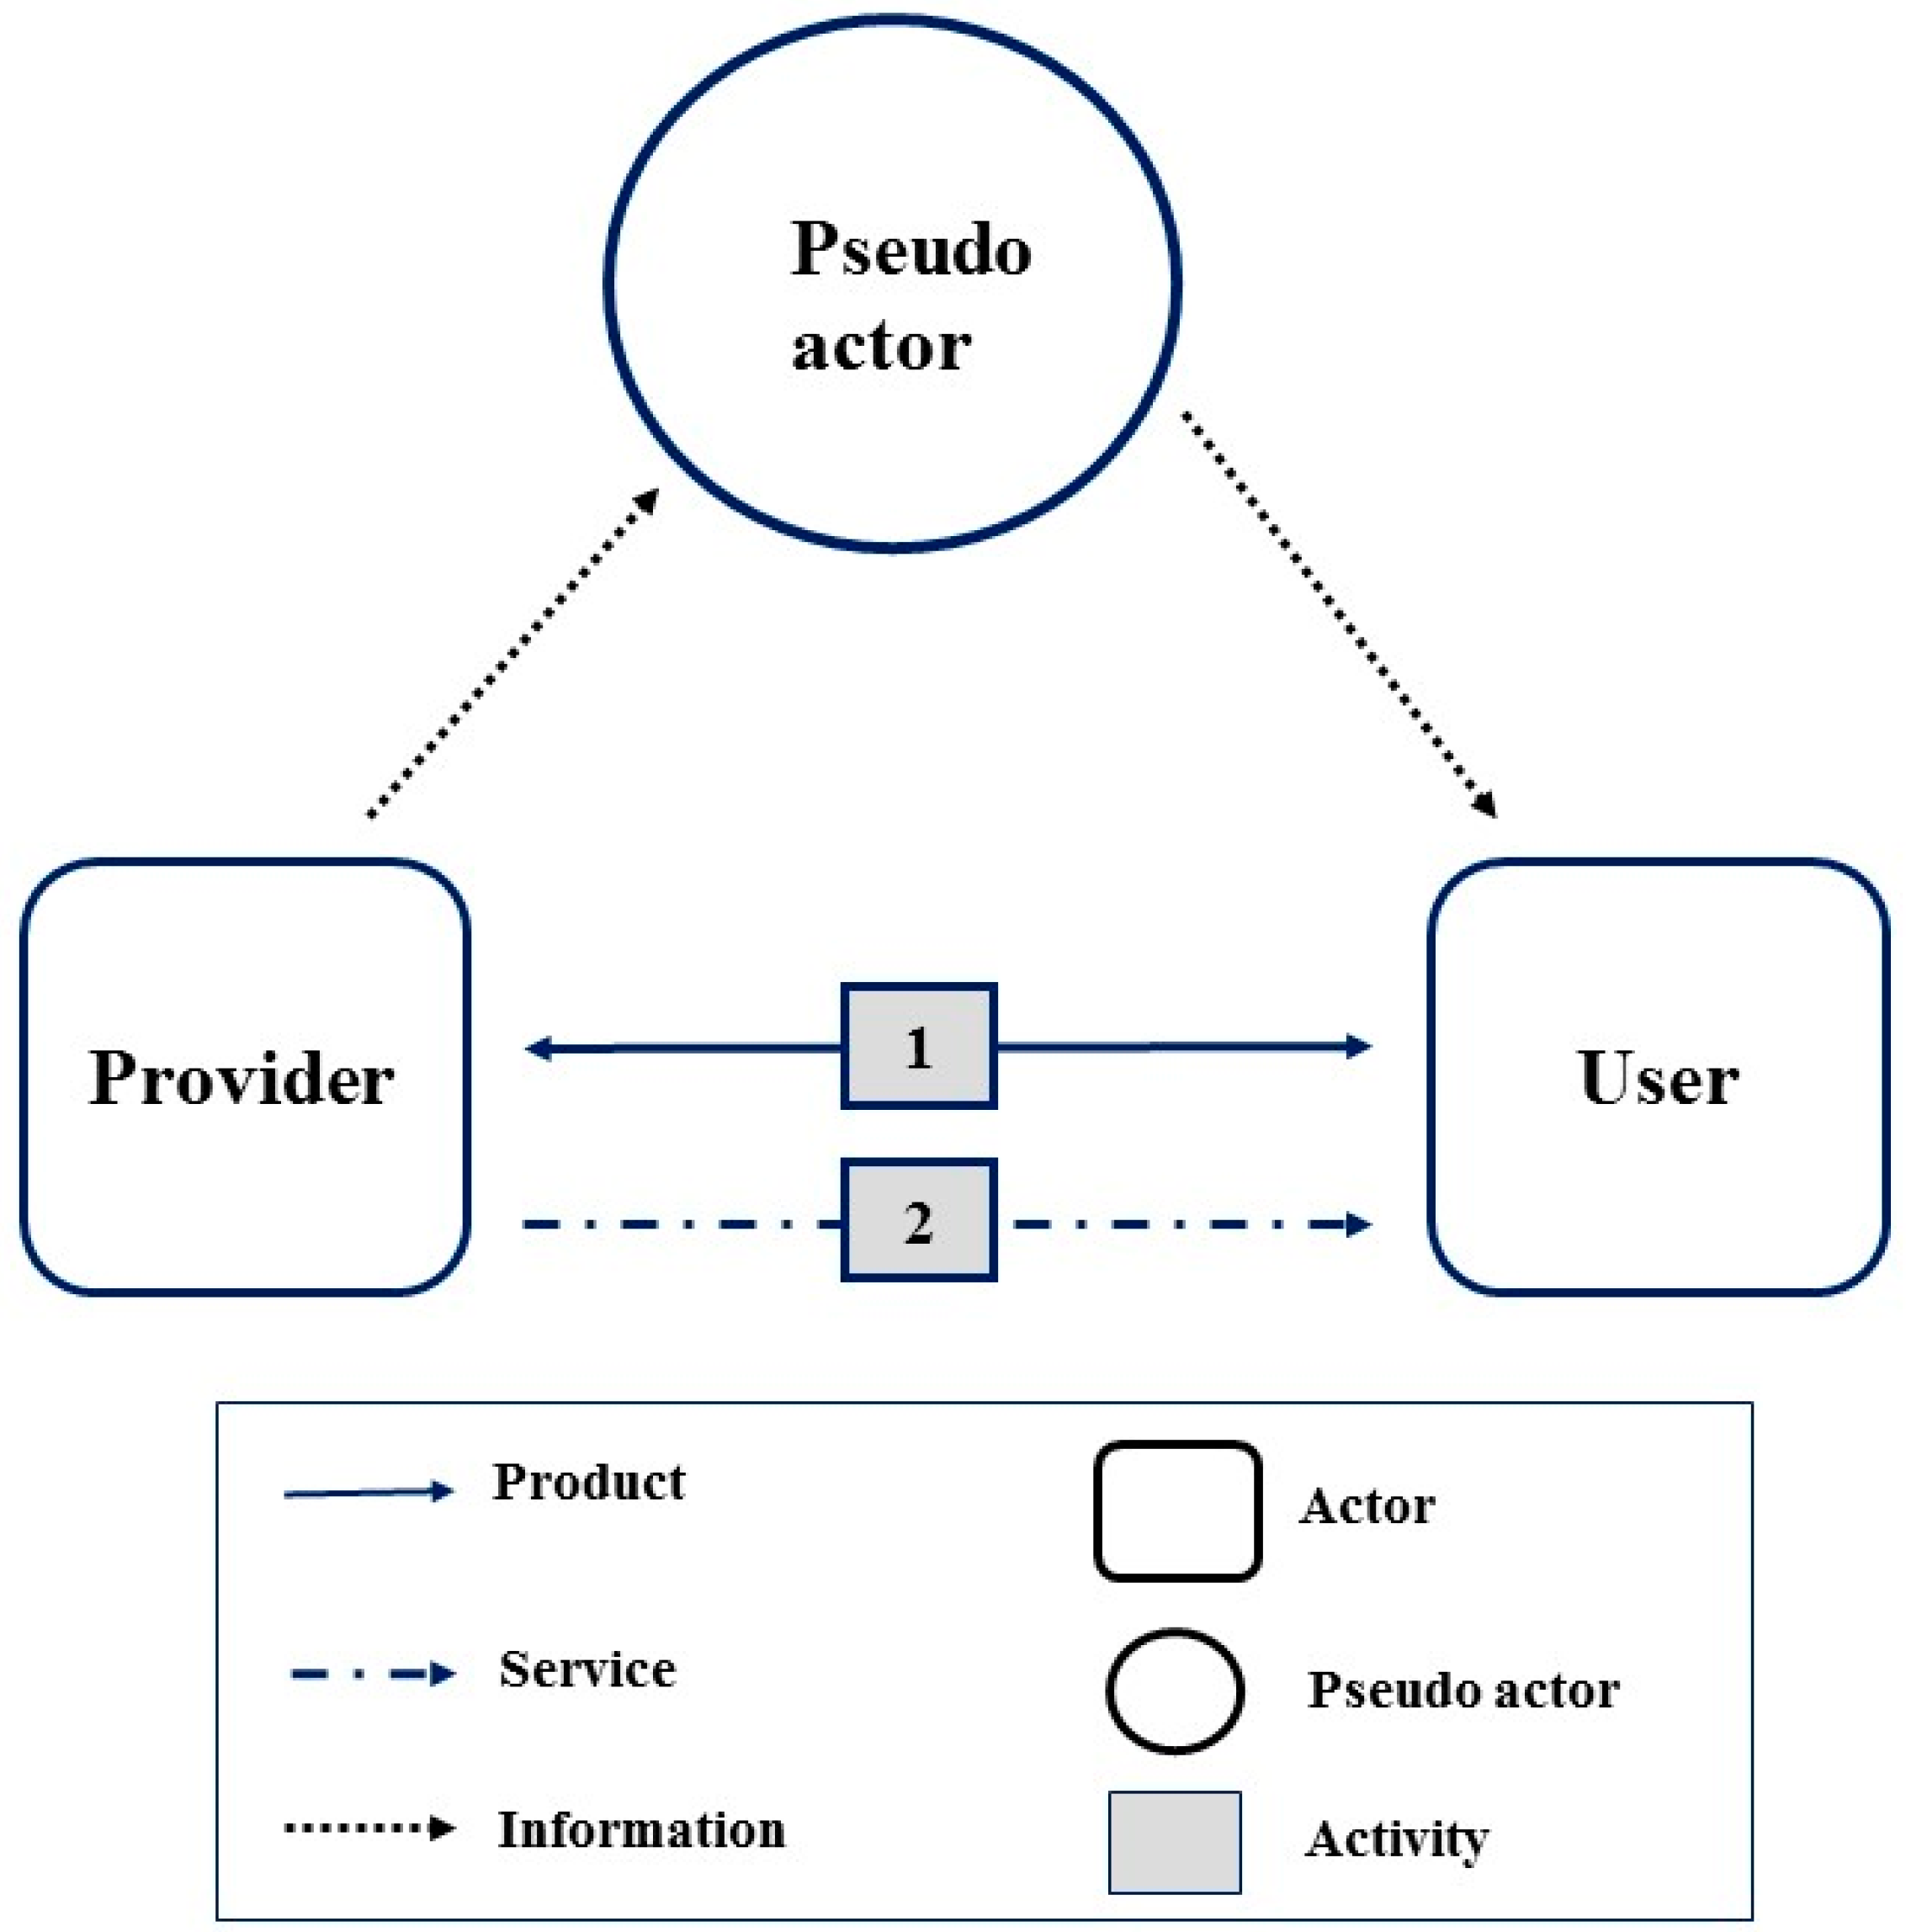
Step 3. Analyze whether the identified actors and pseudo actors, along with IoT technology and together with the flows of products, services, and information, could offer solutions to unmet needs. After Step (2), implementing IoT technologies in the candidate pseudo actors could be recognized as potential “solutions” to the problems obtained in Step (1). Drawing an “actors and system map” for a combination of actors and pseudo actors could help analyze and evaluate how and to what extent the combination can fulfill an unmet need. Steps (2) and (3) should be conducted iteratively. Many actors and system maps with different combinations of pseudo actors may be drawn and compared. Note that pseudo actors as well as conventional actors are noted as nodes, while flows of products, services, and information are noted as arrows. The boxes attached to arrows stand for activities. Figure 1 illustrates a simple example where two rectangles represent conventional actors: the right one is customers, the left one denotes service providers, and the circle denotes a pseudo actor. Because of a pseudo actor joining in, the flows between the two conventional actors increase. For example, a car (pseudo actor) in a car rental service is equipped with some IoT technologies so that additional information could be delivered to customers directly from the “smart” car. By drawing a map, designers can visualize and analyze if the service level is improved by pseudo actors joining in. One can imagine that with these pseudo actors joining in the PSS the interaction (flows of products, services, and information) among actors changed and the potential service improvement is identified much more easily. Since there are limitations on the flows connecting pseudo actors depending on the IoT technologies included, pseudo actors and related flows should be noted carefully on the map. For example, pseudo actors may be good in delivering additional information but not able to pass physical products and interact with users via sophisticated communication.
(4)
Step 4. Use a recommended table to summarize “problems” and corresponding feasible “solutions”. A table that helps evaluate the application potential of IoT technologies in different pseudo actors to improve services is suggested herein. An illustrative table is shown in Table 1. The first column on the right contains the problems (users’ unmet needs) and the second column contains the weightings of these needs (from Step (1)), while the top row contains horizontally a list of IoT technologies applied in different pseudo actors (from Step (2)). Inside the table, designers could check if a combination of IoT technology application could contribute to solving a problem (from Step (3)). Note that “actor and system maps” should be drawn for analysis and clearly identify whether an alternative combination is legitimate for solving a specified unmet need. There could be more than one alternative combination for each unmet need (problem). For example, there are more than two alternatives for each unmet need in Table 1.
(5)
Step 5. Evaluate the contribution of each alternative combination of IoT technologies to each unmet need. After finishing Step (4), alternative feasible combinations for solving unmet needs are clearly identified and presented in rows in the table. To identify the contribution to solving an unmet need by each alternative (combination) to the PSS, at least one additional actors map should be plotted for each alternative. By carefully observing each corresponding “actor and system map” and identifying the flows of products, services, and information that interact directly with customers, designers could evaluate to what extent an alternative can fulfill an unmet need. To compare the contributions of different alternatives of IoT application, quantitative expression of the contributions to the unmet needs is suggested. The second column on the right in Table 1 contains the contribution score of each alternative to the corresponding unmet need. To get a quantitative expression, a score ranging from 1 to 10 is used where 10 means the highest contribution to an unmet need.
(6)
Step 6. Calculate the total weighted scores and select the optimal alternative. To select an alternative that offers the best value, the proposed method suggests calculating the total weighted score for each alternative combination of IoT technologies. Firstly, the weighting factor for each unmet need is multiplied by the contribution score of each alternative to get a weighted score. The first column on the right in Table 1 contains the calculated weighted scores for alternatives. Secondly, all weighted scores to all unmet needs for each alternative are summarized to get a total weighted score. The total weighted score of each alternative stands for the overall “value” offered by the alternative of IoT technology application. Please note that users or domain experts should be invited in Steps (5) and (6) since opinions from the user side are very important regarding the “value” evaluation.
Consequently, the proposed method can help (1) identify and highlight the roles of pseudo actors that denote the objects applying IoT technologies; (2) draw the actors and system maps to visualize the interactions between actors and pseudo actors; (3) evaluate potential improvement due to IoT technology applications; and (4) quantitatively evaluate and select the alternatives that offer the highest customer value.

4. A Case of Developing Battery Swapping Services for Electric Scooters in Taiwan

As an illustrative example of the proposed method, a PSS for the battery swapping service for electric scooters is selected. This section briefly presents some background on promoting electric scooters with battery swapping services in Taiwan. The first reason for promoting battery swapping services is that charging the battery of an electric scooter is still time-consuming; even in a fast charging mode it may still take more than half an hour, so battery swapping services provide a convenient choice. Secondly, battery swapping services encourage users to simply buy services instead of buying batteries, thereby reducing resource use and encouraging sustainability. In this context, the Taiwan government decided to subsidize battery swapping service systems for electric motorcycles and bikes in 2012 (EPA, Taiwan [40]). The original master plan presented by the local government includes: (1) encouraging start-up companies to build service systems including swapping stations, standardized batteries, and service infrastructure; and (2) persuading major motorcycle manufacturers to adopt standardized batteries so that motorcycles from different brand names could use the same swapping service. In the original business model, a user purchased a motorcycle and a battery and then paid for each swapping service. After more than one year, the start-up companies failed to persuade major manufacturers to adopt standardized batteries and expand the service scale. Since the idea of using standardized batteries did not work, customers had very few choices of compatible motorcycle models. Since major manufacturers did not commit and the start-up companies themselves were not able to develop attractive new motorcycle models, the market share of battery swapping services remained very low. Major complaints from customers included: (1) the design of available motorcycles was not attractive and few choices were available; (2) few swapping stations were established; and (3) the batteries provided by the system were not reliable or trustworthy.
After 2013, these new companies gave up seeking cooperation with major manufacturers and tried to establish their own brand names, launch new designs, and develop new business models. In this stage, customers do not have to purchase batteries; they simply pay for each swapping service. However, users kept complaining that they could not get a fully charged battery when they needed one and felt no confidence in the efficiency of the battery they got from the swapping service. In this context, local users have not yet enjoyed the full benefits of battery swapping services and constantly compared the swapping service with the traditional method of owning a battery and charging it by themselves.
Since 2015, several companies that offered battery swapping services have adopted new technologies like IoT technologies and launched new business models. A good example company is Gogoro, which officially launched in June 2015 and started selling its newly designed smart scooters. The scooter price ranges from 2700 to 4000 USD, while the service fee is set between 10 to 30 USD per month depending on the riding mileage. It has several innovative selling points different from those of existing companies such as fashion scooter design, placing unmanned swapping stations at sites like convenience stores and universities, requesting and reserving batteries remotely, and vastly shortening the time for swapping. To accomplish these, Gogoro has extensive applications of IoT technologies in providing a system with innovative and competitive battery swapping services. Because of the extensive use of IoT technology, it was listed in “The Top 100 Internet of Things Start-ups for 2015” by Mattermark [41]. One of the selling points is that the swapping operation only takes six seconds because riders can request and reserve charged batteries using a smartphone app when they discover the battery power is low. In the service design, batteries, swapping stations, scooters, cell phones, and the control center are connected via IoT technologies and an information network. More than 25 sensors were placed in a battery, while more than 30 sensors were implemented in a scooter to provide more information and real-time monitoring. The monitoring system updates the status information every 10 min, providing instant feedback to riders as well as to Gogoro’s control center. By using IoT technology, it enhances the service quality and the speed of allocating swapping stations, reserving a charged battery, ensuring the reliability of batteries, recording riding history, diagnosing system problems, etc. The extensive use of IoT technologies by Gogoro and its success story has encouraged the promotion of battery swapping services for electric vehicles.

5. An Illustrative Example of Battery Swapping Service Improvement Using the Proposed Method

To illustrate the application potential of the proposed method, a system design for improving battery swapping services by using IoT technology is presented. Although new electric scooters made by Gogoro have already extensively applied IoT technology, the authors picked the battery swapping service as an example for illustration purposes. With the illustration, one can learn more about how IoT technology can help create customer value, visualize the interaction between actors and pseudo actors, and execute the evaluation process quantitatively. In this section, the six-step method presented in Section 3 is applied to find new service designs, assuming the designers start from a point where no IoT technology was used yet. The following illustrates the execution of the proposed method, step by step:
(1)
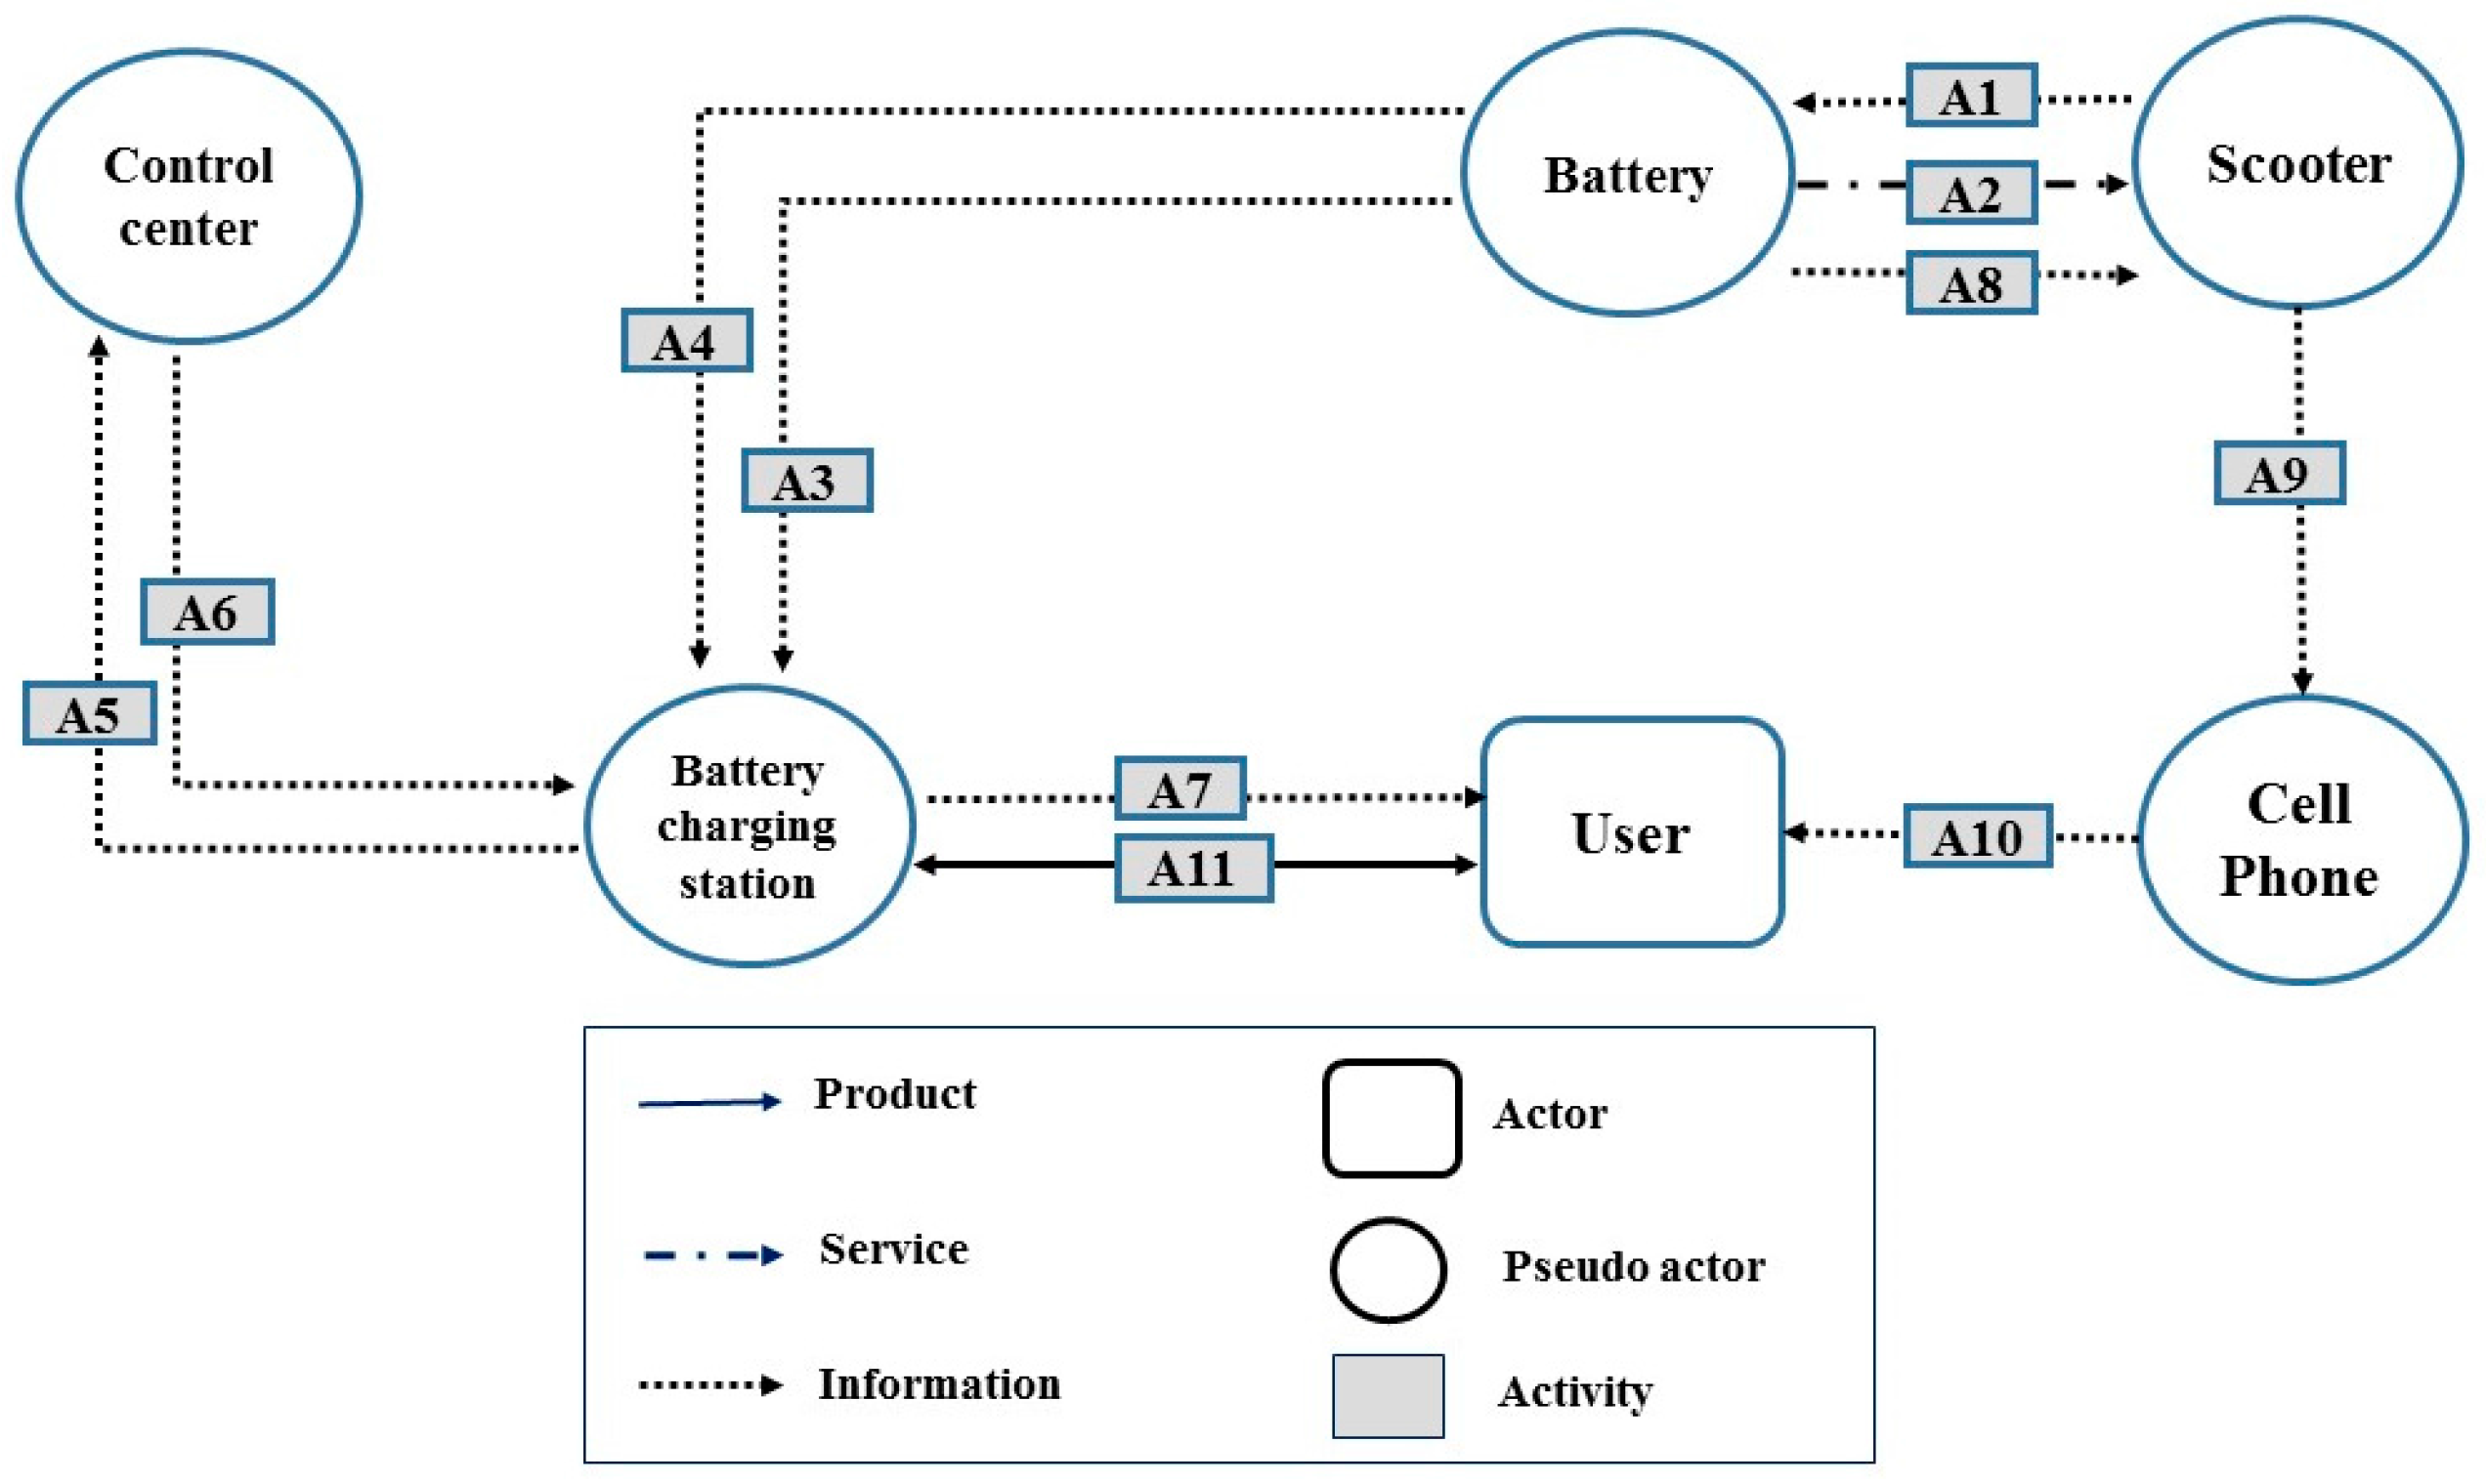
Step 1. Unmet needs or dissatisfaction of customers are identified, assuming that the battery swapping service is conducted in a conventional way where a user takes the battery to a service provider to get a charged one when the battery power is exhausted. This is similar to the situation users faced in Taiwan before 2015. The user simply has to trust the service provider to provide a fully charged battery. Figure 2 shows a simple “actors and system map” describing the service operation without using IoT technology. Table 2 contains the flows of products, services, and information. After an interview with a group of users, one of the unmet needs is a lack of confidence about the batteries they get. More guarantees and more information about the batteries obtained from a swapping service are demanded by the users. For illustration, another minor complaint from users is the lack of personalized settings on the display panel of a scooter. Designers asked users to weigh the relative importance of the above two “problems” (unmet needs) and got the weighting factors accordingly.
(2)
Step 2. Find candidate objects that might apply IoT technologies. In this illustrative case, cell phones, batteries, a scooter itself, unmanned charging stations, and the service control center are candidate objects and various IoT technologies such as memory, RFID tag, sensors, wireless communication device, microprocessor, and actuator could be applied on each object. There are various combinations of IoT technologies applied on the candidate objects. Most of the combinations would be screened out in the next step and only feasible alternative combinations would go through further evaluation.
(3)
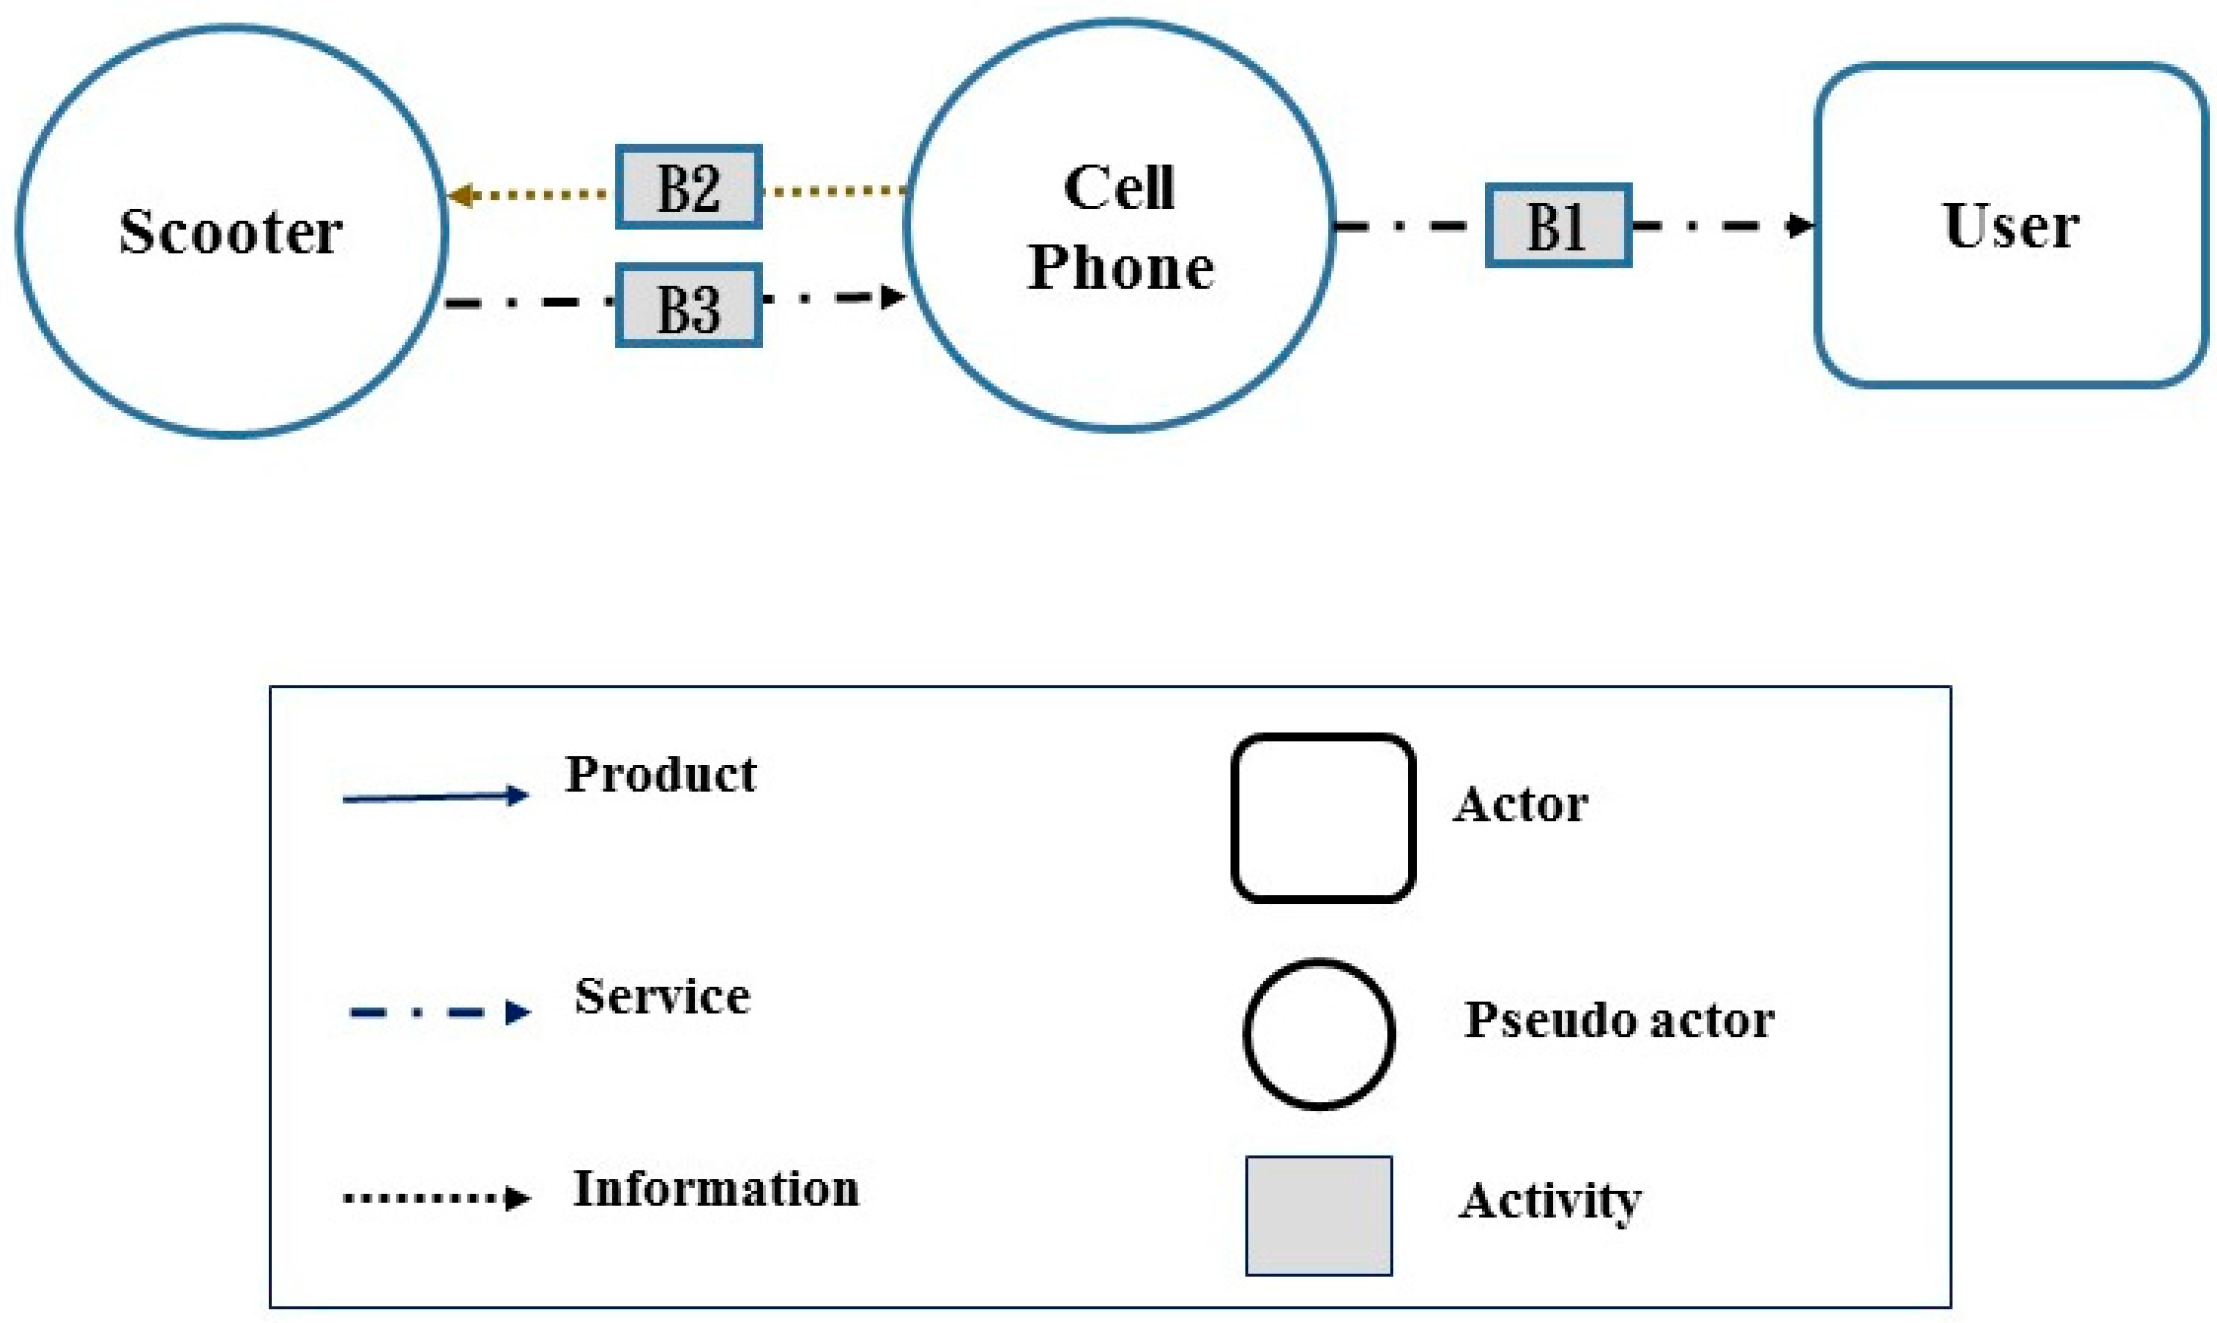
Step 3. Identify feasible alternative combinations of IoT technology applications for solving each unmet need. Screen out those combinations that are not feasible or do not contribute to meeting unmet needs. This step should be done by relying on domain expertise or on a trial-and-error basis. It is important to draw an “actors and system map” for each feasible alternative, where pseudo actors are identified as the objects that equipped with IoT technologies. The flows of products, services, and information between actors and pseudo actors should be carefully identified and examined and whether unmet needs are fulfilled should be checked. To demonstrate, Table 3 presents two alternatives that can solve the two unmet needs, where “v” denotes the IoT technology in the specified object is selected in the alternative combination (in a row). The IoT technologies include: a wireless communication device (e.g., WiFi, Bluetooth), some computing tools (e.g., microprocessor, electric control unit on scooter), an actuator, a sensor, and a memory device. At the top of Table 3, the technologies are noted as a wireless communication device (WL), a microprocessor (MP), an actuator (AT), a sensor (SS), and a memory device (MM). Figure 3 and Figure 4 show the “actors and system maps” for two illustrative alternatives for two unmet needs, in which arrows represent the flows between actors and pseudo actors, rectangles denote conventional actors, and circles denote pseudo actors. Table 4 and Table 5 include the descriptions of flows and some activities corresponding to the arrows in the two figures. Please note that in order to keep the illustration straightforward the authors did not consider other innovative design means besides introducing IoT technology for fulfilling unmet needs.
(4)
Step 4. Make a summary table like Table 6, which includes all unmet needs and all feasible alternatives that consist of multiple IoT technologies on specified objects (pseudo actors). Note that one alternative (e.g., alternative 1) originally picked for solving one problem (e.g., a more reliable battery) may also make a contribution to solving another problem (e.g., a personalized display panel). So, alternatives 1 and 2 appear twice in the table so that the total contribution of each alternative to the system improvement can be summarized later.
(5)
Step 5. Evaluate the contribution of each alternative to solving each problem (fulfilling each unmet need). The second column on the right of Table 6 contains the contribution scores for illustration. The scores could be made by designers, together with users, based on the detailed presentation of “actors and system maps” and the description of flows. An analysis and discussion of the flows of products, services, and information that directly connect with customers are essential in this step.
(6)
Step 6. Calculate total weighted scores for all alternatives and make a decision. By multiplying the weighting factors of problems and the contribution score of each alternative, one can get a weighted score for each alternative. The first column on the right in Table 6 contains the weighted scores. For example, the weighted score of Alternative 1 for the first unmet need is 5.6 (= 0.8 × 7). The total scores can be obtained by summing up all the weighted scores with respect to each alternative. For example, the total score of Alternative 1 is 6.6 (= 5.6 + 1.0) while the total score of Alternative 2 is 2.4 (= 0.8 + 1.6). The total score represents the relative “customer value” contributed by each alternative combination of IoT technology application. The total scores can be used to rank the alternatives when making decisions to further improve the system.
As a result, Alternative 1 is recommended because its combination of IoT technologies helps create the relatively higher customer value. Several IoT technologies are chosen to apply to objects like batteries, swapping stations, scooters, cell phones, and the control center, as indicated in Table 6. In addition to the demonstration of the easy-to-use method, this illustration also shows the benefits of introducing “pseudo actors” and using the proposed method, such as highlighting the roles of pseudo actors in “actors and system maps,” visualizing the interaction between actors and pseudo actors, and getting a preliminary quantitative evaluation with the recommended evaluation table.

6. Conclusions

This study proposes a practical design method that extends visual mapping methods by introducing “pseudo actors” to help design PSSs that plan to incorporate IoT technologies. The reasons for introducing pseudo actors and how to identify them are presented. Because of the differences between pseudo actors and conventional actors, there are advantages to differentiating pseudo actors from conventional actors in plotting actors and system maps. Designers can visualize and analyze the potential effect of applying IoT technologies with the maps including the nodes of pseudo actors and conventional actors and the flows of information, services, and products among them. By plotting the pseudo actors, the role and interaction with other actors of the objects applying IoT technologies are distinguished from those of conventional actors. This method also recommends a useful table to quantitatively evaluate alternatives of IoT technology application based on users’ weightings of their unmet needs. The idea of bridging the customer value and technology alternatives for evaluation is inspired by the QFD method. To make the method more practical, a six-step procedure is proposed that covers three stages of creating customers’ value including identifying unmet needs, finding technological solutions, and selecting alternatives that generate greater value. The six steps include (1) identify unmet needs or dissatisfactions and provide weighting factors; (2) identify objects (candidate pseudo actors) that adopt IoT technologies; (3) identify feasible alternative combinations of IoT technologies for solving each unmet need. Pseudo actors are identified and included in plotting actors and system maps herein to facilitate feasibility check; (4) use a recommended table to summarize alternative combinations of IoT technologies for each unmet need; (5) quantitatively evaluate the contribution of each alternative to each unmet need by plotting extended actors and system maps; and (6) calculate total weighted scores so that the relative value created by the alternatives can be presented to designers for decision-making.
An illustrative example of the battery swapping system design for electric scooters is presented and discussed. After a brief description of the background is presented, the proposed method is used to find alternative combinations of IoT technologies that create higher customer value step-by-step for illustration. Different from a traditional battery swapping service, batteries, unmanned charging stations, cell phones, and electric scooters are considered as candidate objects that apply IoT technologies, and are noted as pseudo actors in the map plotting and evaluation process. During the execution of the proposed method, the influence and value generated by alternative combinations of IoT technologies can be visualized and evaluated. Consequently, the actors and system maps, along with tables of flows, are obtained for two unmet needs. By using the proposed table, designers can conduct quantitative evaluation and sort out priorities of alternative combinations of IoT technologies for creating higher customer value. As a result, the example illustrates that the proposed method can help designers visualize the effect of introducing IoT technologies, highlight the roles of pseudo actors, and find the best alternative of IoT technology application to create customer value.

Acknowledgments

The authors would like to thank the Ministry of Science and Technology of Taiwan for funding this research project (MOST 104-2621-M-006-004).

Author Contributions

Li-Hsing Shih contributed to the research idea, setting the overall research scheme, and writing the manuscript; Yen-Ting Lee worked as a research assistant and a graduate student to contribute to the literature review, the illustration of the example, and preparing useful tables and figures; Fenghueih Huarng provided suggestions on related literature discussion and practical implications and helped with manuscript revision.

Conflicts of Interest

The authors declare no conflict of interest. The funding sponsors had no role in the design of the study; in the collection, analyses, or interpretation of data; in the writing of the manuscript, and in the decision to publish the results.

References

  1. Goedkoop, M.; van Halen, C.J.; te Riele, H.; Rommens, P.J. Product Service Systems, Ecological and Economic Basics; Spatial Planning and the Environment Communications Directorate: The Hague, The Netherlands, 1999. [Google Scholar]
  2. Mont, O. Clarifying the Concept of Product-Service System. J. Clean. Prod. 2002, 10, 237–245. [Google Scholar] [CrossRef]
  3. Ceschin, F. Critical factors for implementing and diffusing sustainable product-Service systems: Insights from innovation studies and companies’ experiences. J. Clean. Prod. 2013, 45, 74–88. [Google Scholar] [CrossRef]
  4. Tukker, A. Eight types of product service system: Eight ways to sustainability? Experiences from suspronet. Bus. Strat. Environ. 2004, 13, 246–260. [Google Scholar] [CrossRef]
  5. Piscicelli, L.; Cooper, T.; Fisher, T. The role of values in collaborative consumption: Insights from a product-service system for lending and borrowing in the UK. J. Clean. Prod. 2015, 97, 21–29. [Google Scholar] [CrossRef]
  6. Lindahl, M.; Sundin, E.; Sakao, T. Environmental and economic benefits of Integrated Product Service Offerings quantified with real business cases. J. Clean. Prod. 2014, 64, 288–296. [Google Scholar] [CrossRef]
  7. Vezzoli, C.; Ceschin, F.; Diehl, J.C.; Kohtala, C. New design challenges to widely implement ‘Sustainable Product–Service Systems’. J. Clean. Prod. 2015, 97, 1–12. [Google Scholar] [CrossRef] [Green Version]
  8. Mont, O. Product-Service Systems: Panacea or Myth? Ph.D. Dissertation, Lund University, Lund, Sweden, 2004. [Google Scholar]
  9. Baines, T.S.; Lightfoot, H.W.; Evans, S.; Neely, A.; Greenough, R.; Peppard, J.; Roy, R.; Shehab, E.; Braganza, A.; Tiwari, A.; et al. State-of-the-art in product-service systems. Proc. Inst. Mech. Eng. Part. B J. Eng. Manuf. 2007, 221, 1543–1552. [Google Scholar] [CrossRef]
  10. Morelli, N. Developing new product service systems (PSS): Methodologies and operational tools. J. Clean. Prod. 2006, 14, 1495–1501. [Google Scholar] [CrossRef]
  11. Aurich, J.C.; Fuchs, C.; Wagenknecht, C. Life cycle oriented design of technical Product-Service Systems. J. Clean. Prod. 2006, 14, 1480–1494. [Google Scholar] [CrossRef]
  12. Komoto, H.; Tomiyama, T. Integration of a service CAD and a life cycle simulator. CIRP Ann. Manuf. Technol. 2008, 57, 9–12. [Google Scholar] [CrossRef]
  13. Maussang, N.; Zwolinski, P.; Brissaud, D. Product-service system design methodology: From the PSS architecture design to the products specifications. J. Eng. Des. 2009, 20, 349–366. [Google Scholar] [CrossRef]
  14. Shih, L.-H.; Chen, J.L.; Tu, J.C.; Kuo, T.C.; Hu, A.H.; Lin, S.L. An integrated approach for product service system design and evaluation (I): Design phase. J. Environ. Eng. Manag. 2009, 19, 327–342. [Google Scholar]
  15. Shih, L.-H.; Hu, A.H.; Lin, S.L.; Chen, J.L.; Tu, J.C.; Kuo, T.C. An integrated approach for product service system design and evaluation (II): Evaluation phase. J. Environ. Eng. Manag. 2009, 19, 343–356. [Google Scholar]
  16. Vasantha, G.V.A.; Roy, R.; Lelah, A.; Brissaud, D. A review of product–service systems design methodologies. J. Eng. Des. 2012, 23, 635–659. [Google Scholar] [CrossRef] [Green Version]
  17. Matzen, D. A Systematic Approach to Service Oriented Product Development; DTU Management: Kongens Lyngbyv, Denmark, 2009; p. 186. [Google Scholar]
  18. Ishii, K. Customer Value Chain Analysis (CVCA), in ME317 dfM: Product Definition Course Book; Ishii, K., Ed.; Stanford Bookstore, Stanford University: Stanford, CA, USA, 2001; pp. 1.3.1–1.3.8. [Google Scholar]
  19. Moritz, S. Service Design—Practical Access to an Evolving Field; International School of Design, University of Applied Sciences Cologne: Köln, Germany, 2005; p. 245. [Google Scholar]
  20. Lindahl, M.; Sakao, T.; Carlsson, E. Actor’s and system maps for integrated product service offerings-practical experience from two companies. Precedia CIRP 2014, 16, 320–325. [Google Scholar] [CrossRef]
  21. Desai, A.; Lindahl, M.; Widgren, M. Actors and System Maps—A Methodology for Developing Product Service Systems. In Proceedings of the EcoDesign 2015 International Symposium, Tokyo, Japan, 2–4 December 2015.
  22. McKinsey Global Institute. The Internet of Things: Mapping the Value beyond the Hype; McKinsey & Company: New York, NY, USA, 2015. [Google Scholar]
  23. Greenough, J.; Camhi, J. The Internet of Things 2015: Examining How the OT Will Affect the World. BI Intelligence Report. Available online: https://zh.scribd.com/document/288595065/the-internet-of-things-2015-examining-how-the-iot-will-affect-the-world-pdf (accessed on 23 November 2016).
  24. Atzori, L.; Iera, A.; Morabito, G. The internet of things: A survey. Comput. Netw. 2010, 54, 2787–2805. [Google Scholar] [CrossRef]
  25. Gubbi, J.; Buyya, R.; Marusic, S.; Palaniswami, M. Internet of Things (IoT): A vision, architectural elements, and future directions. Future Gener. Comput. Syst. 2013, 29, 1645–1660. [Google Scholar] [CrossRef]
  26. Dijkman, R.M.; Sprenkels, B.; Peeters, T.; Janssen, A. Business models for the internet of things. Int. J. Inf. Manag. 2015, 35, 672–678. [Google Scholar] [CrossRef]
  27. Osterwalder, A.; Pigneur, Y. Business Model Generation: A Handbook for Visionaries, Game Changers, and Challengers; John Wiley & Sons: Hoboken, NJ, USA, 2010. [Google Scholar]
  28. Maurya, A. Running Lean: Iterate from Plan A to a Plan That Works; O’Reilly Media: Sebastopol, CA, USA, 2012. [Google Scholar]
  29. Bucherer, E.; Uckelmann, D. Business Models for the Internet of Things, Chapter 10 in Architecting the Internet of Things; Uckelmann, D., Harrison, M., Michahelles, F., Eds.; Springer: Berlin/Heidelberg, Germany, 2011. [Google Scholar]
  30. Tan, A.R. Service-Oriented Product Development Strategies; Danmarks Tekniske Universitet, DTU Management, DTU Management Engineering: Lyngby, Denmark, 2010. [Google Scholar]
  31. Donaldson, K.; Ishii, K.; Sheppard, S. Customer value chain analysis. Res. Eng. Des. 2006, 16, 174–183. [Google Scholar] [CrossRef]
  32. Giusto, D.; Iera, A.; Morabito, G.; Atzori, L. The Internet of Things; Springer: New York, NY, USA, 2010. [Google Scholar]
  33. Akao, Y. Development History of Quality Function Deployment. The Customer Driven Approach to Quality Planning and Deployment; Asian Productivity Organization: Minato, Japan, 1994; p. 339. [Google Scholar]
  34. Norman, D.A.; Draper, S.W. User-Centered System Design: New Perspectives on Human-Computer Interaction; Lawrence Earlbaum Associates: Hillsdale, NJ, USA, 1986. [Google Scholar]
  35. Shneiderman, B. Designing the User Interface: Strategies for Effective Human-Computer Interaction; Addison-Wesley Publishing Co.: Reading, MA, USA, 1987. [Google Scholar]
  36. Preece, J.; Rogers, Y.; Sharp, H. Interaction Design: Beyond Human-Computer Interaction; John Wiley & Sons Inc.: New York, NY, USA, 2002. [Google Scholar]
  37. Kensing, F.; Plomberg, J. Participatory design: Issues and concerns. Comput. Support. Coop. Work 1998, 7, 167–185. [Google Scholar] [CrossRef]
  38. Schuler, D.; Namioka, A. Participatory Design: Principles and Practices; Lawrence Erlbaum Associates: Mahwah, NJ, USA, 1993. [Google Scholar]
  39. Muller, M.; Wildman, D.; White, E. Taxonomy of PD practices: A brief practitioner’s guide. Commun. ACM 1993, 36, 26–28. [Google Scholar]
  40. Environmental Protection Agency of Taiwan. Regulation of Subsidizing Battery Swap Service for Electric Motorcycles; Environmental Protection Agency of Taiwan: Taipei, Taiwan, 2012.
  41. Mattermark Report. The Top 100 Internet of Things Startups. Available online: http://www.forbes.com/sites/louiscolumbus/2015/10/25/the-top-100-internet-of-things-startups-of-2015/ (accessed on 28 December 2015).
Figure 1. An illustration of adding one pseudo actor to an actors and system map.
Sustainability 08 01217 g001
Figure 2. An actor and system map for conventional service without IoT technology.
Sustainability 08 01217 g002
Figure 3. Actors and system map for the first alternative combination of IoT technology application.
Sustainability 08 01217 g003
Figure 4. Actors and system map for the second alternative combination of IoT technology application.
Sustainability 08 01217 g004
Table 1. A table summarizing unmet needs and alternative combinations of applying IoT technologies.
Unmet NeedsWeighting FactorsAlternativesIoT Technology Applied on Object 1IoT Technology Applied on Object 2Contribution to Unmet NeedsWeighted Score
Alternative 1vv
Unmet need AWeight waAlternative 2v
Alternative 1vv
Unmet need BWeight wbAlternative 2v
Table 2. Flows between actors without using IoT technology.
NumberType of InteractionDescription
1Product flowService provider provides a charged battery to users or users give back an exhausted battery.
2Service flowService provider charges battery and makes sure it is fully charged.
3Information flowService provider provides ID of the battery and shows the proof of the battery being fully charged to the user.
Table 3. Alternative combinations of IoT technologies for two specified unmet needs.
Unmet NeedsWeightsAlternativesScooterCharging StationCell PhoneBatteryControl Center
WLMPATSSWLWLSSWLMMMPWLMP
More reliable batteryW1Alternative 1vv vvvvvvvvv
Personalized display panelW2Alternative 2vvv v
Table 4. Description of flows for alternative 1.
NumberType of FlowsDescription
A1informationRiding distance record for the currently used battery
A2serviceBattery provides power (electricity) for the scooter
A3informationBattery passes riding distance record to the charging station
A4informationBattery passes remaining power and other records indicating battery efficiency to charging station
A5informationCharging station provides riding distance, battery remaining power, efficiency records to control center
A6informationControl center passes summary report and condition of battery to charging station
A7informationRemaining power and accumulated riding distance of the battery
A8informationBattery passes current power status of power to scooter
A9informationScooter passes current power status to cell phone
A10informationCell phone displays power status to users
A11productUser and service provider swap batteries
Table 5. Description of flows of alternative 2.
NumberType of FlowsDescription
B1serviceCell phone provides choice of settings for display panel on a scooter, e.g., color of panel backlight, pattern of light blinking, etc.
B2informationCell phone passes the personalized settings to scooter
B3serviceScooter provides personalized settings to a user
Table 6. A summary evaluation table of alternative combinations of IoT technologies.
Unmet NeedsWeightsAlternativesScooterCharging StationCell PhoneBatteryControl CenterContribution to Unmet NeedWeighted Score
WLMPATSSWLWLSSWLMMMPWLMP
More reliable battery0.8Alternative 1vv vvvvvvvvv75.6
Alternative 2vvv v 10.8
Personalized control panel0.2Alternative 1vv vvvvvvvvv51.0
Alternative 2vvv v 81.6

