Article

Inventory and Policy Reduction Potential of Greenhouse Gas and Pollutant Emissions of Road Transportation Industry in China

1
Key Laboratory of Road and Traffic Engineering of the State Ministry of Education, Tongji University, Shanghai 201804, China
2
Energy Analysis and Environmental Impacts Division, Lawrence Berkeley National Lab, Berkeley, CA 94720, USA
*
Author to whom correspondence should be addressed.
Sustainability 2016, 8(12), 1218; https://doi.org/10.3390/su8121218
Submission received: 1 July 2016 / Revised: 5 October 2016 / Accepted: 16 November 2016 / Published: 25 November 2016

Abstract

:
In recent years, emissions from the road transportation industry in China have been increasing rapidly. To evaluate the reduction potential of greenhouse gas and pollutant emissions of the industry in China, its emission inventory was calculated and scenario analysis was created for the period between 2012 and 2030 in this paper. Based on the Long-range Energy Alternatives Planning System (LEAP) model, the development of China’s road transportation industry in two scenarios (the business-as-usual (BAU) scenario and the comprehensive-mitigation (CM) scenario) was simulated. In the Comprehensive Mitigation scenario, there are nine various measures which include Fuel Economy Standards, Auto Emission Standards, Energy-saving Technology, Tax Policy, Eco-driving, Logistics Informatization, Vehicle Liquidation, Electric Vehicles, and Alternative Fuels. The cumulative energy and emission reductions of these specific measures were evaluated. Our results demonstrate that China’s road transportation produced 881 million metric tons of CO2 and emitted 1420 thousand tons of CO, 2150 thousand tons of NOx, 148 thousand tons of PM10, and 745 thousand tons of HC in 2012. The reduction potential is quite large, and road freight transportation is the key mitigation subsector, accounting for 85%–92% of the total emission. For energy conservation and carbon emission mitigation, logistics informatization is the most effective method, potentially reducing 1.80 billion tons of coal equivalent and 3.83 billion tons of CO2 from 2012 to 2030. In terms of air pollutant emission mitigation, the auto emission standards measure performs best with respect to NOx, PM10, and HC emission mitigation, and logistic informatization measure is the best in CO emission reduction. In order to maximize the mitigation potential of China’s road transportation industry, the government needs to implement various measures in a timely and strict fashion.

1. Introduction

Currently, China’s carbon dioxide (CO2) emissions rank first in the world. CO2 emissions generated in energy consumption in China in 2012 amounted to 9.9 billion tons, which accounts for 29% of global CO2 emissions and is close to the total CO2 emissions of the United States and the European Union combined [1]. In the last decade, CO2 emissions in China have increased three times, and the rate of increase in China is far higher than those of other major economies. From 2010 to 2012, 73% of global CO2 emission increases came from China [2].
The road transportation industry has been one of the main sources of increase in energy consumption and carbon emission in recent years. Although the road transportation industry only contributed around 5% of total CO2 emissions in China in 2008 [3], it grew significantly after that, especially in its largest sub-sector, freight transportation. From 2008 to 2012, freight kilometers increased by 81% and the population of registered freight trucks in China increased by 65% to 12.53 million. The road transportation fleet consumed a large amount of fuel and emitted an equally significant amount of CO2. Meanwhile, fossil fuel burning produces different kinds of air pollutants, such as carbon monoxide (CO), nitrogen oxide (NOx), particulate matter (PM10), and hydrocarbon (HC). If no action is taken, along with the rapid urbanization and motorization processes underway in China, energy consumption, as well as CO2 and pollutant emissions by the transportation industry, can be predicted to continue to rise rapidly in the future [4], and a variety of issues, such as energy shortages, global warming, and environmental pollution deterioration, will be aggravated.
In order to reduce emissions from the road transportation industry, China has formulated several policies in the past decade, including stricter vehicle fuel economy standards and promoting electric vehicles. However, the increase in emissions in China’s transportation sector cannot be suppressed. On the contrary, the road transportation sector’s emissions are correspondingly accelerating because of rapid development [5]. The quantity of related measures in China is smaller when compared to other high-emission countries. According to IEA data, in the first decade of the 21st century, only five transportation-related measures were implemented in China, which is less than half of those in United States, Japan, or the United Kingdom [6]. During the same period, the United States, Japan, and the United Kingdom enacted 59, 11, and 16 policies, respectively, to promote low-carbon transportation. This gap indicates that the Chinese government has not paid a great deal of attention to emission mitigation strategies. These polices contain not only technology measures but also economic measures, renewable energy measures, and complementary policies. For example, the United States implemented the Plug-in Electric Drive Motor Vehicle Tax Credit campaign in 2008 and Japan implemented the National Promotion of Eco Driving campaign in 2006. China can use these successful experiences as models for its own emission reduction schemes.
Nowadays, China has undertaken more responsibility in reducing CO2 emissions. At the end of 2014, the leaders of China and the Unites States jointly issued the Sino–US Joint Statement on Climate Change, in which the Chinese government proposed that China’s CO2 emission would reach its peak in 2030. Emission reduction targets should be distributed to different economic industries. However, there is no evidence to show if CO2 emissions from the road transportation industry can peak before 2030 and the degree to which emissions can be reduced by implementing more mitigation measures. Before taking new actions, the emission inventory and mitigation potential of the road transportation sector should be quantitatively examined first.
In the paper, we calculate emissions from the road transportation industry and analyze the energy-saving and emission mitigation potential of the implementation of various policies and measures. In Section 2, we review emission estimation methods and the emission mitigation potential of relevant policies. In Section 3, we introduce the model framework, data structure, and calculation equations. In Section 4, we set several scenarios and corresponding bases and calculate CO2 and pollutant emissions from the road transportation industry from 2012 to 2030 according to different scenarios based on the established model. Finally, in Section 5 and Section 6, we calculate the amount of emissions in the base year, 2012, from the road transportation industry, compare the contribution rates of various scenarios to emission mitigation, and propose relevant policies.

2. Literature Review

2.1. Vehicle Emission Evaluation

An evaluation of emissions from transportation is the basis of low-carbon transportation studies. The differences in methods, indicators, and data adopted in relevant studies have led to significantly different conclusions [7,8,9]. The most widely used estimation standards of carbon dioxide emission are from the 2006 IPCC (Intergovernmental Panel on Climate Change) Guidelines for National Greenhouse Gas Inventories [10]. In the IPCC Guidelines, emissions are estimated according to human activity levels and emission factors. The estimation methods are divided into two types: the bottom-up approach and the top-down approach. In the bottom-up approach, the mileage of various traffic methods is multiplied by the corresponding fuel consumption per kilometer to give the total fuel consumption, which is then multiplied by the carbon emission coefficients of fuel to obtain the total emissions. In the top-down approach, the national or regional data of transportation fuel consumption is multiplied by the carbon emission coefficients of various fuels to obtain the total carbon emissions.
For easier calculation and data collection, most air emission inventories that contain all social activities and economic sectors have adopted the second method. However, when policy-makers focus on a specific sector, more details should be presented, and the bottom-top method is more appropriate. Vehicles are moving carbon emission sources, and there are significant differences between different types of vehicles. Decision-makers can obtain more precise information about different kinds of vehicles, which is useful in measuring the contribution rates of policies, projects, and different scenarios. For example, in the United States and some European countries, emissions from the transportation industry were estimated according to the operating conditions of vehicles, and vehicle pollutant emission factors were measured and released to national vehicle emission inventories [11,12,13,14]. The estimation approach can be deemed as a bottom-up approach.
The bottom-up approach requires local vehicle emission factors. In most previous studies in China, software defaults of emission factors were generally adopted, but the defaults were mostly incompatible with the situation in China [15]. Therefore, the calculation results differed significantly from the actual results. In recent years, the Vehicle Emission Control Center of the Department of Environmental Protection in China has started to study vehicle emission factors and released the Technical Guidelines for Calculating Road Motor Vehicle Emission Inventories (Trial) [16], which provided the emission factors for this study.

2.2. Mitigation Potential Analysis

Developing and implementing policies is one of the main ways to promote low-carbon urban transportation. Various methods of accessing their mitigation potentials have also been hotly debated in recent studies. The effectiveness and feasibility of relevant policies are closely related to local characters [17,18]. There is some bottom-up modeling software, such as TREMOVE, TRANUS, TV-SIM, and Long-range Energy Alternatives Planning System (LEAP), which can input the local characteristic parameters in the analysis module, such as emission factors, vehicle quality, and model-split. These can be used to estimate the emission mitigation potential of transportation policies [9,15,19].
Among these models, LEAP is one of the most popular methods for mitigation potential analysis because it requires less data and provides the scenario analysis function. LEAP can quantify impacts of structural shifts and technology-based policies such as energy efficiency [20,21,22]. However, the analysis function for fiscal policies remains relatively limited, such as the carbon tax. Their impacts can only be captured by referencing related studies. In this way, LEAP is widely used for the modeling of transportation energy consumption and emissions with transportation analysis modules, especially in developing countries. For example, Malaysia [23], Mexico [24], and other countries have established the modified LEAP model according to local conditions to evaluate their mitigation potential in the transportation sector and the effects of relevant mitigation policies [25]. Several studies on China using the LEAP model have been conducted over the past few years. The Chinese Energy Research Institute (ERI) has used LEAP to explore how China could achieve its development goals while reducing its carbon footprint [26]. Zhang, Y. established the traffic model for Beijing’s urban transport system, analyzed energy consumption and pollutant emissions from 2010 until 2020, and evaluated the emission mitigation potential of various energy-saving measures [27]. Zhan, J. et al. developed a LEAP model for the city of Foshan to compare the mitigation potential between road transportation and water transportation [28]. These studies have helped create regional and even national energy policies and plans.
However, there is a lack of studies focusing on the mitigation potential of road transportation. Although Yan analyzed the energy consumption of road transportation in China [29], atmospheric pollutant emissions, liquidation policies of heavy emission vehicles, and promotion policies of electric vehicles have not been considered. In this paper, we comprehensively study the emission mitigation potential of the road transportation industry, which could help the government to develop reasonable macroscopic transportation policies addressing the synchronous challenges of greenhouse gas (GHG) emissions and pollution in the next 15 years.

3. Methodology

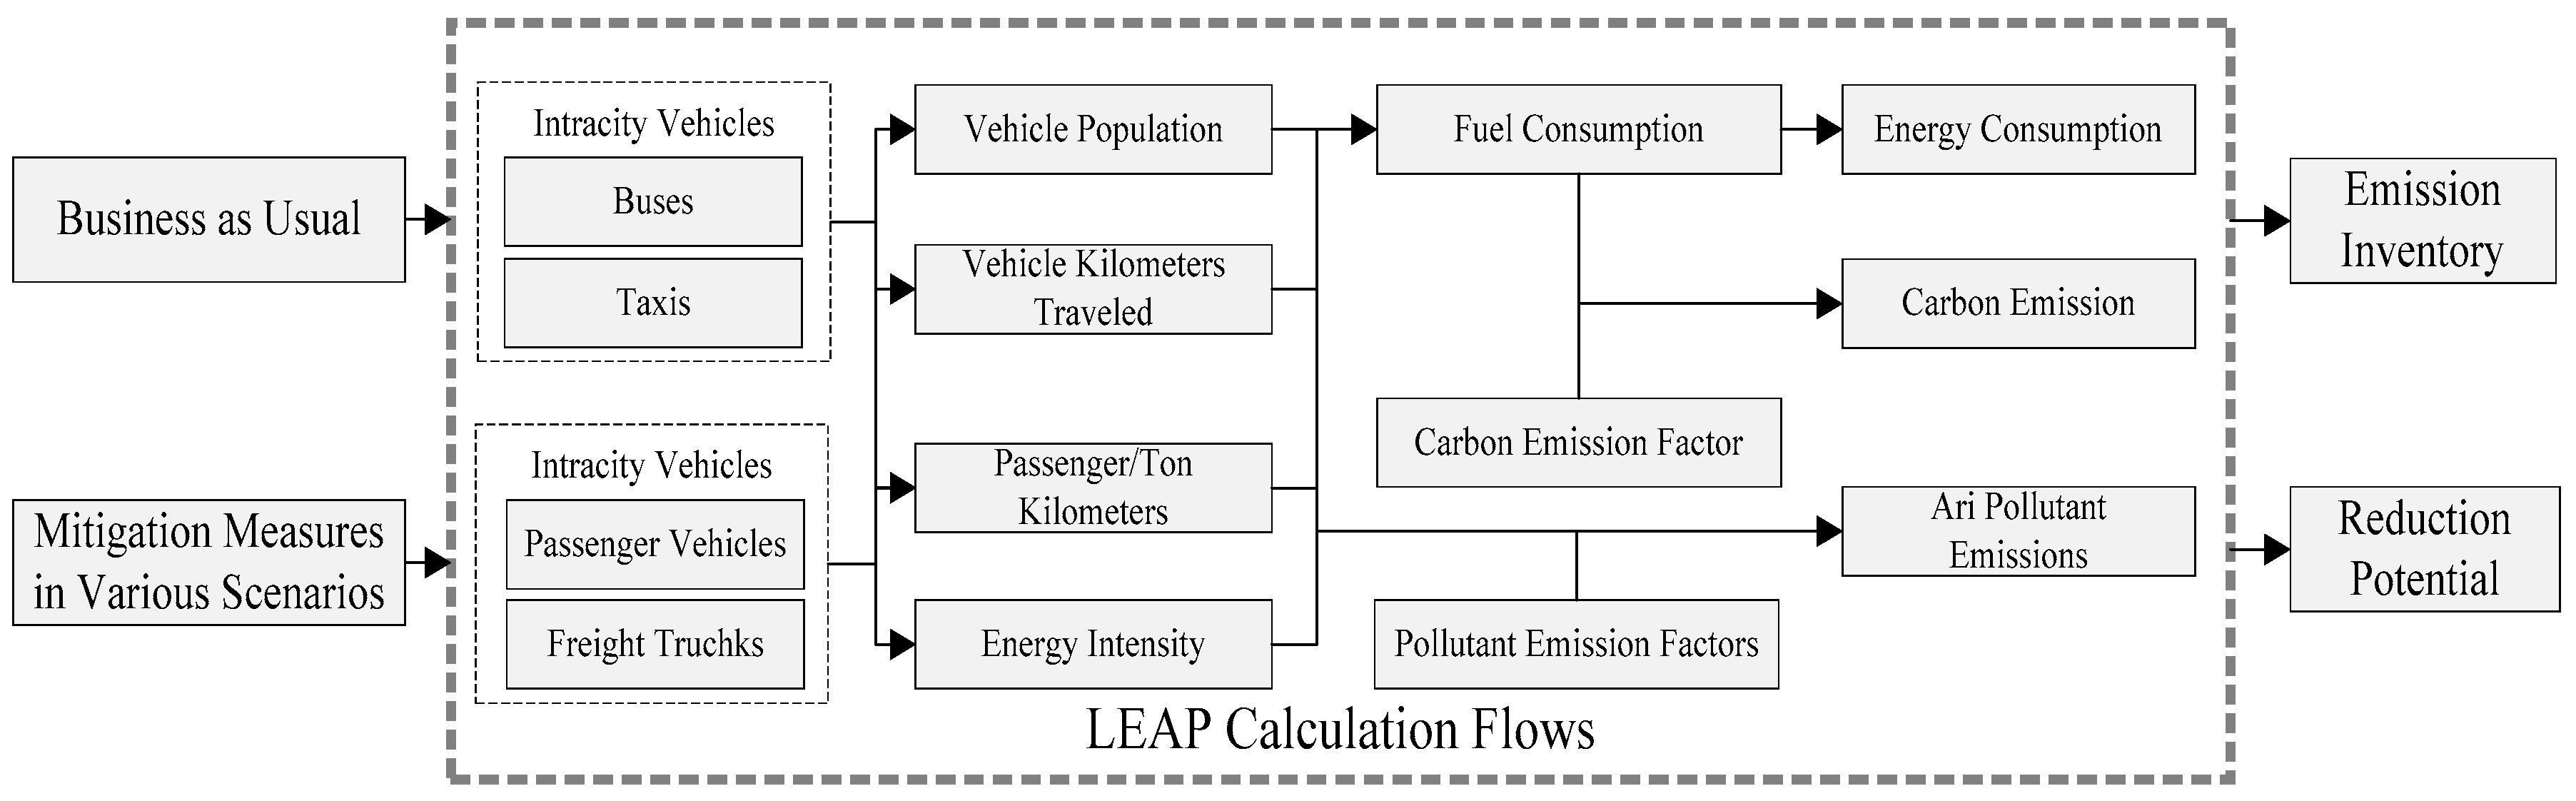
3.1. Model Framework

In order to evaluate the emission inventory and reduction potential, we built a LEAP model for the Chinese road transportation industry. This model framework is shown in Figure 1. At first, the data from Chinese road transportation were collected, and emission reduction policies and measures were quantified as model input parameters. It should be noted that socioeconomic and demographic parameters were fixed, while measure parameters were variable. Nine mitigation measures were considered in this study. Then, based on various parameter value sets under different measures, the energy demand of each transport sector is calculated using the LEAP model. By multiplying different pollutant emission factors, we obtained emission situations under different measures.

3.2. Data Structure

Data used in this study came from the National Bureau of Statistics of China (NBS) and the Ministry of Transport of China (MOT). Due to the statistical methods and dimensions, the data collected are only for business vehicles, which are registered by the MOT. In China, trucks and coaches are not allowed to conduct transport businesses if they have not been registered. Therefore, the total GHG and pollutant emissions exhausted by these vehicles reflect the emissions of the road transportation sector in China.
In accordance with the China Transport Statistical Yearbook, business vehicles are divided into two key categories: vehicles for intracity transport and vehicles for intercity transport. The former were further divided into buses and taxis, and the latter were further divided into passenger vehicles and freight vehicles. Vehicles based on different technologies consume different types of fuel, as shown in Table 1. Different fuels have different emission factors. Thus, vehicle technology should be considered in the emission estimation process.

3.3. Estimation Equations

The emission estimation of the road transportation industry is performed according to the ASIF method in four aspects: transportation activity (A), the composition structure of transportation vehicles (S), energy intensity (I), and fuel type (F). A represents all activities of passenger transportation or freight transportation and may be measured by passenger turnover, freight turnover, or vehicle-miles of travel. S represents the travel mode structure, including walking, cycling, car, bus, and subway. I represents the intensity of energy consumption, which is related to fuel price, vehicle standards, and incentives. F represents the carbon emission factor of a fuel. The factors are slightly different among various regions and may be calculated according to the carbon balance method. It should be noted that the actual parameters of the ASIF framework are not the same in different countries or regions. Therefore, emission characteristics are different in different countries or regions. Being the bottom-up estimation basis of energy consumption and emissions, the ASIF method has been widely applied since it was proposed by Schipper in 2000 [30,31]. Based on ASIF, we used the bottom-up method to calculate energy consumption, CO2 emission, and pollutant emissions.

3.3.1. Calculation of Energy Consumption

The total energy consumption of the road transportation industry is calculated as
S E = j i ( P i j × M i j × e i j × 365 )
where P i j is the population of j vehicles utilizing i fuel; M i j is the average daily mileage or the average daily turnover of a vehicle; e i j is the energy consumption factor of a vehicle, namely, the energy consumption of a vehicle per kilometer or unit turnover.

3.3.2. Calculation of CO2 Emission

According to the calculation method of carbon emission of mobile sources in 2006 IPCC Guidelines for National Greenhouse Gas Guidelines [31], CO2 emission is calculated as
S c = j S E j × c j
where c j is carbon emission factor of j fuel, namely, the mass of CO2 generated in the complete combustion of per unit of j fuel.

3.3.3. Calculation of Pollutant Emissions

Air pollutants emitted by a vehicle mainly come from fuel impurities and an incomplete combustion process. The amount of pollutant emissions of a vehicle therefore largely depends on the technology of its internal combustion engine, driving conditions, and oil quality. Considering the above factors, total pollutant emissions from the road transportation industry was calculated as
S p k = j i ( P i j × M i j × p i j k × 365 )
where p i j k is the emission factor of a pollutant, the emission of a pollutant w of j vehicles utilizing i fuel per kilometer.

4. Scenarios Setting

In order to reflect energy-saving and emission mitigation potential of the Chinese road transportation industry, several scenarios were set: the Business-as-usual (BAU) Scenario and the Comprehensive Mitigation (CM) Scenario. Based on the existing policies and other countries’ developing experiences, a series of reasonable assumptions on the developmental trends of the road transportation industry from 2012 to 2030 were considered. Meanwhile, in order to further analyze specific mitigation potentials of different types of measures, the CM scenario was divided into three sub-scenarios: the technological-progress (TP) sub-scenario, the organizational-management (OM) sub-scenario, and the energetic-structure promotion (EP) sub-scenario. Different sub-scenarios contain several measures. The OM sub-scenario contains fuel economy standards, auto emission standards, and energy-saving technology; the TP sub-scenario contains tax policies, eco-driving, logistics informatization, and vehicle liquidation; the EP sub-scenario contains electric vehicles and alternative fuels.

4.1. The Business-as-Usual (BAU) Scenario

In the BAU scenario, the core assumption is that, during the scenario’s prediction period, the urban passenger transportation structure, the road transportation structure, infrastructure investment in the transportation industry, energy efficiency, and emission levels of different types of vehicles will not experience any major change, but show slow and progressive changes. The government will not implement any new mitigation measures. Thus, this scenario represents the developmental trends of energy consumption and emissions of the Chinese road transportation industry without any other actions, which can be used to measure the mitigation potential of other scenarios. In this scenario, the trends of vehicle population and vehicle passenger turnover were obtained by adjusting the parameters related to transportation activity levels and by fitting the data collected in recent years. Freight turnover is significantly correlated with economic growth and energy consumption. In this paper, it is assumed that the growth of China’s freight turnover will slow down after completing the industrialization process around 2020 [26].

4.2. The Technological-Progress (TP) Sub-Scenario

4.2.1. Fuel Economy Standards

Fuel economy standards are regulations to improve the average fuel economy of cars and light trucks produced for sale. According to the Guiding Opinions on Low-carbon Transport System Construction [32] and the Comprehensive Working Program for Low-carbon Transport System Pilot [33] issued by the Chinese government in 2011 for the road transportation sector in 2015 and 2020, the energy intensity of commercial vehicles should decrease by 10% and 16%, respectively, compared with 2005 levels. Therefore, the energy intensity of intercity commercial passenger vehicles should be downregulated by 6% and 8%, respectively; the energy intensity of commercial trucks should be downregulated by 12% and 18%, respectively; the energy intensity of urban buses should decrease by 14% and 22%, respectively; the energy intensity of taxi energy consumption should decrease by 23% and 30%, respectively. Meanwhile, referring to the Global Fuel Economy Initiative [34], the fuel economy of new vehicles was to be reduced by 50% from 2005 to 2030, by approximately 2.7% per year. The third phase of fuel economy standards was carried out in 2015, improving by 34% compared with 2005 levels, and the new standards are under study. This study therefore assumes the fourth phase of fuel economy standards will be implemented in 2020. Accordingly, the average energy intensity will be reduced by 34% compared with 2005 levels. In 2030, the fuel economy of new vehicles for sale will double.

4.2.2. Auto Emission Standards

The auto emission standards will reduce both tailpipe and evaporative pollutant emissions from passenger cars, light-duty trucks, medium-duty passenger vehicles, and some heavy-duty vehicles. China implemented China-IV (Chinese emission standards in the fourth phase) for light-duty vehicles in 2011 and for heavy-duty trucks in 2013 [35]. According to this developmental trend, this study assumes that China will implement China-V in 2017 and implement China-VI (which is equivalent to Euro-VI) in 2020.

4.2.3. Energy-Saving Technology

Energy-saving technology can be used to improve fuel economy for existing vehicles, especially for heavy-duty trucks. A set of energy-saving equipment including a wind deflector and a tire pressure sensor, as well as low resistance tires, can save about 13% of fuel consumption [36]. In this scenario, governments and companies attach importance to developing green freight operations and promoting energy-saving equipment in fleets. Vehicle fuel economy will be increased by 10% after energy-saving improvements. It is expected that, from 2015 onwards, 8% of freight vehicles will be installed with energy-saving equipment every year until 2020. At that time, the energy efficiency of 40% of freight trucks will be improved. Afterwards, the promotion speed will begin to slow down. In 2030, 80% of trucks in the road transportation industry will be improved.

4.3. Organizational-Management (OM) Sub-Scenario

4.3.1. Tax Policy

Tax policy, as an economic tool, can influence vehicle purchasing and driving behavior, and has been a reserve policy in China since 2008. Although related studies have been done in the last few years, the question of whether a carbon tax or a green tax can be implemented in China remains unanswered. Despite this, it is still very meaningful to evaluate the emission mitigation potential of this measure. In this study, we boldly assume that China will gradually reduce passenger vehicles’ and taxis’ fuel subsidies and will begin to impose a carbon tax of 10% of fuel costs to the road transportation sector from 2015. According to several research results [37], this will cause a 1% decrease in the cargo volume of trucks and an increase in other forms of transportation, including railway transport, as well as a 1.5% growth of fuel economy within a year. In 2020, the effect will lead to a 3% reduction in the vehicle kilometers traveled (VKT), and a 4% improvement in fuel economy. Under this effect, the ratio of the high efficiency models has a slightly higher annual growth rate than that of the baseline scenario.

4.3.2. Eco-Driving

Eco-driving means smarter and more fuel-efficient driving, and it is also a way to minimize fuel consumption and CO2 emissions. Good driving habits can reduce fuel consumption by nearly 10% [38]. Promoting eco-driving training programs to transportation enterprises’ drivers or adding eco-driving tips to a driver’s license examination can help the Chinese government to reduce CO2 emissions from the road transportation industry. Therefore, in the eco-driving scenario, we established that eco-driving training would be implemented in the road transportation industry in the future. The amount of drivers trained in 2020 and 2030 would be approximately 40% and 80% of the total drivers in this industry, respectively.

4.3.3. Logistics Informatization

By improving vehicle load factors as well as operational efficiency, logistics informatization measures can help freight companies save costs and reduce energy consumption and emissions. The United States carried out the Electronic Freight Management Initiatives in 2004. As part of this, an open freight management platform was built. The government, transportation companies, and customers can share information on this platform. After 10 years, the American empty-loaded rate fell by more than 50% to around 10% [39]. This rate in China was around 40%–45% in 2012. Based on the experiences of domestic and international development, it was assumed that China would vigorously develop and promote information platform constriction and specialty vehicles. In this study, we define 2020 and 2030 as the target years; accordingly, the empty-loaded rate of freight trucks will decrease to 35% and 20%, the freight kilometers of specialty-vehicles will rise to 21% in 2020 (17% in BAU), and 30% in 2030 (20% in BAU).

4.3.4. Vehicle Liquidation

Vehicle liquidation is a policy that accelerates the retirement speed of heavy-polluting vehicles. In 2012, there were 2.01 million “yellow-label vehicles” in the Chinese road transportation industry, which includes gasoline vehicles that do not meet the China-I emission standard, and diesel vehicles that do not meet the China-III emission standard. These vehicles accounted for 13.27% of the total pollution, but consumed 22.94% of the energy and emitted over 35% air pollutants. Furthermore, they produced over half of all PM10 emissions in the road transportation industry. According to the 2014–2015 Action Plan for Energy Conservation, Emission Reduction and Low-Carbon Development, issued by the State Council, about 46.15% of the total amount of yellow-label vehicles was to become obsolete by the end of 2013. Therefore, in this study, we assumed that China strictly implemented these programs, eliminating 46.15% of the yellow-label vehicles in the road transportation industry in 2014, and took enforcement measurements after 2014 to phase out all yellow-label vehicles in the road transportation industry.

4.4. The Energetic-Structure Promotion (EP) Sub-Scenario

4.4.1. Electric Vehicles

Due to the limitations of battery technology, electric vehicles are not suitable for long-distance transportation. Thus, electric vehicles are mainly promoted for intracity transportation. China’s aim is for the ownership of battery electric vehicles (BEVs) and plug-in hybrid electric vehicles (PHEVs) in the market to reach 500,000 or more in 2015 and 5 million in 2020. The Comments on the Implementing Opinions on Accelerating the Promotion and Application of New Energy Vehicles (Draft for Comment) [40] issued by the Ministry of Transportation put forward that, “in 2020, among new buses and taxis in the ‘transit metropolis’, the proportion of new energy vehicles will be no less than 30%; by 2020, new energy buses will reach 20 million units, while new energy taxis will reach 50,000 units”. On this basis, in this study, we assumed that the average level of increase of new energy vehicles in intracity transportation would be half of that in the “transit metropolis” and would grow faster over time, which meant that the proportion of newly increased new energy vehicles was to reach 5% in 2015 and is to reach 15% in 2020 and 40% in 2030. Among new energy vehicles, the hybrid electric vehicle is now highly recommended, while the purely electric vehicle is the developmental direction of the future. According to statistics, among new energy buses and taxis, the ratio of PHEVs and BEVs was 7:3 in 2012; thus, we set the ratio of PHEVs and BEVs to be 3:2 in 2010 and 1:1 in 2030.

4.4.2. Alternative Fuels

An alternative fuel, most generally defined, is any fuel other than the traditional fuels (gasoline and diesel), such as natural gas, ethanol gasoline, and so on. As substitutes for gasoline and diesel vehicles, alternative fuel vehicles are suitable for both the intracity transportation subsector and the intercity transportation subsector. In 2012, natural gas buses accounted for 18% of total buses, and natural gas taxis 4.4%. Based on this, in this study, we estimated that, in the intracity transportation subsector, the proportion of increased natural gas buses was to reach 20% in 2015 and is to reach 30% in 2020 and 50% in 2030, and that the proportion of increased taxis was to reach 10% in 2015 and is to reach 20% in 2020 and 40% in 2030. The proportion of alternative fuels in the intercity transportation subsector is currently negligible. In this scenario, we assume that China will vigorously promote the use of alternative fuels in the road transport industry. The proportion of alternative fuel vehicles in freight trucks is to reach 10% by 2020 and 30% in 2030, among which biofuels and compressed natural gas vehicles share the same proportion. We estimate that the emission factors of natural gas vehicles will be greatly reduced with technology advances.
In the paper, we have set the parameters of the above scenarios based on considerations of previous results and Chinese medium- and long-term planning [26,32,33,34,35,36,37,38,39,40,41,42,43,44,45]. The parameters of the above scenarios are shown in Table 2.

5. Results

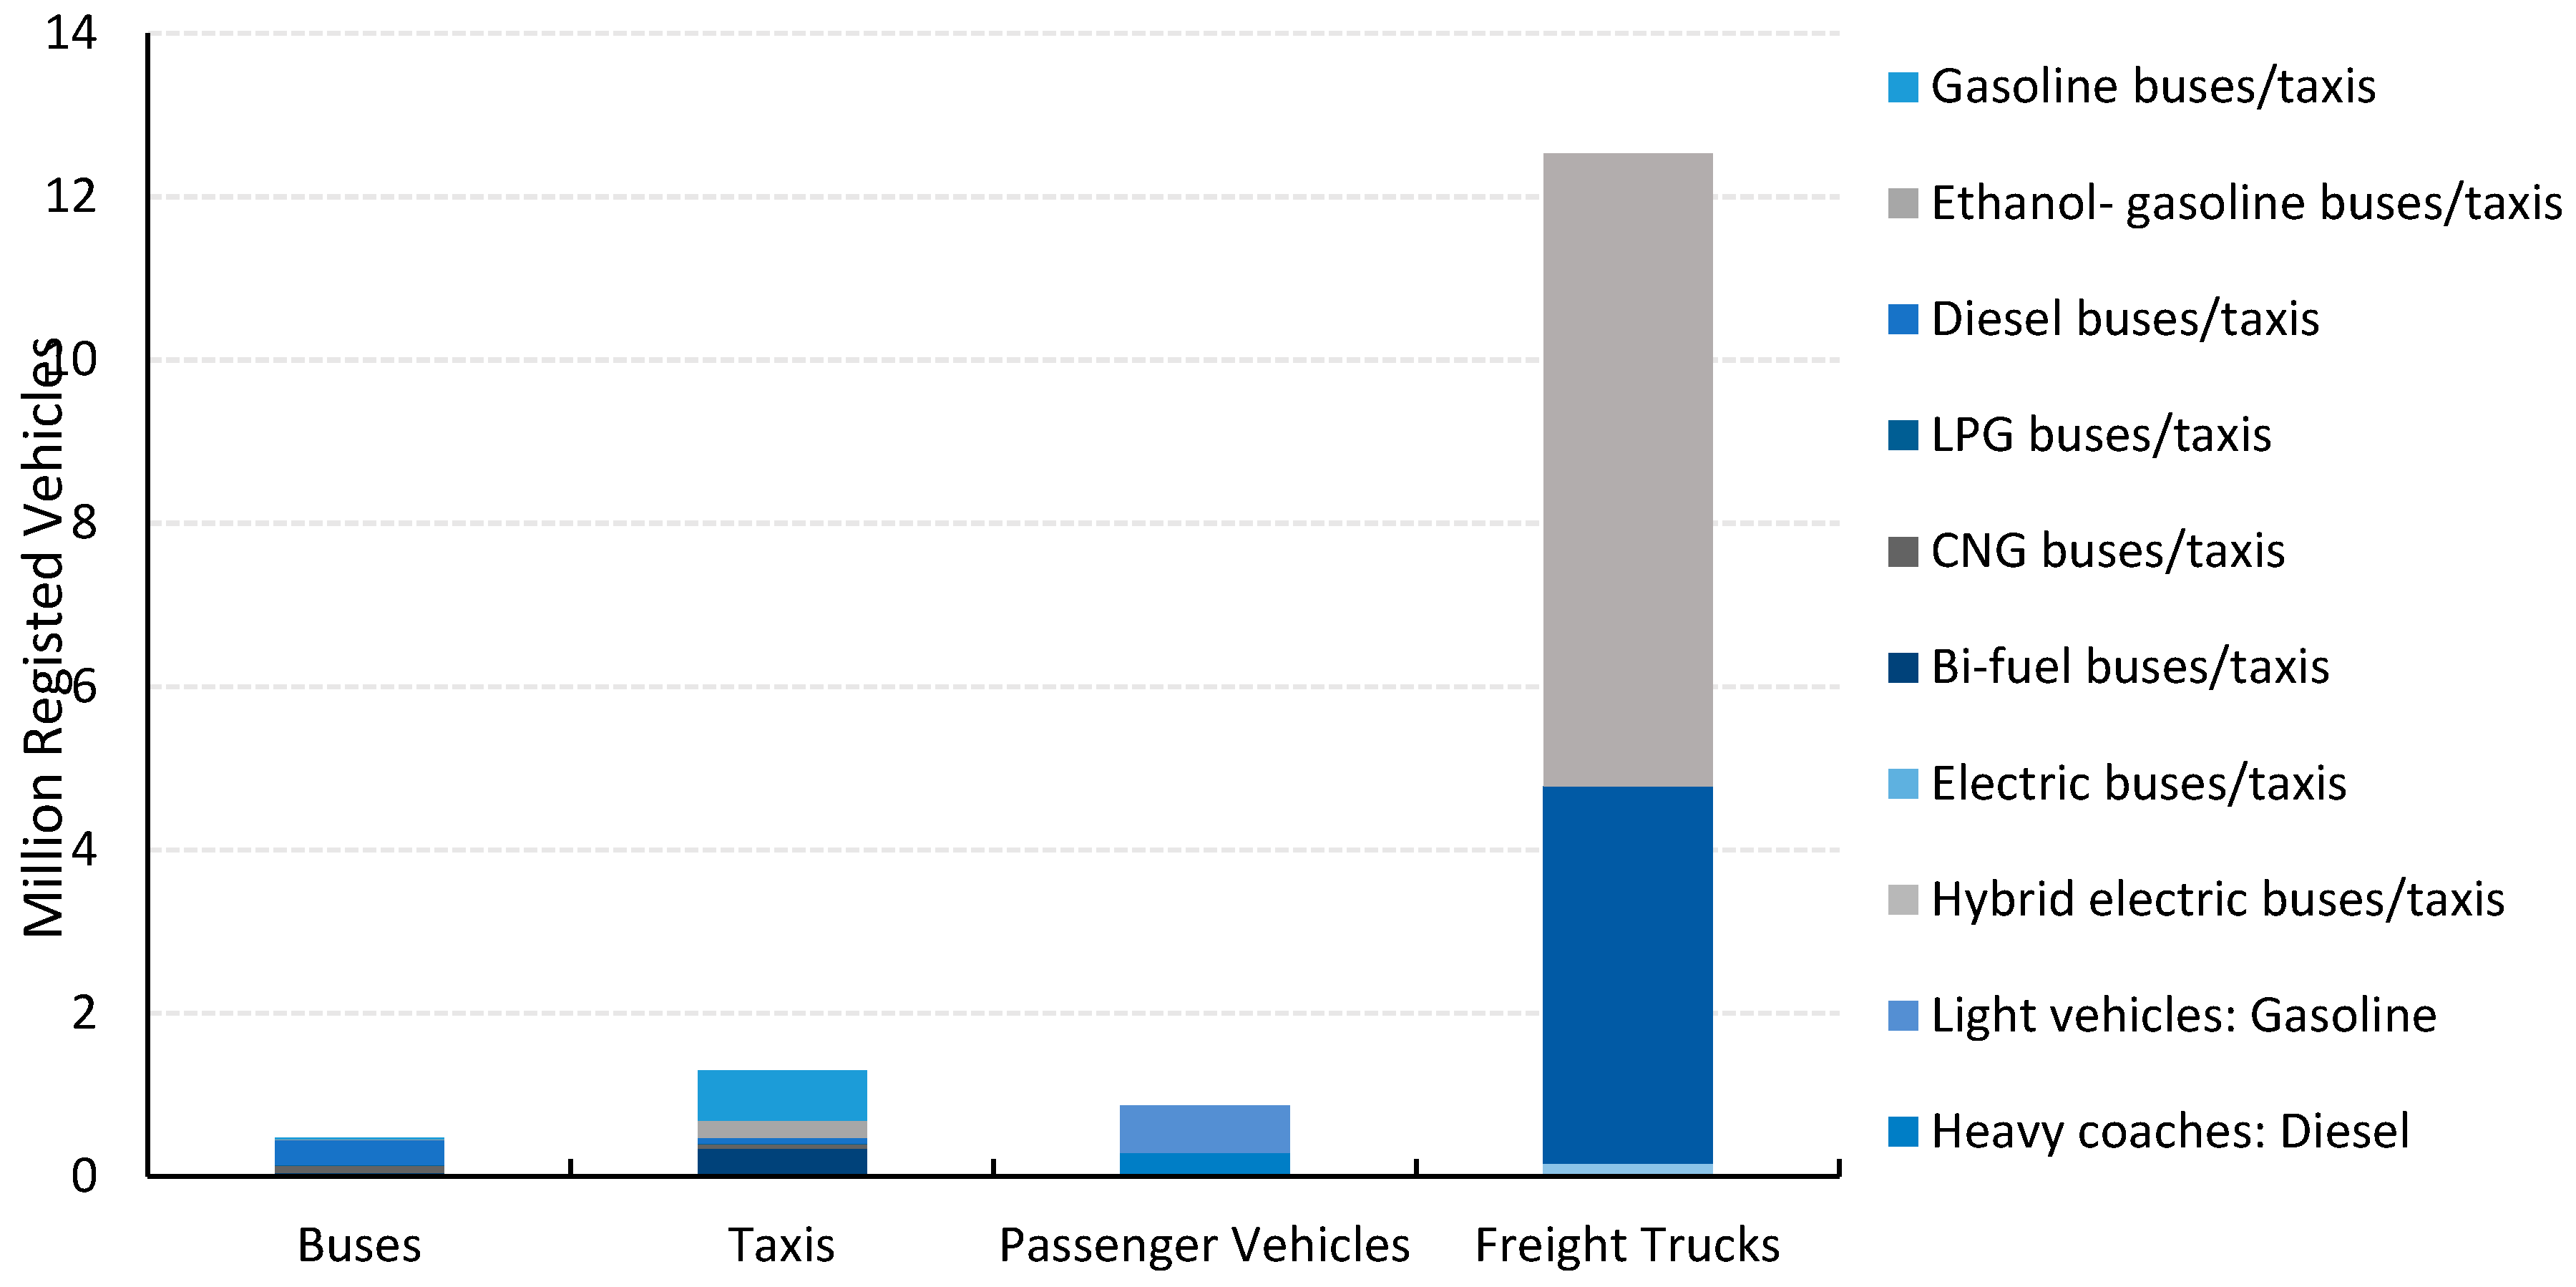
5.1. Emission Inventory of the Road Transportation Industry in China in 2012

In 2012, gasoline and diesel are still the two main energy resources in the Chinese road transportation industry. It can be seen from Figure 2 that these two fuels feed nearly three quarters of intracity transportation vehicles and almost all intercity vehicles. Only a small part of buses and taxis use liquefied petroleum gas (LPG) or compressed natural gas (CNG). Only 0.1% of total vehicles are electric or hybrid power vehicles. Although the number of clean energy vehicles was limited in 2012, it is much better than the situation several years ago.
The emission inventory of the road transportation industry in China was calculated using base data from the China Transport Statistical Yearbook 2012 [46]. The base data included the registered vehicle population, kilometers traveled, and turnover. Average energy consumption intensity of each vehicle class was from the Highway and Waterway Transportation Industry Statistical Bulletin in 2012. The data of emission standards and compositions of intracity vehicles were from the China Transport Statistical Yearbook 2012, and the data of intercity vehicles were calculated from the vehicle survival curves and annual vehicle production quantities. The carbon emission factor was from the Greenhouse Gas Accounting Tool for Chinese Cities (Pilot Version 1.0) [47]. Pollutant emission factors of the vehicles with different emission standards were provided by the Vehicle Emission Control Center of the Ministry of Environmental Protection.
As shown in Table 3, for the year 2012, more than 15 million registered vehicles in the Chinese road transportation industry consumed 422 Mtce (million tons of coal equivalent) of energy and produced 881 Mt CO2e (million metric tons of CO2 equivalent). The emission contribution rate of the Chinese road transportation industry to the total emission amount is 8.9%, which increased by 78% since 2008. This proportion would be 16% if emissions from private vehicles, ships, rails, and aircrafts were added, which is still far from the average level of the world, 23% [48]. We used the ratio provided by the Institute for Energy and Environmental Research Heidelberg to evaluate it [49]. Furthermore, they also emitted 1420 kilotons of CO, 2150 kilotons of NOx, 148 kilotons of PM10, and 745 kilotons of HC. Among these four sub-sectors, freight trucks consumed the most energy and emitted the largest amount of pollutants emissions in 2012, which contributed 86.4% of CO2 emissions and 68.6~85% of air pollutants.

5.2. Scenario Analysis

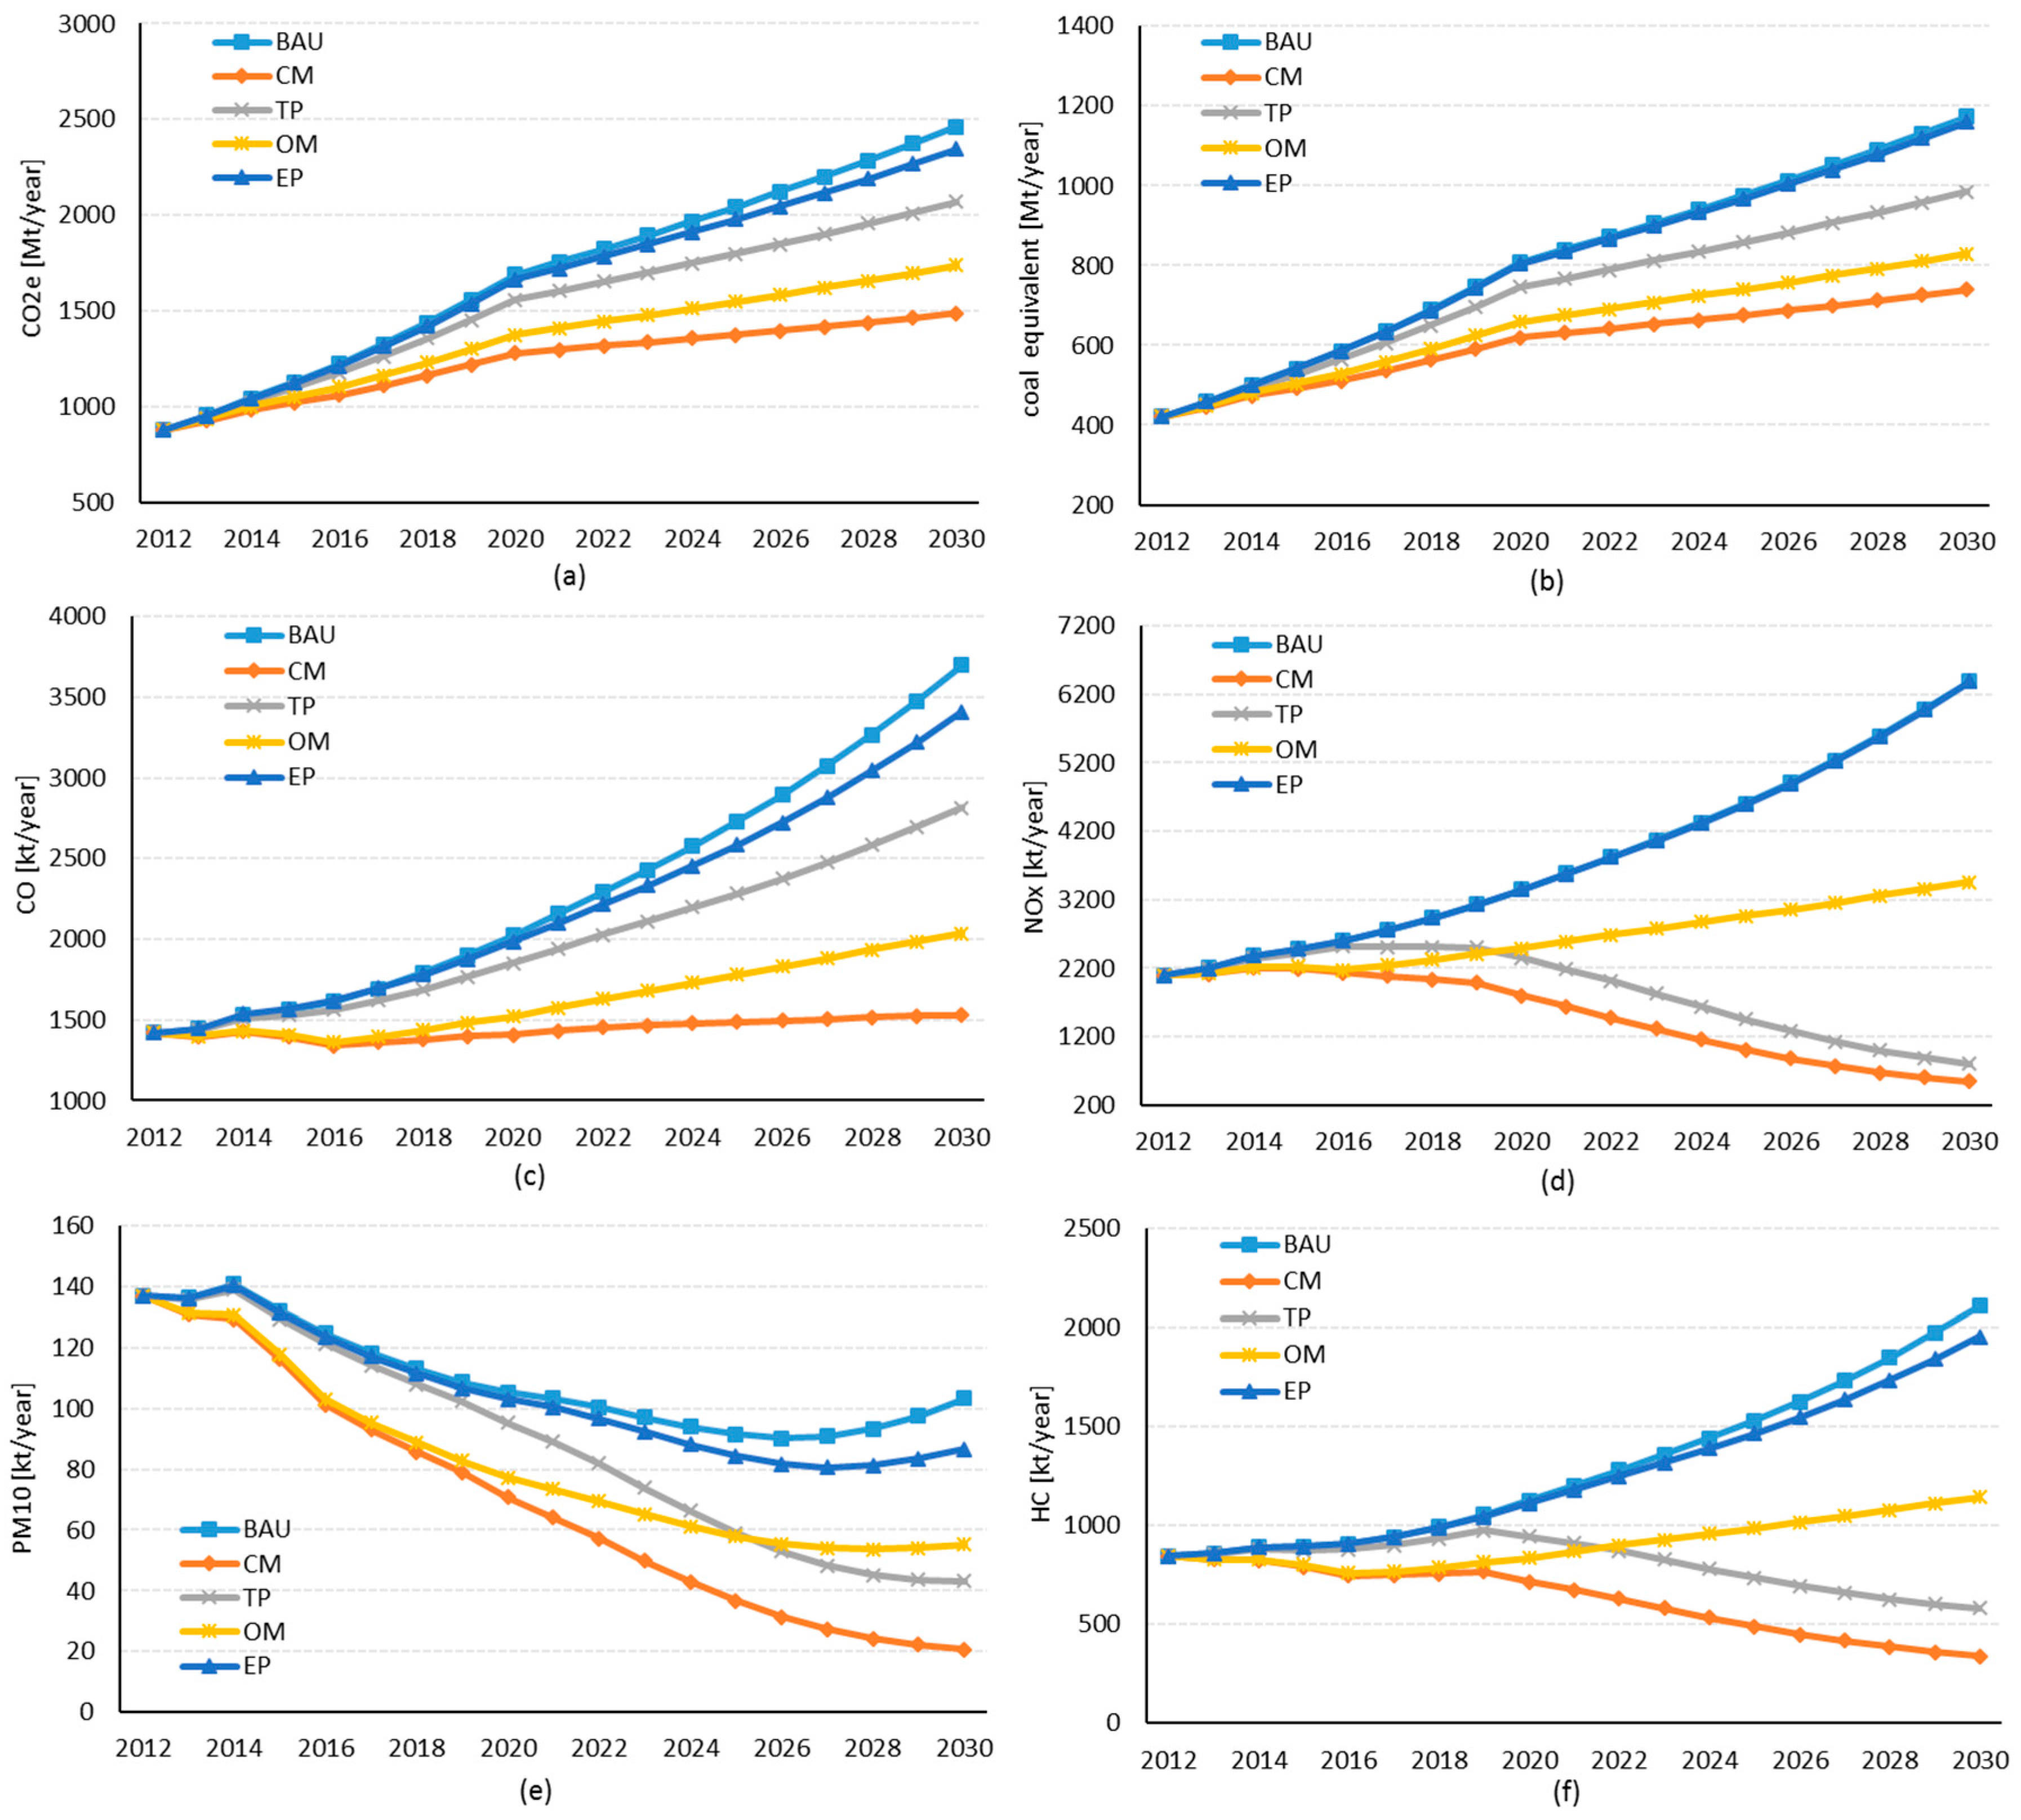
5.2.1. Energy Consumption, CO2 Emission and Pollutant Emissions

In the BAU scenario, both total energy consumption and CO2 emission of the Chinese road transportation industry show the same growth trends, continuing to grow linearly after 2012. Compared with the situation in the base year of 2012, total energy consumption and CO2 emissions will double in 2020 and increase twofold in 2030. 1.174 billion tons of standard coal and 2.463 billion tons of CO2 will be consumed or emitted in 2030. Both average annual growth rates are about 5.8%. As shown in Figure 3, the CM scenario shows the most significant energy-saving and emission mitigation effect, with the smoothest curves of energy consumption and CO2 emissions. CO2 emissions in 2030 will be 1.7 times that in the base year of 2012. CO2 emissions in 2030 in the CM scenario will be 976 million tons less than that in the BAU scenario. However, in the CM scenario, CO2 emission can be predicted to continue to increase after 2030 based on the historical trend. Considering the mitigation performances of these three sub-scenarios of the CM scenario, they are decreasing in the following order: the OM scenario, the TP scenario, and the EP scenario.
Figure 3c–f shows the emissions level of four air pollutants in different scenarios. In the BAU scenario, after the implementation of China-IV for heavy-duty vehicles in 2013, the growth rate of emissions of various pollutants will be suppressed around 2023. After the completion of the fleet upgrade, the mitigation potentials of China-IV will be exhausted and the emission growth rate will accelerate. In 2030, NOx, CO, and HC emissions will be about 3.3 times, 2.9 times, and 2.5 times those in 2012, respectively. Only the emissions of PM10 show a rapid decline and fall under the 2012 emission level by the end of this period. This is because its emission factor gap between China-IV and China-III is much larger than that between any of the others. From the emission factors produced by the China Vehicle Emission Control Center (VECC), the PM10 emission factor of light-duty vehicles will decrease by 40%, and those of medium- and heavy-duty will both decrease by 83.33%.
In the CM scenario, emissions of all these four air pollutants were suppressed to a greater extent. After the implementation of comprehensive policies and measures, various air pollutants show significant mitigation potentials. CO emissions remain almost unchanged, and the emissions of the other three pollutants show a more obvious declining trend. In the CM scenario, CO, NOx, PM10, and HC emissions in 2030 will respectively be 107.7%, 26.0%, 15.1%, and 40.1% of those in the base year of 2012. In 2030, CO, NOx, PM10, and HC emissions in CM scenario will be 41.4%, 8.5%, 20.1%, and 16.1% of those in the BAU scenario, respectively.
The three sub-scenarios show great diversity in various air pollutant emissions. TP measures have the greatest potential to cut down emissions from NOx, PM10, and HC. By carrying out stricter Auto Emission Standards, TP measures can decrease emissions by reducing their own emission factors. Auto Emission Standards China-V and China-VI will be implemented in 2017 and 2020, respectively. The emission factors of NOx, PM10, and HC will decrease dramatically according to Euro-V and Euro-VI. As a result, the emissions of NOx, PM10, and HC in the TP scenario will respectively be 5.59 million tons, 60,000 tons, and 152 tons less than that in the BAU scenario in 2030. However, there is no change in the CO emission factor in the following phases of the Auto Emission Standards. The most effective sub-scenario on the CO emission reduction is OM, rather than TP. OM measures control the CO emissions by improving the fuel efficiency and optimizing the fleet structure. CO emissions in the OM scenario will be 1.66 million tons less than that in the BAU scenario in 2030. In the EP scenario, the pollutant mitigation potential from 2012 to 2030 is limited, but its reduction effect will increase gradually after 2030, based on trend analysis.

5.2.2. Mitigation Contribution Analysis

In the CM scenario, various sub-scenarios show different mitigation performances, and these mitigation performances also vary significantly over time. To compare the mitigation performances of various sub-scenarios, we analyzed the contribution rates of different mitigation measures, namely, the proportions of emission reduction of each sub-scenario in the total emission reductions in the CM scenario. We considered three time nodes: 2015 (the end of the 12th 5-year plan), 2020 (the end of the 13th 5-year plan), and 2030 (the long-term plan). The contribution rates of the policies and measures of the three sub-scenarios to the emission reduction of CO2 and pollutants are shown in Table 4.
In 2015, the contribution rates of the OM sub-scenario to CO2 emission reduction and pollutant reduction are almost 70% and 80%, respectively, which are significantly higher than that in other sub-scenarios. In 2020, the contribution rate of the OM sub-scenario will decline, but the contribution rates in other sub-scenarios will increase. The contribution rate of the TP scenario will be higher than that of the OM sub-scenario in 2020 and reach 53.6%. In 2030, the contribution rate of the OM sub-scenario will further decrease, but the contribution rates of the OM sub-scenario to CO2 and CO mitigation will reach nearly 60%. The contribution rates of the TP sub-scenario to NOx, PM10, and HC mitigation will be higher and reach 65.5%, 48.1%, and 57.7%, respectively. The contribution rates of the EP sub-scenario will significantly increase.

5.3. Cumulative Reductions by Various Measures

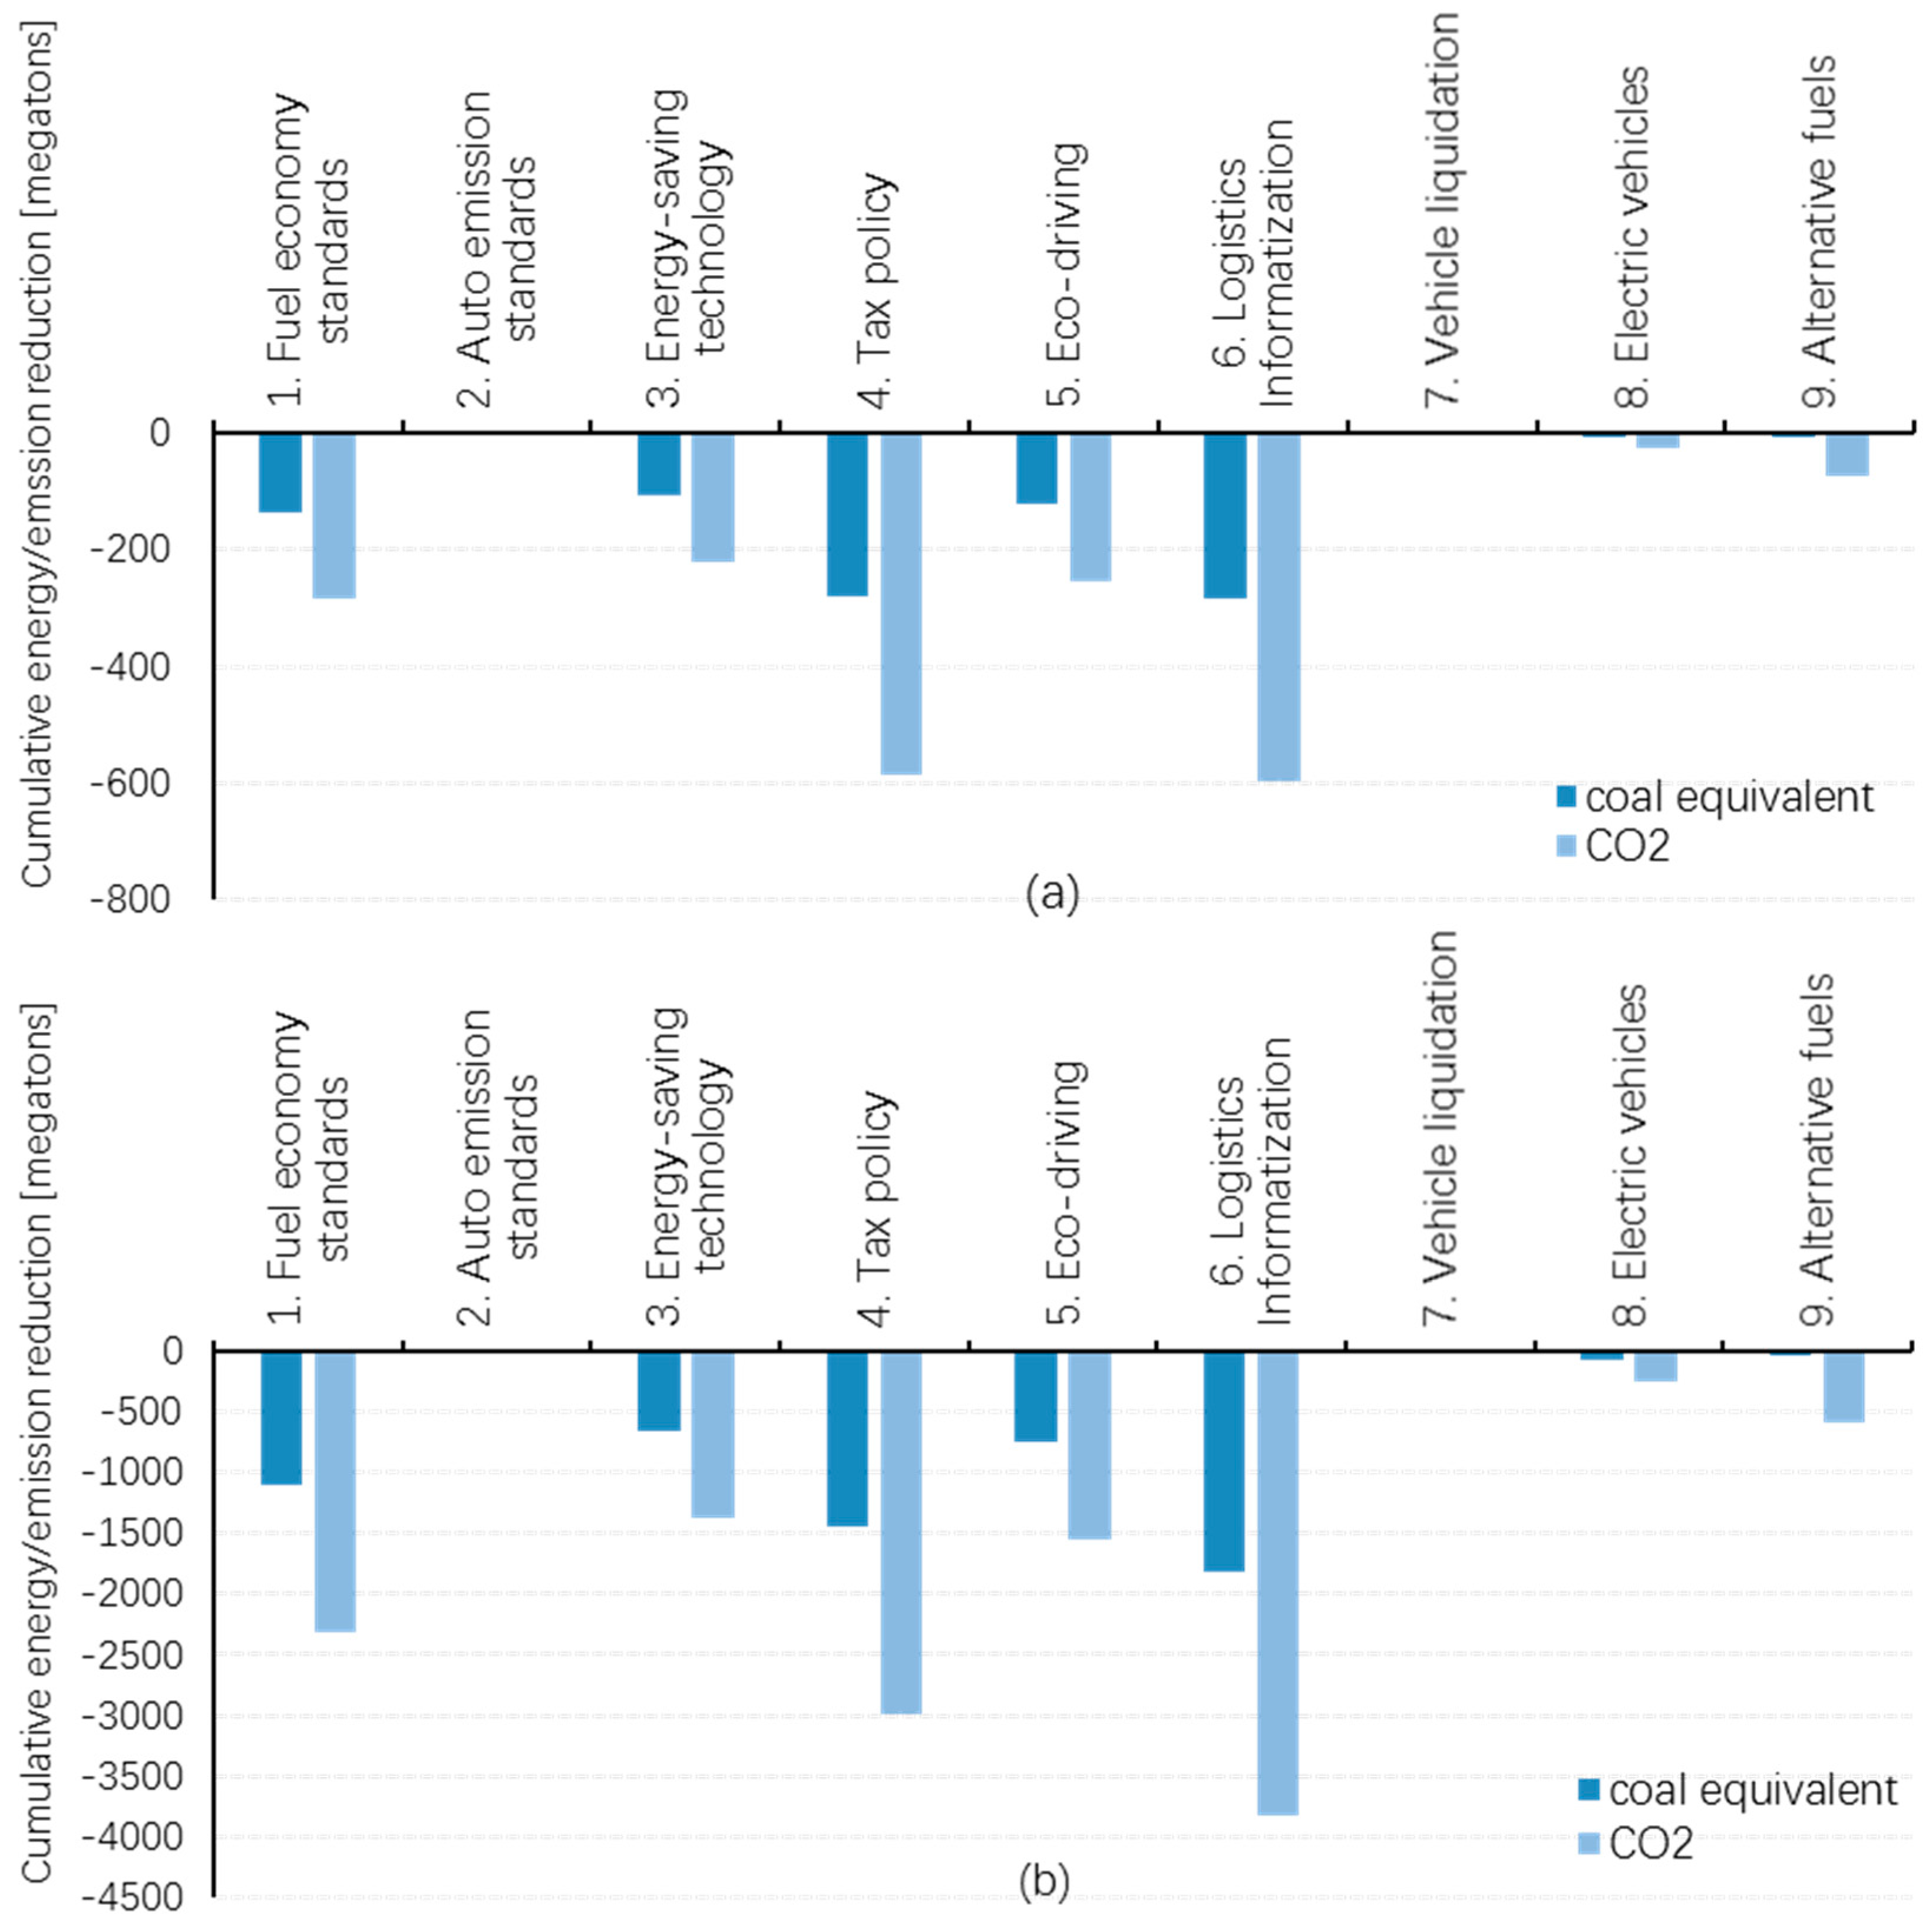
5.3.1. Cumulative Energy and CO2 Emission Reductions by Various Measures

In order to study the emission mitigation potential of specific measures, cumulative energy and emission reductions of the nine different measures for the short term (2012–2020) and the long term (2012–2030) were calculated as shown in Figure 4 and Figure 5. Logistics informatization is the most efficient measure to reduce energy consumption and CO2 emissions. In this manner, the Chinese road transportation industry saves a total of 1.80 billion tons of coal equivalent and will be able to reduce 3.83 billion tons of CO2 during these 18 years, which is the equivalent of about 4.3 times the overall energy consumption and overall carbon emission in the road transportation industry in 2012.
Both the effects of tax policy and fuel economy standards for energy saving and carbon reduction are remarkable. They are ranked as the second and third most efficient reduction methods. The implementation of tax policy and fuel economy standards saves 1.45 billion tons and 1.11 billion tons of coal equivalent, reducing 2.99 billion tons and 2.31 billion tons of CO2 emissions, respectively. The process by which fuel economy standards impact emissions will take several years due to vehicle life cycles. Thus, the effect of fuel economy standards is more significant in the long term. Eco-driving and energy-saving technologies play a role in energy saving and carbon reduction; they save energy consumption of 739 million tons and 649 million tons of coal equivalent, and reduce 1.55 billion tons and 1.367 billion tons of CO2 emissions, respectively.
The other measures have limited effects on energy saving and carbon reduction. In particular, auto emission standards have no effect on energy saving and carbon reduction. Since the main purpose of these measures is to reduce other air pollutant emissions in the road transportation industry, their energy saving potential is limited. Although electric vehicles have great potential to reduce carbon, their share in intercity vehicles is small and their carbon reduction effect is therefore also limited.

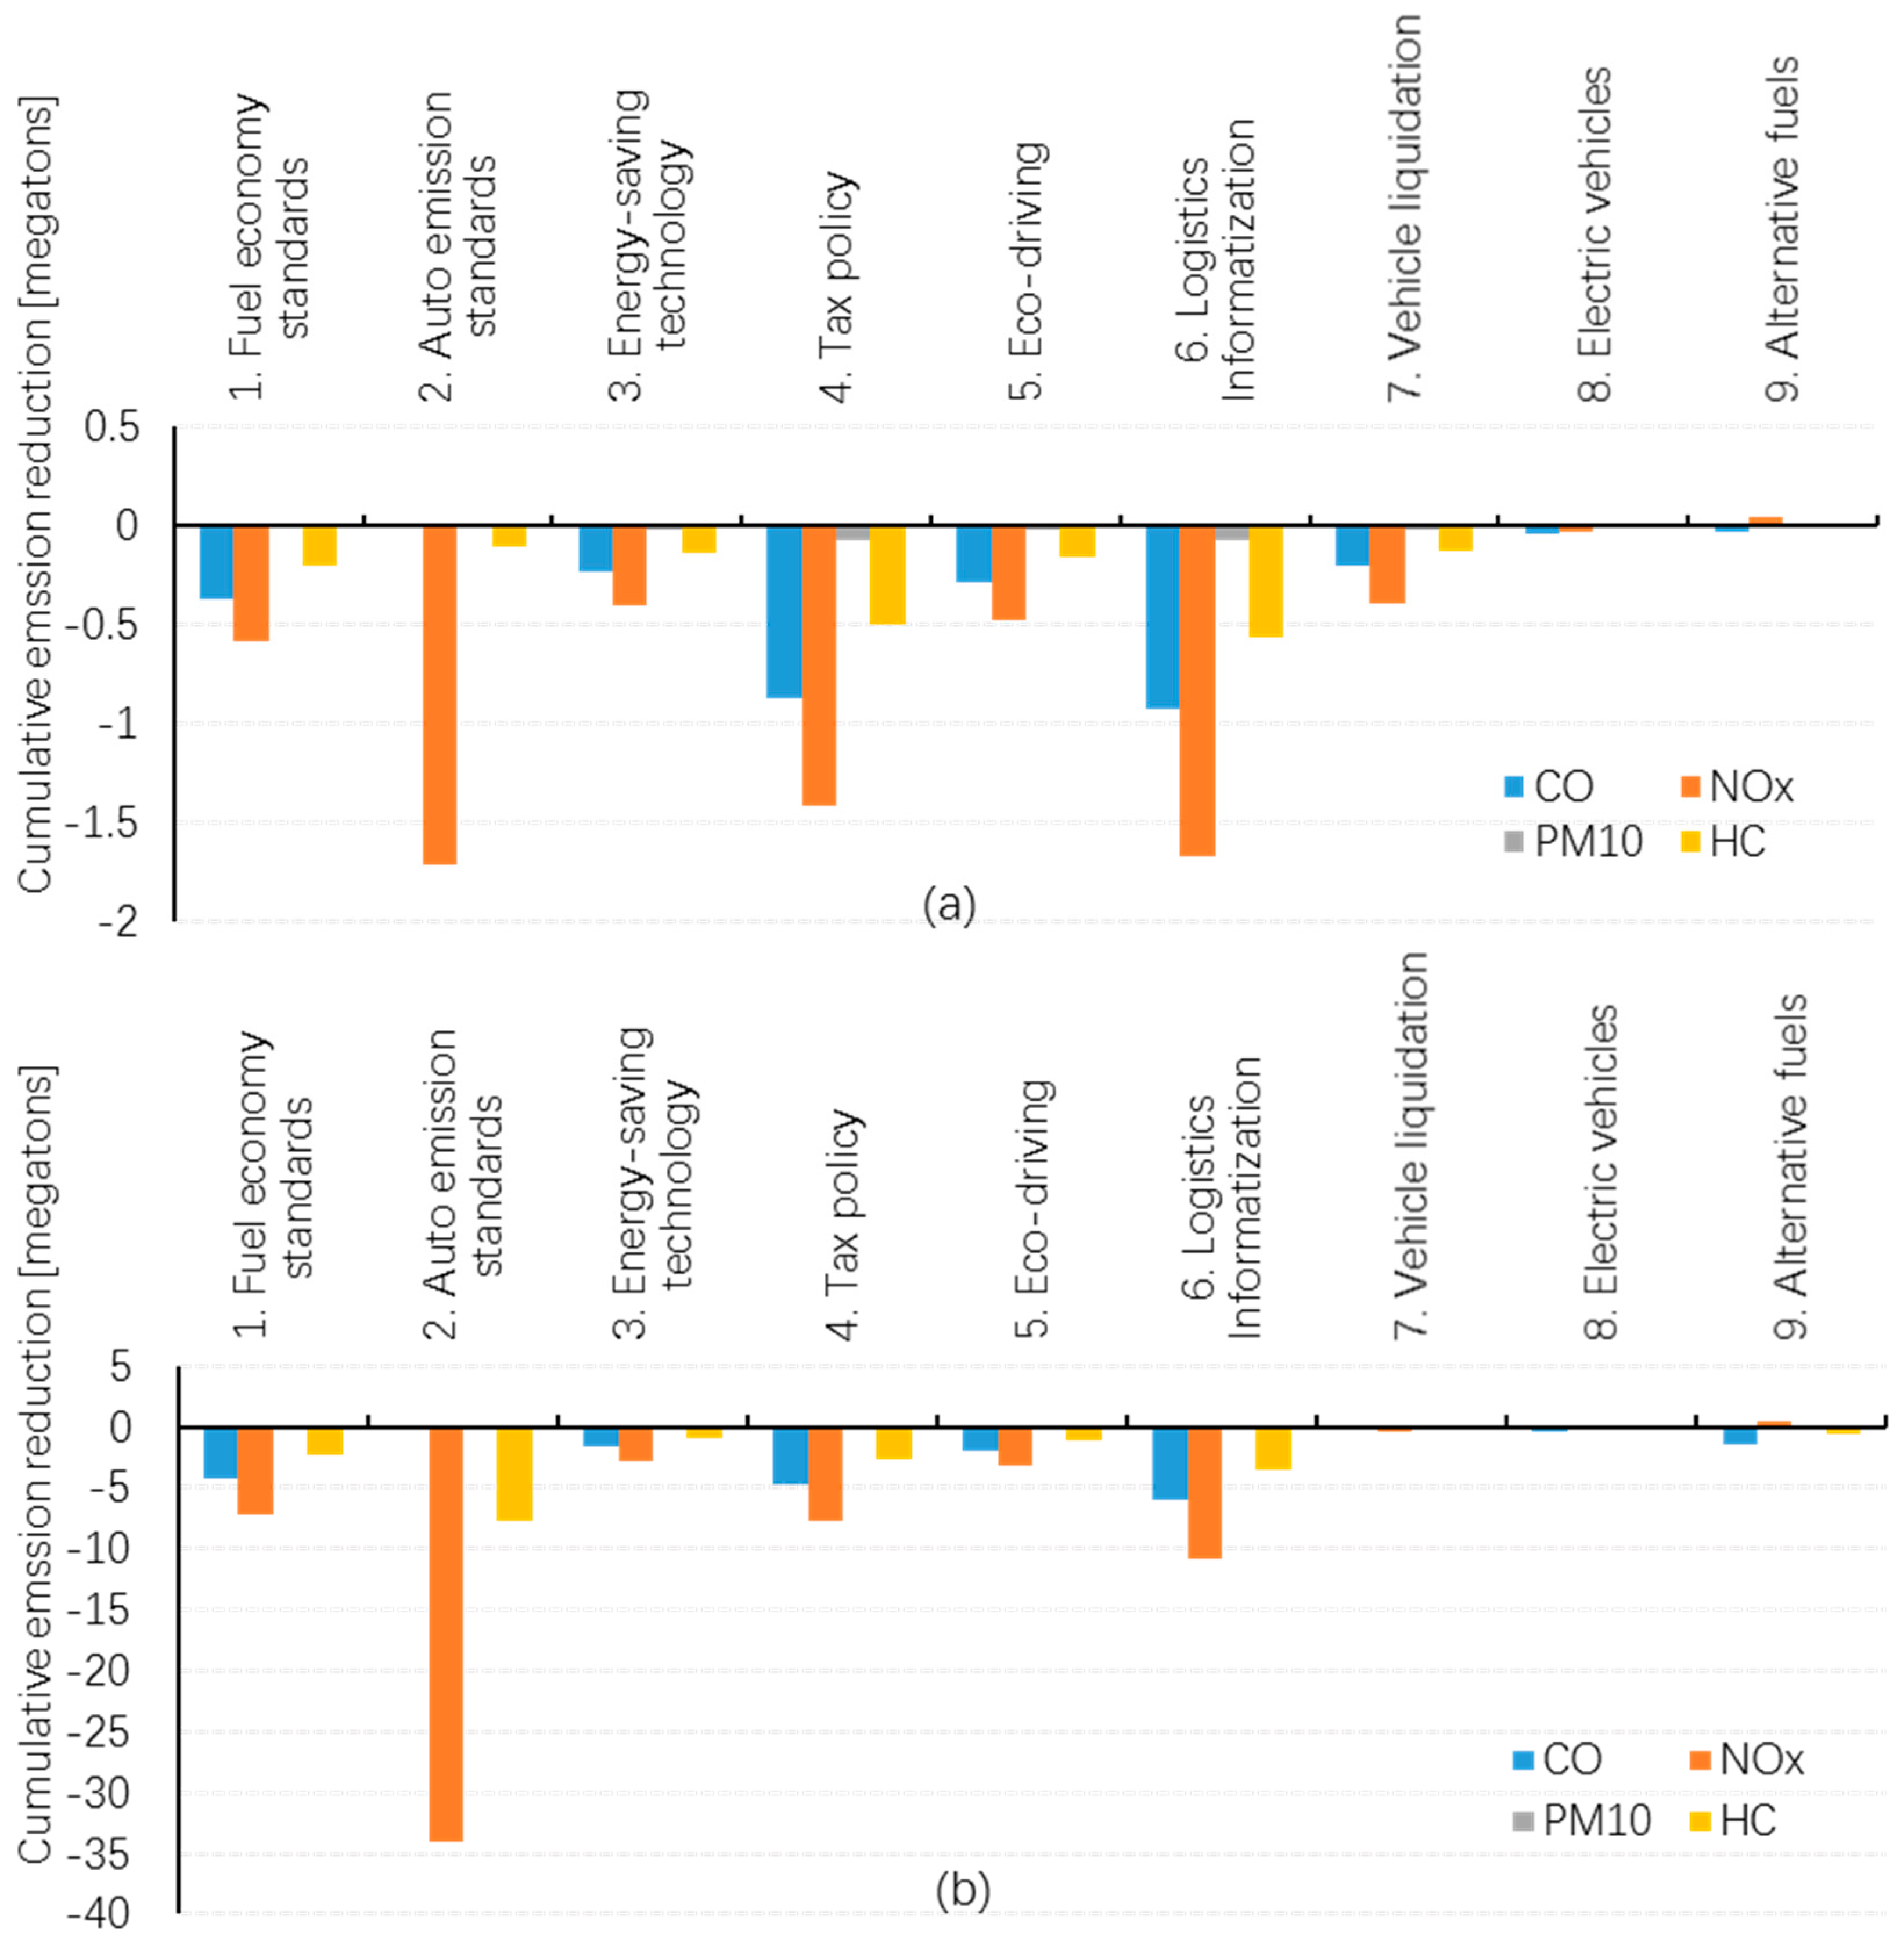
5.3.2. Cumulative Air Pollutant Emission Reductions by Various Measures

Cumulative emission reductions of four main vehicles air pollutants, namely CO, NOx, PM10, and HC, by various measures were also calculated in this paper. From 2012 to 2020, emission reduction effects of logistics informatization and tax policy measures are remarkable, whereas, in the long run (from 2012 to 2030), the emission mitigation potential of auto emission standards is greater. The emission reductions of all pollutants, except CO, led by emissions standards, are the highest. NOx, PM10, and HC are to decrease cumulatively by 33.96 million tons, 0.27 million tons, and 7.64 million tons, respectively. They are the equivalent to 15.8 times, 1.8 times, and 10.2 times the overall road transportation industry emissions in 2012, respectively. Because NOx, PM10, and HC factors have become more stringent after China-IV, the reduction effect is relatively significant. There is no effect on CO emission reduction because the CO emission factor limit remains unchanged after China-IV.
Logistics informatization, tax policy, and fuel economy standards have significant effects on pollutant reductions and are considered the second to fourth most efficient reduction methods, respectively. In the short term, logistics modernization and tax systems are the most significant measures for all pollutant reduction; in the long term, CO emission reduction by logistics informatization is the highest of all measures; there is a total reduction of 5.96 million tons of carbon monoxide, equivalent to 4.2 times of the overall industry emissions in 2012. Eco-driving, energy-saving technologies, and alternative fuel measures play a role in the overall reduction of pollutant emissions. It should be noted that NOx emissions increase in alternative fuel scenarios because the NOx emission factor of natural gas is higher than that of diesel.
Vehicle liquidation and electric vehicle measures show different mitigation trends. The short-term performance of vehicle liquidation is notable, while the long-term effect is limited. However, the emission reduction effect of electric vehicles will gradually reveal itself over time. The former one can be used to alleviate short-term environmental problems, and the latter one should be given more attention as one of the most potentially useful measures in the future.

6. Conclusions and Recommendations

The primary goal of this study was to shed light upon the emissions of the Chinese road transportation industry and how emissions may change under various mitigation measures. In 2012, the Chinese road transportation industry produced 881 Mt CO2e, accounting for 8.9% of the total annual emission, which increased by 78% from 2008. Through collecting and reorganizing of Chinese road transportation policies, emissions levels in several scenarios from 2012 to 2030 were calculated in detail using the LEAP model. We can see that the CO2 emission of the Chinese road transportation industry will continue to increase rapidly to meet rigid traffic demands in the near future. Even in the CM scenario, its emission cannot reach the peak before 2030, meaning that other industries should undertake more responsibility for carbon emission reductions in order to meet the national targets. For instance, the CO2 emissions of the industrial sector need to peak earlier to offset transport emissions. It would be helpful for the government to divide the reduction targets amongst different economy sectors.
Although the growth tendency cannot be reversed before 2030, the successful implication of several mitigation measures can slow the growth trend. Moreover, the emission reduction potential is significant. In the CM scenario, 8629 Mt CO2e can be reduced from 2012 to 2030, which is almost equivalent to total Chinese CO2 emissions in 2012. From the simulation, OM measures are the most effective in reducing CO2 and CO emissions, and the TP measures are the most effective in reducing the other three air pollutants in the long term. Among these measures, Logistics Informatization and Auto Emission Standards show the greatest potential in reducing carbon emissions and air pollutant emissions in the road transportation sector, respectively.
This research can be used as a reference for planning and policy-making in China. To achieve mitigation potentials and promote the development of a more carbon-efficient road transportation industry in China, here are a few recommendations. (1) More attention should be paid to emission mitigation actions in freight transportation, as it is the most significant emitter in the Chinese road transportation industry. By carrying out logistics informatization to reduce the unloaded ratio and improve energy efficiency, its mitigation potential can be realized; (2) Stricter auto emission standards should be created and implemented to improve air quality. These are the most effective methods for controlling air pollutant emissions; (3) Vehicle liquidation can be used in the urban transportation subsector as soon as possible to mitigate urban air pollution because of its rapid effect; (4) The research and development of electric vehicles and alternative fuels should be strengthened, as these measures will provide the impetus for the long-term low-carbon development of the road transportation industry after 2030; (5) A unified statistical system of road transportation energy consumption and emissions should be built. The more complete the data is, the more accurately the LEAP model can simulate and predict trends; therefore it will be easier for the government to find and monitor high CO2-emission departments and compare them to global levels.
In this study, only the road transportation industry was systematically studied with the exclusion of private passenger vehicles. More data on private passenger transport and innovative comparisons between different countries could be added to enrich the evaluation scheme in subsequent research. The costs and benefits, the feasibility, and the difficulties of each sub-scenario can be comprehensively assessed.

Acknowledgments

This study was supported by Soft Science Project Foundation of Ministry of Transport of PRC named “The Strategy Study of Energy Saving and Emission Reduction on Road Transportation Industry (2013-312-822-370)”, Fundamental Research Funds for the Central Universities named “Fundamental Research on New Energy Transportation System Planning (1600144506)” and Program for New Century Excellent Talents in University (NCET-11-0383). Special thanks is given to the Ministry of Transport of PRC for help in data collection. The authors are responsible for all viewpoints, conclusions, and errors.

Author Contributions

Ye Li proposed the research direction of this manuscript. Lei Bao analyzed the data, established the model, and wrote the main part of the manuscript. Li Wenxiang set scenario parameters. Haopeng Deng collected part of the statistical data.

Conflicts of Interest

The authors declare no conflict of interest.

Abbreviations

The following abbreviations are used in this manuscript:
GHGgreenhouse gas
CO2carbon dioxide
COcarbon monoxide
NOxnitrogen oxide
PM10particulate matter
HChydrocarbon
BAUbusiness-as-usual
CMcomprehensive mitigation
OMorganizational-management
TPtechnological-progress
EPenergetic-structure promotion
VKTvehicle kilometers traveled

References

  1. Olivier, J.; Janssens-Maenhout, G.; Middelburg, M. Trends in Global CO2 Emissions: 2013 Report; PBL Netherlands Environmental Assessment Agency: The Hague, The Netherlands, 2013. [Google Scholar]
  2. Liu, Z. China’s Carbon Emissions Report 2015; Harvard Kennedy School: Cambridge, UK, 2015. [Google Scholar]
  3. The OECD-ITF Joint Transport Research Committee. In Transport Greenhouse Gas Emissions: Country Data 2010, Proceedings of the International Transport Forum, Leipzig, Germany, 25–27 May 2010; ITF: Pairs, France, 2010.
  4. Wang, C.; Cai, W.; Lu, X.; Chen, J. CO2 mitigation scenarios in China’s road transport sector. Energy Convers. Manag. 2007, 48, 2110–2118. [Google Scholar] [CrossRef]
  5. Cai, B.; Cao, D.; Liu, L.; Zhang, Z.; Zhou, Y. Study on Road Transportation CO2 Emission in China. China Energy 2011, 33, 26–30. [Google Scholar]
  6. Addressing Climate Change: Policies and Measures Databases, International Energy Agency. Available online: http://www.iea.org/policiesandmeasures/climatechange/ (accessed on 14 July 2015).
  7. Long, J. Evaluation Model and Optimization Method of Urban Passenger Transport System Based on Carbon Emission Target. Ph.D. Thesis, Huazhong University of Science & Technology, Wuhan, China, 2012. [Google Scholar]
  8. Peng, C. Analysis on Comprehensive Evaluation and Development Approaches of Urban Low-Carbon Traffic. Ph.D. Thesis, Beijing Jiaotong University, Beijing, China, 2013. [Google Scholar]
  9. Cao, S.; Mao, S.; Liu, S.; Sun, Q. Calculation and Analysis of Transportation Energy Consumption Level in China. J. Transp. Syst. Eng. Inf. Technol. 2010, 10, 22–27. [Google Scholar]
  10. Intergovernmental Panel on Climate Change. 2006 IPCC Guidelines for National Greenhouse Gas Inventories. 2006. Available online: http://www.ipcc-nggip.iges.or.jp/public/2006gl/ (accessed on 13 June 2015).
  11. Ntziachristos, L.; Gkatzoflias, D.; Kouridis, C.; Samaras, Z. COPERT: A European road transport emission inventory model. In Information Technologies in Environmental Engineering; Springer: Berlin/Heidelberg, Germany, 2009; pp. 491–504. [Google Scholar]
  12. Bellasio, R.; Bianconi, R.; Corda, G.; Cucca, P. Emission inventory for the road transport sector in Sardinia (Italy). Atmos. Environ. 2007, 41, 677–691. [Google Scholar] [CrossRef]
  13. Van der Gon, H.D.; Hulskotte, J.H.J.; Visschedijk, A.J.H.; Schaap, M. A revised estimate of copper emissions from road transport in UNECE-Europe and its impact on predicted copper concentrations. Atmos. Environ. 2007, 41, 8697–8710. [Google Scholar] [CrossRef]
  14. Singh, A.; Gangopadhyay, S.; Nanda, P.K.; Bhattacharya, S.; Sharma, C.; Bhan, C. Trends of greenhouse gas emissions from the road transport sector in India. Sci. Total Environ. 2008, 390, 124–131. [Google Scholar] [CrossRef] [PubMed]
  15. Li, Y.; Bao, L.; Bao, J. Evaluating Emission Mitigation Potential of Shanghai Transportation Policies Using Long-Range Energy Alternatives Planning System Model. In Proceedings of the 93th Transportation Research Board, Washington, DC, USA, 12–16 January 2014.
  16. Tsinghua University; Vehicle Emission Control Center of Ministry of Environmental Protection. In Technical Guidelines for Preparing Road Motor Vehicle Emission Inventories (Trial); The Ministry of Environmental Protection: Beijing, China, 2015. (In Chinese)
  17. Graham-Rowe, E.; Skippon, S.; Gardner, B.; Abraham, C. Can we reduce car use and, if so, how? A review of available evidence. Transp. Res. Part A 2011, 45, 401–418. [Google Scholar] [CrossRef]
  18. Nakamura, K.; Hayashi, Y. Strategies and instruments for low-carbon urban transport: An international review on trends and effects. Transp. Policy 2013, 29, 264–274. [Google Scholar] [CrossRef]
  19. Liu, H.; Wang, Y.; Chen, X.; Han, S. Vehicle emission and near-road air quality modeling in Shanghai, China, based on taxi GPS data and MOVES revised emission inventory. Transp. Res. Rec. 2013, 2340, 38–48. [Google Scholar] [CrossRef]
  20. McPherson, M.; Karney, B. Long-term scenario alternatives and their implications: LEAP model application of Panama’s electricity sector. Energy Policy 2014, 68, 146–157. [Google Scholar] [CrossRef]
  21. Zhao, T.; Liu, Z.; Zhao, C. Research on the prospects of low-carbon economic development in China based on LEAP model. Energy Procedia 2011, 5, 695–699. [Google Scholar]
  22. Hong, S.; Chung, Y.; Kim, J.; Chun, D. Analysis on the level of contribution to the national greenhouse gas reduction target in Korean transportation sector using LEAP model. Renew. Sustain. Energy Rev. 2016, 60, 549–559. [Google Scholar] [CrossRef]
  23. Azam, M.; Othman, J.; Begum, R.A.; Abdullah, S.M.S.; Nor, N.G.M. Energy consumption and emission projection for the road transport sector in Malaysia: An application of the LEAP model. Environ. Dev. Sustain. 2016, 18, 1027–1047. [Google Scholar] [CrossRef]
  24. Chavez-Baeza, C.; Sheinbaum-Pardo, C. Sustainable passenger road transport scenarios to reduce fuel consumption, air pollutants and GHG (greenhouse gas) emissions in the Mexico City Metropolitan Area. Energy 2014, 66, 624–634. [Google Scholar] [CrossRef]
  25. Sadri, A.; Ardehali, M.M.; Amirnekooei, K. General Procedure for Long-term Energy-Environmental Planning for Transportation Sector of Developing Countries with Limited Data based on LEAP (long-range energy alternative planning) and EnergyPLAN. Energy 2014, 77, 831–843. [Google Scholar] [CrossRef]
  26. Kejun, J.; Xiulian, H.; Xing, Z.; Qiang, L. China’s Low-carbon Scenarios and Roadmap for 2050. Sino-Glob. Energy. 2009, 6, 21–26. [Google Scholar]
  27. Zhang, Y. Policy Choice for Urban Low-carbon transportation in Beijing: Scenario Analysis Based on LEAP model. In Proceedings of the EGU General Assembly Conference, Vienna, Austria, 17–22 April 2016.
  28. Zhan, J.; Liu, Y.; He, L.; Li, W. LEAP Based Research of Transport Carbon Emission in Foshan City. Energy Conserv. Environ. Prot. Transp. 2015, 3, 22–27. [Google Scholar]
  29. Yan, X.; Crookes, R.J. Energy Demand and Emissions from Road Transportation Vehicles in China. Prog. Energy Combust. Sci. 2010, 36, 651–676. [Google Scholar] [CrossRef]
  30. Schipper, L.; Marie-Lilliu, C. Transportation and CO2 Emissions: Flexing the Link—A Path for the World Bank; The World Bank: Washington, DC, USA, 1999. [Google Scholar]
  31. Schipper, L.; Leather, J.; Fabian, H. Transport and Carbon Dioxide Emissions: Forecasts, Options Analysis, and Evaluation; Asian Development Bank: Manila, Philippines, 2009. [Google Scholar]
  32. Ministry of Transport of China. Guiding Opinions on Low-carbon Transport System Construction; Ministry of Transport of China: Beijing, China, 2011. (In Chinese)
  33. Ministry of Transport of China. Comprehensive Working Program for Low-Carbon Transport System Pilot; Ministry of Transport of China: Beijing, China, 2011. (In Chinese) [Google Scholar]
  34. Global Fuel Economy Initiative. Global Fuel Economy Initiative-Plan of Action 2012–2015; GFEI: London, UK, 2012. [Google Scholar]
  35. Zhang, S.; Wu, Y.; Wu, X.; Li, M.; Ge, Y.; Liang, B.; Xu, Y.; Zhou, Y.; Liu, H.; Fu, L.; et al. Historic and future trends of vehicle emissions in Beijing, 1998–2020: A policy assessment for the most stringent vehicle emission control program in China. Atmos. Environ. 2014, 89, 216–229. [Google Scholar] [CrossRef]
  36. Cooper, C.; Kamakaté, F.; Reinhart, T.; Kromer, M.; Wilson, R. Reducing Heavy-Duty Long Haul Combination Truck Fuel Consumption and CO2 Emissions; NESCCAF: Boston, USA, 2009. [Google Scholar]
  37. Bongardt, D.; Creutzig, F.; Hüging, H.; Sakamoto, K.; Bakker, S.; Gota, S.; Böhler-Baedeker, S. Low-Carbon land Transport: Policy Handbook; Routledge: London, UK, 2013. [Google Scholar]
  38. Burniaux, J.M.; Chateau, J. Mitigation Potential of Removing Fossil Fuel Subsidies: A General Equilibrium Assessment; OECD: Paris, France, 2011. [Google Scholar]
  39. Yan, P.; Su, S.; Sophie, P. Integrated Design Report for Green Freight China Program; CAI-Asia: Pasig, Philippines, 2011. (In Chinese) [Google Scholar]
  40. Ministry of Transport of China. Comments on the Implementing Opinions on Accelerating the Promotion and Application of New Energy Vehicles (Draft for Comment); Ministry of Transport of China: Beijing, China, 2014. (In Chinese)
  41. Sivak, M.; Schoettle, B. Eco-driving: Strategic, tactical, and operational decisions of the driver that influence vehicle fuel economy. Transp. Policy 2012, 22, 96–99. [Google Scholar] [CrossRef]
  42. Ministry of Transport of China. The Environmental Protection Ministry of China Outline of the National Road and Water Transportation Program for Long- and Medium-Term Energy Conservation; Ministry of Transport of China: Beijing, China, 2008. (In Chinese)
  43. The State Council of the People’s Republic of China. 2014–2015 Action Plan for Energy Conservation, Emission Reduction and Low-Carbon Development; General Office of the State Council: Beijing, China, 2014. (In Chinese)
  44. The State Council of the People’s Republic of China. Energy Saving and New Energy Automobile Industry Development Plan (2012–2020); General Office of the State Council: Beijing, China, 2012. (In Chinese)
  45. Deng, Z.; Fan, D. Status Analysis and Future Trend of China Alternative Energy. Mod. Manag. Sci. 2010, 9, 31–32. (In Chinese) [Google Scholar]
  46. National Bureau of Statistics. China Statistical Yearbook 2012; China Statistics Press: Beijing, China, 2013.
  47. Xiaoqian, J.; Weiquan, F.; Guiyang, Z. Greenhouse Gas Accounting Tool for Chinese Cities (Pilot Version 1.0); World Resources Institute: Beijing, China, 2013. (In Chinese) [Google Scholar]
  48. International Energy Agency (IEA). CO2 Emissions from Fuel Combustion Highlights 2015; IEA: Paris, France, 2015. [Google Scholar]
  49. Institute for Energy and Environmental Research Heidelberg. Transport in China: Energy Consumption and Emissions of Different Transport Modes; IFEU: Heidelberg, Germany, 2008. [Google Scholar]
Figure 1. The Long-range Energy Alternatives Planning System (LEAP) model framework.
Sustainability 08 01218 g001
Figure 2. Chinese road transportation fleet composition in 2012.
Sustainability 08 01218 g002
Figure 3. Energy consumption, greenhouse gas (GHG), and pollutant emissions of the Chinese road transportation industry in different scenarios from 2012 to 2030: (a) Energy consumption; (b) CO2; (c) CO; (d) NOx; (e) PM10; (f) HC.
Sustainability 08 01218 g003
Figure 4. Cumulative energy and CO2 emission reduction by various measures (a) from 2012 to 2020 and (b) from 2012 to 2030.
Sustainability 08 01218 g004
Figure 5. Cumulative air pollutant emission reductions by various measures (a) from 2012 to 2020 and (b) from 2012 to 2030.
Sustainability 08 01218 g005
Table 1. Sectoral structure and vehicle technology.
SectorsSubsectorsVehiclesFuels
Intracity VehiclesBusesGasoline busesGasoline
Ethanol-gasoline busesEthanol, gasoline
Diesel busesDiesel
LPG busesLPG
CNG busesCNG
Bi-fuel busesDiesel, CNG
Electric busesElectricity
Hybrid electric busesElectricity, diesel
TaxisGasoline carsGasoline
Ethanol-gasoline carsEthanol, gasoline
Diesel carsDiesel
LPG carsLPG
CNG carsCNG
Bi-fuel carsGasoline, CNG
Electric carsElectricity
Intercity VehiclesPassenger VehiclesLight-duty vehiclesGasoline
Heavy-duty coachesDiesel
Freight TrucksLight-duty trucksGasoline, diesel
Heavy-duty trucksDiesel
Container trucksDiesel
Note: LPG: liquefied petroleum gas; CNG: compressed natural gas.
Table 2. Parameter setting in different scenarios.
ScenariosParameter DescriptionsReference
BAUTransportation activity levels will remain in accordance with the historical growth trend until 2020, after which it will slow down gradually. Energy intensity will slightly decrease. In 2030, it will decrease by 20% compared with 2005 levels. No new emission standards will be released, and vehicle composition structure will remain stable.Chinese Low-Carbon Development Path by 2050 [26].
TPFuel Economy StandardsEnergy intensity of new vehicles was to be reduced by 5% in 2015 and to reduce by 18% in 2020 and 40% in 2030 compared with 2012 levels.The Guiding Opinions on Low-carbon Transport System Construction [32], the Comprehensive Working Program for Low-carbon Transport System Pilot Cities, and GFEI [34]
Auto Emission StandardsChina will implement China-V in 2017 and implement China-VI in 2020.European experiences, Euro V and Euro VI [35]
Energy-saving TechnologyThe proportion of freight trucks with energy-saving equipment will increase to 40% in 2020, and 80% in 2030. Their fuel economy will improve by 10% compared to uninstalled ones.Cooper et al. [36]
OMTax policyThe carbon tax policy was implemented in 2015. This caused a 1% decrease in cargo volume by trucks and a 1.5% growth of fuel economy within one year; in 2020, it will lead to a 3% reduction in VKT and a 4% improvement in fuel economy.Low-carbon land transport: policy handbook [36], and Buniaux [38]
Eco-drivingEco-driving training coverage in 2020 and 2030 will increase to 40% and 80%, respectively. Trained drivers will reduce fuel consumption by nearly 10%.Related experience of Europe and Japan [41]
Logistics InformatizationThe empty-loaded rate of freight trucks will decrease to 35% in 2020 and 20% in 2030; the turnover ratio of specialty vehicles will rise to 21% in 2020 and to 30% in 2030.Outline of the National Road and Water Transportation Program for Long- and Medium-Term Energy Conservation, international experience [39,42]
Vehicle LiquidationChina was to retire 46.15% of the yellow-label vehicles in the road transportation industry in 2014 and take enforcement measurements after 2014 to phase out all yellow-label vehicles in the road transportation industry.2014–2015 Action Plan for Energy Conservation, Emission Reduction and Low-Carbon Development [43]
EPElectric VehiclesThe proportion of newly increased new energy vehicles was to reach 5% in 2015 and is to reach 15% in 2020 and 40% in 2030. The ratio of PHEVs and BEVs was to be 3:2 in 2010, and will be 1:1 in 2030.Comments on the Implementing Opinions on Accelerating the Promotion and Application of New Energy Vehicles, Planning for the Development of the Energy-Saving and New Energy Automobile Industry (2012–2020) [44]
Alternative FuelsThe proportion of newly increased natural gas buses was to reach 20% in 2015, 30% in 2020, and 50% in 2030; the proportion of newly increased taxis was to reach 10% in 2015 and is to reach 20% in 2020 and 40% in 2030; the proportion of alternative fuel vehicles in freight trucks is to reach 10% by 2020 and 30% in 2030.Policy on Utilizing Natural Gases and international experience [45]
Table 3. Emission inventory of China road transportation in 2012 (kilotons).
SectorsSubsectorsVehiclesCO2CONOxPM10HC
Intracity VehiclesBusesGasoline buses1260.424.44.00.03.0
Ethanol-gasoline buses501.37.01.60.01.1
Diesel buses22,689.550.195.76.234.2
LPG buses680.730.64.80.03.9
CNG buses6194.656.354.70.013.5
Bi-fuel buses1356.510.011.60.03.3
Electric buses0.00.00.00.00.0
Hybrid electric buses333.30.51.00.00.3
Total33,016.3178.8173.46.259.3
TaxisGasoline cars19,203.434.011.10.04.3
Ethanol-gasoline cars6427.68.24.30.01.3
Diesel cars2173.04.05.80.52.0
LPG cars186.30.50.10.00.1
CNG cars1343.72.20.70.00.2
Bi-fuel cars10,737.916.612.60.04.5
Electric cars0.00.00.00.00.0
Total40,071.965.634.50.512.3
Intercity VehiclesPassenger VehiclesLight-duty vehicles14,166.354.28.40.08.6
Heavy-duty coaches32,789.7147.6284.515.594.2
Total46,956.0201.8292.815.5102.8
Freight TrucksLight-duty trucks162,117.9159.661.03.540.6
Heavy-duty trucks561,052.0787.71536.8118.6512.8
Container trucks37,296.726.651.94.017.3
Total760,466.6973.91649.7126.1570.6
Total880,510.81420.02150.4148.4745.0
Table 4. Mitigation contribution rates of each sub-scenario in the comprehensive mitigation scenario.
Sub-ScenariosMitigation Contribution Rates of Each Sub-Scenario in the Comprehensive Mitigation Scenario
201520202030
CO2 mitigation contribution rate
Sub-scenario 3: TP26.3%27.7%31.9%
Sub-scenario 4: OM68.5%66.5%58.6%
Sub-scenario 5: EP5.2%5.8%9.6%
CO mitigation contribution rate
Sub-scenario 3: TP18.1%24.1%31.2%
Sub-scenario 4: OM84.1%70.4%58.6%
Sub-scenario 5: EP−2.2%5.5%10.3%
NOx mitigation contribution rate
Sub-scenario 3: TP17.5%53.6%65.5%
Sub-scenario 4: OM82.4%46.2%34.4%
Sub-scenario 5: EP0.1%0.2%0.1%
PM10 mitigation contribution rate
Sub-scenario 3: TP14.5%24.8%48.1%
Sub-scenario 4: OM81.4%69.3%38.6%
Sub-scenario 5: EP4.1%5.8%13.4%
HC mitigation contribution rate
Sub-scenario 3: TP17.1%37.3%57.7%
Sub-scenario 4: OM82.6%59.7%36.5%
Sub-scenario 5: EP0.3%3.0%5.8%

