1. Introduction
Based on current economic growth rates, it has been estimated that demand for freshwater by 2030 will be 40% above current water supplies [
1]. At present, demand from manufacturing industry accounts for 22% of global freshwater withdrawal, and in most developed countries the water consumed by industry is already exceeding agricultural consumption [
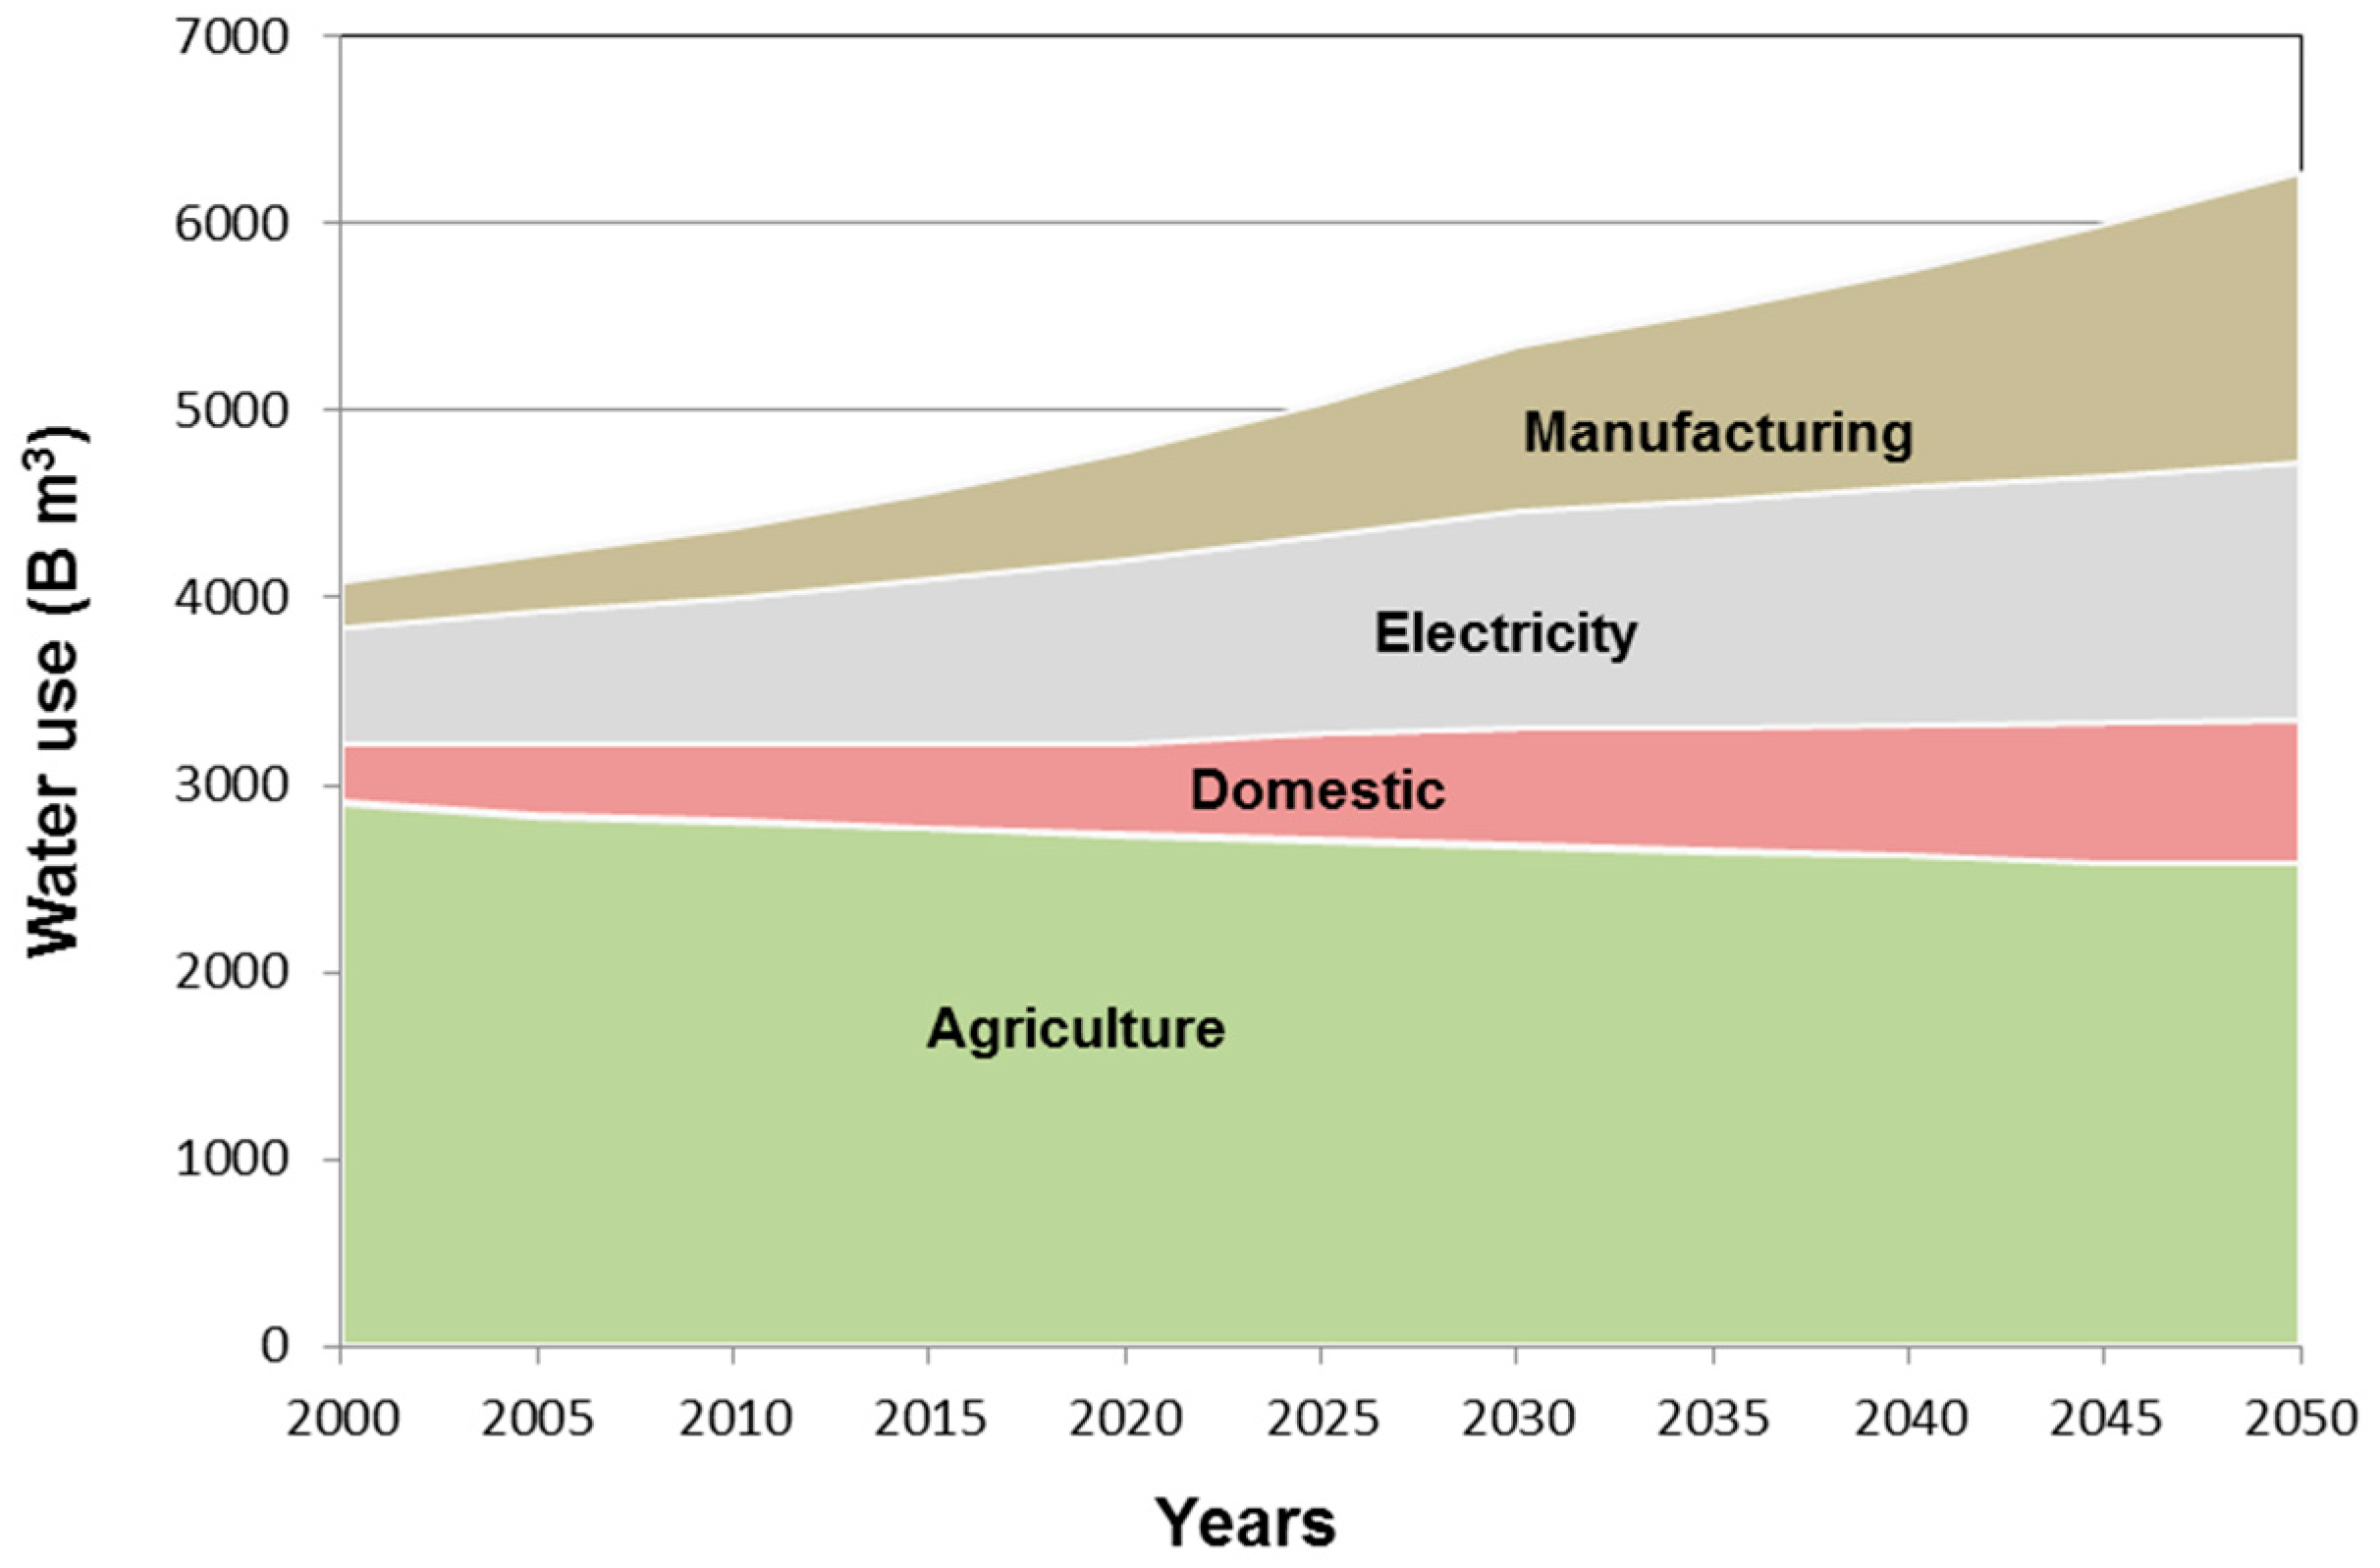
2]. With significant growth in manufacturing activities, particularly within developing countries, global manufacturing water consumption (see
Figure 1) is set to increase by a factor of more than 5 by 2050, over a year 2000 baseline, from 245 to 1552 billion m
3 [
3].
The pressure on freshwater availability for human use is exacerbated by the changing climate and increasing population, particularly where this results in a mismatch between water demand and availability on a local scale. Water is not easily transportable in large volumes, and, unlike energy, there are no viable large-scale new sources. For example, the energy cost of distillation of saline water is prohibitively high at 2–4 kWh per cubic meter [
4].
Disposal of wastewater is increasingly costly due to tightened quality standards. Legislation—such as the European directives on a common European water policy framework [
5] and on integrated pollution prevention and control [
6]—has forced many manufacturers to directly bear the cost of treating their factory water before discharge. Lack of public or private spare treatment capacity can also act as a restriction on business growth.
Against this background, water is now an important part of commercial sustainability strategies along with energy and materials. To date, less effort has been put into water management compared to energy management, but there is a growth in literature and armory of tools. Water reduction measures range from practicing good housekeeping, through carrying out water audits, to product and process redesign. These measures were classified by Puigjaner et al. [
7] into reactive (which they termed “Specific Actions”) and proactive (which they termed “General Methodologies”). Low risk, low cost, reactive measures involving little change to process or product are generally the first port of call for manufacturing companies seeking to improve their water profile. However, proactive measures involving more fundamental changes are essential for long-term gains (see, for example, Seneviratne [
8]). Because these are higher risk and more costly, analysis and decision support tools are required to target areas for intervention and management of the risk. In this article, a survey of current tools and techniques available to support water reduction programs is presented, and their usefulness with respect to the proactive approach discussed. It is argued that the tools surveyed do not provide insights into the operational requirements from an individual process step for water, instead taking such requirements as a given. As a first step to achieving insight, we propose a concept of water usage efficiency similar to that already used in energy analysis, which can be used to evaluate current and proposed processes and products. We also discuss the elements required to create a useable tool based on water usage efficiency measures.
2. Survey of Water Reduction Tools
Life cycle assessment (LCA) is the methodology for assessment of environmental impacts of products and practices. Berger and Finkbeiner [
9] pointed out that inclusion of the impacts on the environment from the use of water has long been neglected in LCA, probably because LCA has been primarily used to assess the impacts of industrial products, which are not very water intensive. In addition, the local nature of water impacts is not well-treated by LCA, in contrast to the global nature of energy and greenhouse gas emissions. However, there has been a recent upswing in interest [
10,
11,
12]. Yen [
13] and Fthenakis and Kim [
14] have considered water and its use as an indicator to assess the environmental impacts of products and production systems.
Only a limited number of studies have considered water impacts in the manufacturing stage of product lifecycles [
15]. Where water has been considered, machining processes are a popular target (see, for example, the study by Ogaldez et al. [
15]), possibly because they underpin a wide range of industries and products. Instead, other studies concentrate on water impacts on the production of intermediate products and processes. For example, the study by Tejada et al. [
11] identifies the use phase of a car to be the thirstiest, due to the water required for fuel production. Recent studies looking at the life cycle impact on the environment from the perspective of water only provide the impacts that are the consequence of resource depletion, and do not provide assessment of emissions to water affecting the natural ecosystem.
Research by Bayart et al. [
16] recommends reviewing water in the LCA phases of life cycle inventory analysis (LCI) and life cycle impact assessment (LCIA) separately. Owens [
17] concluded that LCI water indicators should not be based on volumes, but on other sustainability factors, such as quality/source of intake water and quality/discharge of wastewater. A more recent study, by Milà I Canals et al. [
18], identifies an important omission of considering evaporation in the LCI database and suggests distinguishing between “consumptive” and “evaporative” water use, especially in production systems. Milà I Canals [
19] further investigated including the concept of virtual water associated with the supply chain [
20] in LCI studies.
The results of the LCIA phase have a strong influence on decisions affecting the environment. Owens [
17] suggested that water impact indicators capturing effects of availability, distribution and regional variations, and quality (i.e., wastewater discharge, emissions to water affecting human health ecosystems) are essential but are not adequately developed in current methodologies. A practical method of accounting for the effect of local availability of water in LCIA was suggested by Lévová and Hauschild [
21] in the form of a regional characterization factor.
As a response to the limitations in LCA the water footprint method, Hoekstra et al. [
22] was developed to evaluate the total volume of freshwater consumption associated with an individual process or product. The underlying framework distinguishes between the direct water used in the actual processing of a product (e.g., irrigation, production processes) and indirect water used in the supply chain (e.g., transport, energy generation).
Total footprints are composed of estimates for blue water (used from freshwater sources), green water (rain or soil water taken up by plants), and grey water (water required to dilute wastewater to be fit for discharge). Footprinting is used for (1) individual products, such as cars, beer, and shirts; (2) for commodities, such as wheat, cotton and biofuels; and (3) for whole countries and regions. Waterstat [
23], a global water database from the Water Footprint Network (WFN), provides a list of water footprints of various products and commodities. Most activity in water footprinting is focused on agriculture-based products, for which the blue water and green water footprints can be determined from evapotranspiration rates, available through the Food and Agriculture Organization CLIMWAT database [
24].
The WFN list provides little data on specific processes, and Hoekstra et al. [
25] point out that databases that cover the consumptive use of water by process hardly exist, and that the best sources are the manufacturers themselves. Ogaldez et al. [
15] proposed expanding the water footprint method to include consumptive water as a separate component to include with the green, blue, and grey water footprints, specifically for machining operations. Another proposal by Hoekstra et al. [
25] covers extension of the method to cover reuse and recycling water.
The regional nature of water resources is addressed by strategic tools that assess business risks from water availability data of individual watersheds. The WaterGAP (Water—Global Assessment and Prognosis) model and associated tool developed by the European Environmental Agency (EEA) estimates the future water availability and water stress in various watersheds upon which many sectors, including manufacturing, rely [
26]. The model is currently developed in the context of Europe and is evaluated for a baseline scenario, where the current trends of water use continues, and a climate policy scenario that implements more strict and drastic policies to limit greenhouse gas emissions.
The spreadsheet-based Global Water Tool (GWT), developed by the World Business Council for a Sustainable World [
27], maps water use and wastewater discharges of industries in relation to their global operations and supply chains. This mapping and comparison of site-specific water data, sanitation, population, and biodiversity enables an organization to identify the sites that are at higher risk of water scarcity, to evaluate the percentage of production output from such high-risk sites, to understand the sanitation and well-being of employees working in such regions, and to predict the number of sites that will be in water-scarce regions in the future. The indicators are calculated by the tool from water inventory data.
The Global Environmental Management Initiative (GEMI) is a global organization developing sustainability tools, solutions, and green practices for various businesses. The online water sustainability tool “Connecting the Drops—Towards Creative Water Strategies” [
28], developed by GEMI, provides analytical guidance that enables a business to understand water uses and the impacts on water sources in the entire value chain. This facilitates the assessment of business risks and opportunities and implementation of water strategies. Case studies sourced from the GEMI membership are used as a database that provides information on how to manage water risks and opportunities.
CERES Aqua Gauge [
29] is another water risk assessment tool used by potential investors to investigate a company’s view on water risks. The tool comprises Excel spreadsheets that allow investors to record scores of a company’s management of water risks against leading practices in other companies. The scores are given based on the measurement of, management of, stakeholder engagement with, and disclosure of, the associated water risks. The output from the Aqua Gauge provides a holistic view of a company’s water management approach in the form of a spider diagram.
Water auditing and monitoring tools provide simple and cost-effective ways to mitigate water inefficiencies by recording and quantifying the water usage of a manufacturing facility [
30]. The United Kingdom’s Waste and Resource Action Programme (WRAP) has developed a water guidance program, Rippleffect [
31], that provides step-by-step guidance to help businesses save money by using water more efficiently. The program includes a suite of tools to track water usage (Water Consumption Monitoring Tool) and water costs of a business (True Cost Tool, Mogden Formula Tool), supporting documents that provide guidance on measures for water and cost reduction, and a knowledge base of industrial case studies from which businesses can learn. The modules in the Rippleffect program begin by providing assistance in collecting water data to monitor water usage at the facility. The Water Consumption Monitoring Tool is a Microsoft Excel spreadsheet that is used to record water usage data from up to five water meters. The data is then presented in tables and graphs that assist in visualizing the pattern of water usage and detect any leaks. Meters additional to the main supply meter can be retrofitted at locations to monitor specific sites in a facility; for example, production sites, cooling towers, vehicle washing, washrooms, and urinals. In addition to the overall water usage, water balance diagrams track the water uses in a facility by balancing water inputs and outputs. The True Cost of Water tool is an Excel spreadsheet that provides an indication of the costs of water supply and water pretreatment charges. This helps in assessing the true cost of water, and identifying the areas of improvement that bring greatest savings in cost. The Mogden Formula Tool additionally calculates and reports the cost savings that could be achieved by reducing the volume of trade effluent and contaminant concentration in effluent streams.
There has been an increase in interest in the use of smart water metering to plan and manage water [
32,
33]. Until recently, the use of such smart water meters was limited to water suppliers measuring domestic water usage in households. Due to the growth in interest in water efficiency in industry, several commercially available web-based applications are now available to help businesses to efficiently manage their water usage. The real-time monitoring and logging of water with the help of automated meter reading (AMR) technologies makes use of a water data logger and transfer system to remotely transfer the data via internet, mobile, or radio. The data is analyzed and the results regarding leak detection and water-saving potential are communicated back.
Process integration is engineering of an industrial system to make use of energy, water, and raw materials more efficient. It involves ways of combining inputs to and outputs from individual unit processes, but not changes to the processes themselves. Examples are use of heat exchangers to recover heat form the output of one unit process and using it as the input to another or, similarly, reuse of output water streams.
Pinch analysis refers to the establishment of the theoretical minimum consumption that can be achieved by process integration. Water pinch analysis (WPA) was developed by Wang and Smith [
34] by considering water inputs and outputs to and from unit processes as mass transfer fluxes of contaminants, to establish the minimum theoretical freshwater input required for a process chain. This method was further developed to incorporate water reuse/recycle opportunities [
35] and graphically determine the minimum freshwater requirement [
36]. Manan et al. [
37] devised a “water cascade” analysis to determine the freshwater target for continuous water-using processes, and Almatò et al. [
38] proposed a methodology to reduce freshwater consumption in batch process industries by introducing storage tanks for water reuse in time-dependent processes. Subsequently, treatment of production planning, mathematical modeling, and costing was also demonstrated [
39].
Various software packages to support process integration using WPA have been produced, for example, Water Design developed by Virginia Polytechnic Institute and State University [
40]. This is a PC-based software tool for designing water networks, using input data regarding water volume and contaminant load. The output is a water block diagram that shows the water inlet and outlet for individual processes in order to graphically determine the minimum freshwater target.
WaterTarget by KBC [
41] is another WPA-based package, consisting of a suite of software tools for water reduction and reuse. The WaterTracker component is stand-alone software that is used to construct the water balance by establishing the water volume flow and contaminant concentration for all the processes in a site. The WaterPinch tool is a second stand-alone component that optimizes the water networks by determining the most efficient water reuse and treatment strategies. Another feature in WaterPinch is the assessment of operating costs associated with water purchase, treatment, pumping, and discharges to conduct a sensitivity analysis.
UMIST WATER [
42], developed by the University of Manchester for process industries, supports:
Minimizing freshwater consumption through maximum water reuse,
Minimizing wastewater generation through automatic design of water reuse networks,
Optimizing freshwater sources when multiple freshwater sources are available,
Identifying opportunities for regeneration of water through automatic design of effluent treatment networks,
Assessing trade-offs between freshwater, effluent treatment, and pipe-work/sewer costs.
AspenWater, developed by AspenTech, is a commercially available software tool used to design and optimize water and effluent systems in process industries [
43]. Similarly to WaterTarget, AspenWater has the capability to determine the lowest cost network. The water regeneration decisions are supported by a database detailing the available treatment options for given contaminant types and concentrations.
The software tools listed above are designed for continuous process industries where the processes are independent. Puigjaner et al. [
7] developed a methodology and software tool for water reuse in batch process industries with time-dependent processes. The software supports heuristic and mathematical optimization. More generally, factors such as network complexities, geographic proximities, and variations in contaminants have limited the scope of WPA in industry [
44].
The analytical methods and tools covered in the previous section can be used for change over various time scales and organizational levels by manufacturer interested in water reduction. Short-term, relatively low cost and risk improvements, such as identifying and resolving leaks, can be gained using water auditing tools. Higher cost but still relatively low risk improvements can be achieved using process integration measures. LCA and WF as broader approaches to reviewing water use—looking beyond processes to the full life cycle of a product and higher level strategic analysis—are useful in decisions as to where to site plants or from where to source materials and components. However, no method deals with understanding the reasons for water demand by individual manufacturing processes. The lack of water data for production in LCI databases signifies that water is not critically understood in LCA studies. Water footprinting, although increasingly popular as an alternative to LCA, is best suited to higher level analyses such as those of global trade or of virtual water transfers between countries. Water pinch analysis is a practical tool on the process level for improving network efficiency, but it takes the water requirement for individual process steps as a given. Without understanding how and why water is used, the proactive opportunities to achieve deeper water cuts through product and process redesign, substitution, or elimination are missed. There is a therefore a gap in provision for a tool focusing on individual manufacturing processes. As a first step to achieving this, we propose a concept of water usage efficiency. It is envisaged that the concept can be used to assess current and proposed processes and products, identify hotspots for intervention, and focus water reduction efforts. The concept is similar to that already applied to energy modeling [
45,
46,
47,
48].
3. Definitions of Water Usage Efficiency Ratios (WERs)
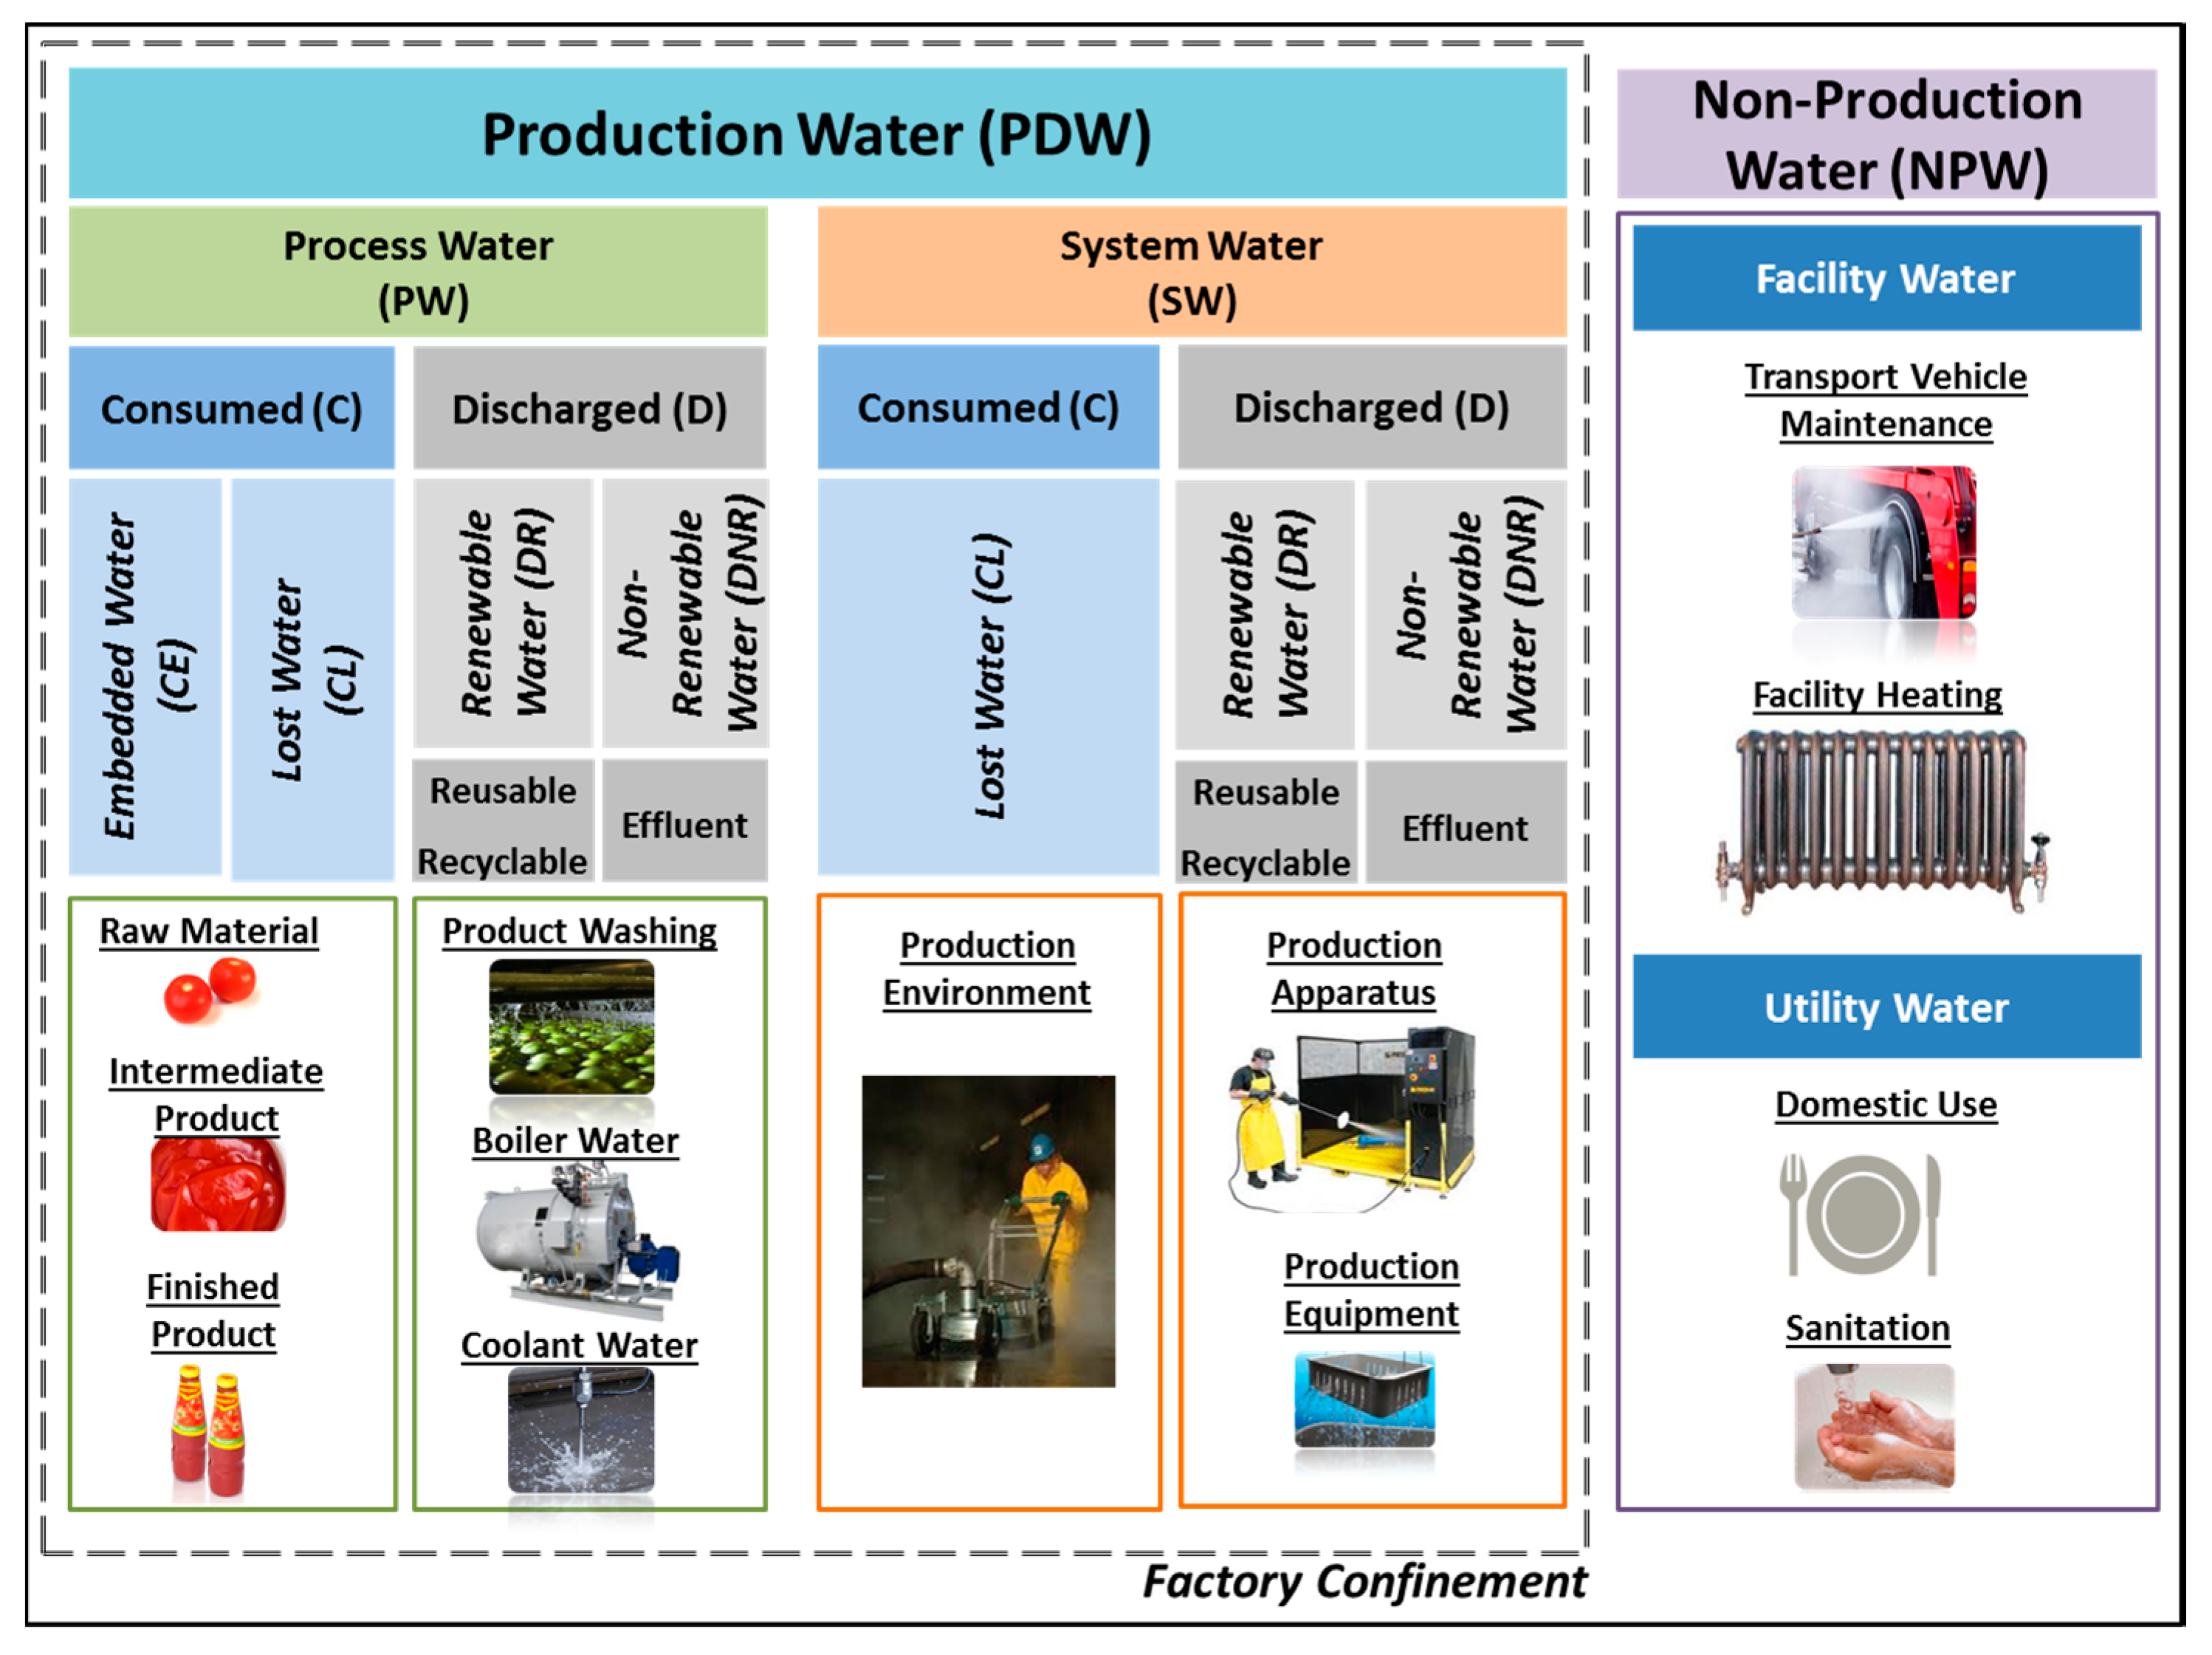
To evaluate water efficiency, we propose three metrics that we term Water Efficiency Ratios (WERs). The metrics depend upon a classification scheme for water flows in a factory, illustrated in
Figure 2. The scheme allows a consistent description of a manufacturing facility, within which the efficiency measures can be meaningfully defined. Some aspects of the scheme are similar to previous work on both industrial and nonindustrial water flows (see references within the following discussion).
The collection of all water flows in a plant is named “Factory Water”, and the water used during production is referred to as “Production Water” (PDW). As shown in the figure, this is in distinction to “Non-Production Water” (NPW), which is water used by auxiliary activities that facilitate production within a factory. Non-production water is typically the initial focus of water-saving efforts such as awareness campaigns, automatic taps for washrooms, and use of grey water for washing vehicles. In this work, we concentrate on the Production Water, which is the direct use of water by or in products, production processes, production equipment, and production areas. PDW is further subdivided into a number of flow types, as discussed in the next section.
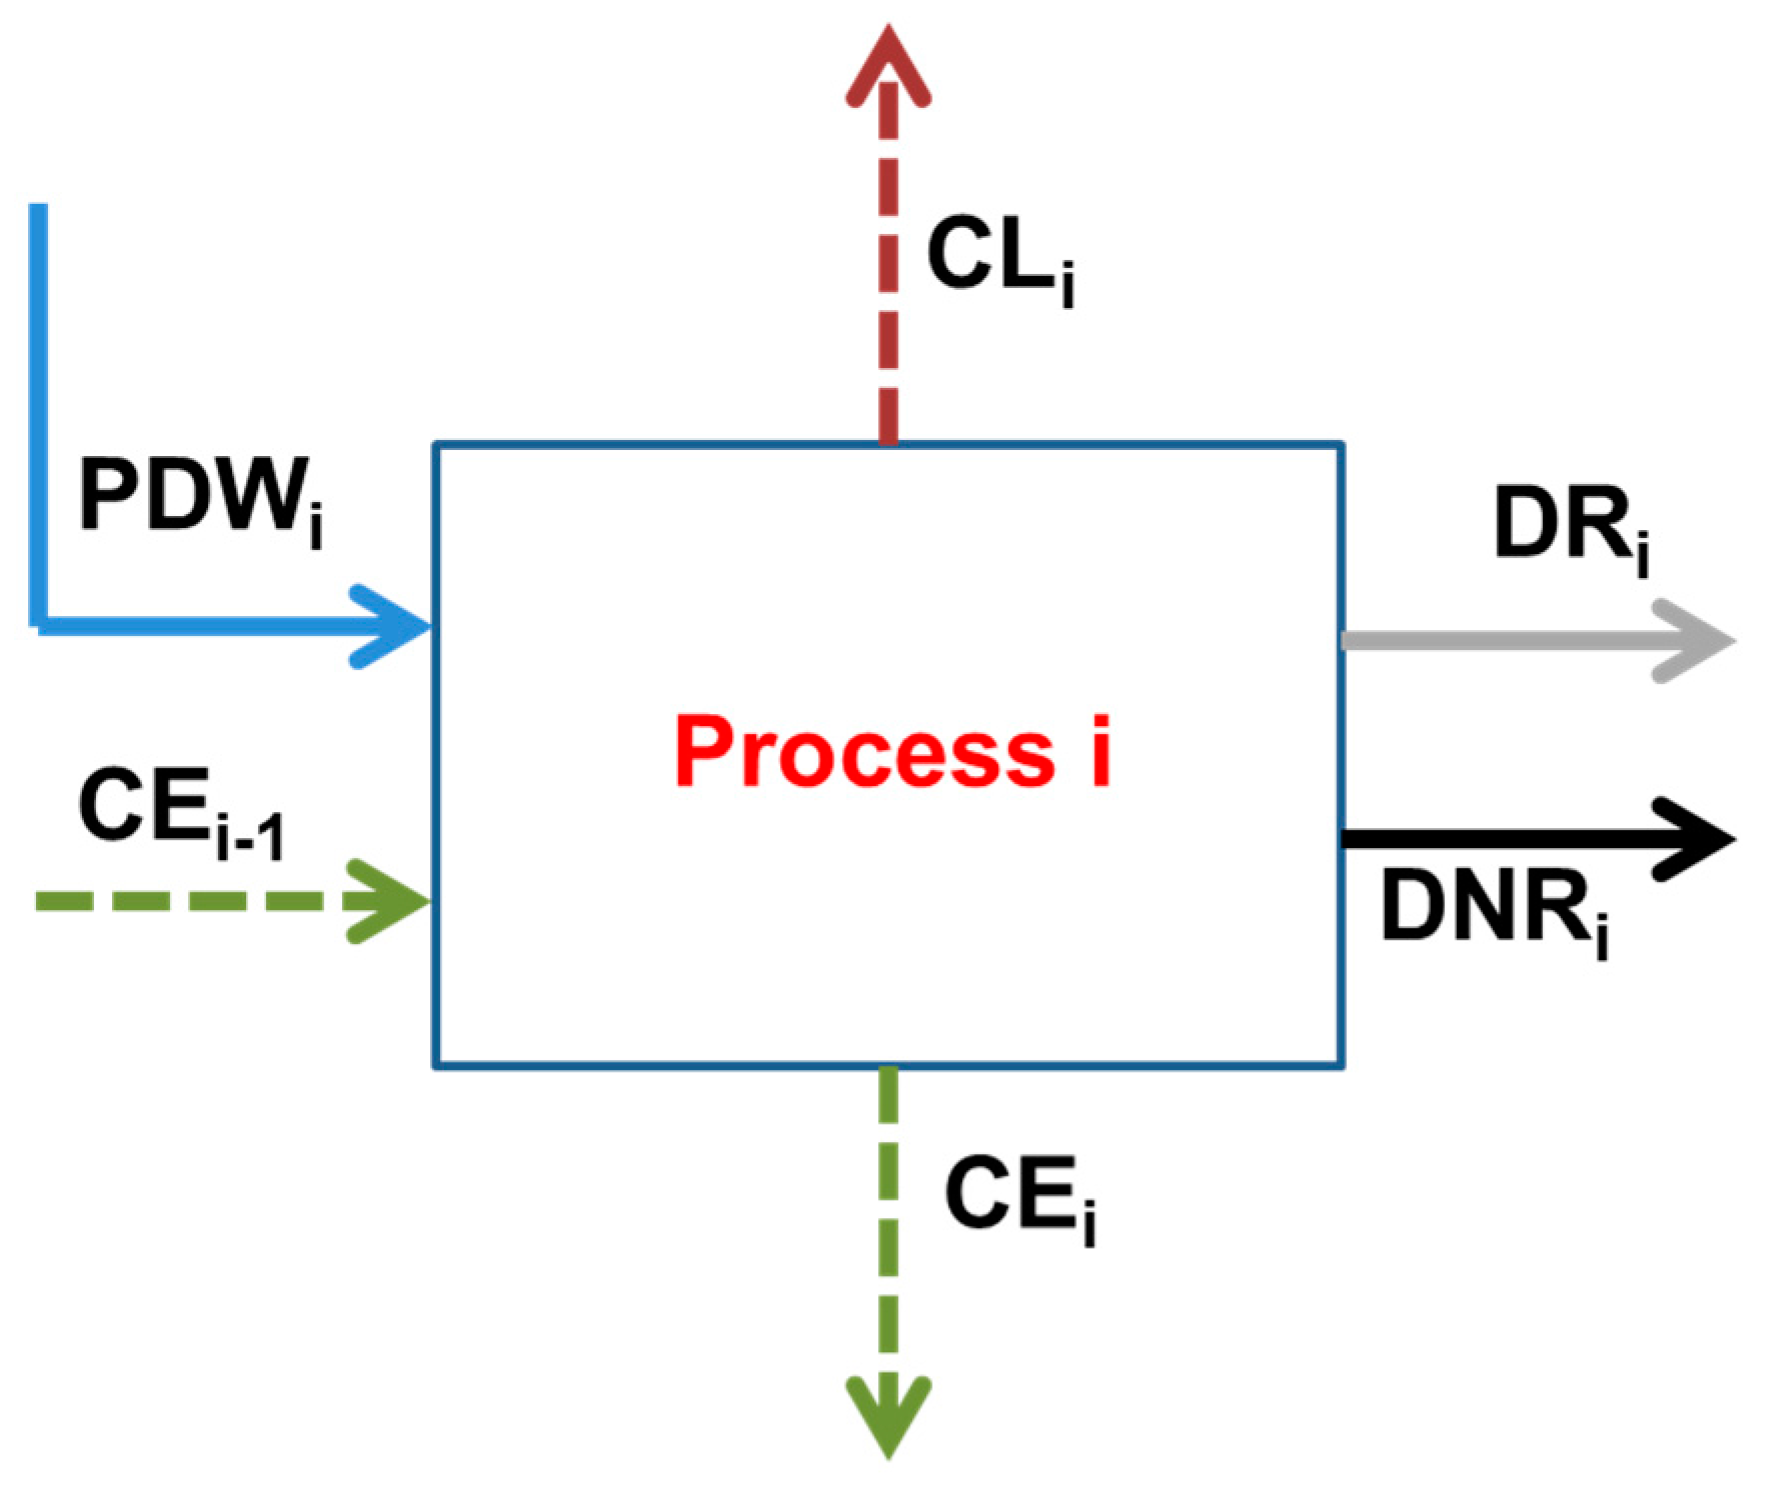
The set of flow inputs and outputs for a unit process is illustrated in
Figure 3. Following Gleick and Palaniappan [
49], the input water can be considered as either consumed, or discharged as wastewater. Molden and Sakthivadivel [
50] also described similar, although not identical, concepts of depleted (i.e., consumed) and outflow water in their accounting scheme for water basins. This leads to the definition of the output flows as follows:
CE: Consumed Embedded water is defined as the water that is embedded into the product as an ingredient. This type of consumption is beneficial and adds value to the product. Examples are beverage manufacturing processes, where water is used as a main ingredient.
CL: Consumed Lost water is defined as the water lost in the process through evaporation or spillage that cannot be recovered. This type of consumption is non-beneficial and occurs due to system inefficiencies and errors.
DR: Discharged Renewable water is that fraction of discharged water which is of a quality allowing reuse either directly or after treatment. Examples are water from washing or rinsing processes, boiler blowdown water, and last rinse water from clean-in-place (CIP) or steam-in-place systems.
DNR: Discharged Nonrenewable water is the proportion of discharged water that is unfit for reuse, because of higher levels of contamination, and is discharged as trade effluent.
DR water could be further subdivided into reusable water, which can be directly reused in a process without any treatment, and recyclable water, which can be reused in a process after being treated using one or more water treatment methods. This distinction is not carried through in the scheme proposed here, but could be incorporated in the future. Similarly, the consideration of positive effects on the environment of discharging reusable water was incorporated into environmental impact scores by Lévová and Hauschild [
21].
Each CL, DR, and DNR flow can be categorized as process water (PW) or system water (SW). PW is defined as the water used in production processes that is essential to convert raw materials into intermediate and final products—for example, water used as an ingredient in products, as a solvent, as a coolant or lubricant, or as a cleaning agent to wash products. SW is defined as the water used in the production processes to maintain the production equipment, apparatus, and environment—for example, water used in clean-in-place (CIP) systems or other general cleaning activities to sanitize production equipment and material-handling systems. CE flows are PW by definition. The concept of process and non-process beneficial depleted water flows proposed by Molden and Sakthivadivel [
50] for water basins is similar, as for these authors the non-process flow produces value but is not consumed directly by the process in question.
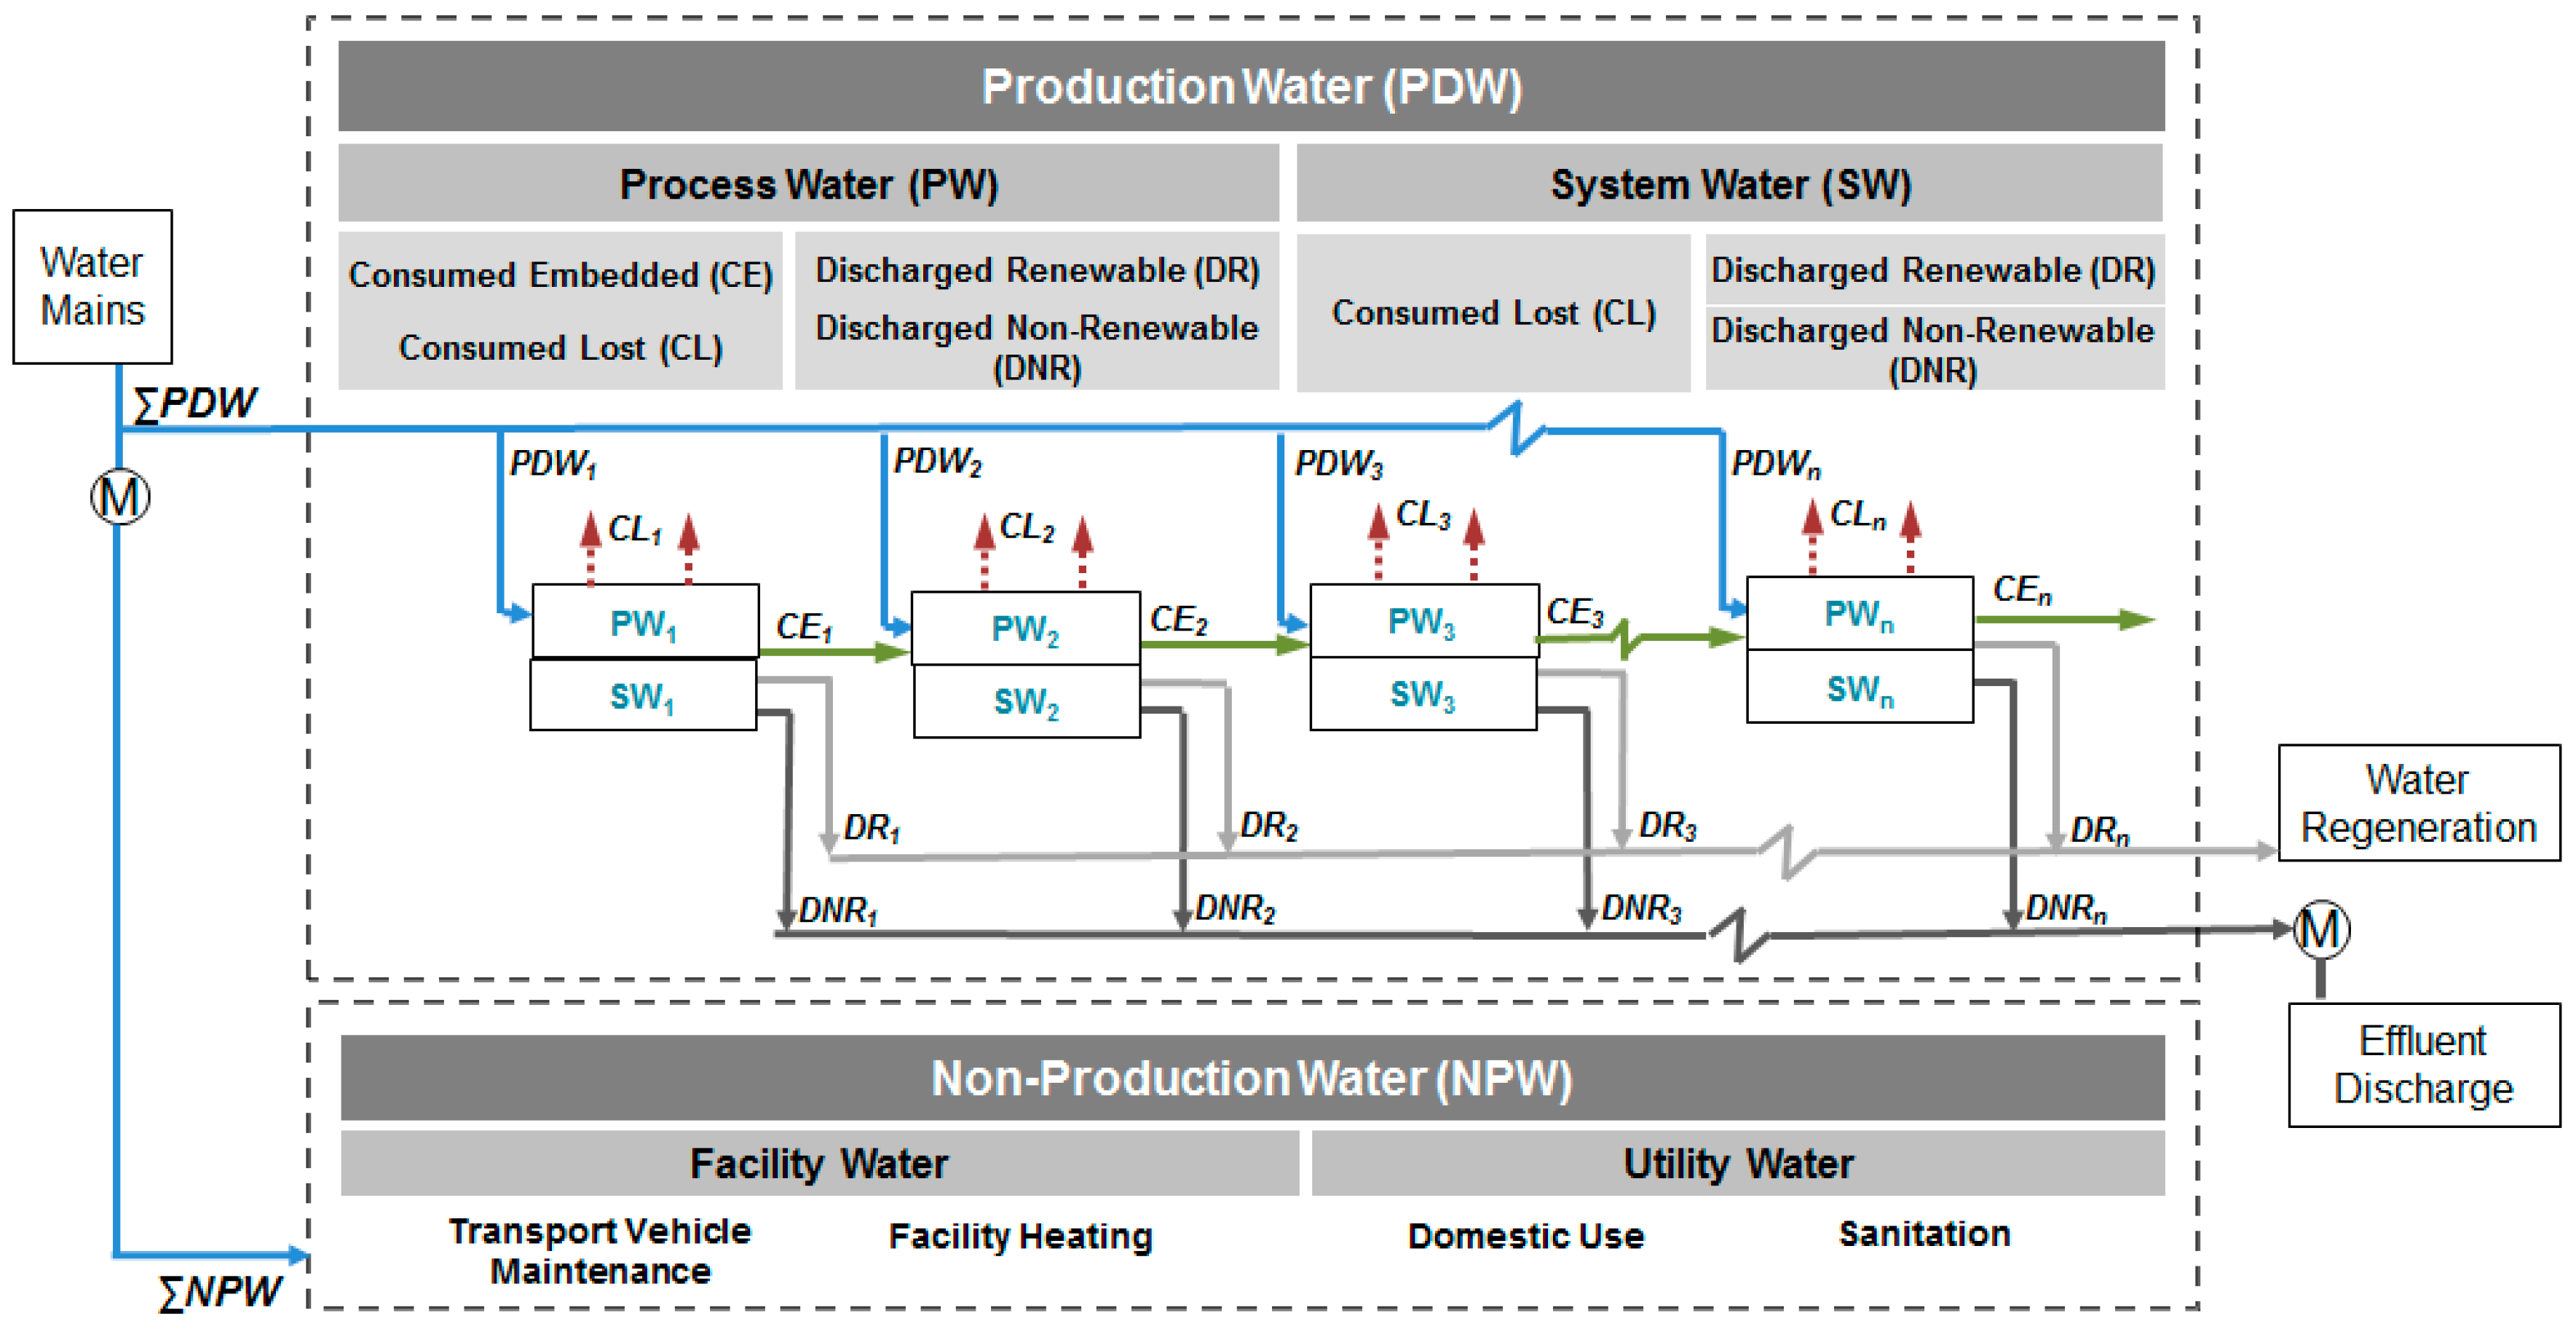
With the definitions above, the full production system can represented as a Factory Water Model as shown in
Figure 4, in which a subscript
i is applied to the flows associated with unit process
i.
The water usage efficiency ratios (WERs) formulated using the flow definitions are defined below. The Water Intensity (WI) ratio identifies processes that use the largest proportions of water in a production chain:
WI highlights water-intensive processes but does not provide clarity on how well that water is used. This is addressed in the other two efficiency ratios. The Water Efficiency (WE) ratio looks at what proportion of the water is incorporated in the product or used directly for processing, compared to water used in an ancillary role, for example in washing production equipment or facility:
The Waste Water Efficiency (WWE) ratio is the proportion of reusable waste water to the total input water to the process:
Defining WWE addresses the criticism of some water impact methods that the nature of effluent produced is not assessed (see, for example, Lévová and Hauschild [
21]). Application of all three measures is required to target unit processes for intervention. For example, the proportion of non-reusable water can be decreased by simple dilution, consequently improving WWE, but at the cost of worsening WI.
4. Example Application of Efficiency Measures
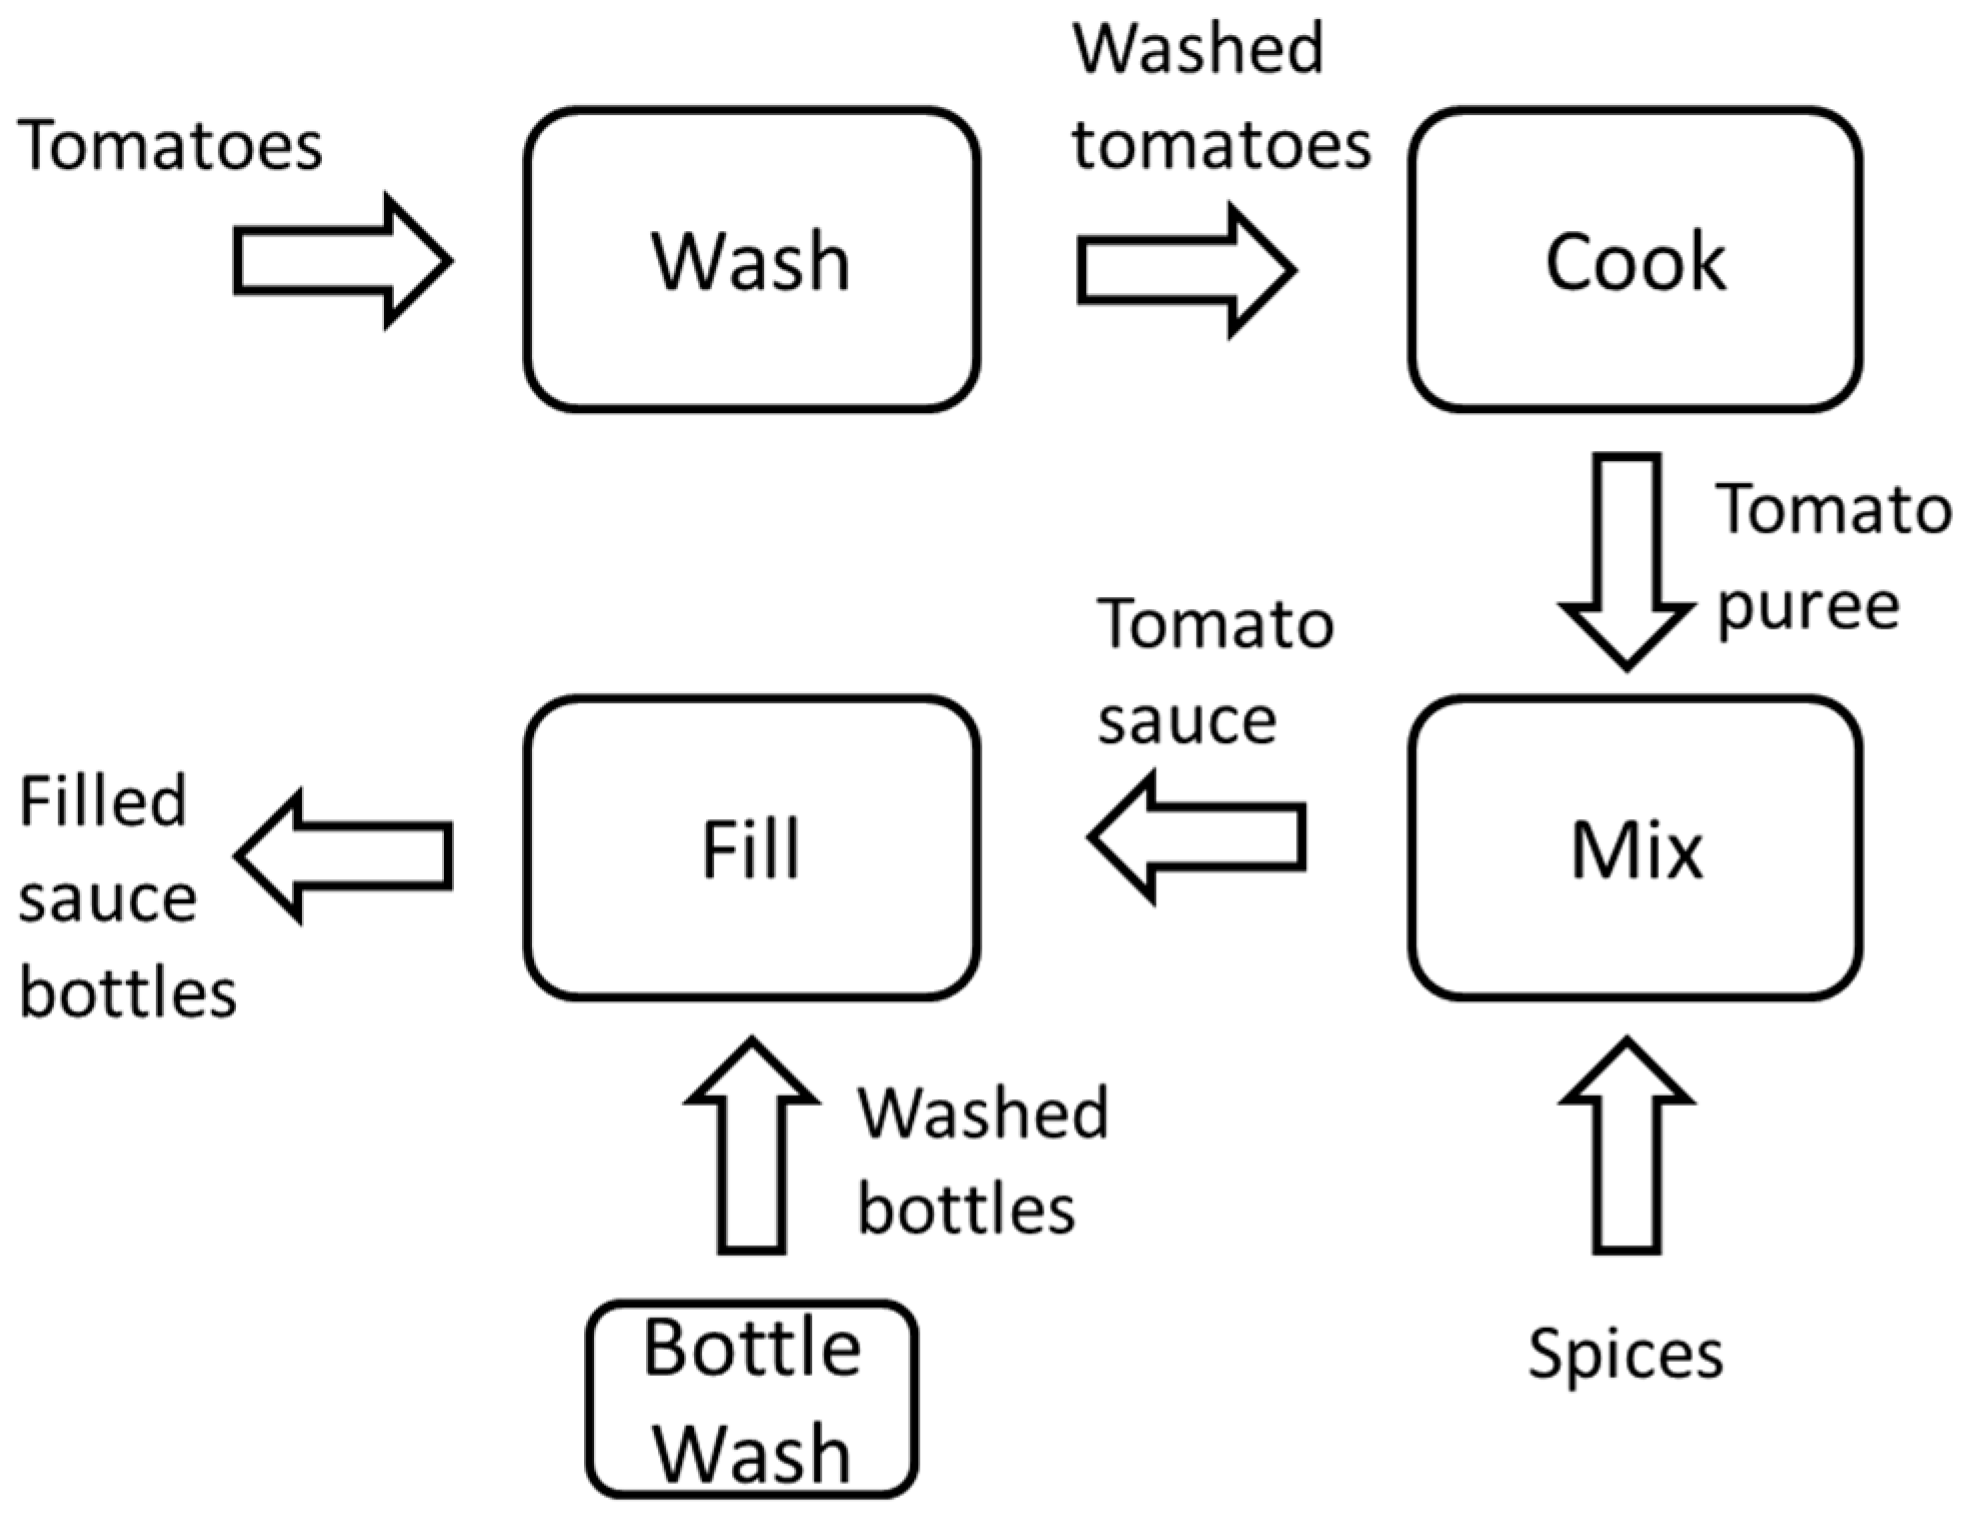
We illustrate the calculation of the WERs using a simple example of tomato sauce production. The production line, illustrated in
Figure 5, consists of four main processes, namely: Washing—of the tomatoes as received; Cooking—of tomatoes to form a puree; Mixing—of the puree with other ingredients; and Filling—of tomato sauce bottles. These processes are connected to each other by conveyor belts and pipes to facilitate both discrete and continuous movement of raw ingredients, processed materials, and final products. The PW usage for individual processes is as follows:
Washing process: water used to wash tomatoes.
Cooking process: water used to cook tomatoes;
Mixing process: water added to the tomato puree;
Filling process: water used to wash bottles before filling with sauce.
The SW for each step is the water used by the clean-in-place (CIP) systems. These cleaning processes take place in two cycles: Mini Wash and Major Wash. Mini Wash is the cleaning cycle in between operations and Major Wash is the general washing of the production machines and equipment after each production shift. Note that the wash water for the bottles is counted as PW rather than SW as it is directly associated with the product—that is to say, a bottle of tomato sauce, and not washing of the manufacturing equipment.
The flow volumes per cycle for each water category for each process are summarized in
Table 1. The ratio of volumes of water consumed to discharged and the proportion of the discharge water considered reusable vary for each process, and for an individual process vary between the process and the system water. For example, a relatively high proportion of the tomato washing water can be directly reused (D of 26 L, DR of 20 L) through techniques such as a pre-rinse in counter current rinsing [
51], but in the tomatoes cooking step all the cooking water is absorbed or evaporated so there is no discharged water (PW of 23 L, D of 0 L, C of 23 L). Also shown in
Table 1 are the number of cycles of each process that occur over the course of an eight-hour production shift. Using the figures in the table and Equations (1)–(3), the total PDW and the values of the water efficiency ratios can be calculated for an eight-hour production shift, as shown in the table.
It can be seen that the Washing and Cooking processes use the most water and hence have comparatively lower WI values (i.e., 0.58 and 0.69, respectively). Although water intensive, these processes are efficient in comparison to the others because a smaller proportion of PDW is used as SW (as indicated by their WE values, i.e., 0.96 and 0.99, respectively). The water productivity in these cases can be improved through process redesign. For example, use of high pressure/steam washers to rinse tomatoes, the use of lids over the cooking containers to prevent water evaporation, or the reuse of “last rinse water” as the “first rinse water” in a subsequent operation. Interventions such as these are able to substantially reduce the PW intake by proactively targeting areas for improving efficiency.
In contrast, the Mixing process has a relatively high WI value (i.e., 0.96), and uses the least amount of water compared to the other three processes. At the same time, it has a comparatively poor WE value of 0.32 because a larger proportion of PDW is used as SW. Therefore, improvement can be targeted at reducing the SW requirement of the Mixing process through operational changes such as increasing the batch size, or appropriately planning the product flows to minimize idle time and prevent unnecessary cleaning from product residue.
Similar to the Mixing process, the Filling process also has a comparatively high WI of 0.96, but a relatively poor WE of 0.61. It is not as efficient comparatively because a higher amount of water is used as SW. Furthermore, the Filling process has a lower WWE value (i.e., 0.42) compared to the other processes, which reflects the fact that a larger proportion of DNR water is generated because of the use of special detergents that make the outgoing water unsuitable for reuse.
5. Discussion
The WERs provide numerical scores to be used in a comparative manner to help to identify critical water usage areas or “hotspots” on which to concentrate in developing water reduction proposals [
52]. However, in making investment decisions there are generally other considerations which must be included, such as technical and economic feasibilities and projected environmental benefit of proposed measures. For example, in the early stages of a company water reduction program, the optimum measures might be expected to be more reactive (i.e., low risk and low return, in nature), while at later stages they might be proactive (i.e., high risk and return). Combining quantitative data such as WERs with qualitative judgments to rank alternatives is a typical task faced in water management, and use of a number of multi-criteria decision analysis (MCDA) techniques to support such ranking have been reported in the literature. Examples are work by Curiel-Esparza et al. [
53], who applied the analytical hierarchy process (AHP) [
54] with the Delphi method and VIKOR technique to select a sustainable water disinfection technique for water reuse projects in Valencia, Spain, and by Rahman et al. [
55] who also applied AHP followed by weighted linear combination (WLC) for selection of optimum aquifer recharge strategies in the Gaza Strip.
Use of hydrological simulation to provide the quantification of variables of interest, together with the results of consultations and MCDA is lauded in the literature as a powerful combination for evaluation of proposed watershed management arrangements. Examples are Cau and Paniconi [
56], who applied it to agricultural land use in Sardinia, and Rahaman et al. in their Gaza Strip study. We propose that the Factory Water model of
Figure 4 could be used similarly, together with discrete event simulation (DES) and MCDA to evaluate proposed water management changes in a factory. DES allows simulation of the dynamic flow of both water and products in-plant under proposed scenarios. Such scenarios include changes to product formulations, application of water reuse and recycling, or changes to operational parameters such as cycle time, busy and idle times, setup time, product changeovers, wash time, and machine down time. The WERs for each scenario would be calculated from the DES outputs, then combined with the results of expert and management consultations using MCDA methods. This approach would provide the basis of a tool for iterative development and evaluation of water reduction proposals affecting the manufacturing process chain.
However, a barrier to setting up DES factory models and calculation of WERs, and to water conservation efforts in general, is lack of data on water quality and flow volumes at the process level within a plant. In the worst case, actually available data can be limited to periodic meter readings taken by the water utility for charging purposes, covering water supply to the whole of a plant. The volume of effluent discharged may not be measured directly, with sewage charges instead estimated from supply volumes and site area. Content of effluent is often sampled as part of ensuring compliance with discharge permits and charging, but the contributions to the effluent from individual unit processes may not be known. To model a manufacturing plant to sufficient fidelity to assess sustainability concepts, water data at the individual process level is required. The data set should capture the time variation of both volume and content due to the batch nature of production and manufacturing schedules.
To remedy the lack of data, an instrumentation toolkit for characterization of both water content and measurement of fluid flow volumes is required to complement the framework. The instrumentation would ideally be non- or minimally invasive to allow initial characterization work without disrupting plant operation. Other characteristics required are in-line continuous monitoring capability to capture the variation related to production over a period. In the longer term, permanently installed instrumentation could be part of a water reduction solution. An existing example is the use of conductivity sensors for control of boiler blowdown intervals [
8].


