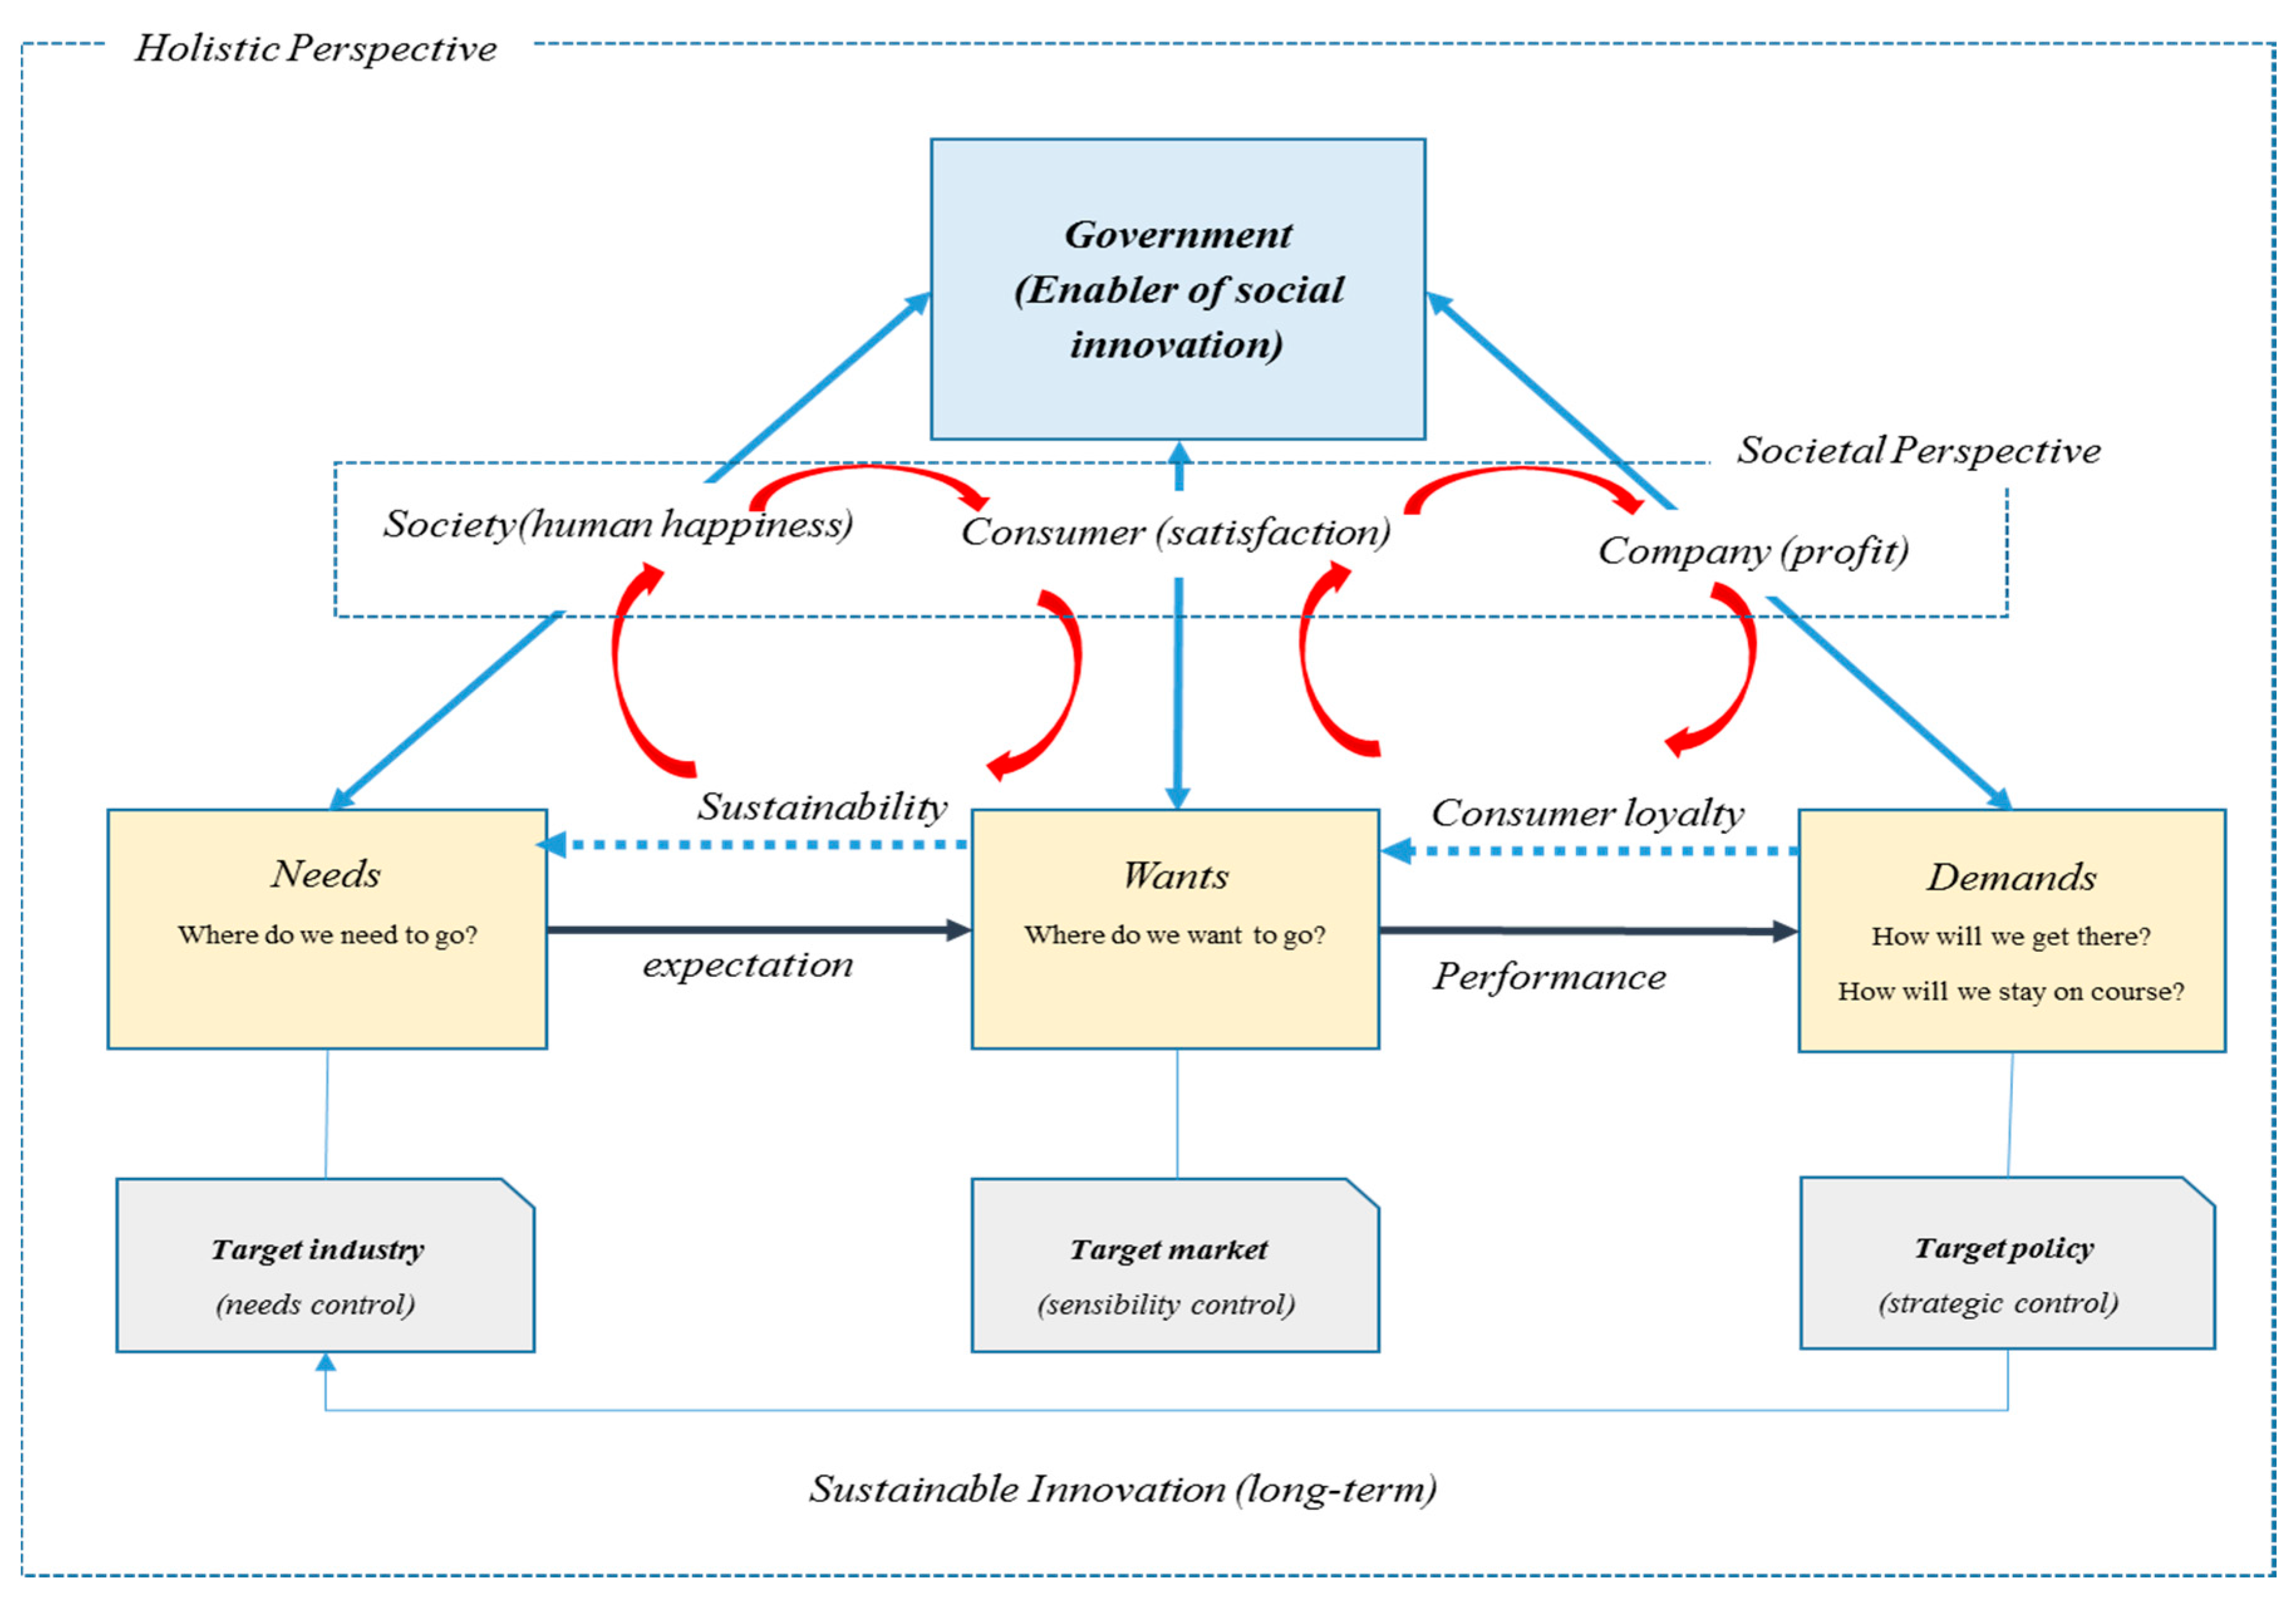
Figure 1.
Holistic social marketing conceptual framework.
Figure 1.
Holistic social marketing conceptual framework.
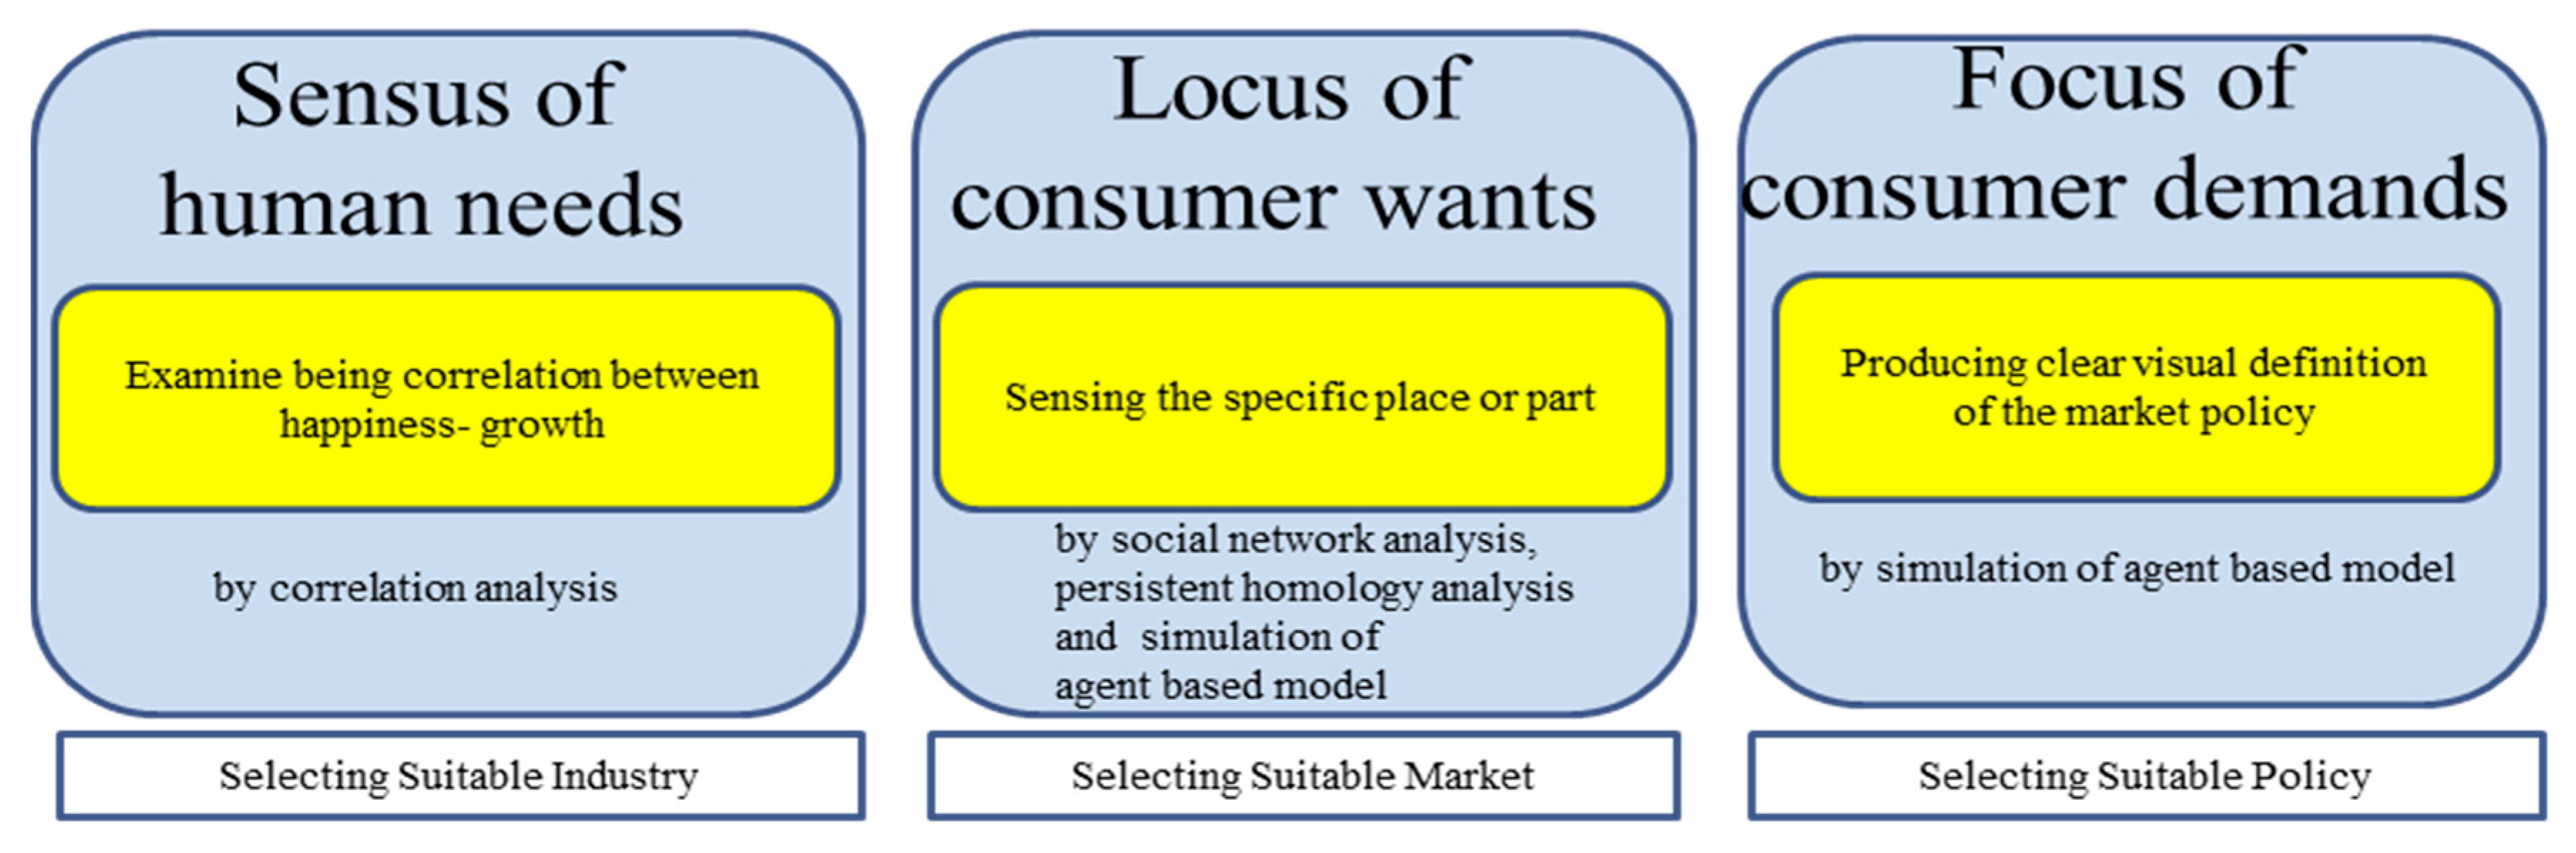
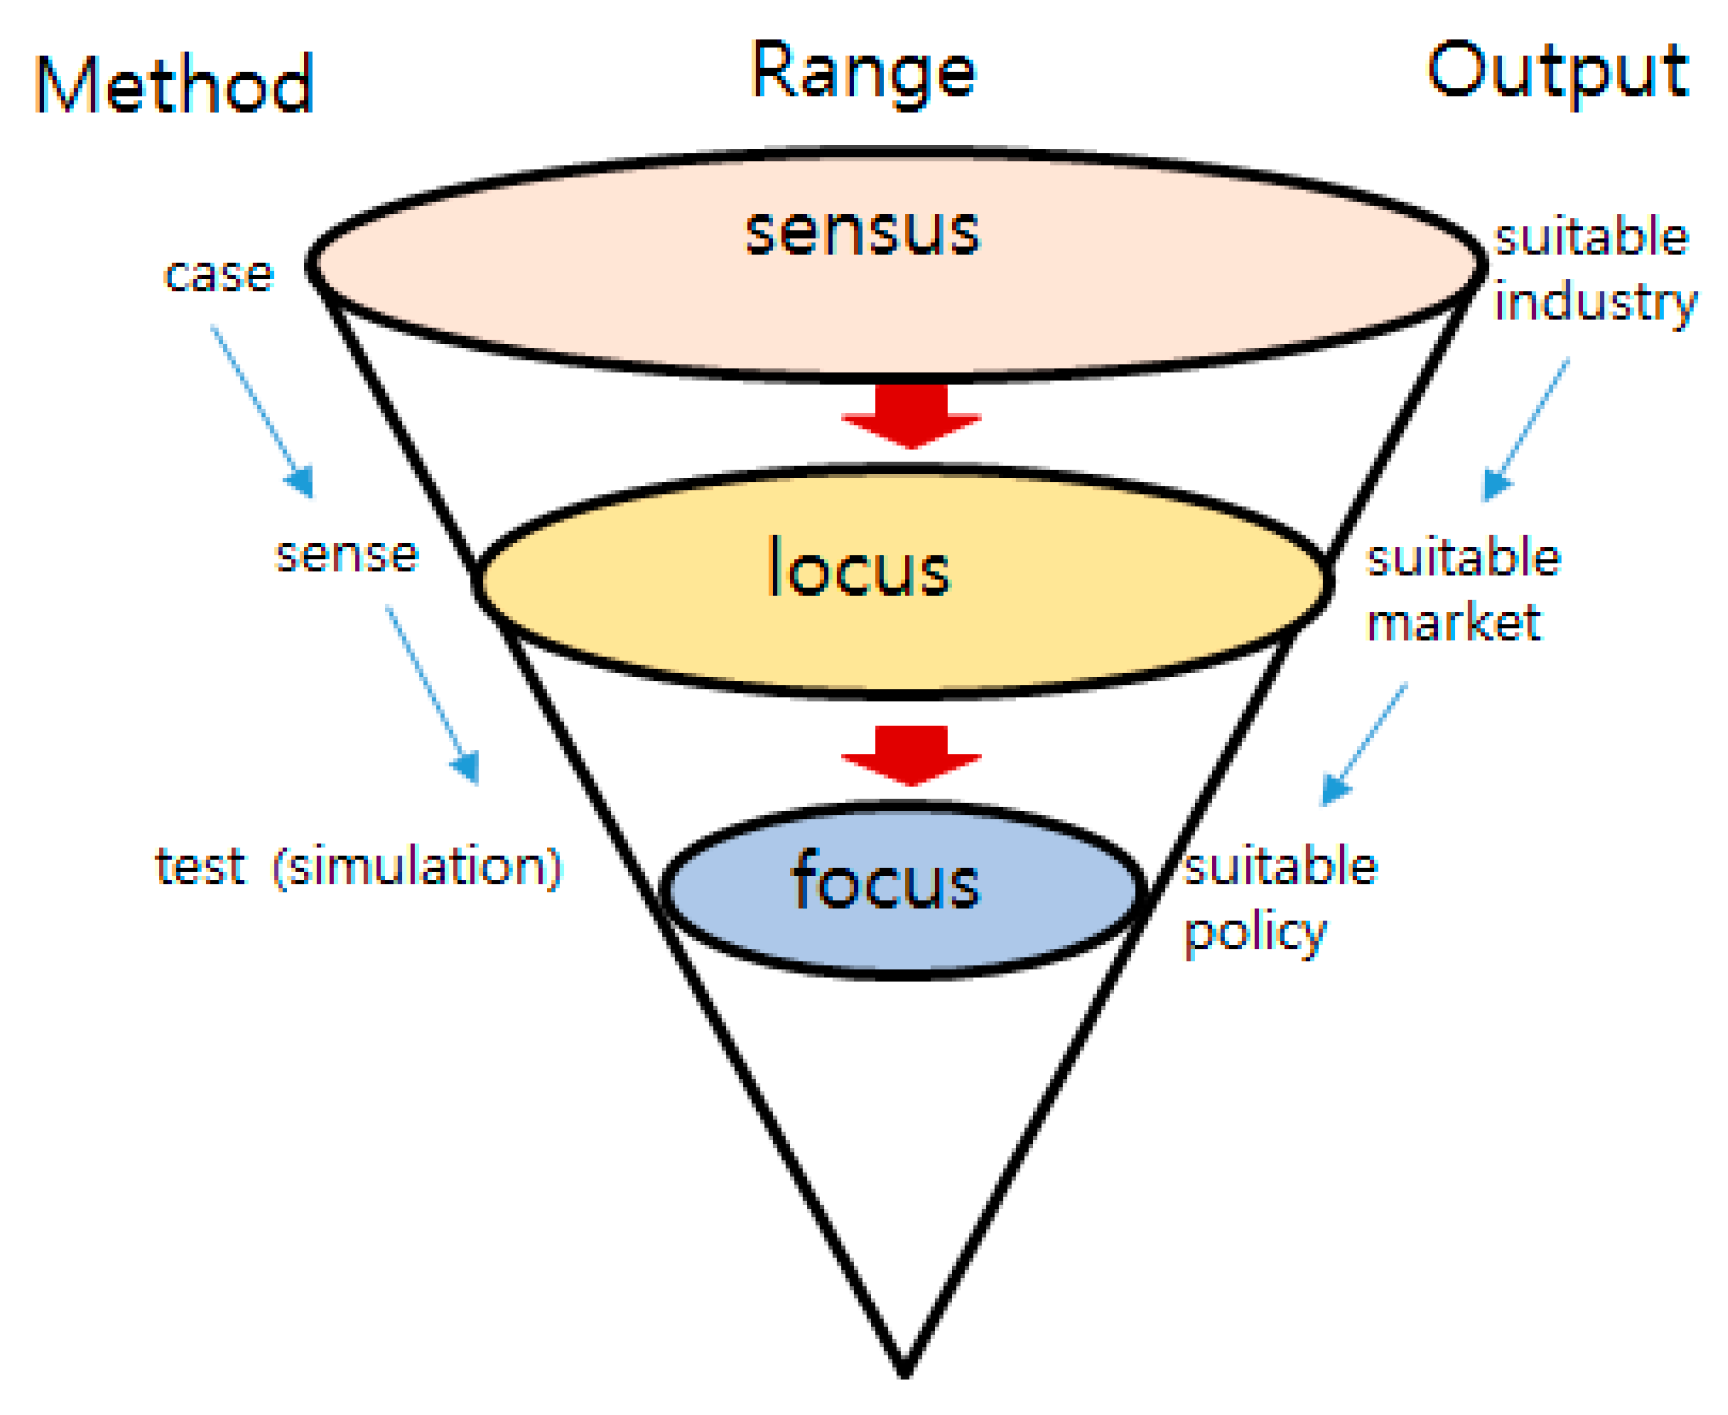
Figure 2.
Method, range and output of research.
Figure 2.
Method, range and output of research.
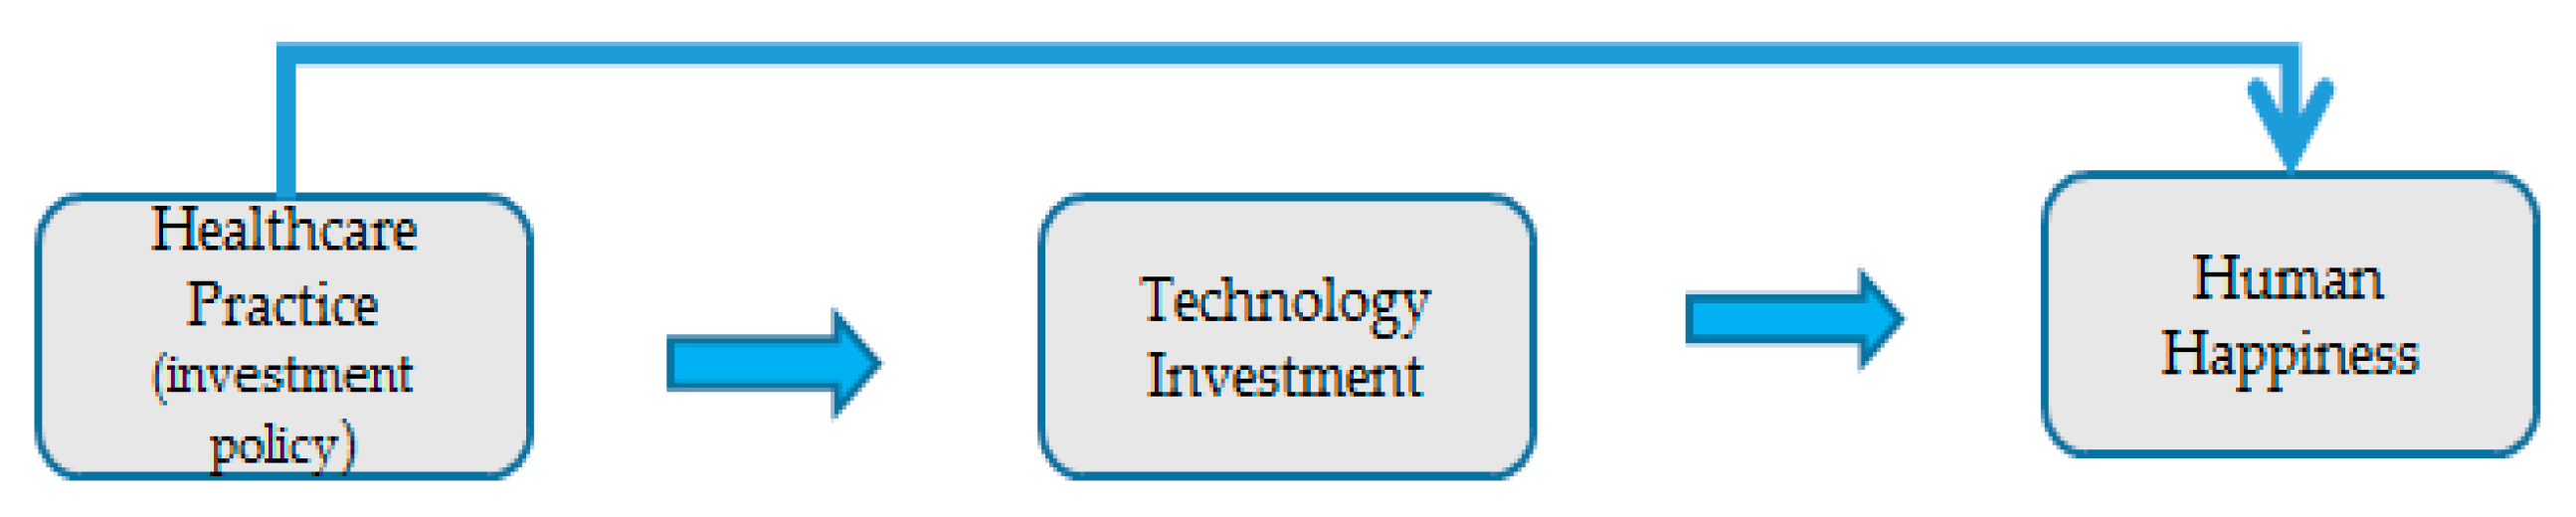
Figure 3.
Research model.
Figure 3.
Research model.
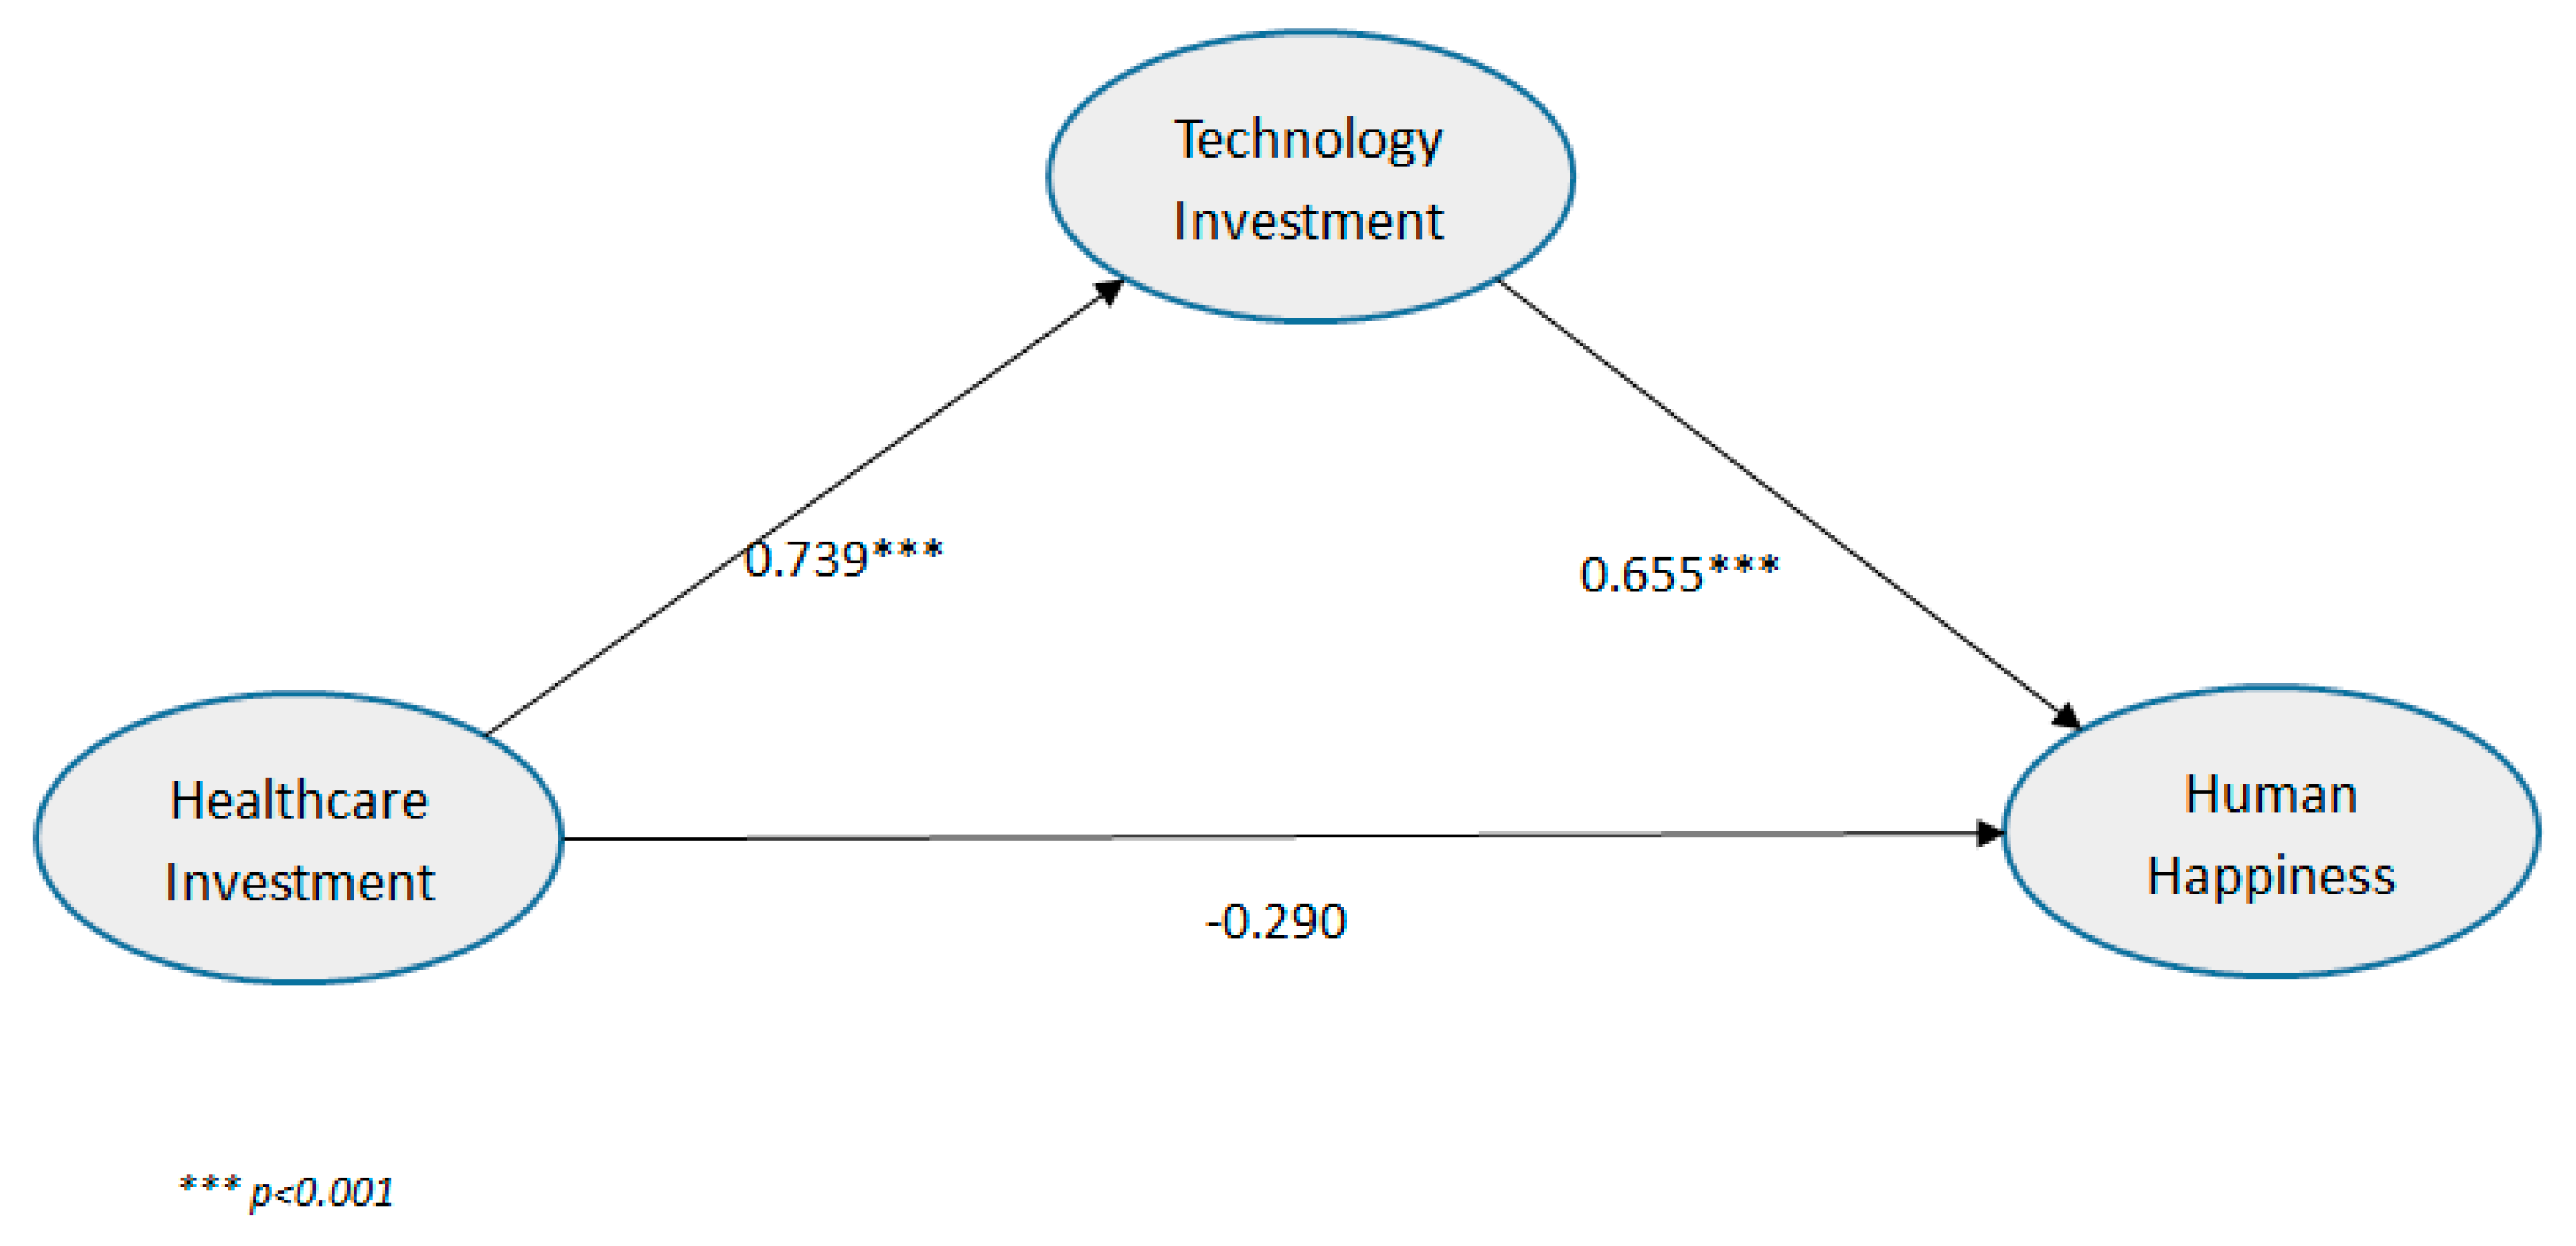
Figure 4.
The direct and mediated relationships that enhance human happiness.
Figure 4.
The direct and mediated relationships that enhance human happiness.
Figure 5.
Path network among the various factors.
Figure 5.
Path network among the various factors.
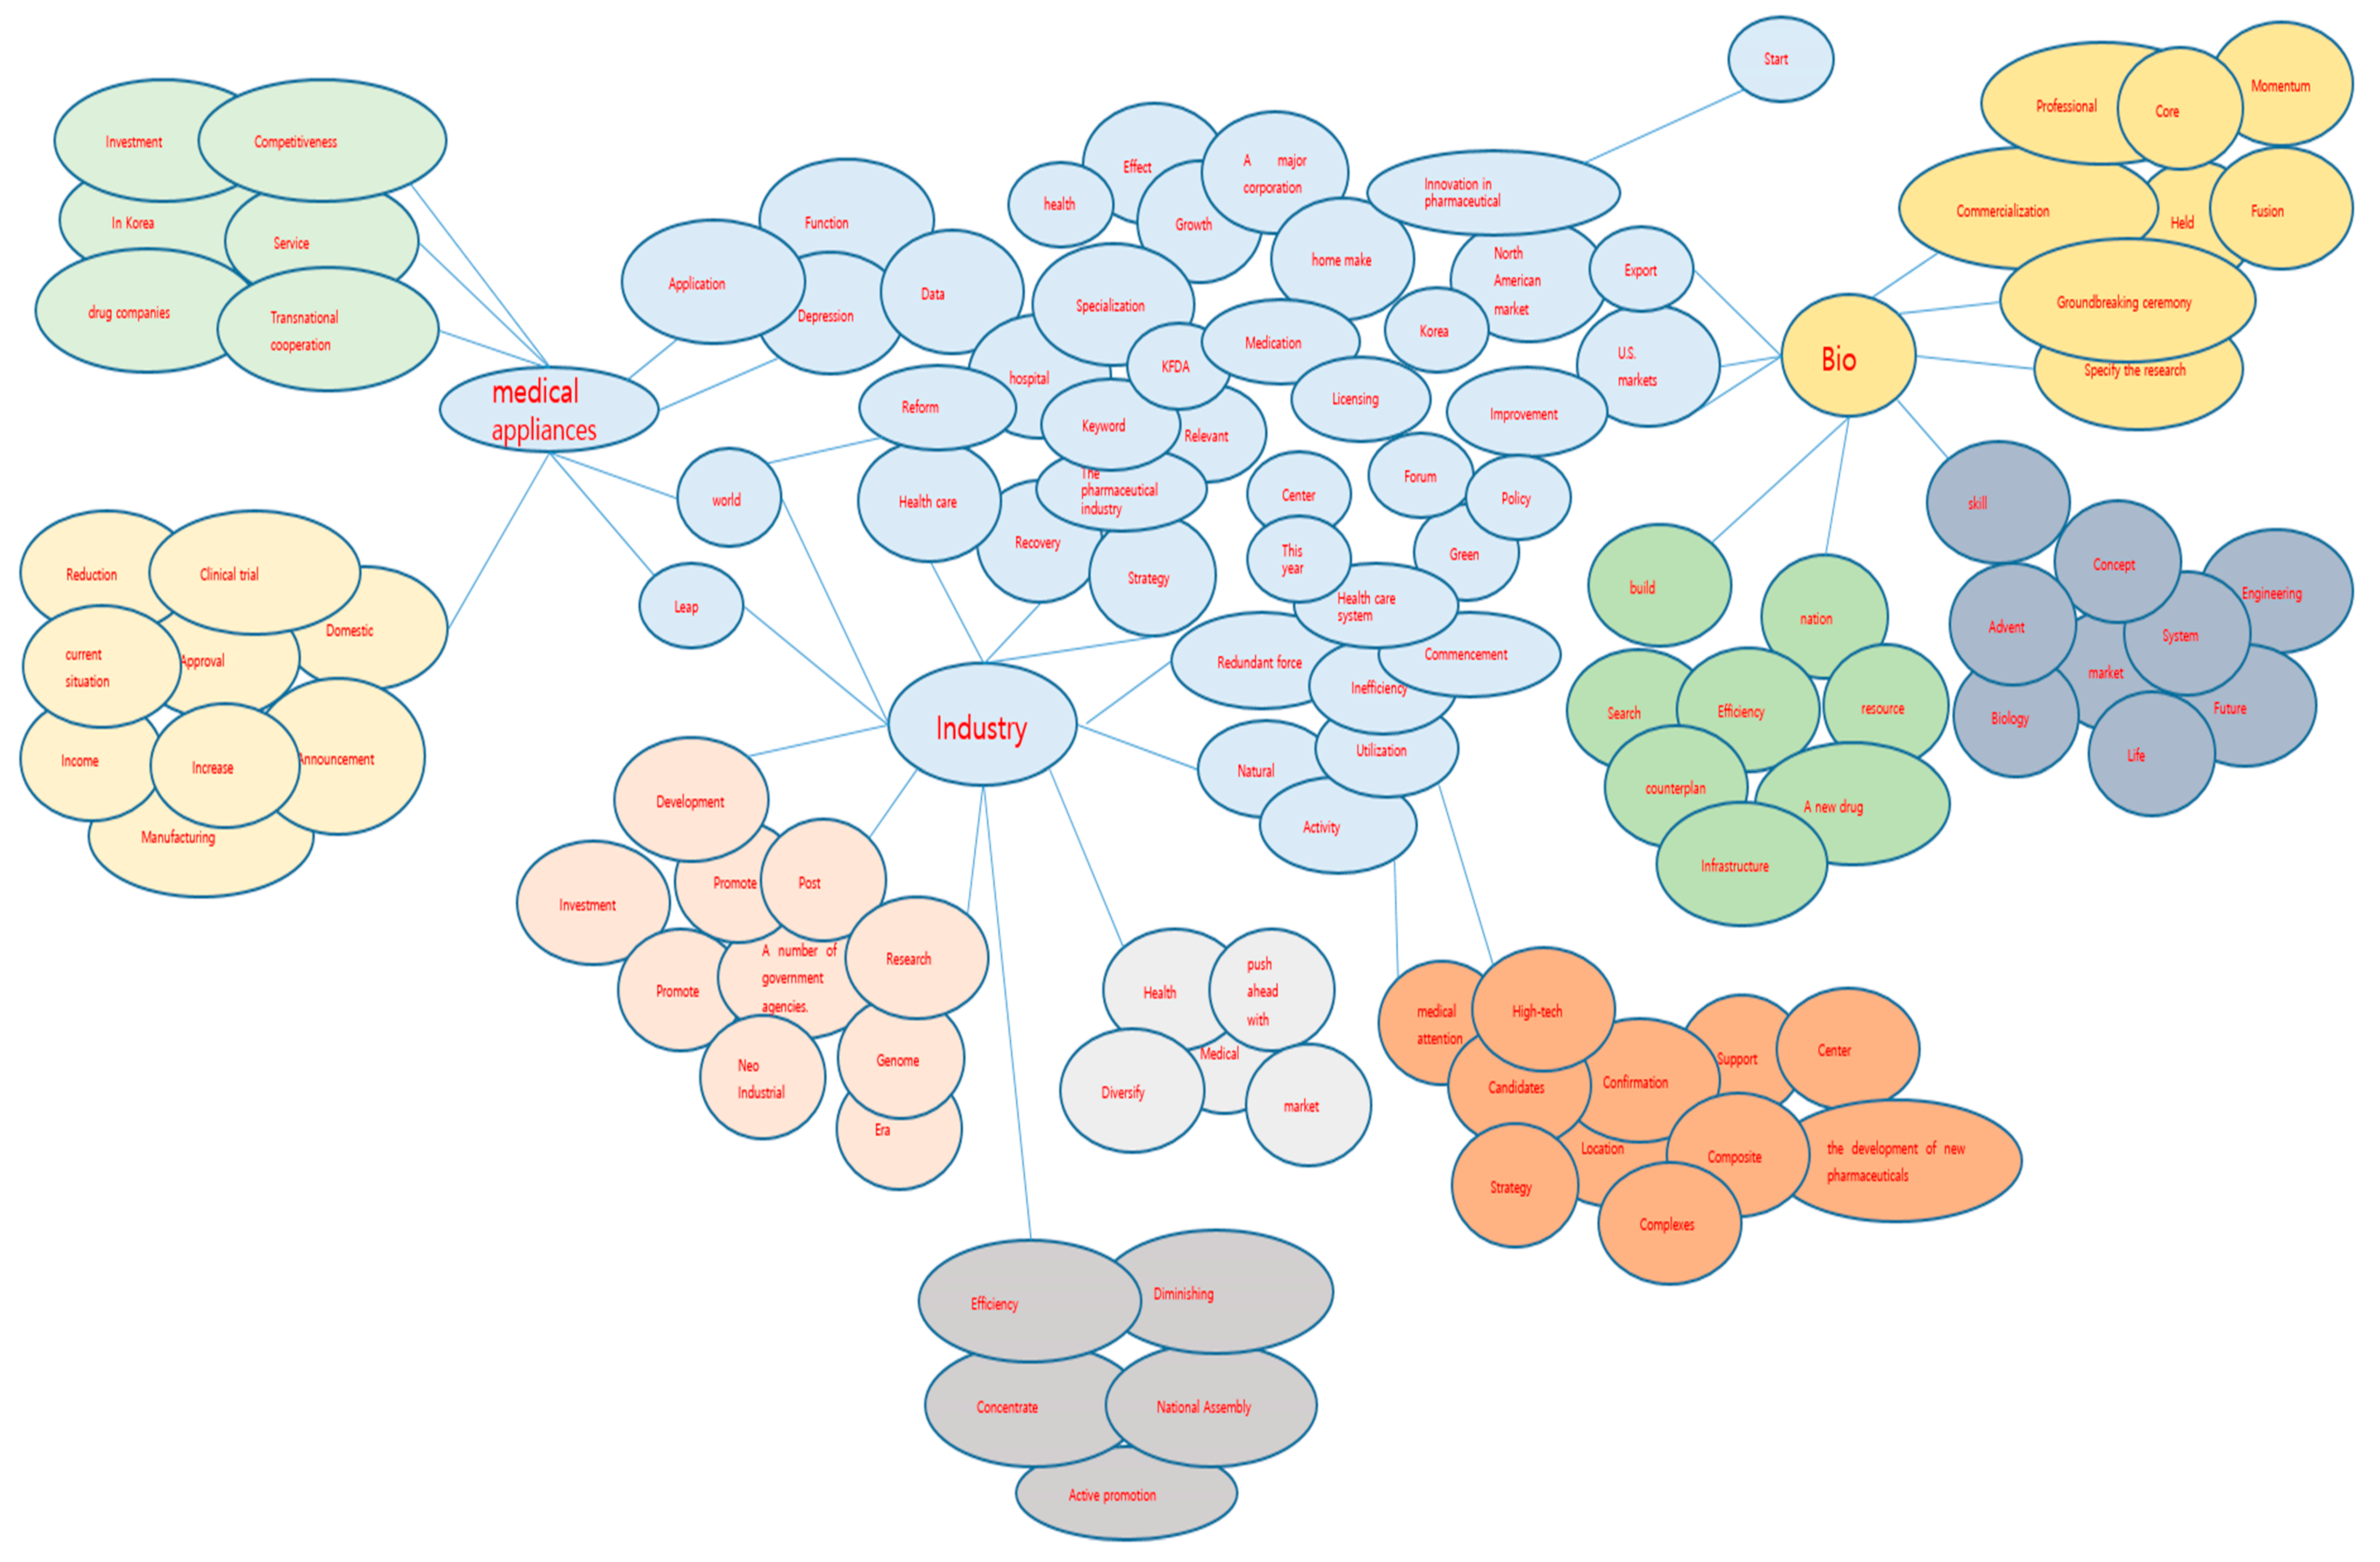
Figure 6.
Bio-issue clustering by social network analysis.
Figure 6.
Bio-issue clustering by social network analysis.
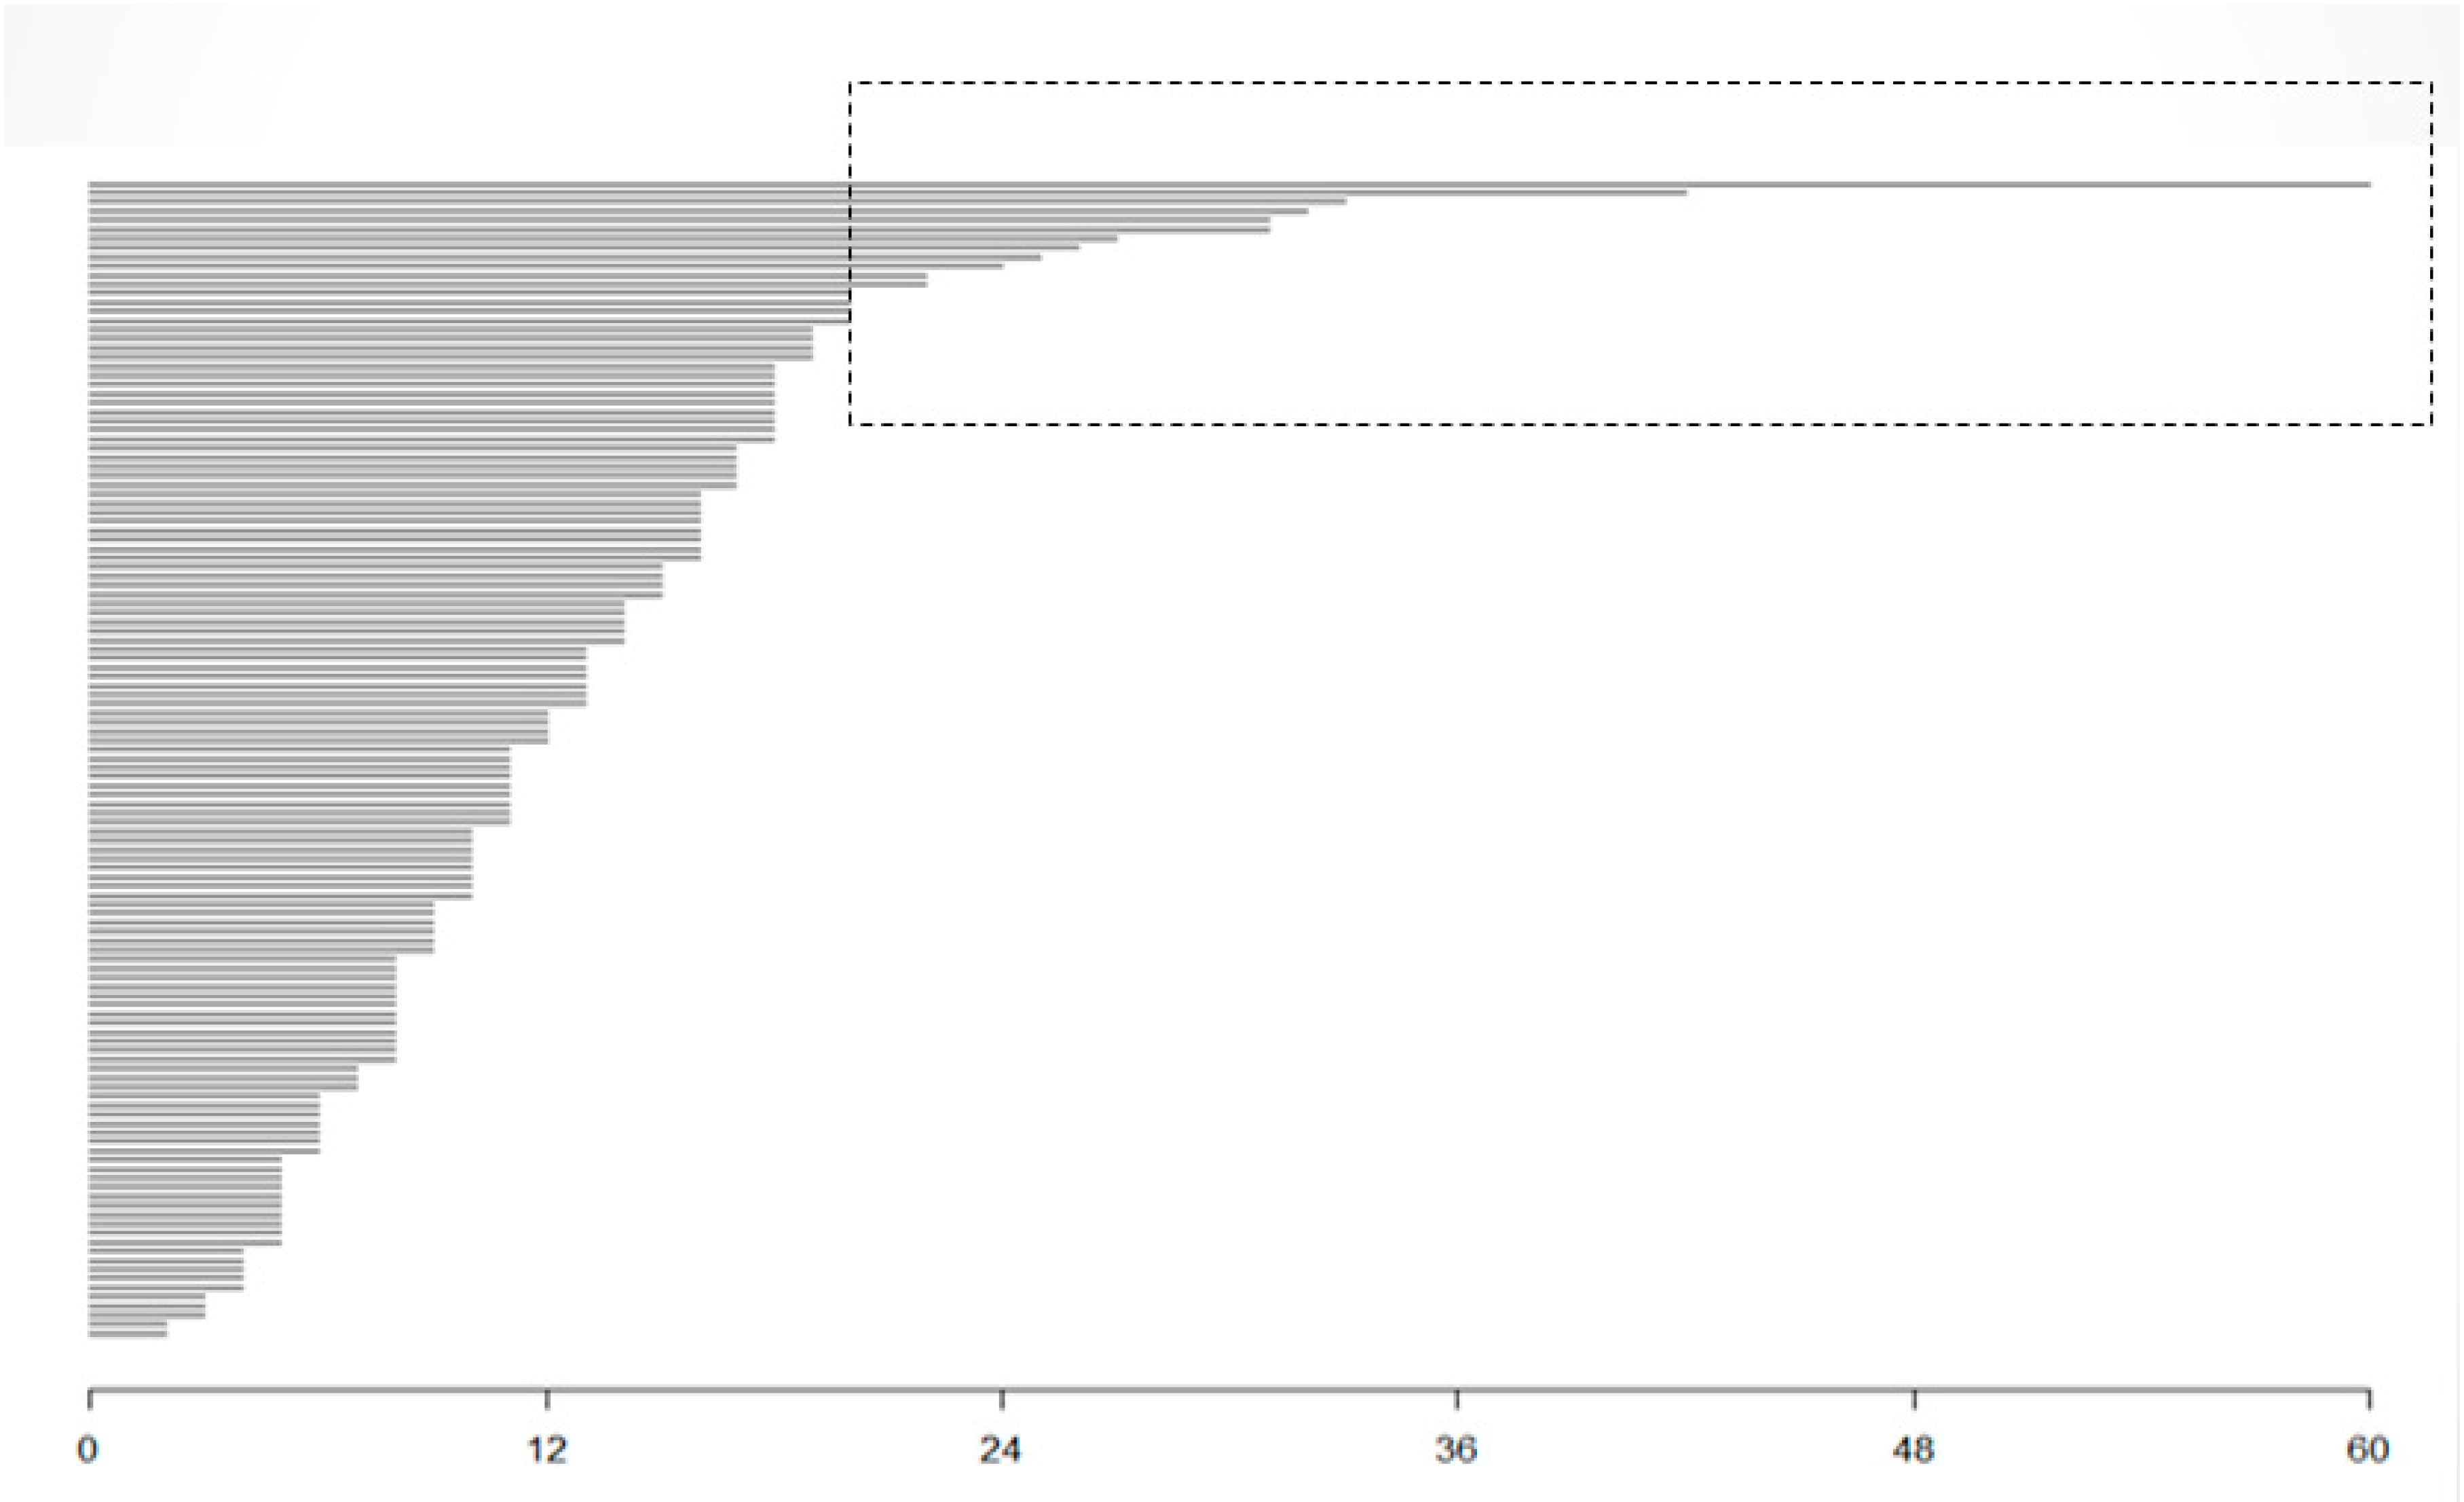
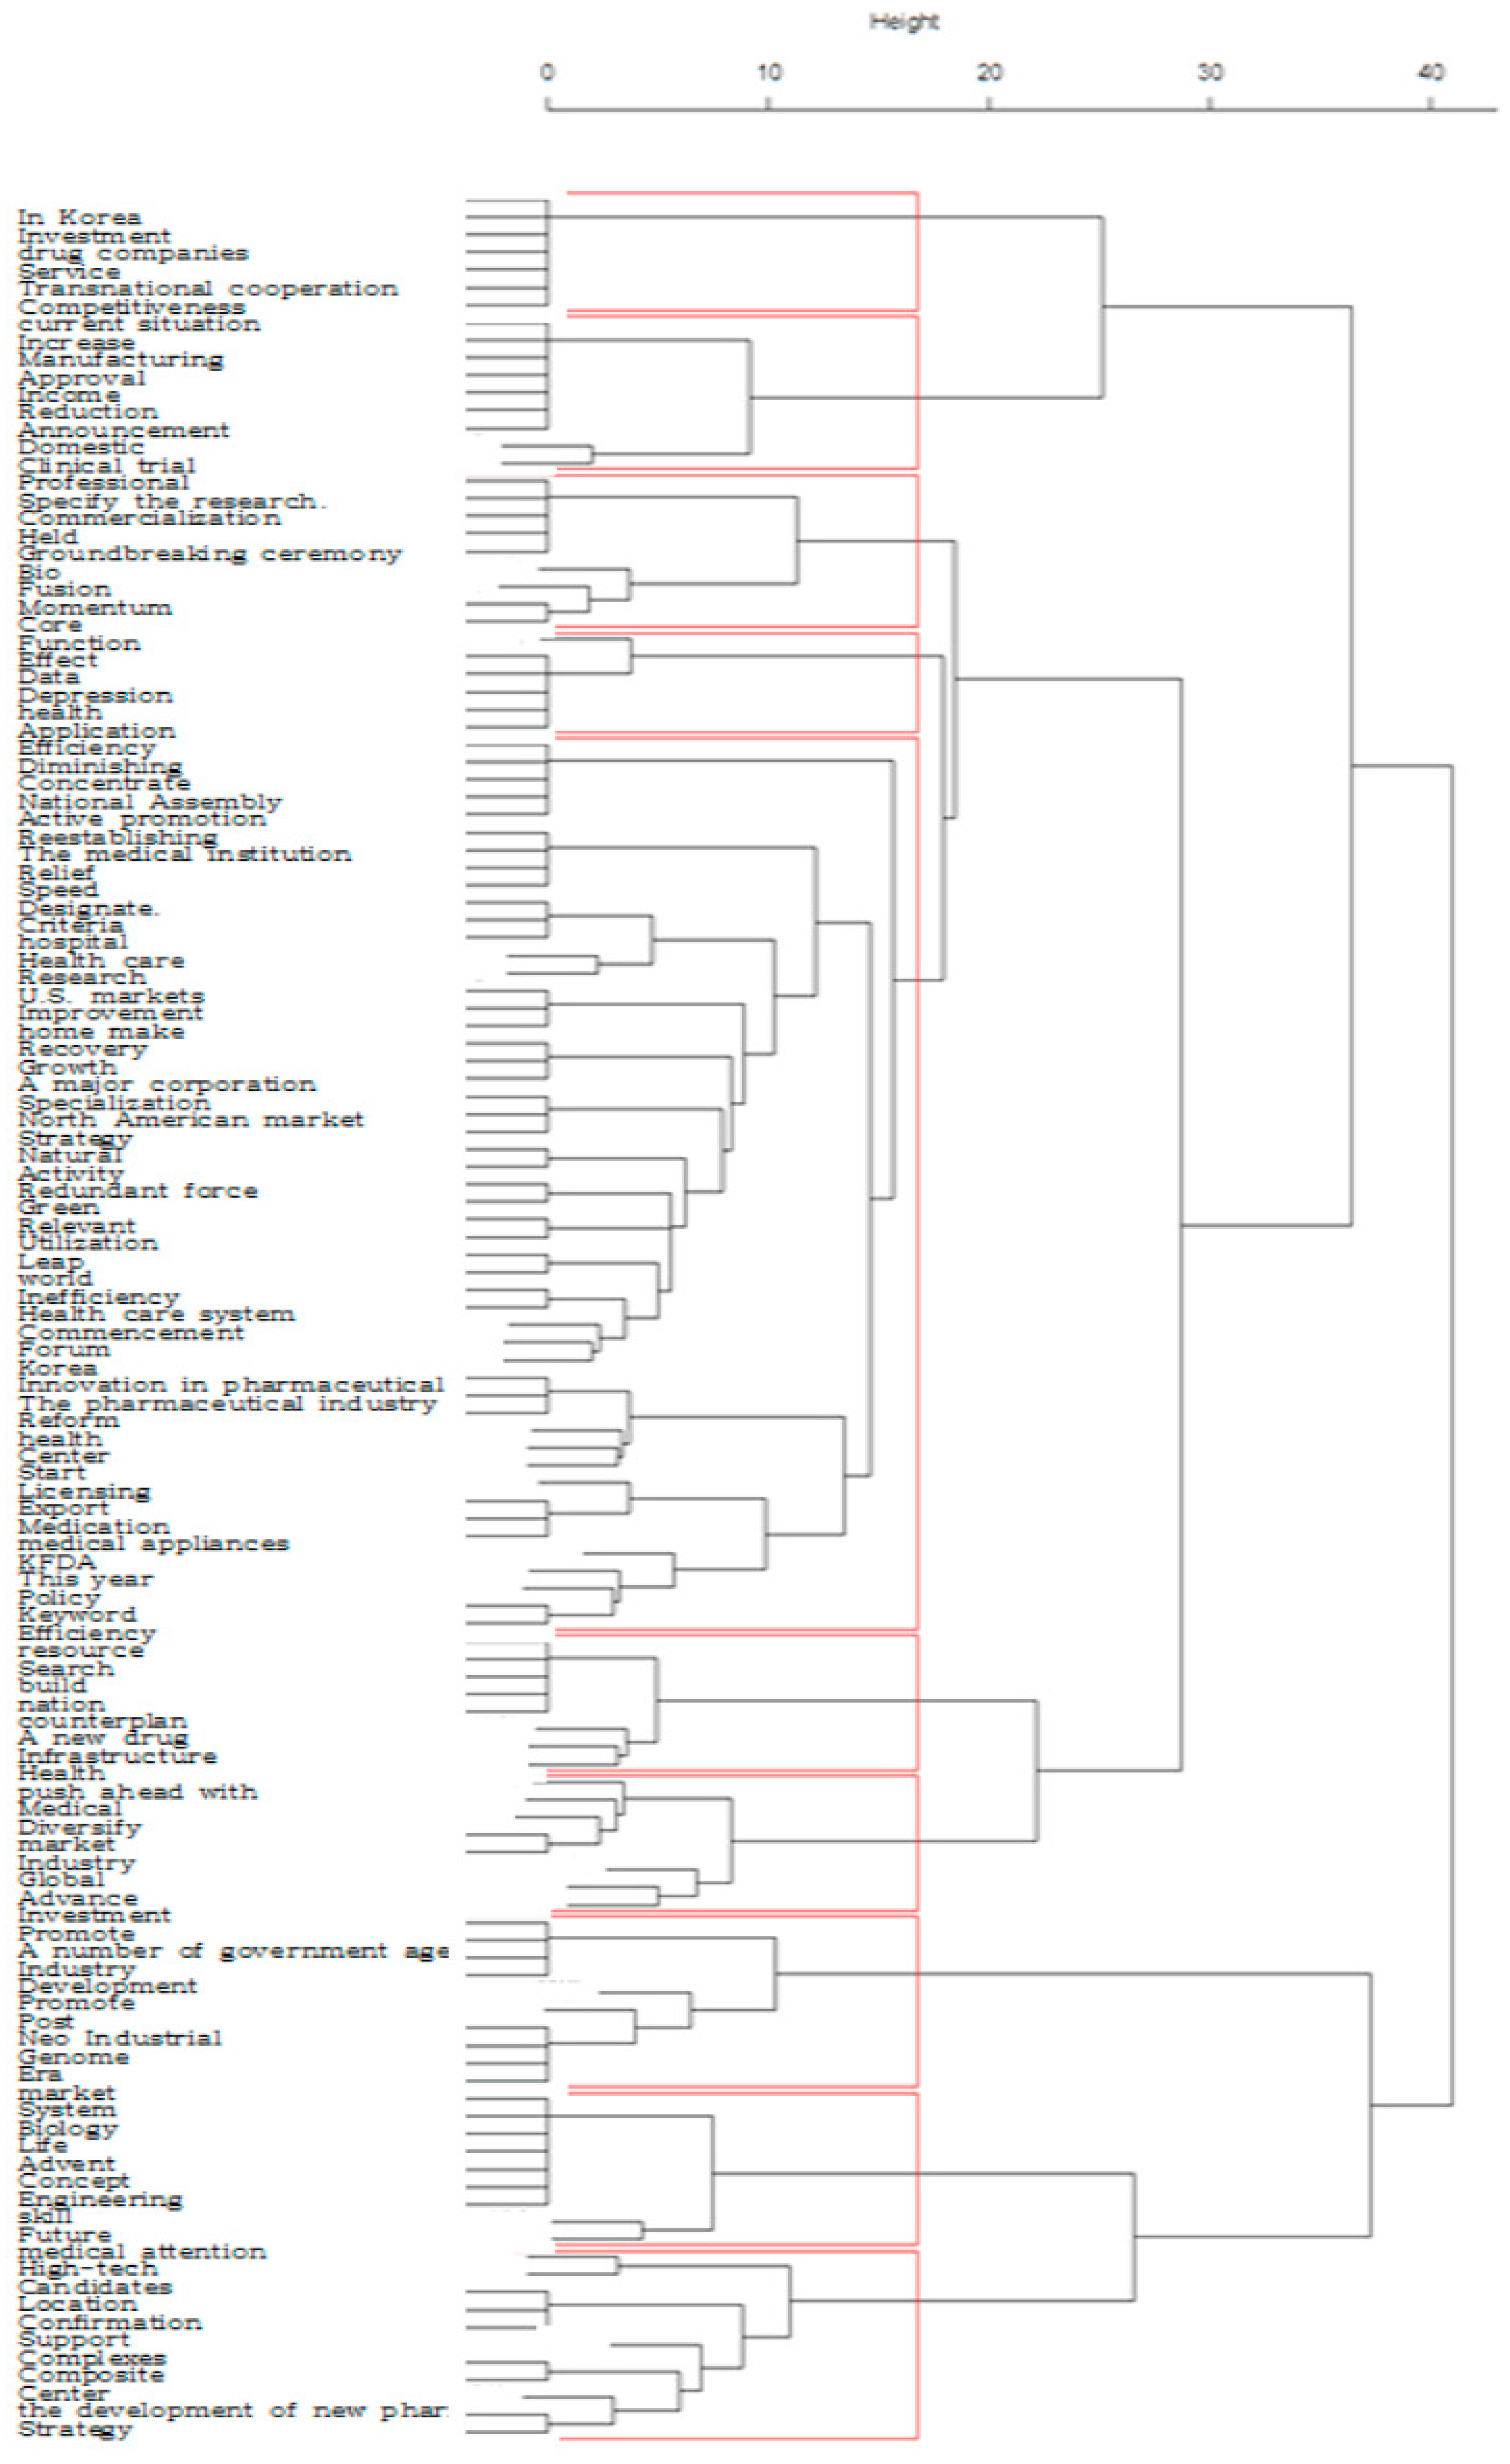
Figure 8.
Hierarchical clustering with Euclidean distance.
Figure 8.
Hierarchical clustering with Euclidean distance.
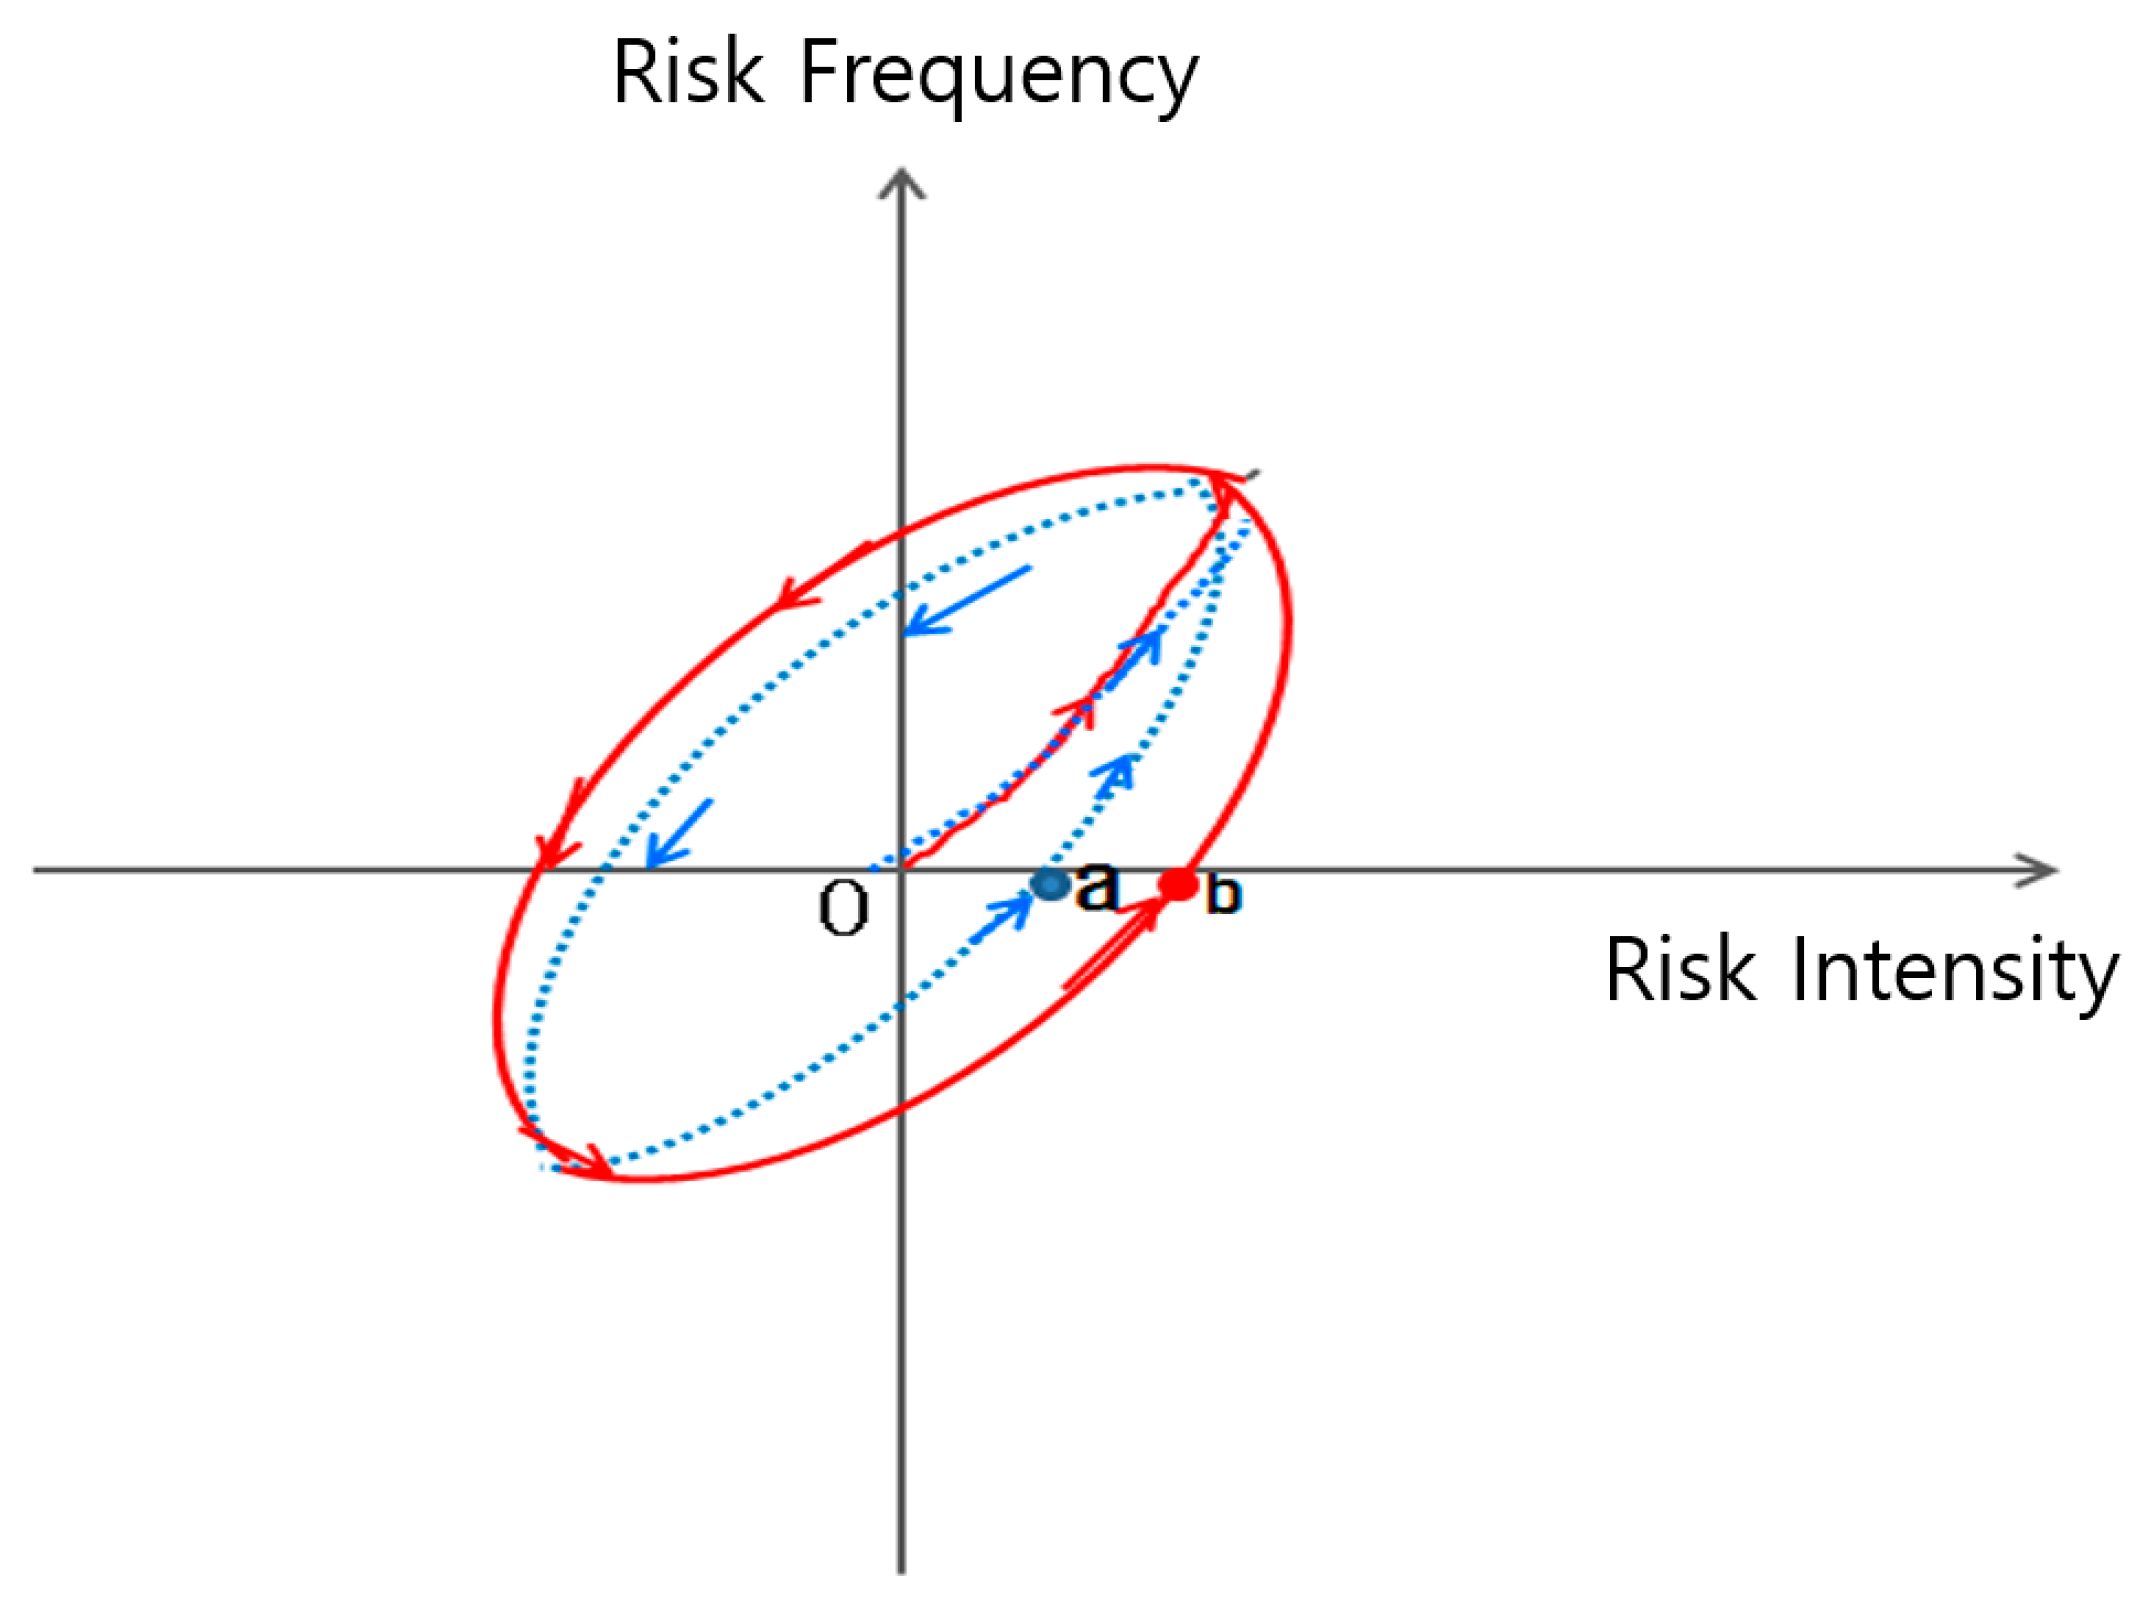
Figure 9.
Conceptual illustration of hysteresis effect.
Figure 9.
Conceptual illustration of hysteresis effect.
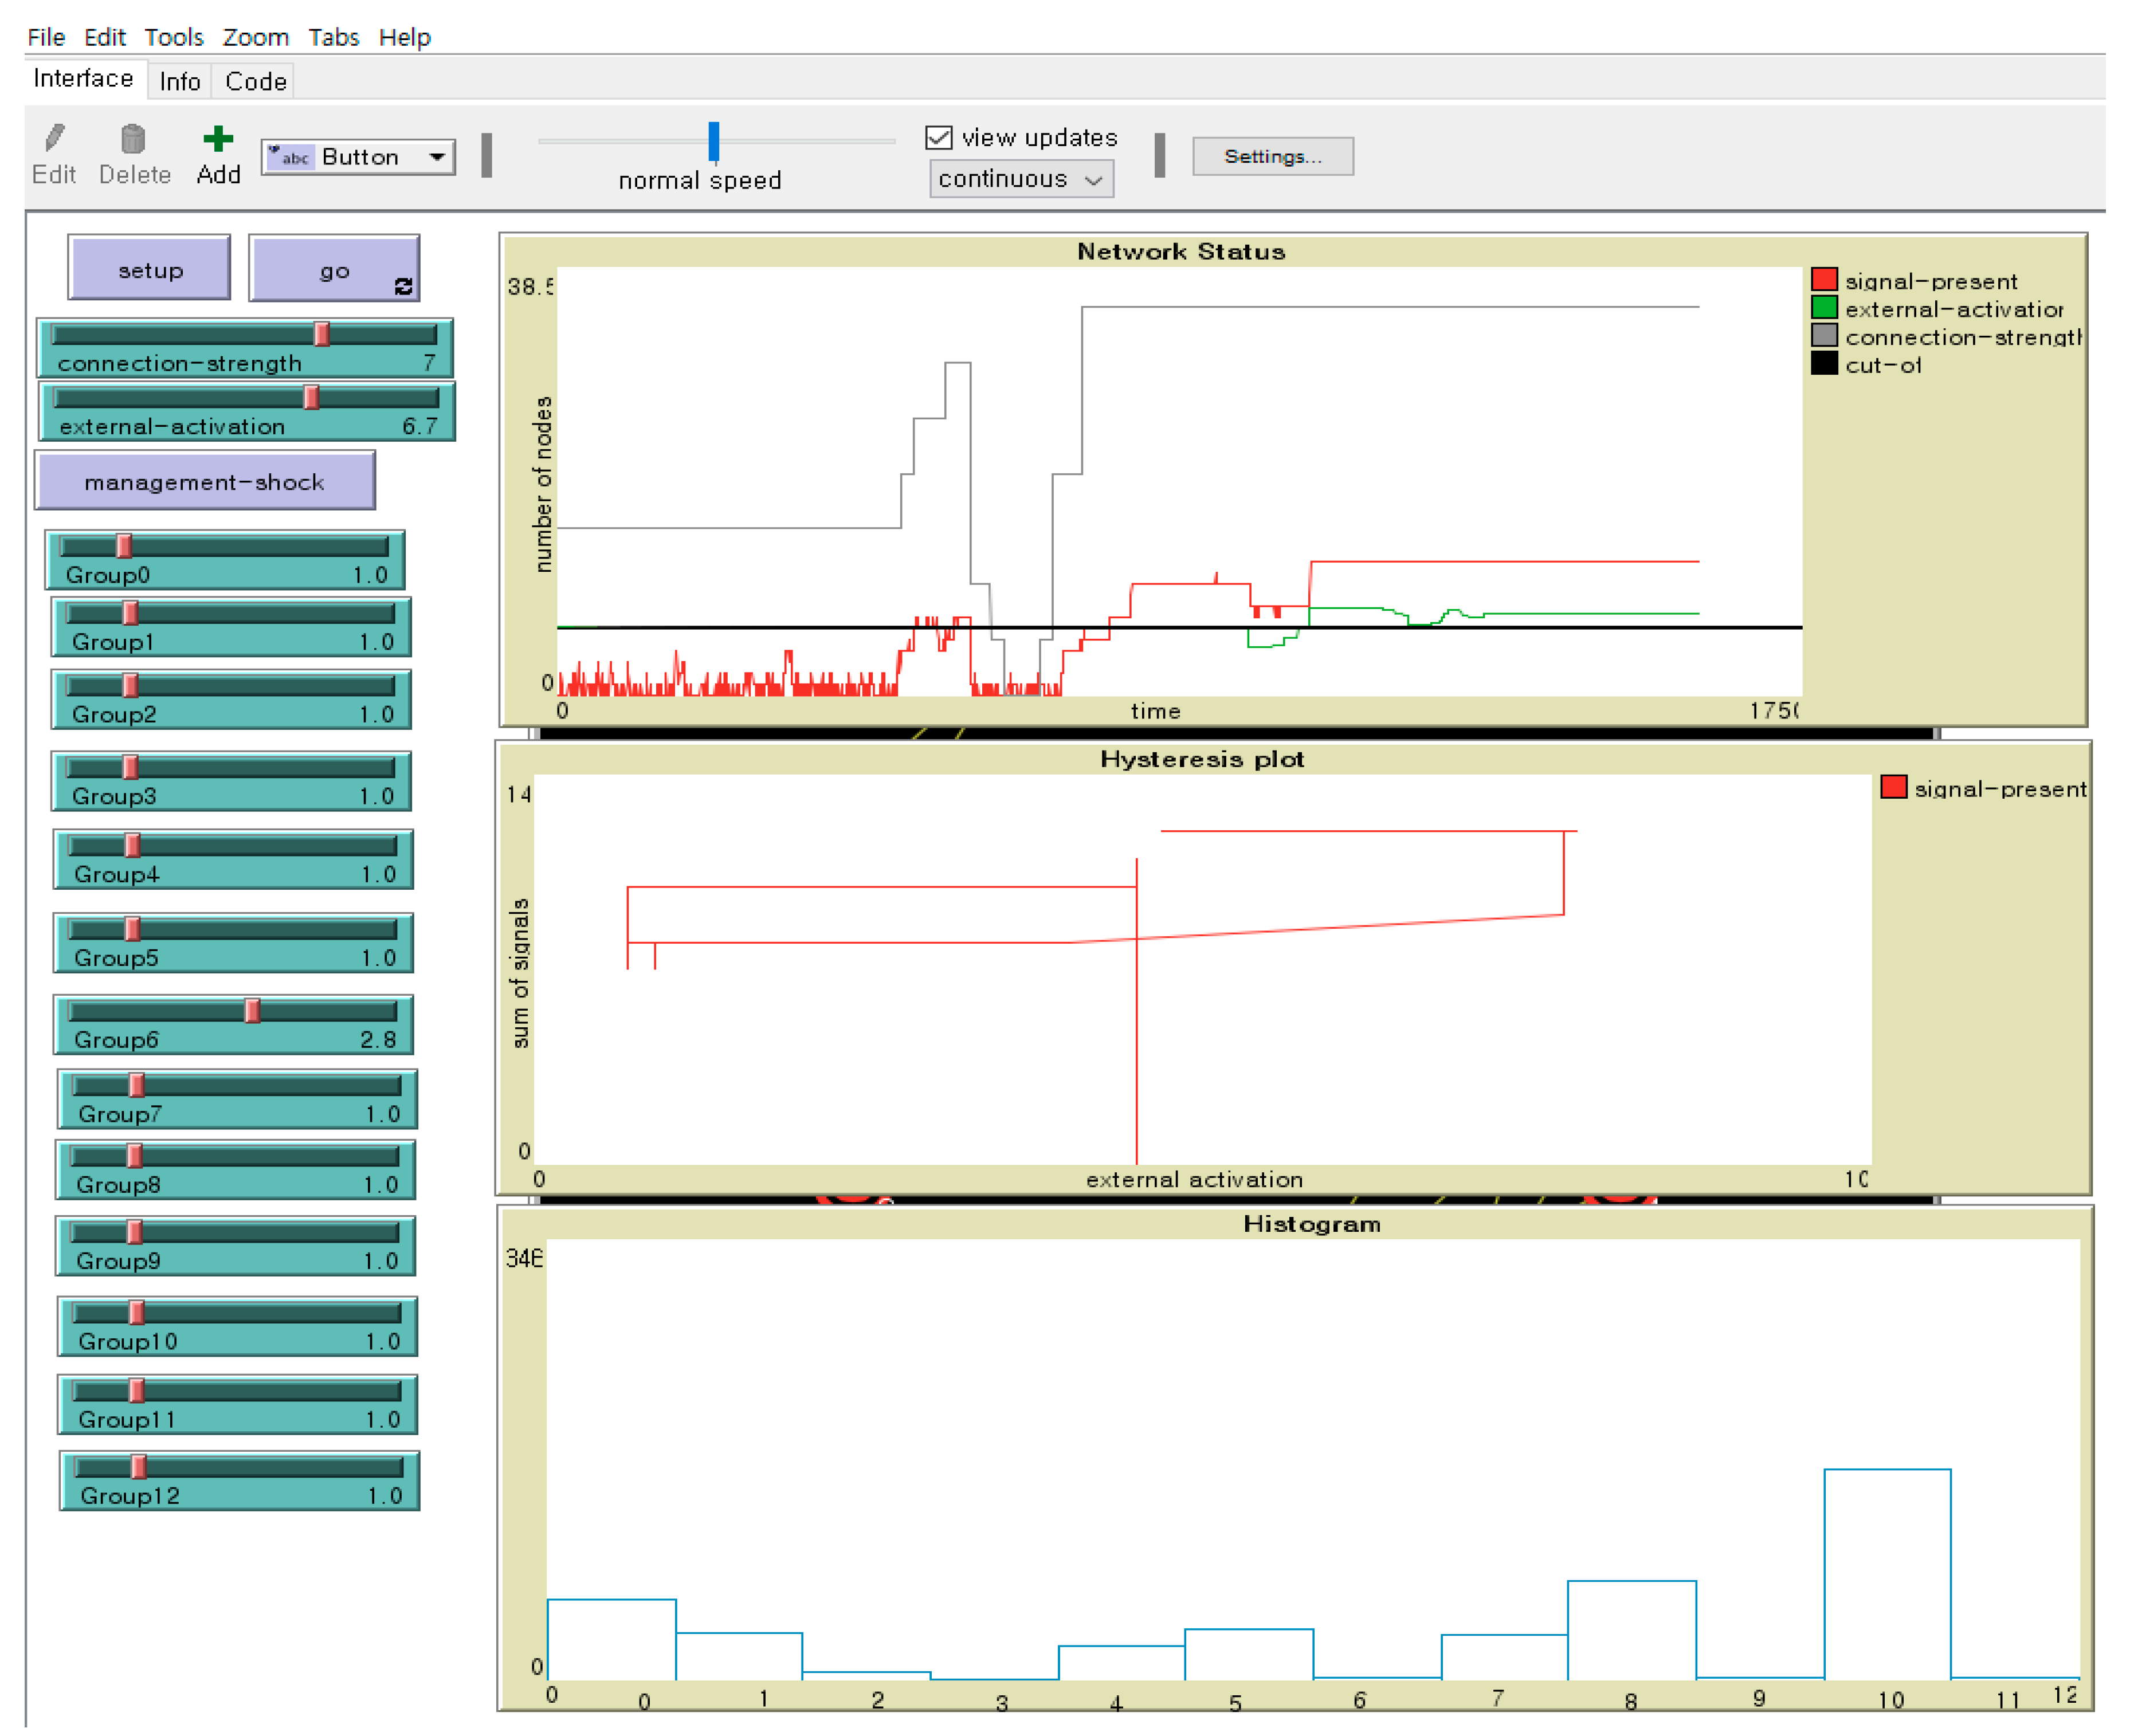
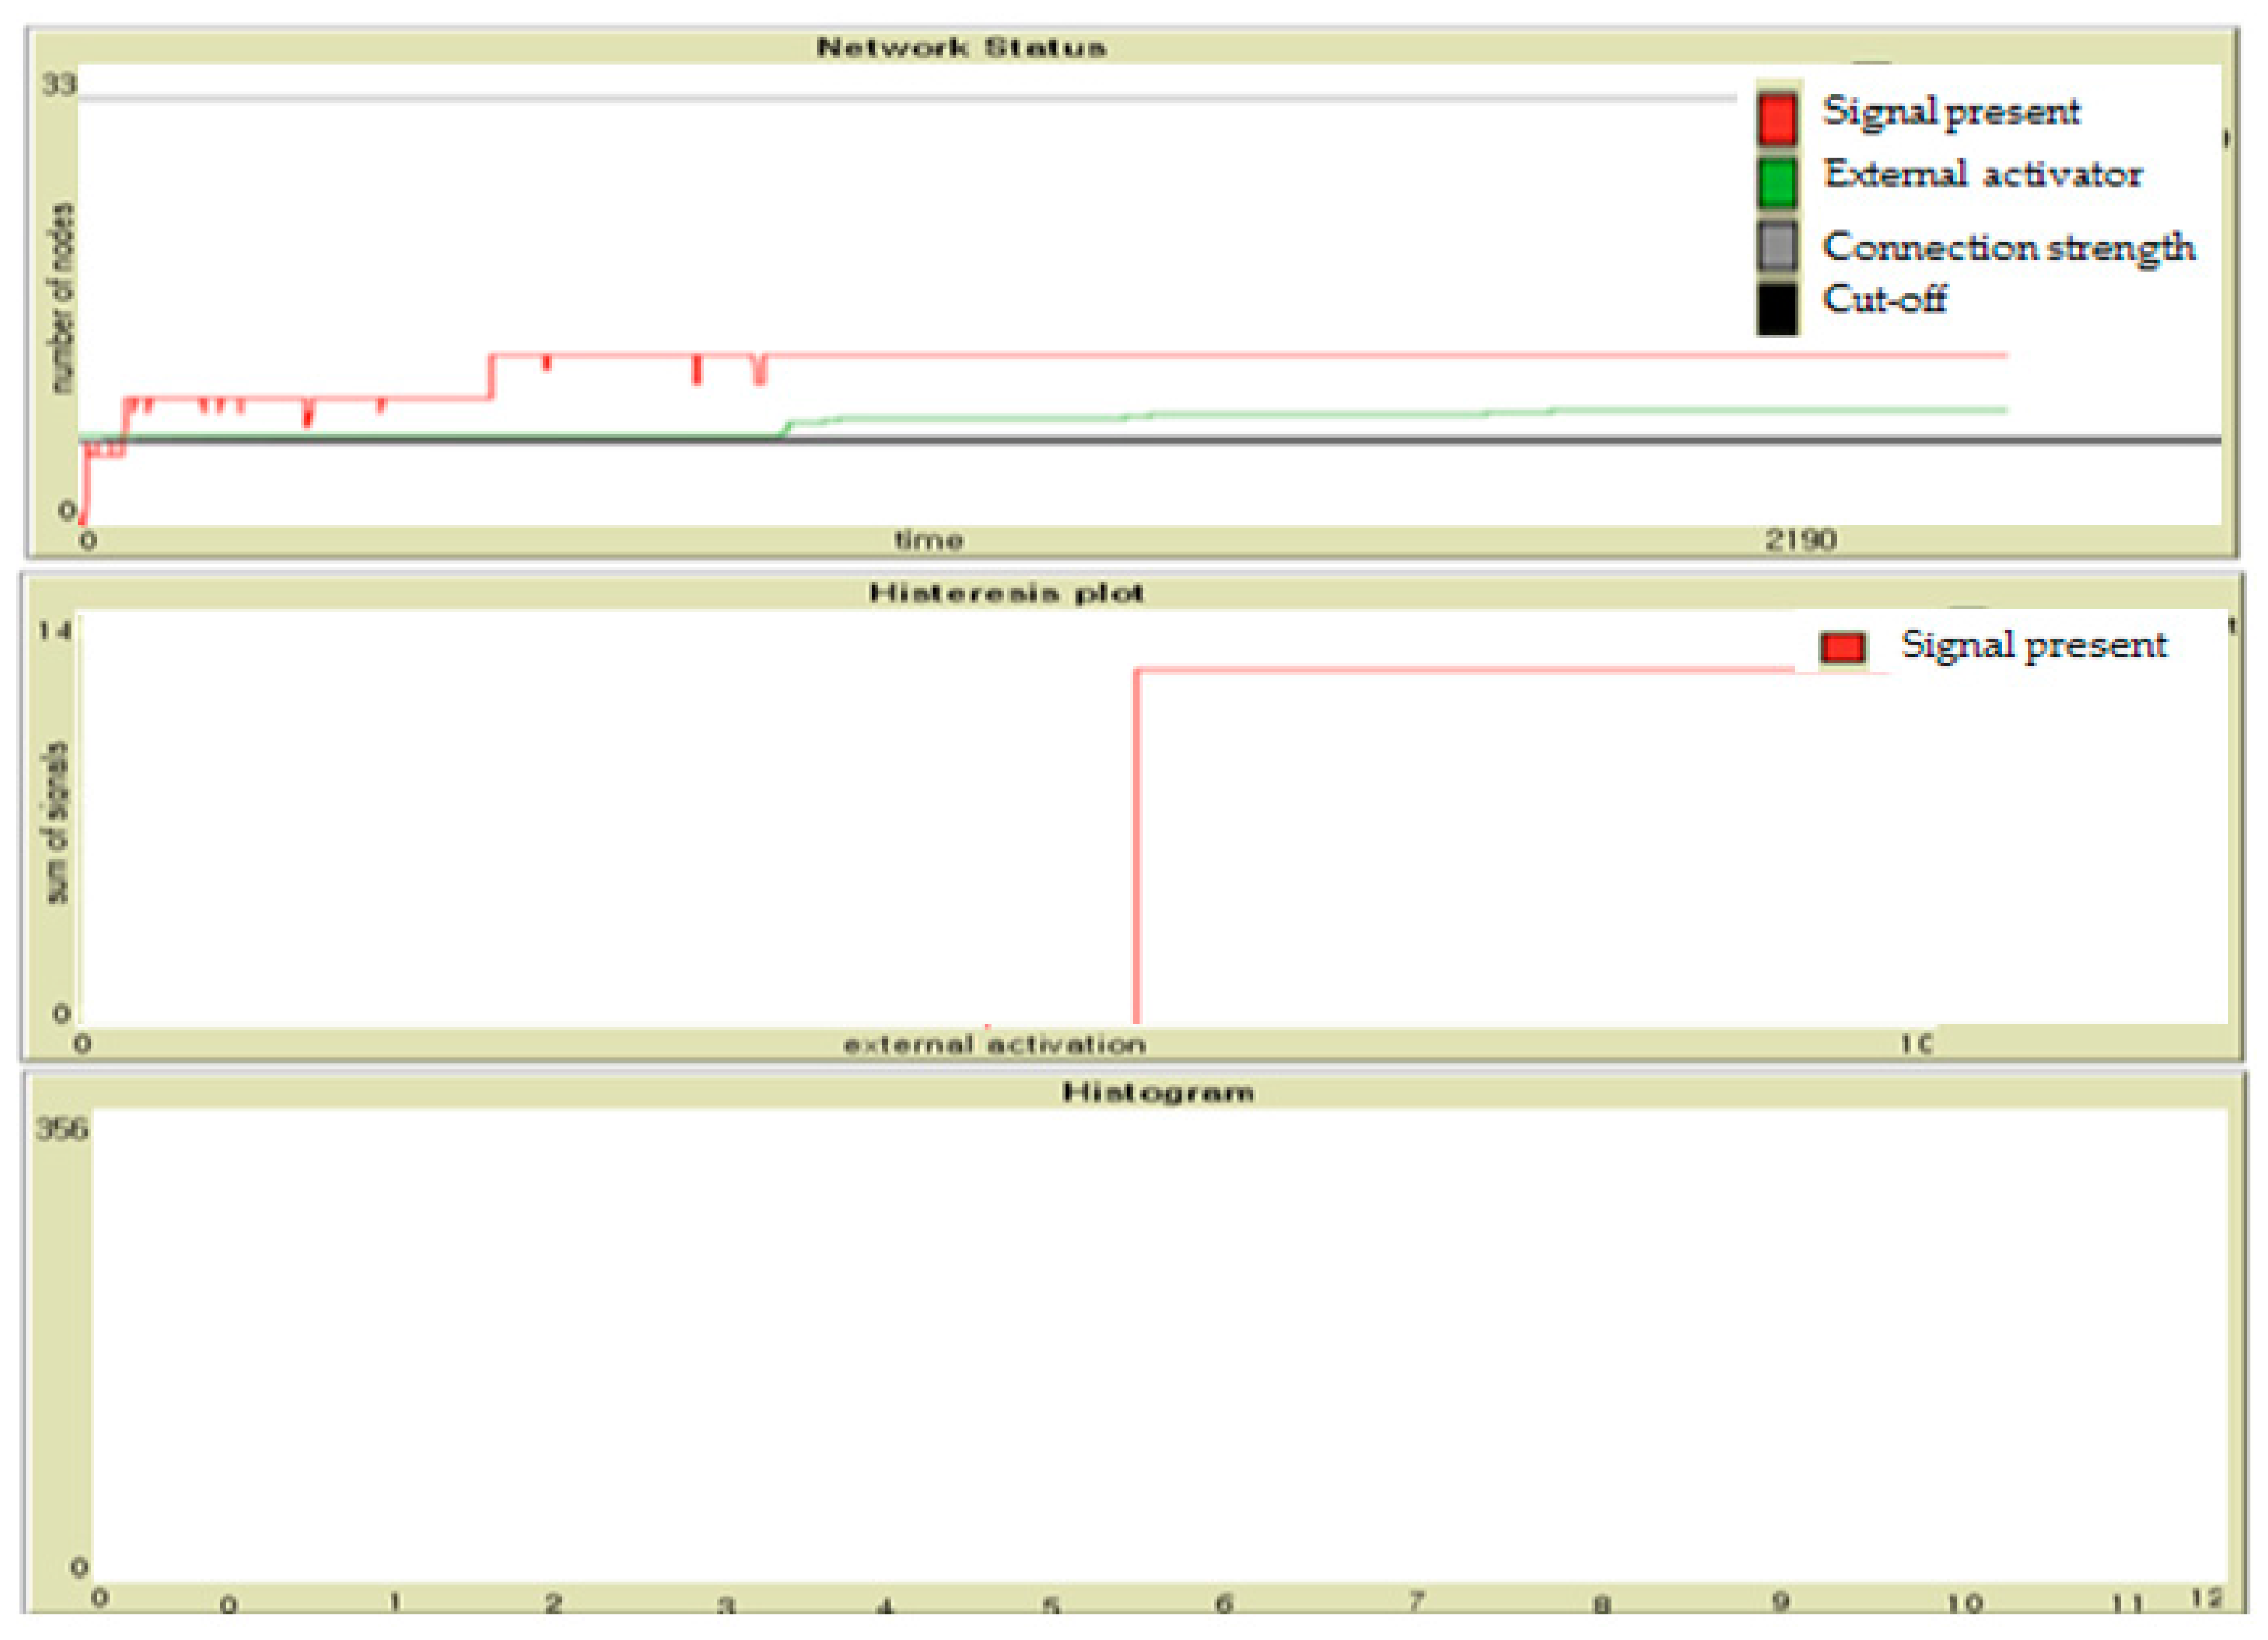
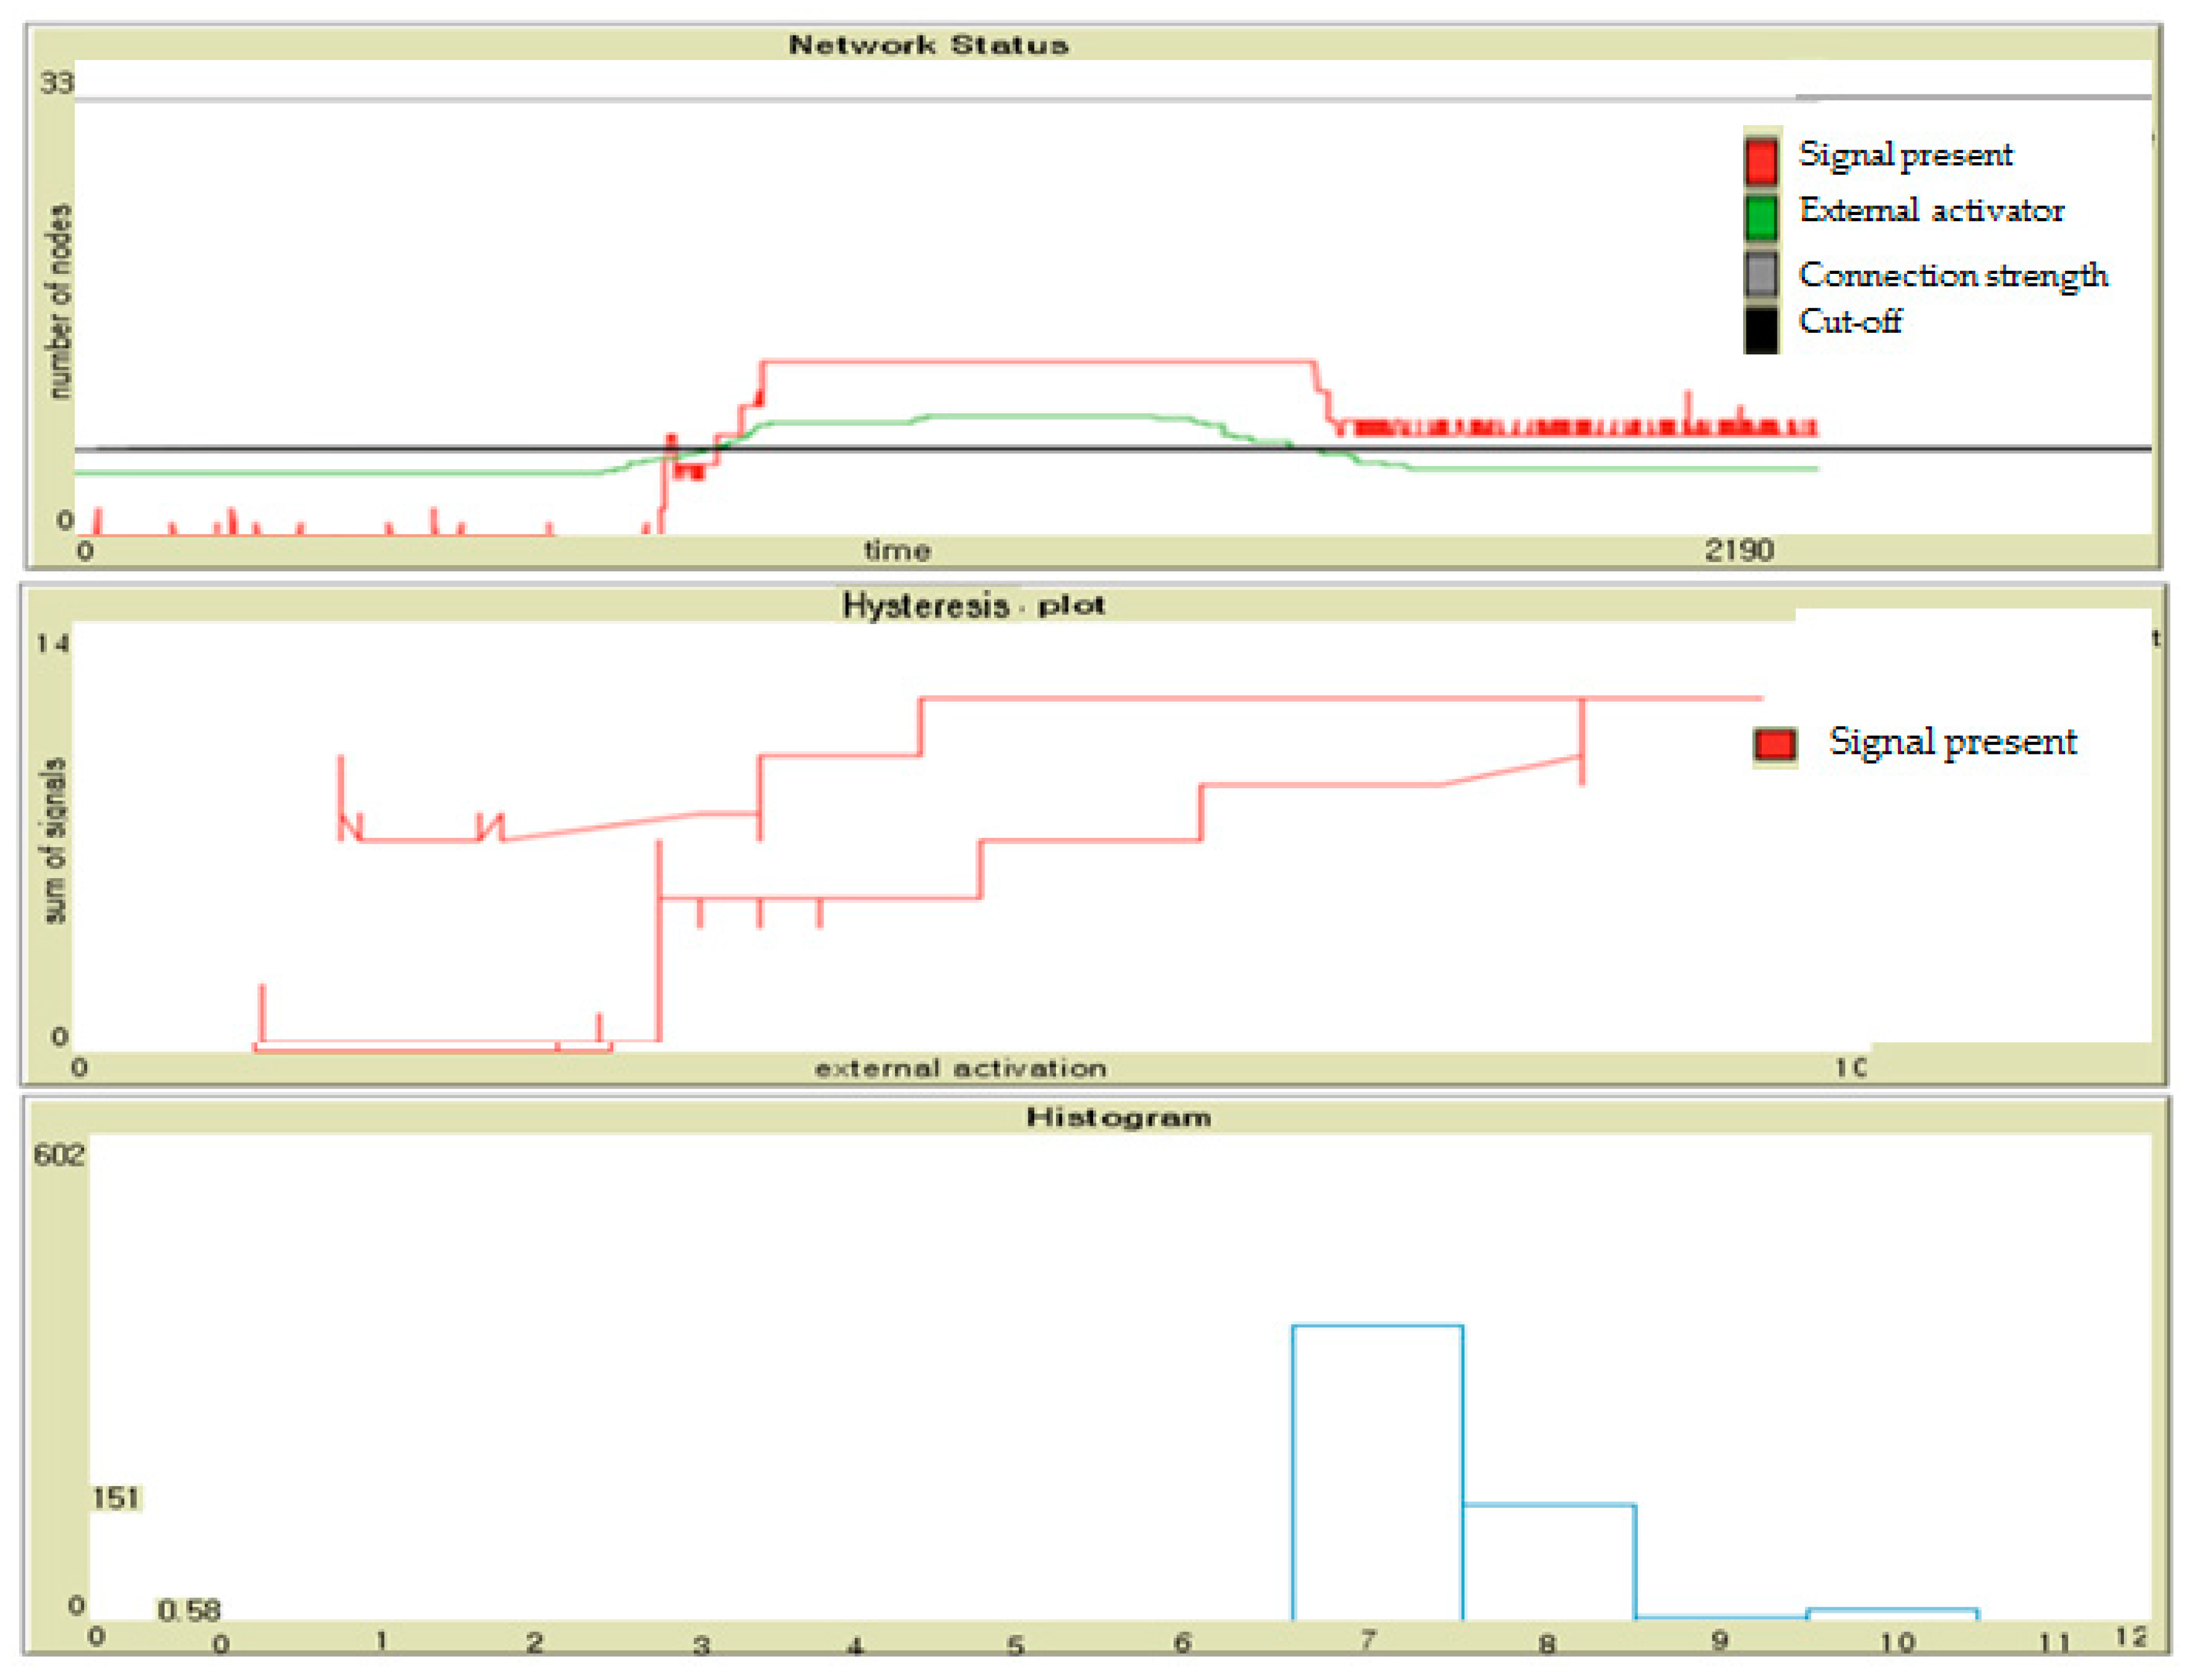
Figure 10.
Screen of simulation model developed by ABM tool NetLogo.
Figure 10.
Screen of simulation model developed by ABM tool NetLogo.
Figure 11.
The case of changing the connection strength between the factors.
Figure 11.
The case of changing the connection strength between the factors.
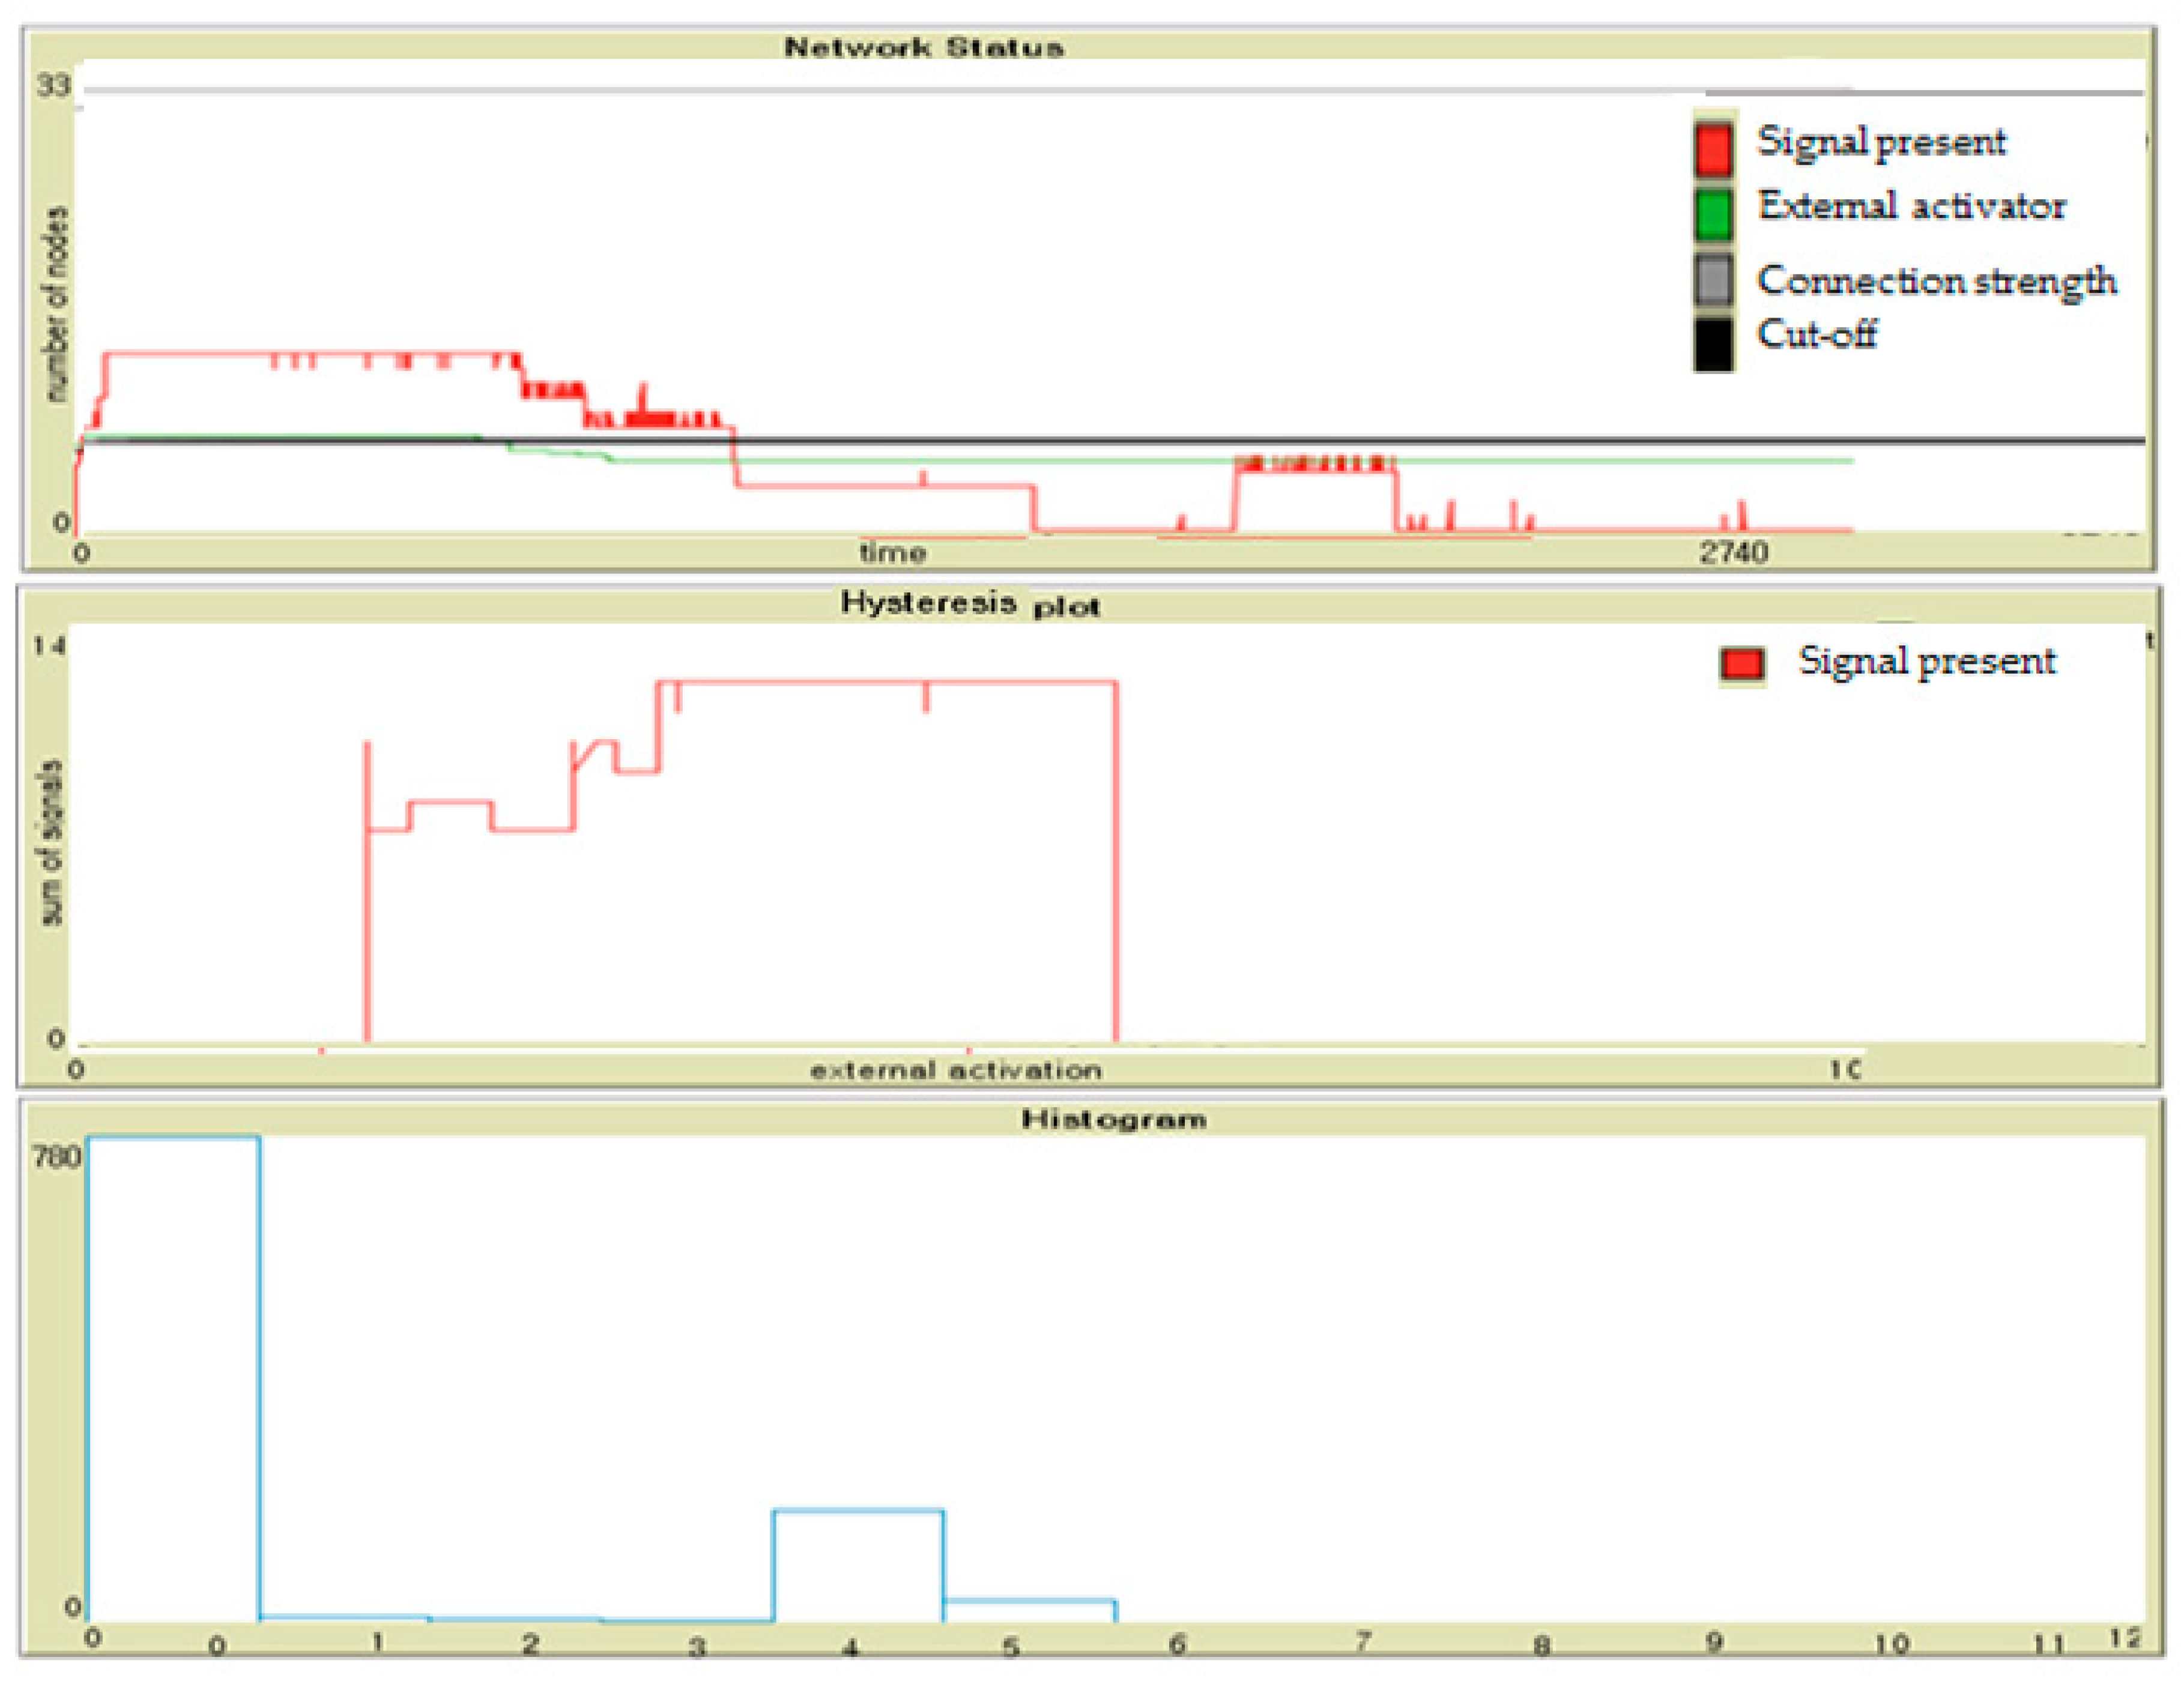
Figure 12.
Comparison of hysteresis between factors when the external impact is weak.
Figure 12.
Comparison of hysteresis between factors when the external impact is weak.
Figure 13.
Comparison of hysteresis between factors when the external impact is strong.
Figure 13.
Comparison of hysteresis between factors when the external impact is strong.
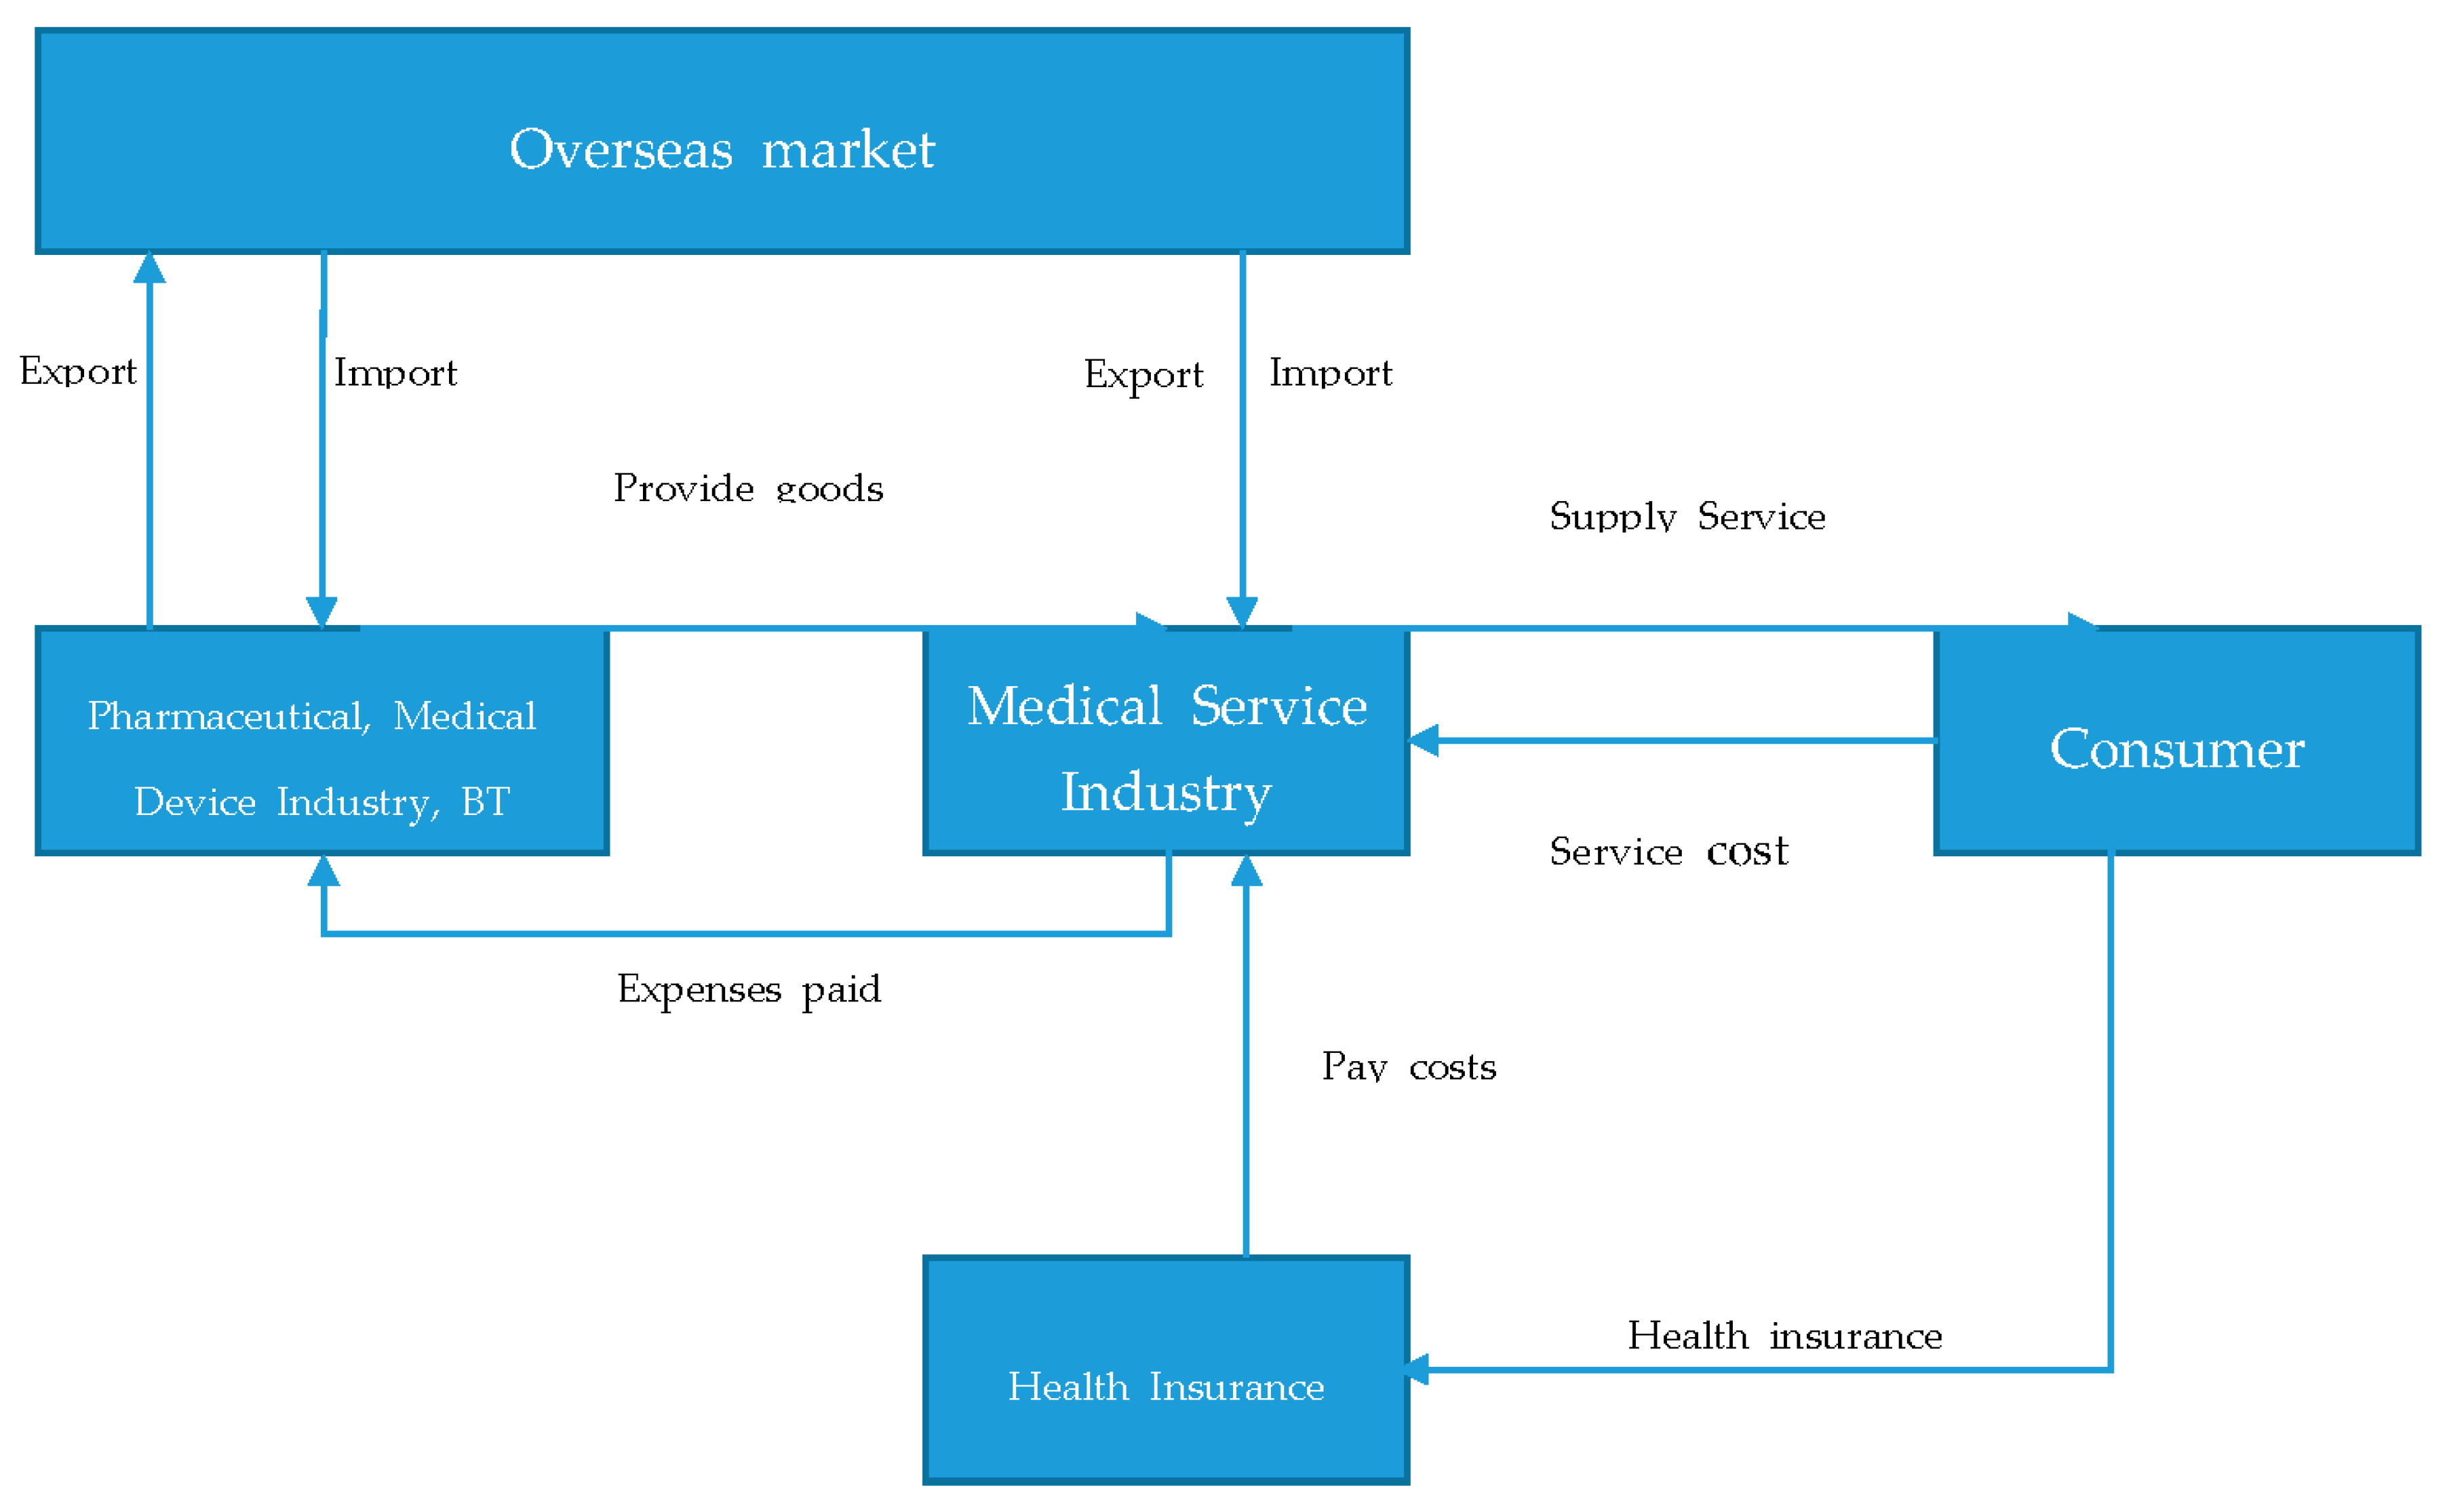
Figure 14.
Healthcare systems in South Korea.
Figure 14.
Healthcare systems in South Korea.
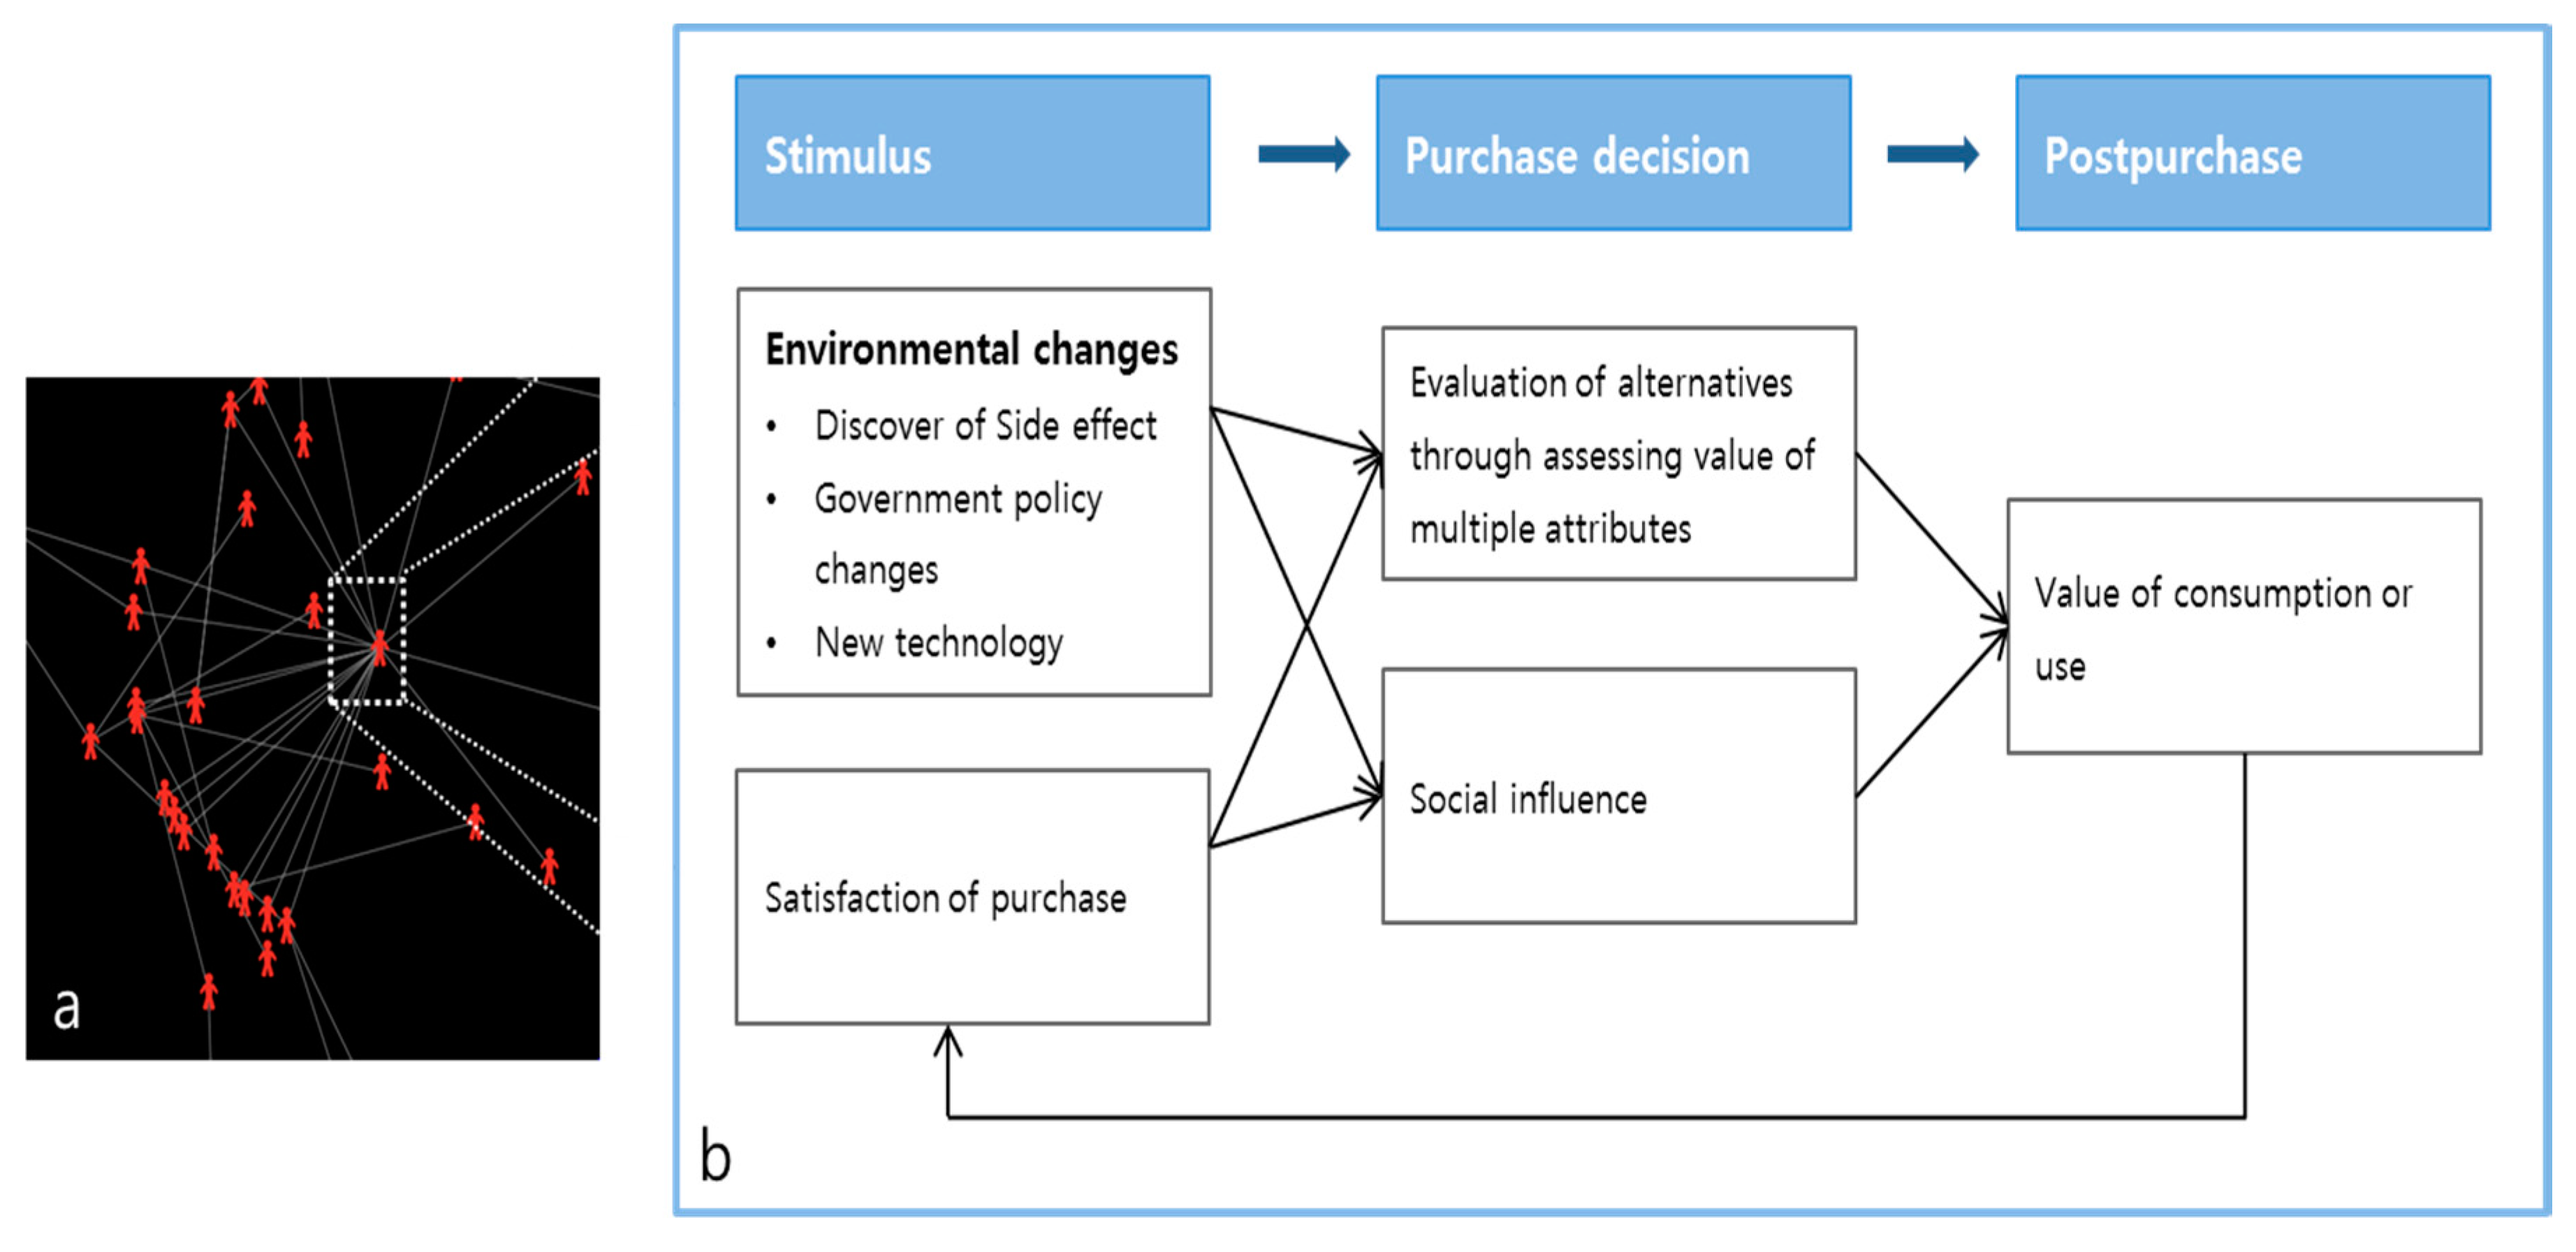
Figure 15.
A consumer’s purchasing decision process. (a) The model environment within which individual’s purchasing decisions are made in social activities; (b) at the individual level, each customer has personal sensitivity to each attribute (price, brand, drug efficiency, convenience, etc.). Purchasing decisions and purchasing behavior were influenced by these individual characteristics and other people’s stimuli within their social network system.
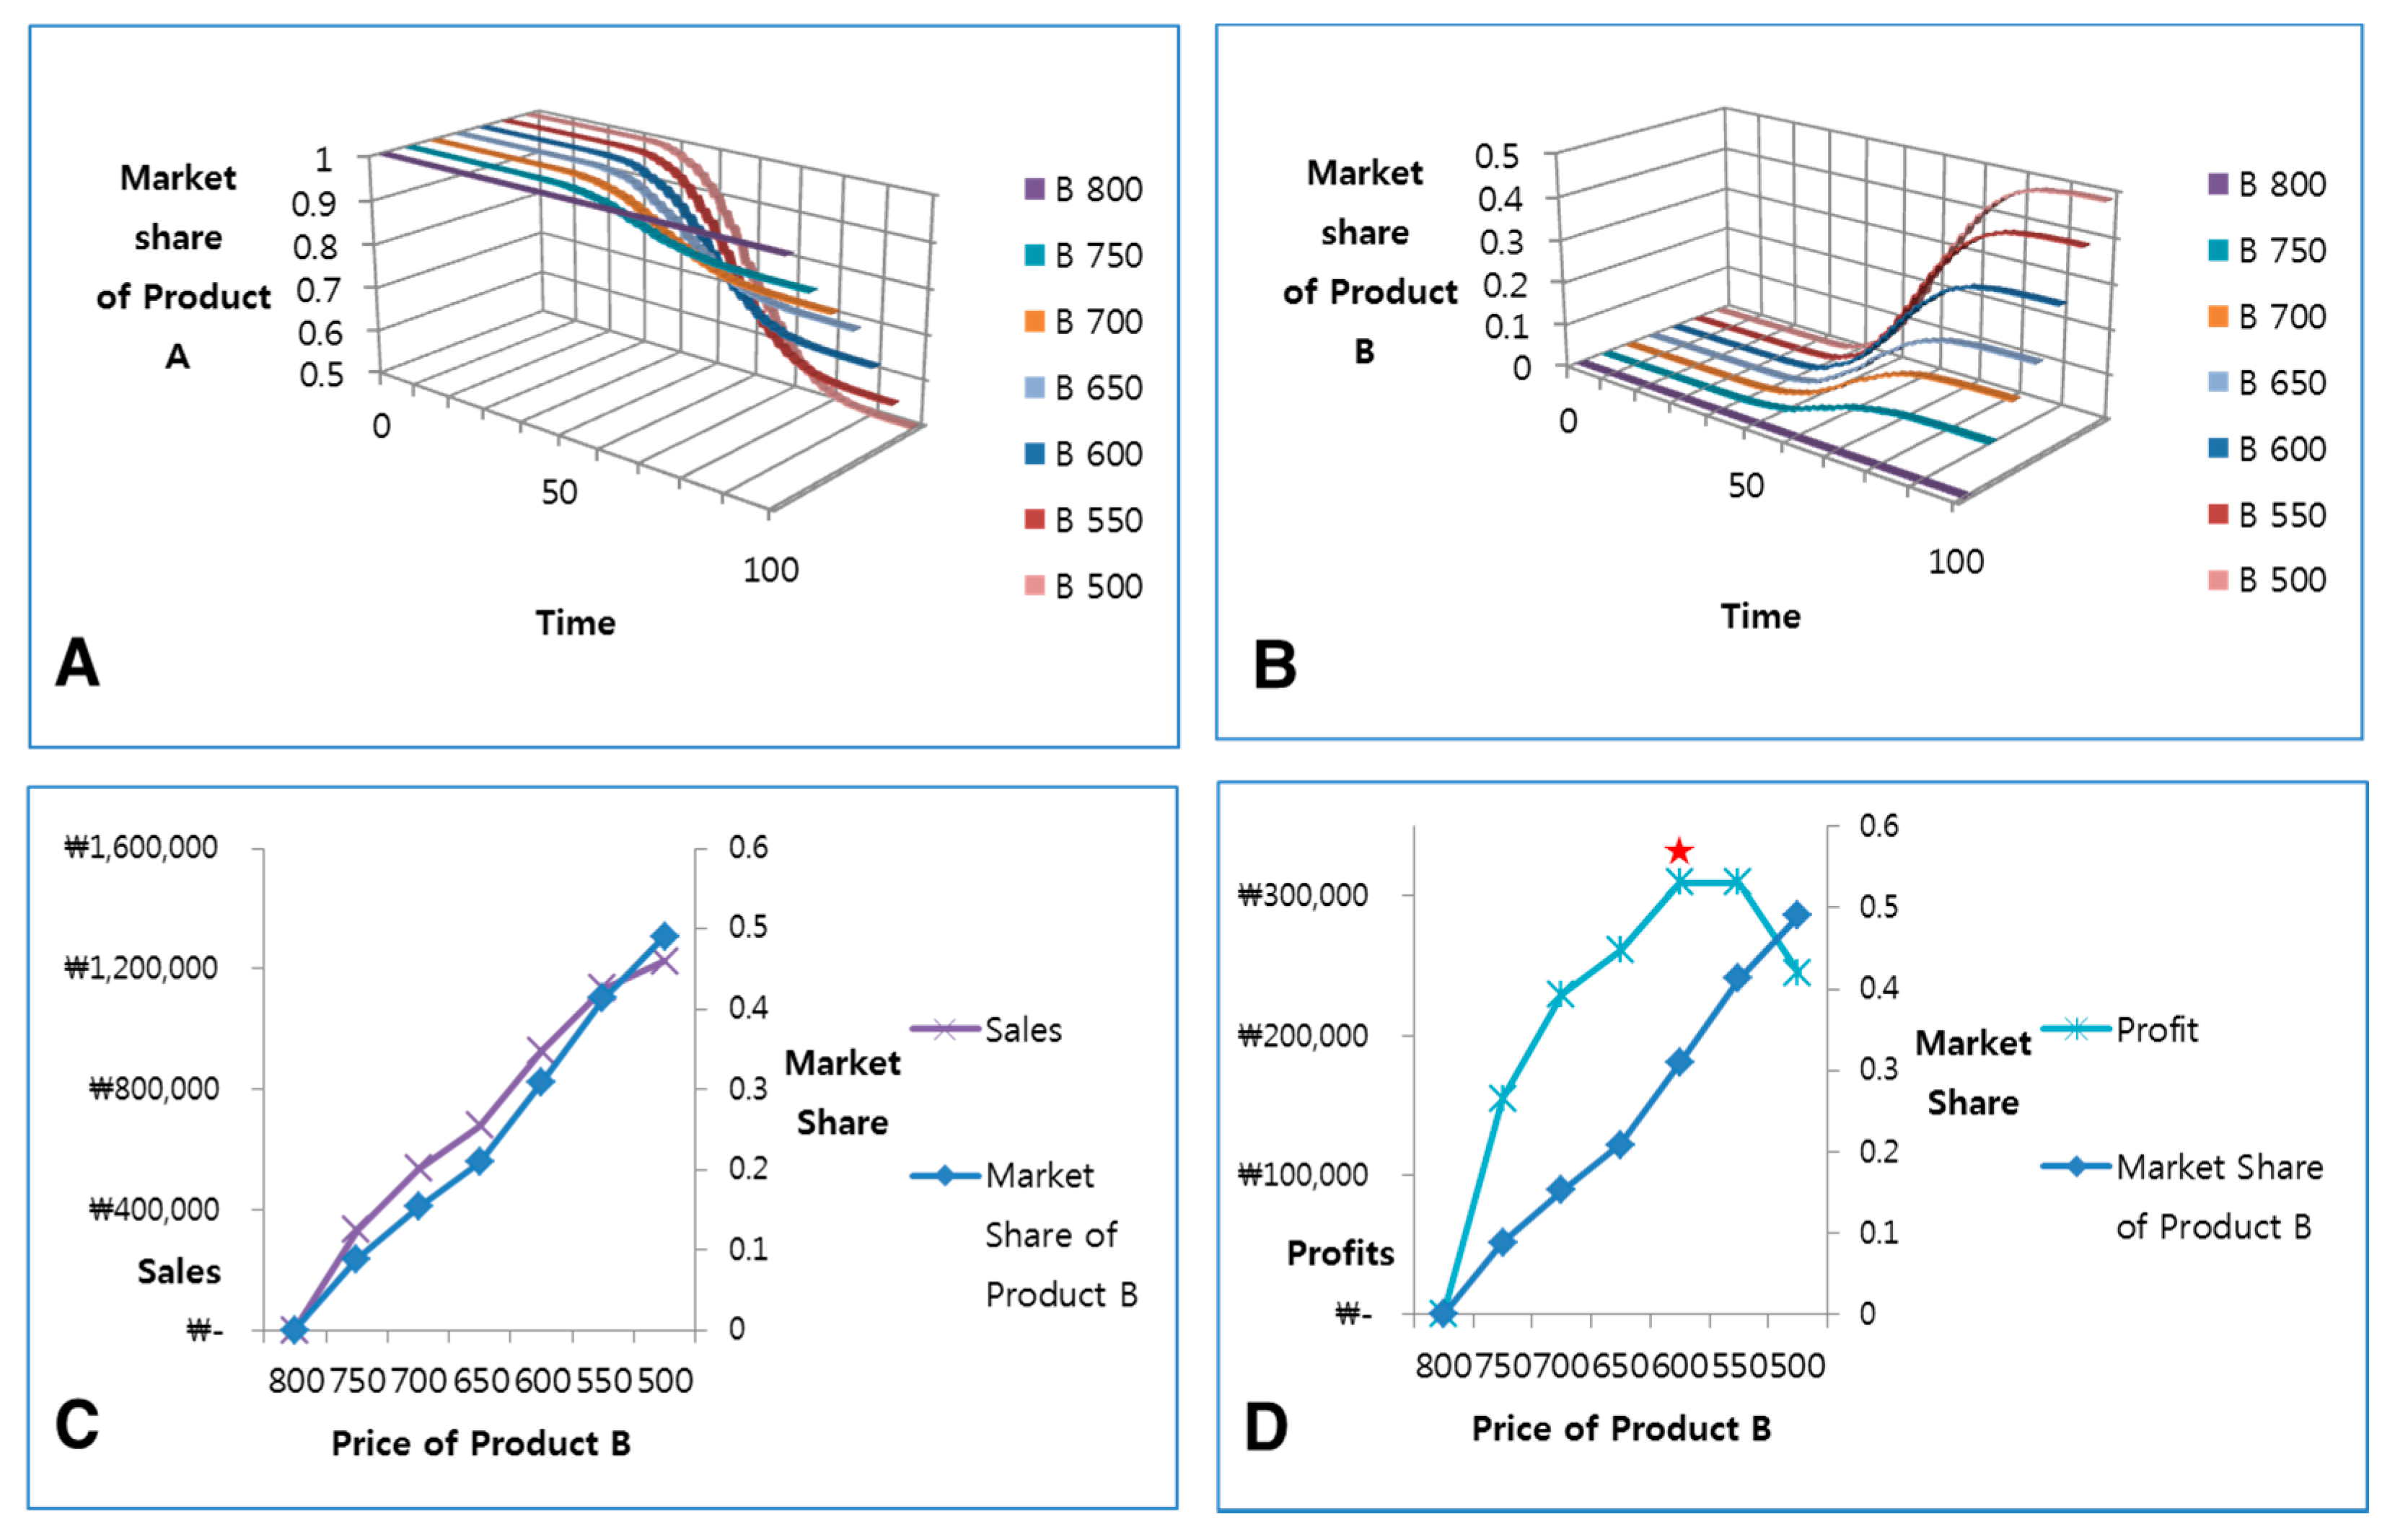
Figure 16.
Changes of market share of Product A (A) and Product B (B) according to the price changes of Product B (low-price product, which entered market). Changes of market share, sales (C), and profits (D) of Product B in several conditions of Product B.
Figure 16.
Changes of market share of Product A (A) and Product B (B) according to the price changes of Product B (low-price product, which entered market). Changes of market share, sales (C), and profits (D) of Product B in several conditions of Product B.
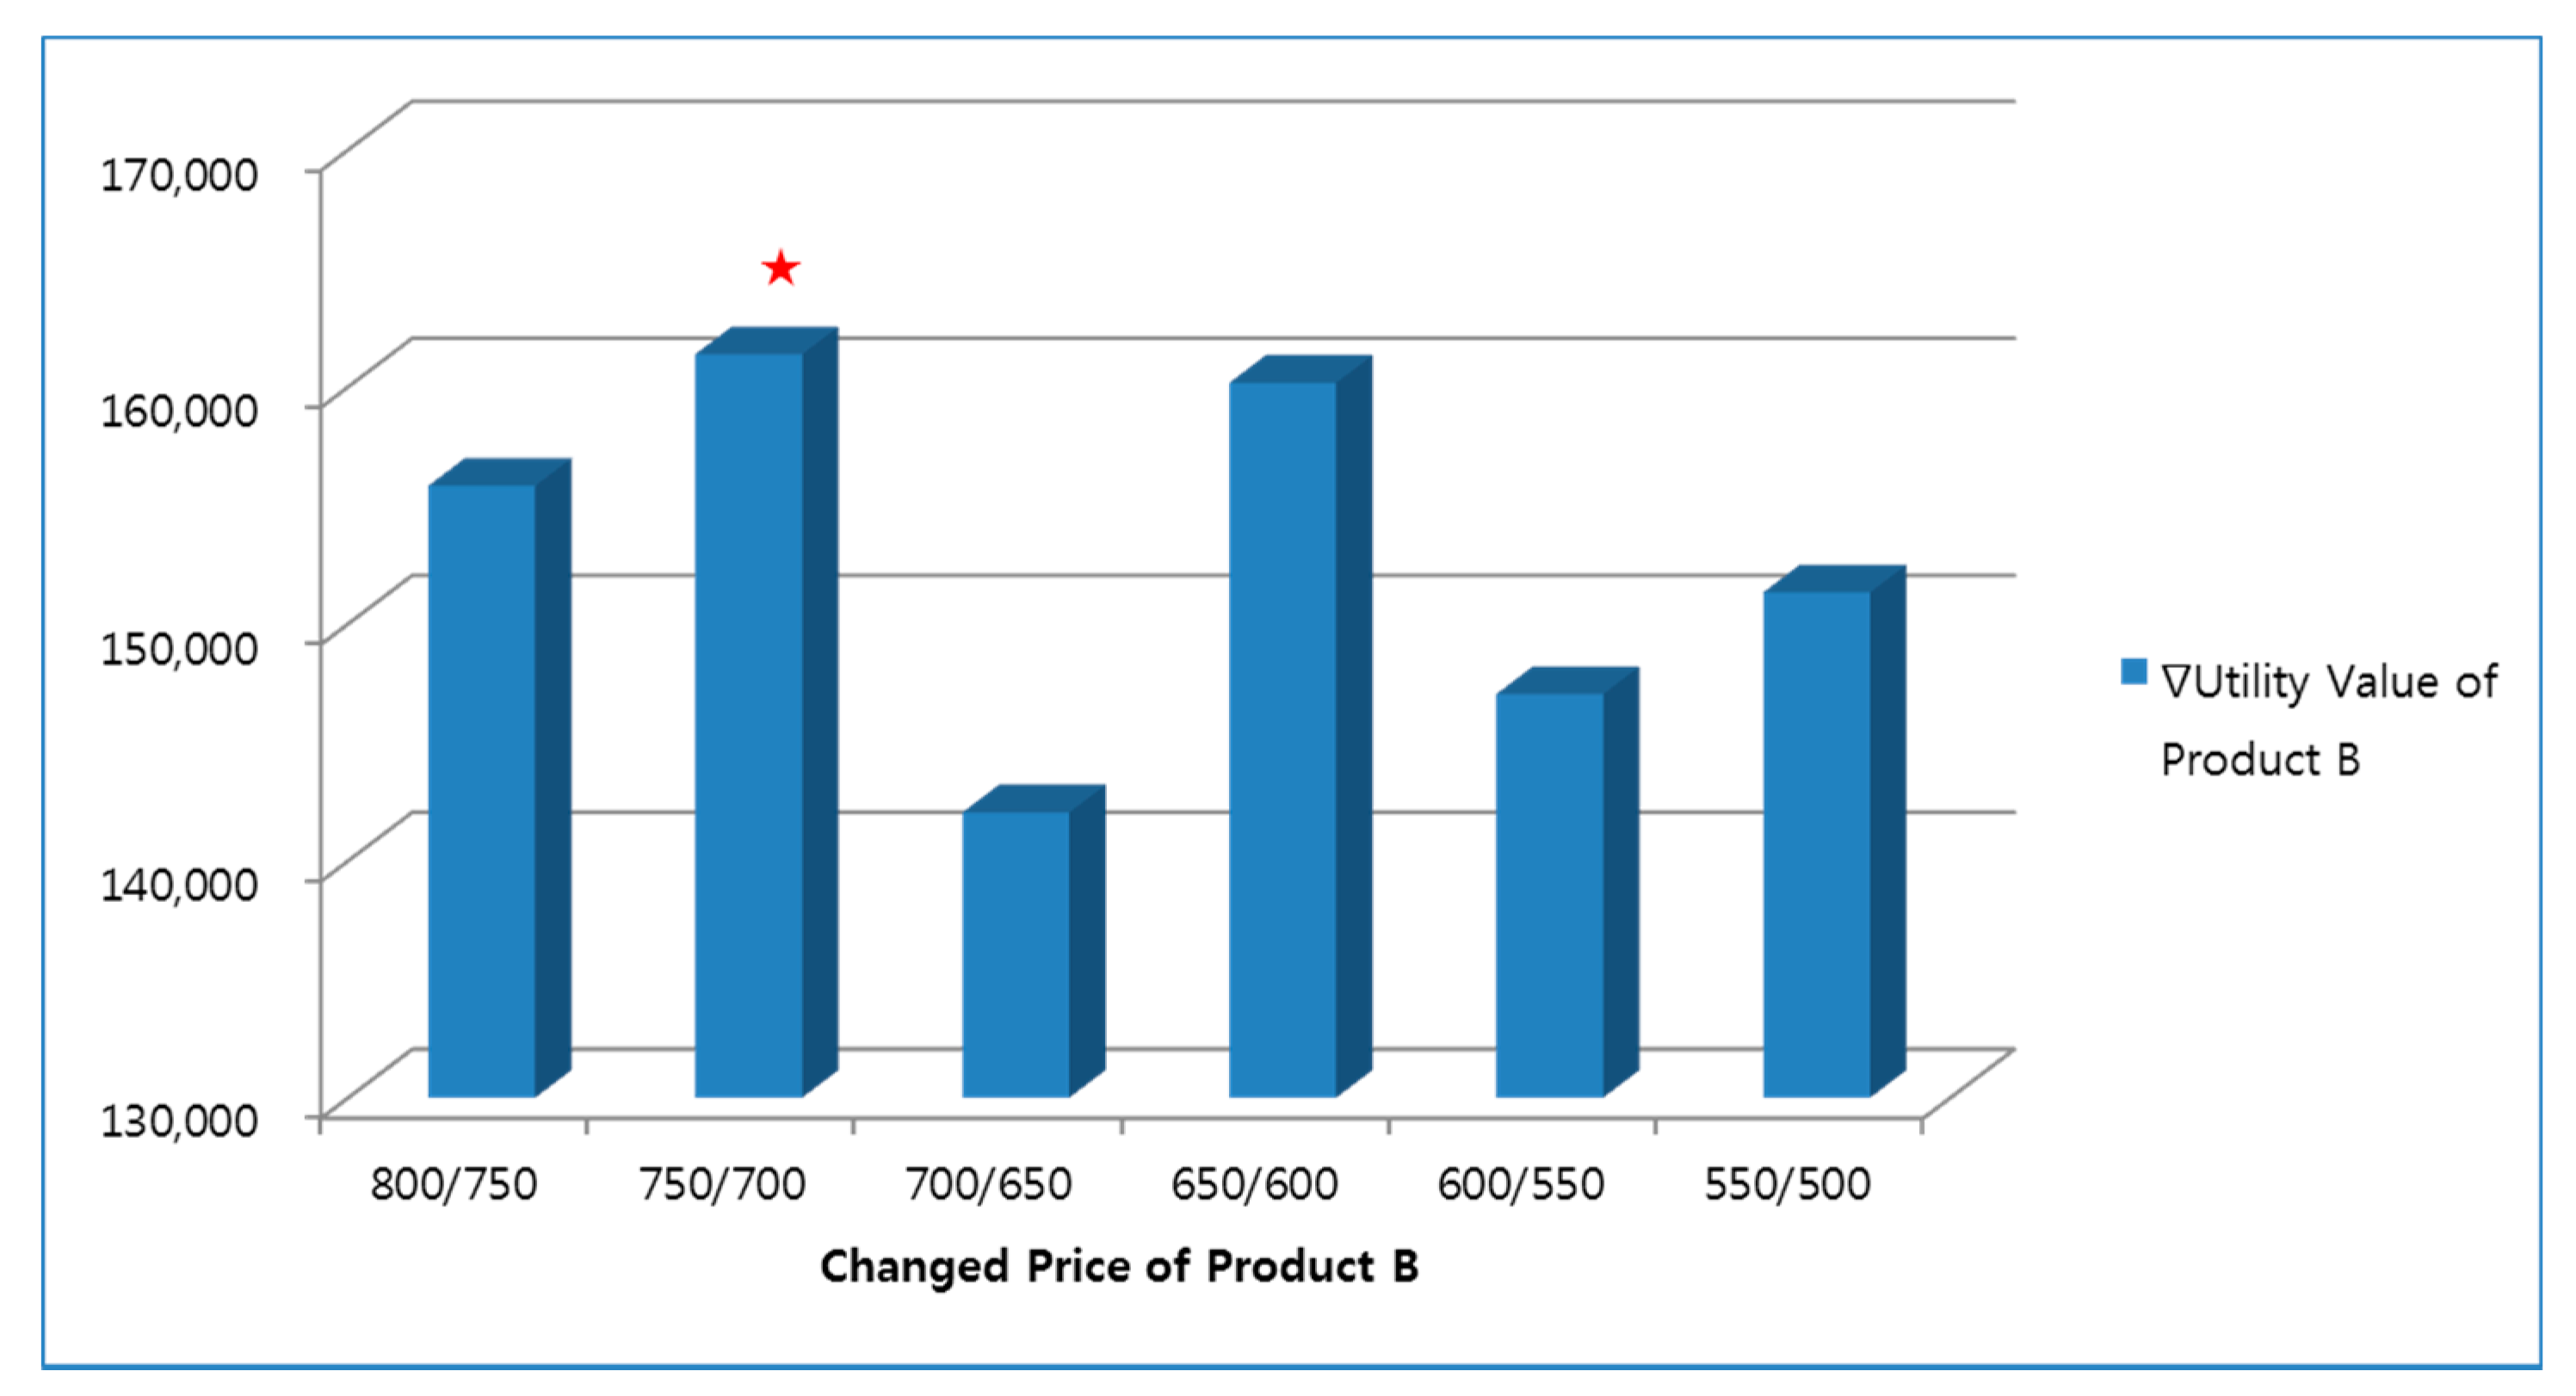
Figure 17.
The sum of utility values for Product B in a society, according to the changes in price of Product B by introducing a pricing policy. When the price was dropped from 750 won to 700 won, the increase of utility values for members of society was highest (red star).
Figure 17.
The sum of utility values for Product B in a society, according to the changes in price of Product B by introducing a pricing policy. When the price was dropped from 750 won to 700 won, the increase of utility values for members of society was highest (red star).
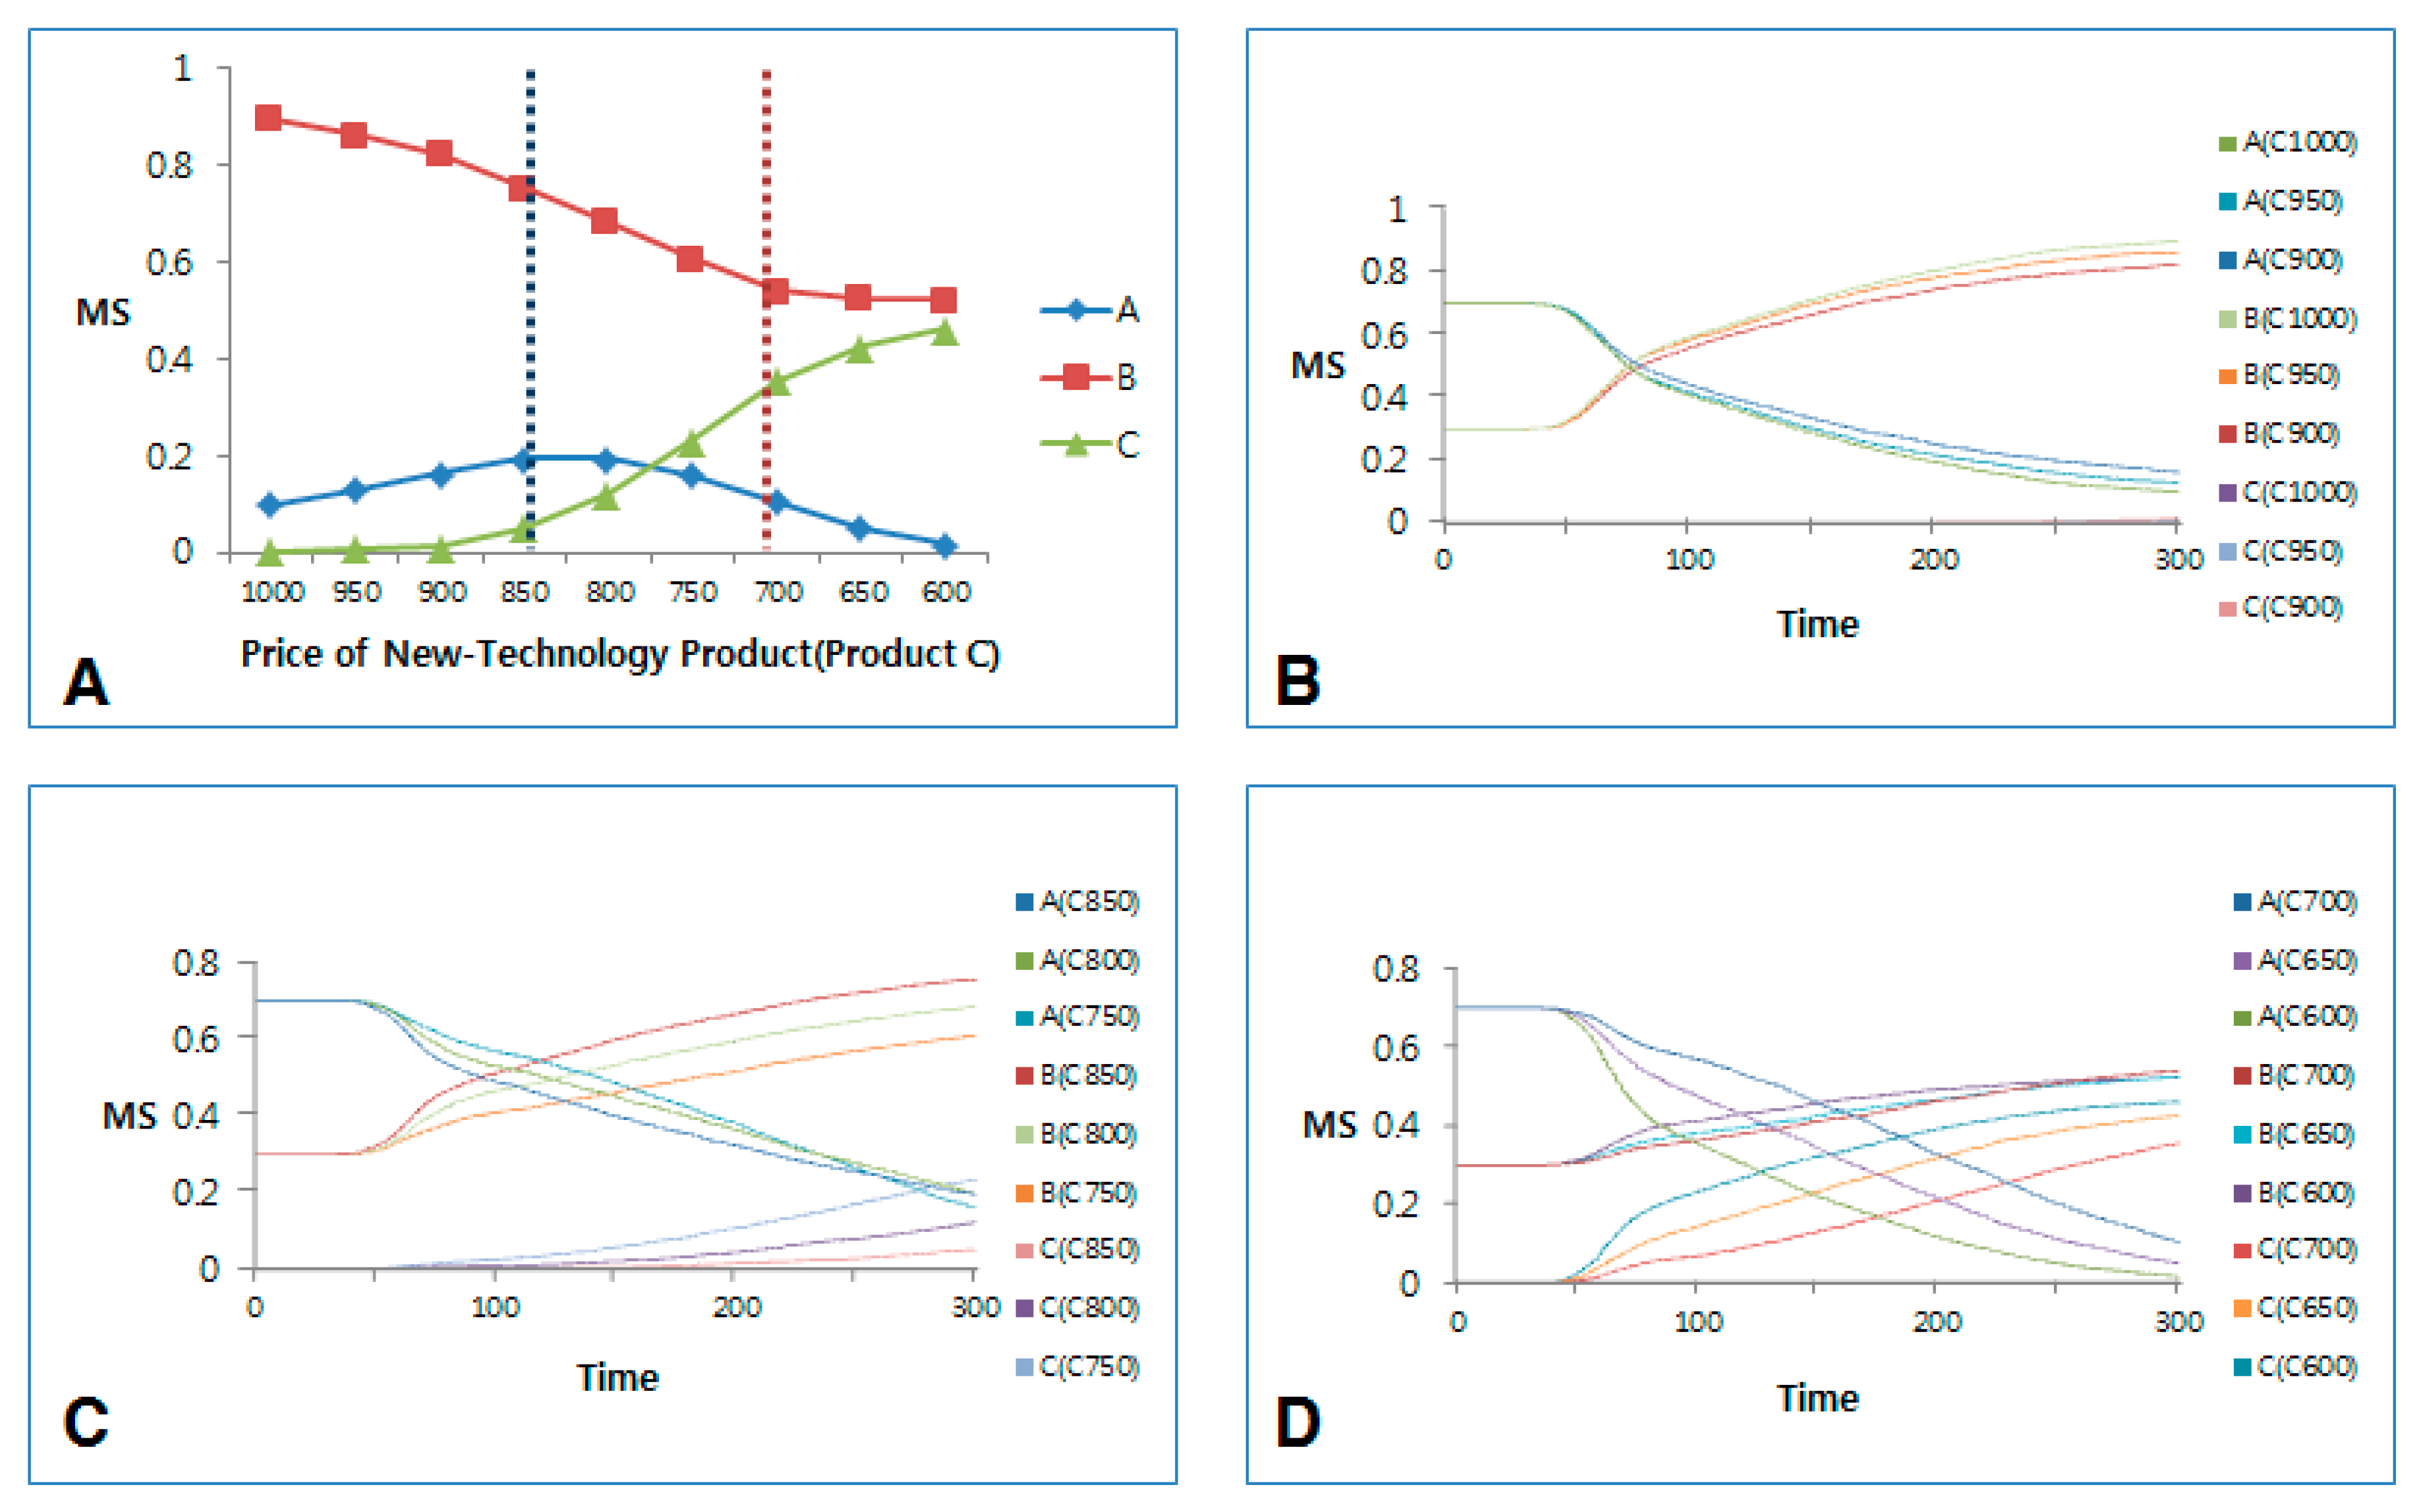
Figure 18.
Changes of market share of Product A, Product B, and Product C according to the price changes of Product C (new-technology product, which entered market) (A). Changes of market share when the price of Product C is greater than 900 won (B); when the price of Product C is between 750 and 850 won (C); and when the price of Product C is 700 won or less (D).
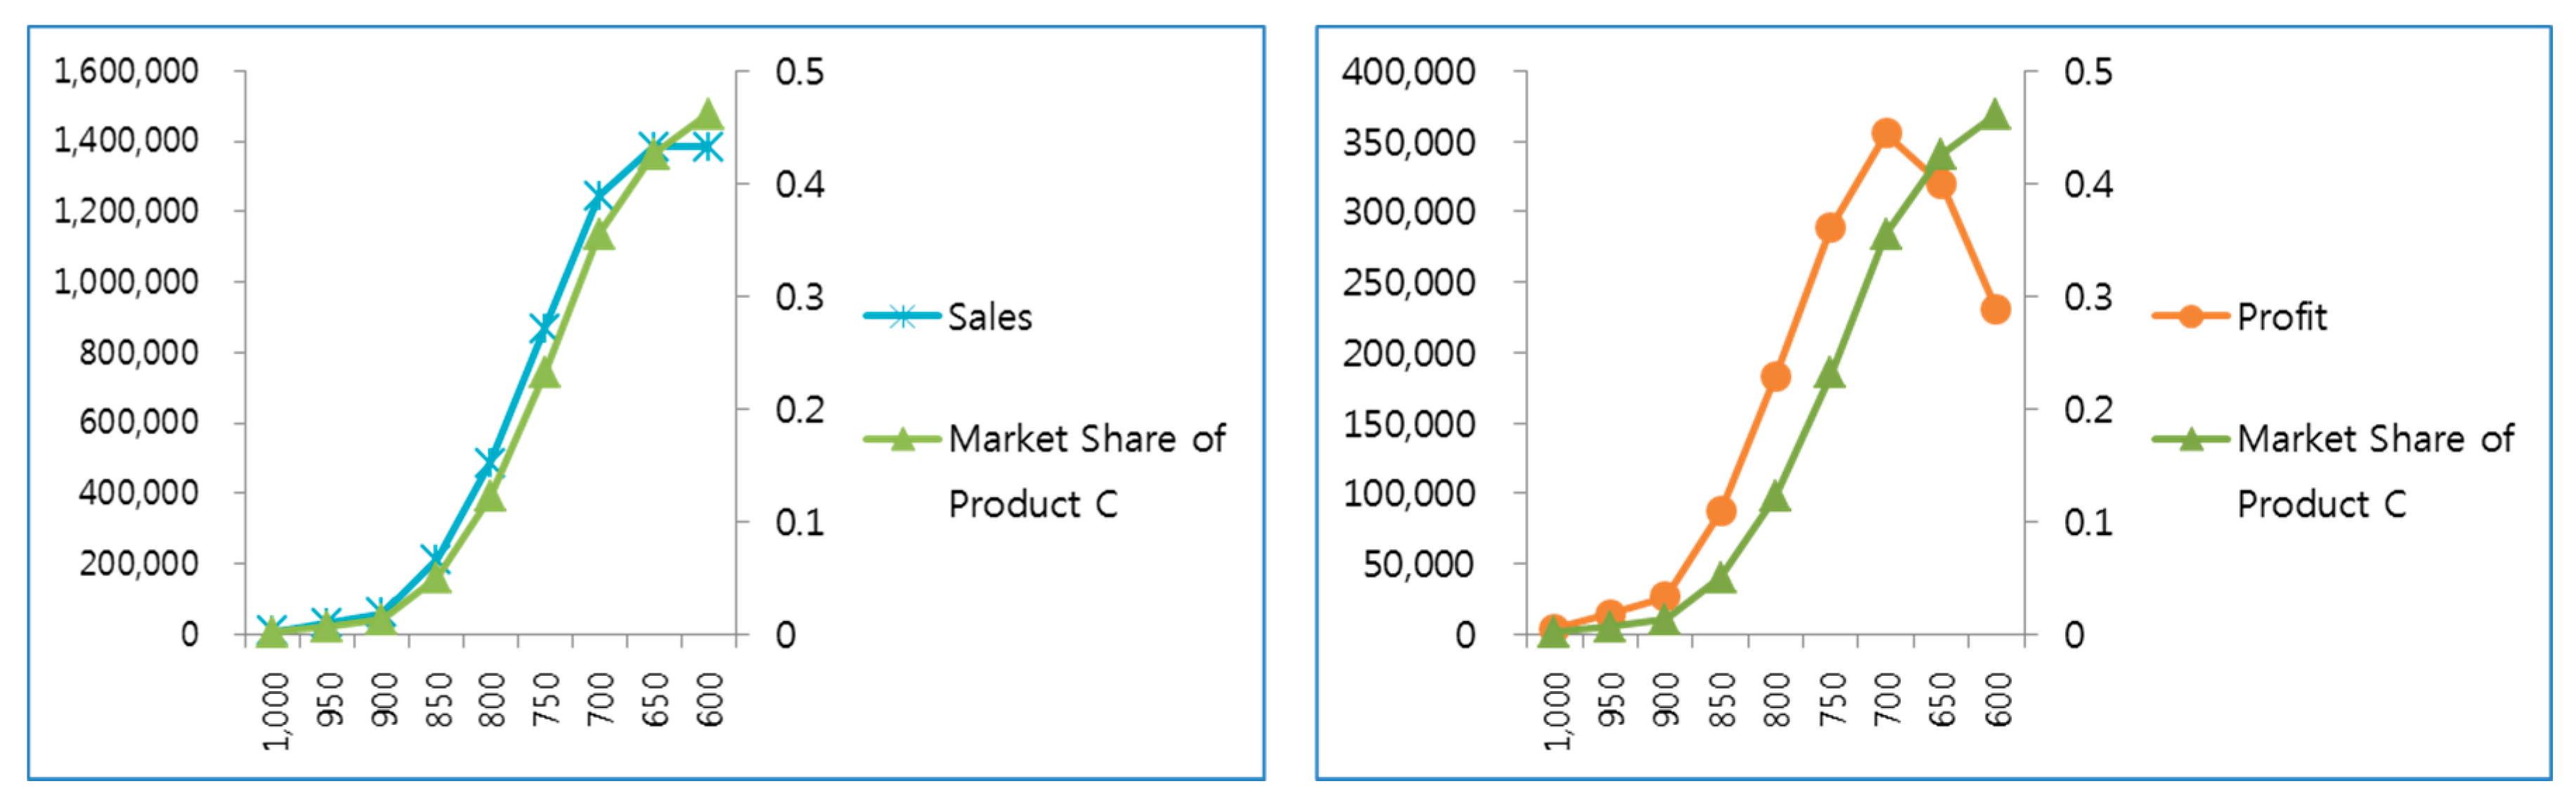
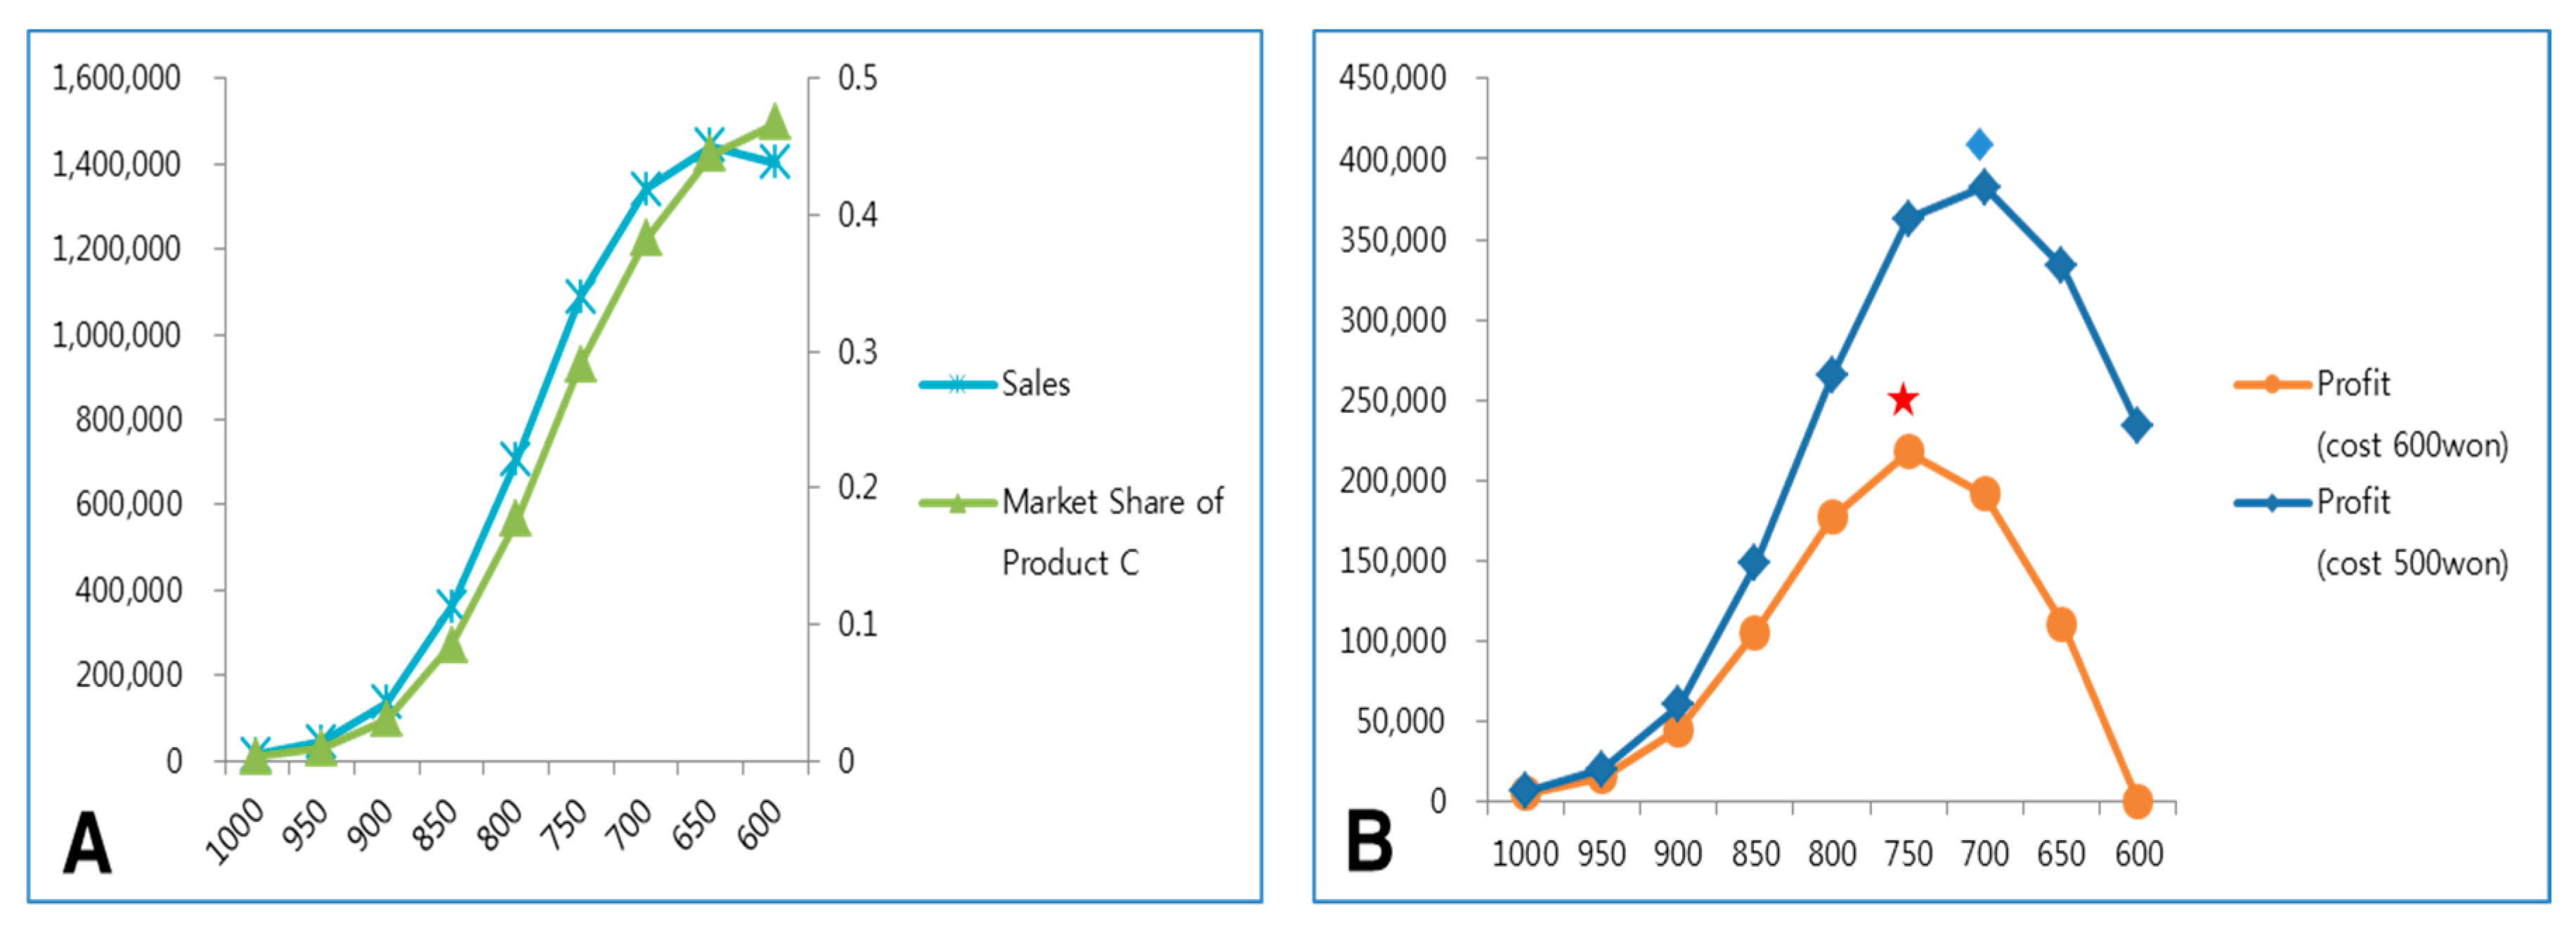
Figure 19.
Changes of market share, sales (A), and profits (B) of Product C according to the price changes of Product C.
Figure 19.
Changes of market share, sales (A), and profits (B) of Product C according to the price changes of Product C.
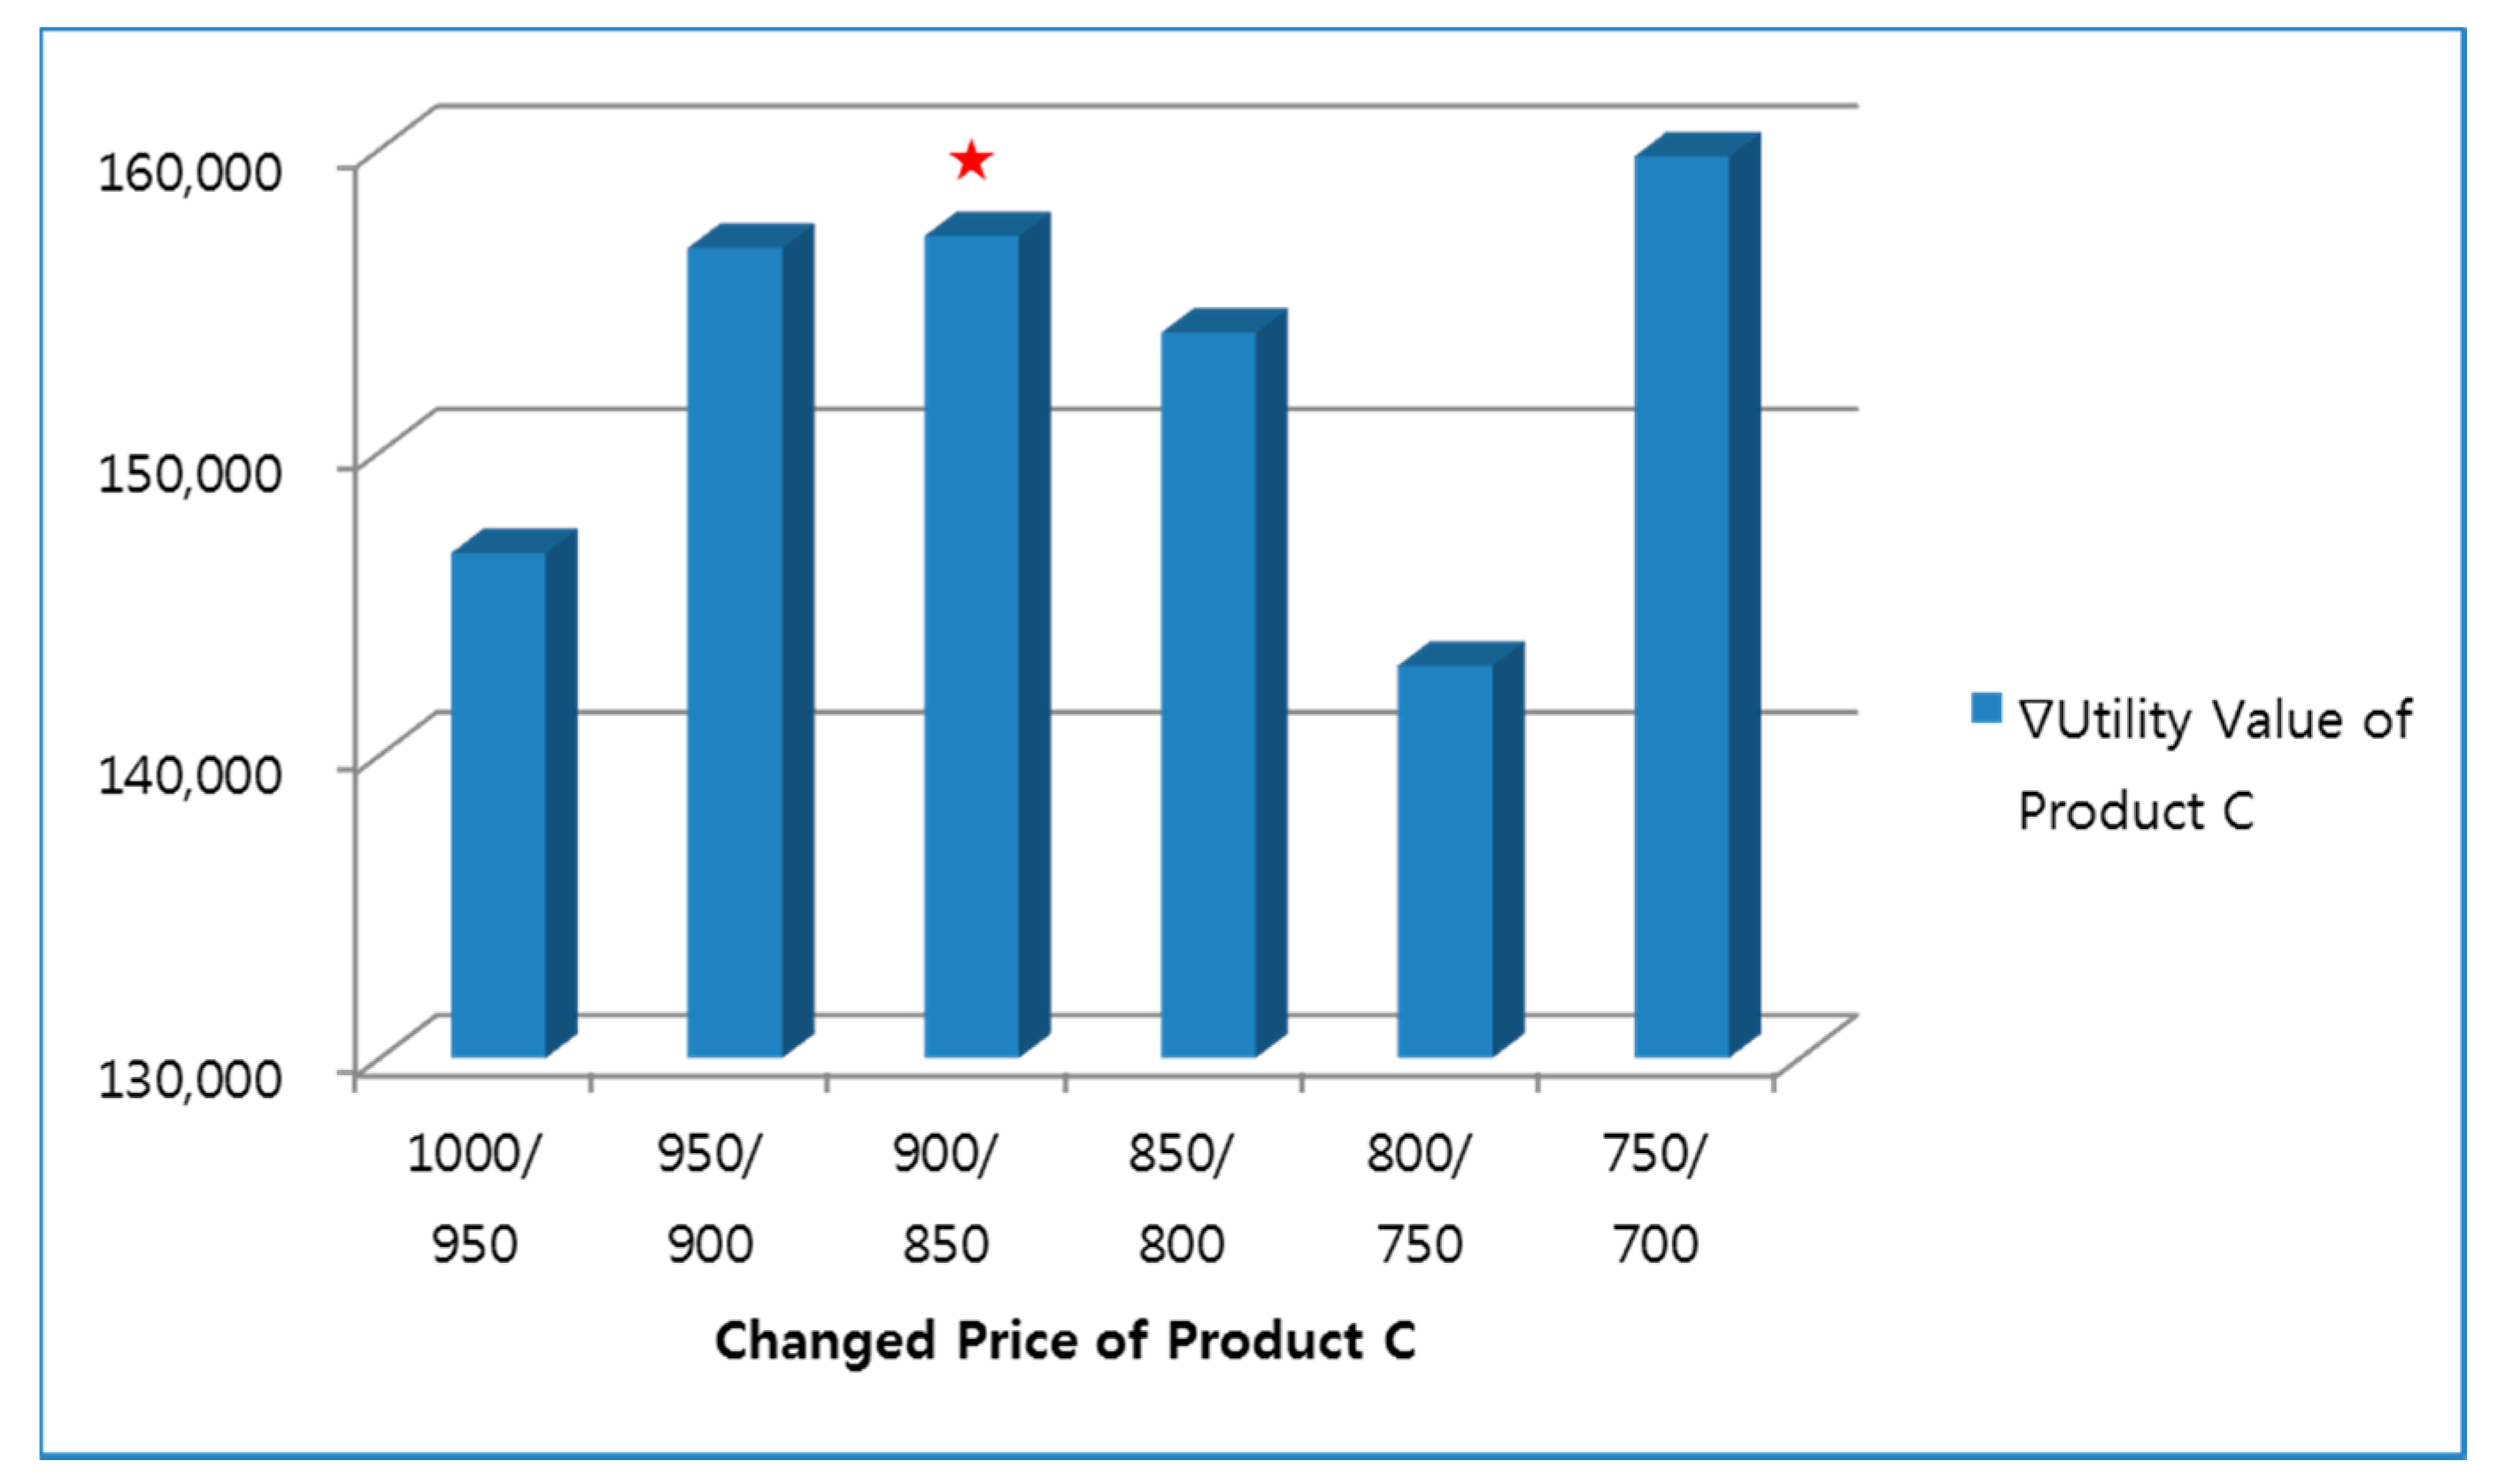
Figure 20.
The changes of utility values for Product C, according to changes in the price of Product C.
Figure 20.
The changes of utility values for Product C, according to changes in the price of Product C.
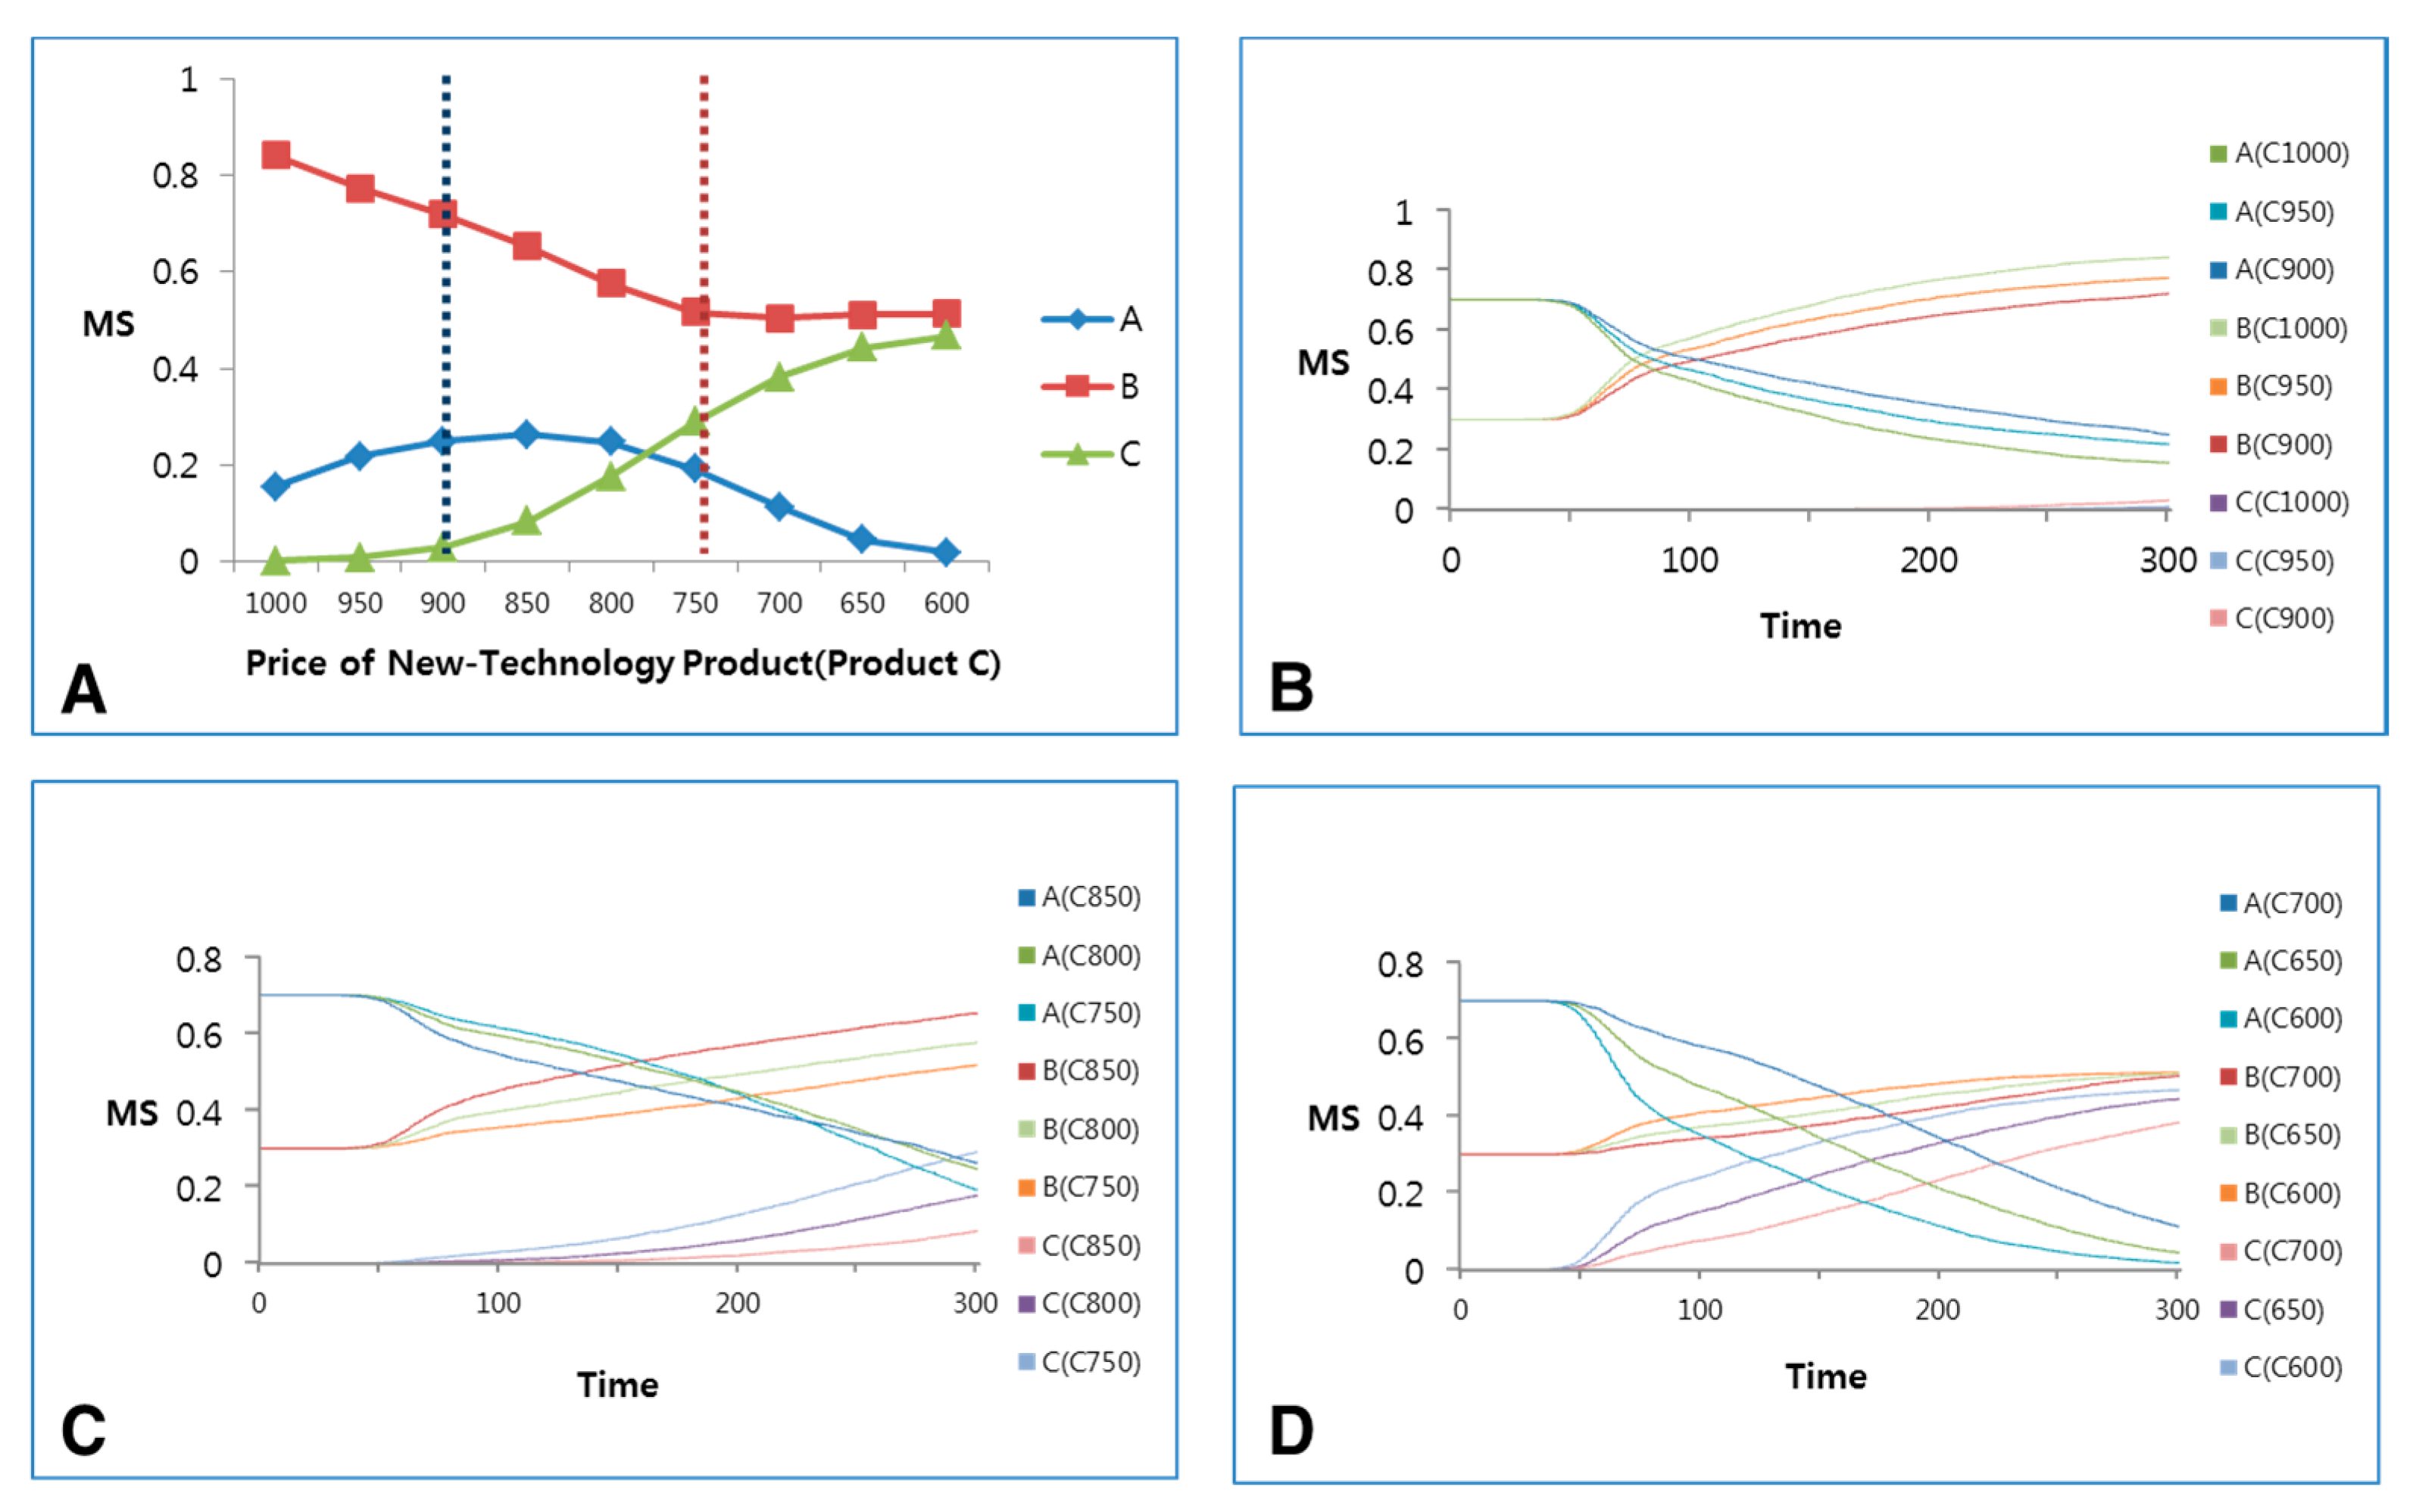
Figure 21.
Changes of market share of Product A, Product B, and Product C according to the changes in price of Product C (new-technology product with improvements to two of its features) (A). Changes of market share when the price of product C is over 900 won (B); when the price of Product C is from 750 won to 850 won (C); and when the price of Product C is 700 won or less (D).
Figure 22.
Changes of market share, sales (A), and profits (B) of Product C (new-technology product developed in two selected utility areas) according to the price changes of Product C.
Figure 22.
Changes of market share, sales (A), and profits (B) of Product C (new-technology product developed in two selected utility areas) according to the price changes of Product C.
Table 1.
National happiness index and bio-innovation index.
Table 1.
National happiness index and bio-innovation index.
| Country | Happiness * | R&D Composite Score | Government Health R&D | Government R&D as a Share of GDP | Extent of Price Controls | Country | Happiness | R&D Composite Score | Government Health R&D | Government R&D as a Share of GDP | Extent of Price Controls ** |
|---|
| Denmark | 1 | 1 | 2 | 3 | 3 | Spain | 29 | 6 | 4 | 24 | 3 |
| Switzerland | 2 | 13 | 13 | 10 | 1 | Slovakia | 30 | 27 | 14 | 37 | 2 |
| Iceland | 3 | 17 | 35 | 2 | 2 | Malaysia | 31 | 41 | 40 | 41 | 2 |
| Norway | 4 | 2 | 6 | 8 | 3 | Italy | 32 | 24 | 21 | 26 | 2 |
| Finland | 5 | 28 | 41 | 7 | 2 | Japan | 33 | 34 | 38 | 21 | 2 |
| Canada | 6 | 32 | 33 | 20 | 2 | Russia | 34 | 39 | 51 | 14 | 2 |
| Netherlands | 7 | 23 | 28 | 18 | 2 | Poland | 35 | 14 | 10 | 31 | 2 |
| New Zealand | 8 | 25 | 22 | 27 | 2 | South Korea | 36 | 21 | 39 | 6 | 2 |
| Australia | 9 | 31 | 18 | 38 | 3 | Lithuania | 37 | 43 | 45 | 42 | 2 |
| Sweden | 10 | 3 | 9 | 4 | 2 | Slovenia | 38 | 15 | 16 | 16 | 2 |
| Israel | 11 | 52 | 55 | 29 | 1 | Peru | 39 | 46 | 37 | 53 | 2 |
| Austria | 12 | 12 | 25 | 1 | 2 | Latvia | 40 | 51 | 47 | 55 | 2 |
| United States | 13 | 7 | 12 | 5 | 1 | Romania | 41 | 47 | 44 | 46 | 2 |
| Costa Rica | 14 | 53 | 52 | 44 | 2 | Estonia | 42 | 16 | 24 | 11 | 2 |
| Germany | 15 | 22 | 34 | 13 | 2 | Hong Kong | 43 | 50 | 50 | 43 | 3 |
| Brazil | 16 | 37 | 43 | 22 | 2 | Turkey | 44 | 56 | 56 | 48 | 2 |
| Belgium | 17 | 48 | 53 | 28 | 2 | Indonesia | 45 | 44 | 30 | 51 | 1 |
| Ireland | 18 | 38 | 36 | 35 | 3 | Philippines | 46 | 54 | 48 | 56 | 2 |
| Mexico | 19 | 35 | 27 | 40 | 1 | China | 47 | 26 | 19 | 32 | 3 |
| Singapore | 20 | 9 | 11 | 9 | 1 | Hungary | 48 | 18 | 15 | 25 | 2 |
| United Kingdom | 21 | 4 | 1 | 30 | 3 | Portugal | 49 | 8 | 8 | 19 | 2 |
| Chile | 22 | 33 | 17 | 50 | 2 | Vietnam | 50 | 40 | 31 | 52 | 2 |
| Argentina | 23 | 36 | 32 | 34 | 1 | Greece | 51 | 29 | 26 | 33 | 2 |
| Czech Republic | 24 | 19 | 23 | 17 | 2 | South Africa | 52 | 30 | 20 | 39 | 3 |
| Colombia | 25 | 11 | 3 | 49 | 2 | India | 53 | 42 | 49 | 23 | 3 |
| France | 26 | 20 | 29 | 12 | 3 | Kenya | 54 | 10 | 5 | 45 | 2 |
| Thailand | 27 | 49 | 42 | 54 | 3 | Ukraine | 55 | 45 | 46 | 36 | 2 |
| Taiwan | 28 | 5 | 7 | 15 | 1 | Bulgaria | 56 | 55 | 54 | 47 | 2 |
Table 2.
Average variance extracted (AVE).
Table 2.
Average variance extracted (AVE).
| | Original Sample | Sample Mean | Standard Deviation | T Statistics | p Value |
|---|
| Healthcare Investment | 0.517 | 0.544 | 0.045 | 9.597 | 0.000 |
| Technology Investment | 0.834 | 0.831 | 0.050 | 16.657 | 0.000 |
Table 3.
Composite reliability.
Table 3.
Composite reliability.
| | Original Sample | Sample Mean | Standard Deviation | T Statistics | p Value |
|---|
| Healthcare Investment | 0.642 | 0.635 | 0.096 | 6.680 | 0.000 |
| Technology Investment | 0.910 | 0.908 | 0.030 | 30.382 | 0.000 |
Table 4.
Direct path coefficients.
Table 4.
Direct path coefficients.
| | Original Sample (β) | Standard Deviation | T Statistics | p Value |
|---|
| Healthcare Investment | −0.290 | 0.184 | 1.582 | 0.114 |
| -> Human Happiness | | | | |
| Technology Investment | 0.655 | 0.149 | 4.382 | 0.000 |
| -> Human Happiness | | | | |
| Healthcare Investment | 0.739 | 0.040 | 18.556 | 0.000 |
| -> Technology Investment | | | | |
Table 5.
Steepness and intercept of clusters.
Table 5.
Steepness and intercept of clusters.
| No. | Cluster | Steepness (a) | Intercept (b) |
|---|
| 0 | Pharmaceutical investment | 0.2 | 0.7 |
| 1 | Clinical infrastructure | 0.2 | 0.9 |
| 2 | Bio-technology development | 0.2 | 0.9 |
| 3 | Health food development | 0.2 | 0.6 |
| 4 | R&D investment | 0.1 | 1.4 |
| 5 | Expanding commercialization | 0.1 | 2.2 |
| 6 | Development of medical equipment | 0.1 | 1.5 |
| 7 | New drug infrastructure | 0.2 | 0.8 |
| 8 | Healthcare development | 0.2 | 0.8 |
| 9 | Fostering new industries | 0.2 | 1 |
| 10 | Technology development | 0.2 | 0.9 |
| 11 | Medical complex development | 0.2 | 1.1 |
Table 6.
The weight of attributes for multi-attribute utility decisions.
Table 6.
The weight of attributes for multi-attribute utility decisions.
| Attribute | Definition | Weight |
|---|
| Brand | Brand awareness | 1.3 |
| Price | The money required to pay for a single dose of pills | 21.7 |
| Efficiency | Medical efficacy to decrease main symptoms of disease | 9.5 |
| Convenience | Improve convenience, including administration method, number, etc. | 7.1 |
| Side Effects | Unwanted non-therapeutic effects caused by a drug | 12.8 |
| Marketing | Advertisement to increase product awareness | 6.7 |
Table 7.
Classification and characterization of products.
Table 7.
Classification and characterization of products.
| Product | Price (Won) | Efficiency (%) | Dosing Convenience | Side Effects | Brand | Marketing |
|---|
| Market leading product (A) | 500~1000 | 100 | No | Yes or No | High | High |
| Low-cost product (B) | 500~600 | 100 | No | Yes or No | Middle or Low | Middle |
| New-technology product (C) | 600~1000 | 100~200 | Yes or No | Yes or No | High, Middle, Low | High or Middle |
Table 8.
Characterization of product in Scenario 1.
Table 8.
Characterization of product in Scenario 1.
| Product | Price (Won) | Efficiency (%) | Dosing Convenience | Side Effects | Brand | Marketing |
|---|
| Market-leading product (A) | 800 | 100 | No | No | Very High | High |
| Low-cost product (B) | 500~800 | 100 | No | No | Low | Middle |
Table 9.
Characterization of products in Scenario 2.
Table 9.
Characterization of products in Scenario 2.
| Product | Price (won) | Efficiency (%) | Dosing Convenience | Side Effects | Brand | Marketing |
|---|
| Market-leading product (A) | 800 | 100 | No | No | Very High | High |
| Low-cost product (B) | 600 | 100 | No | No | Low | Middle |
| New-technology product (C) | 600~1000 | 150 | No or Yes | No | Low | Middle |


