
Hydraulic Performance of an Innovative Breakwater for Overtopping Wave Energy Conversion

 , , and
Abstract
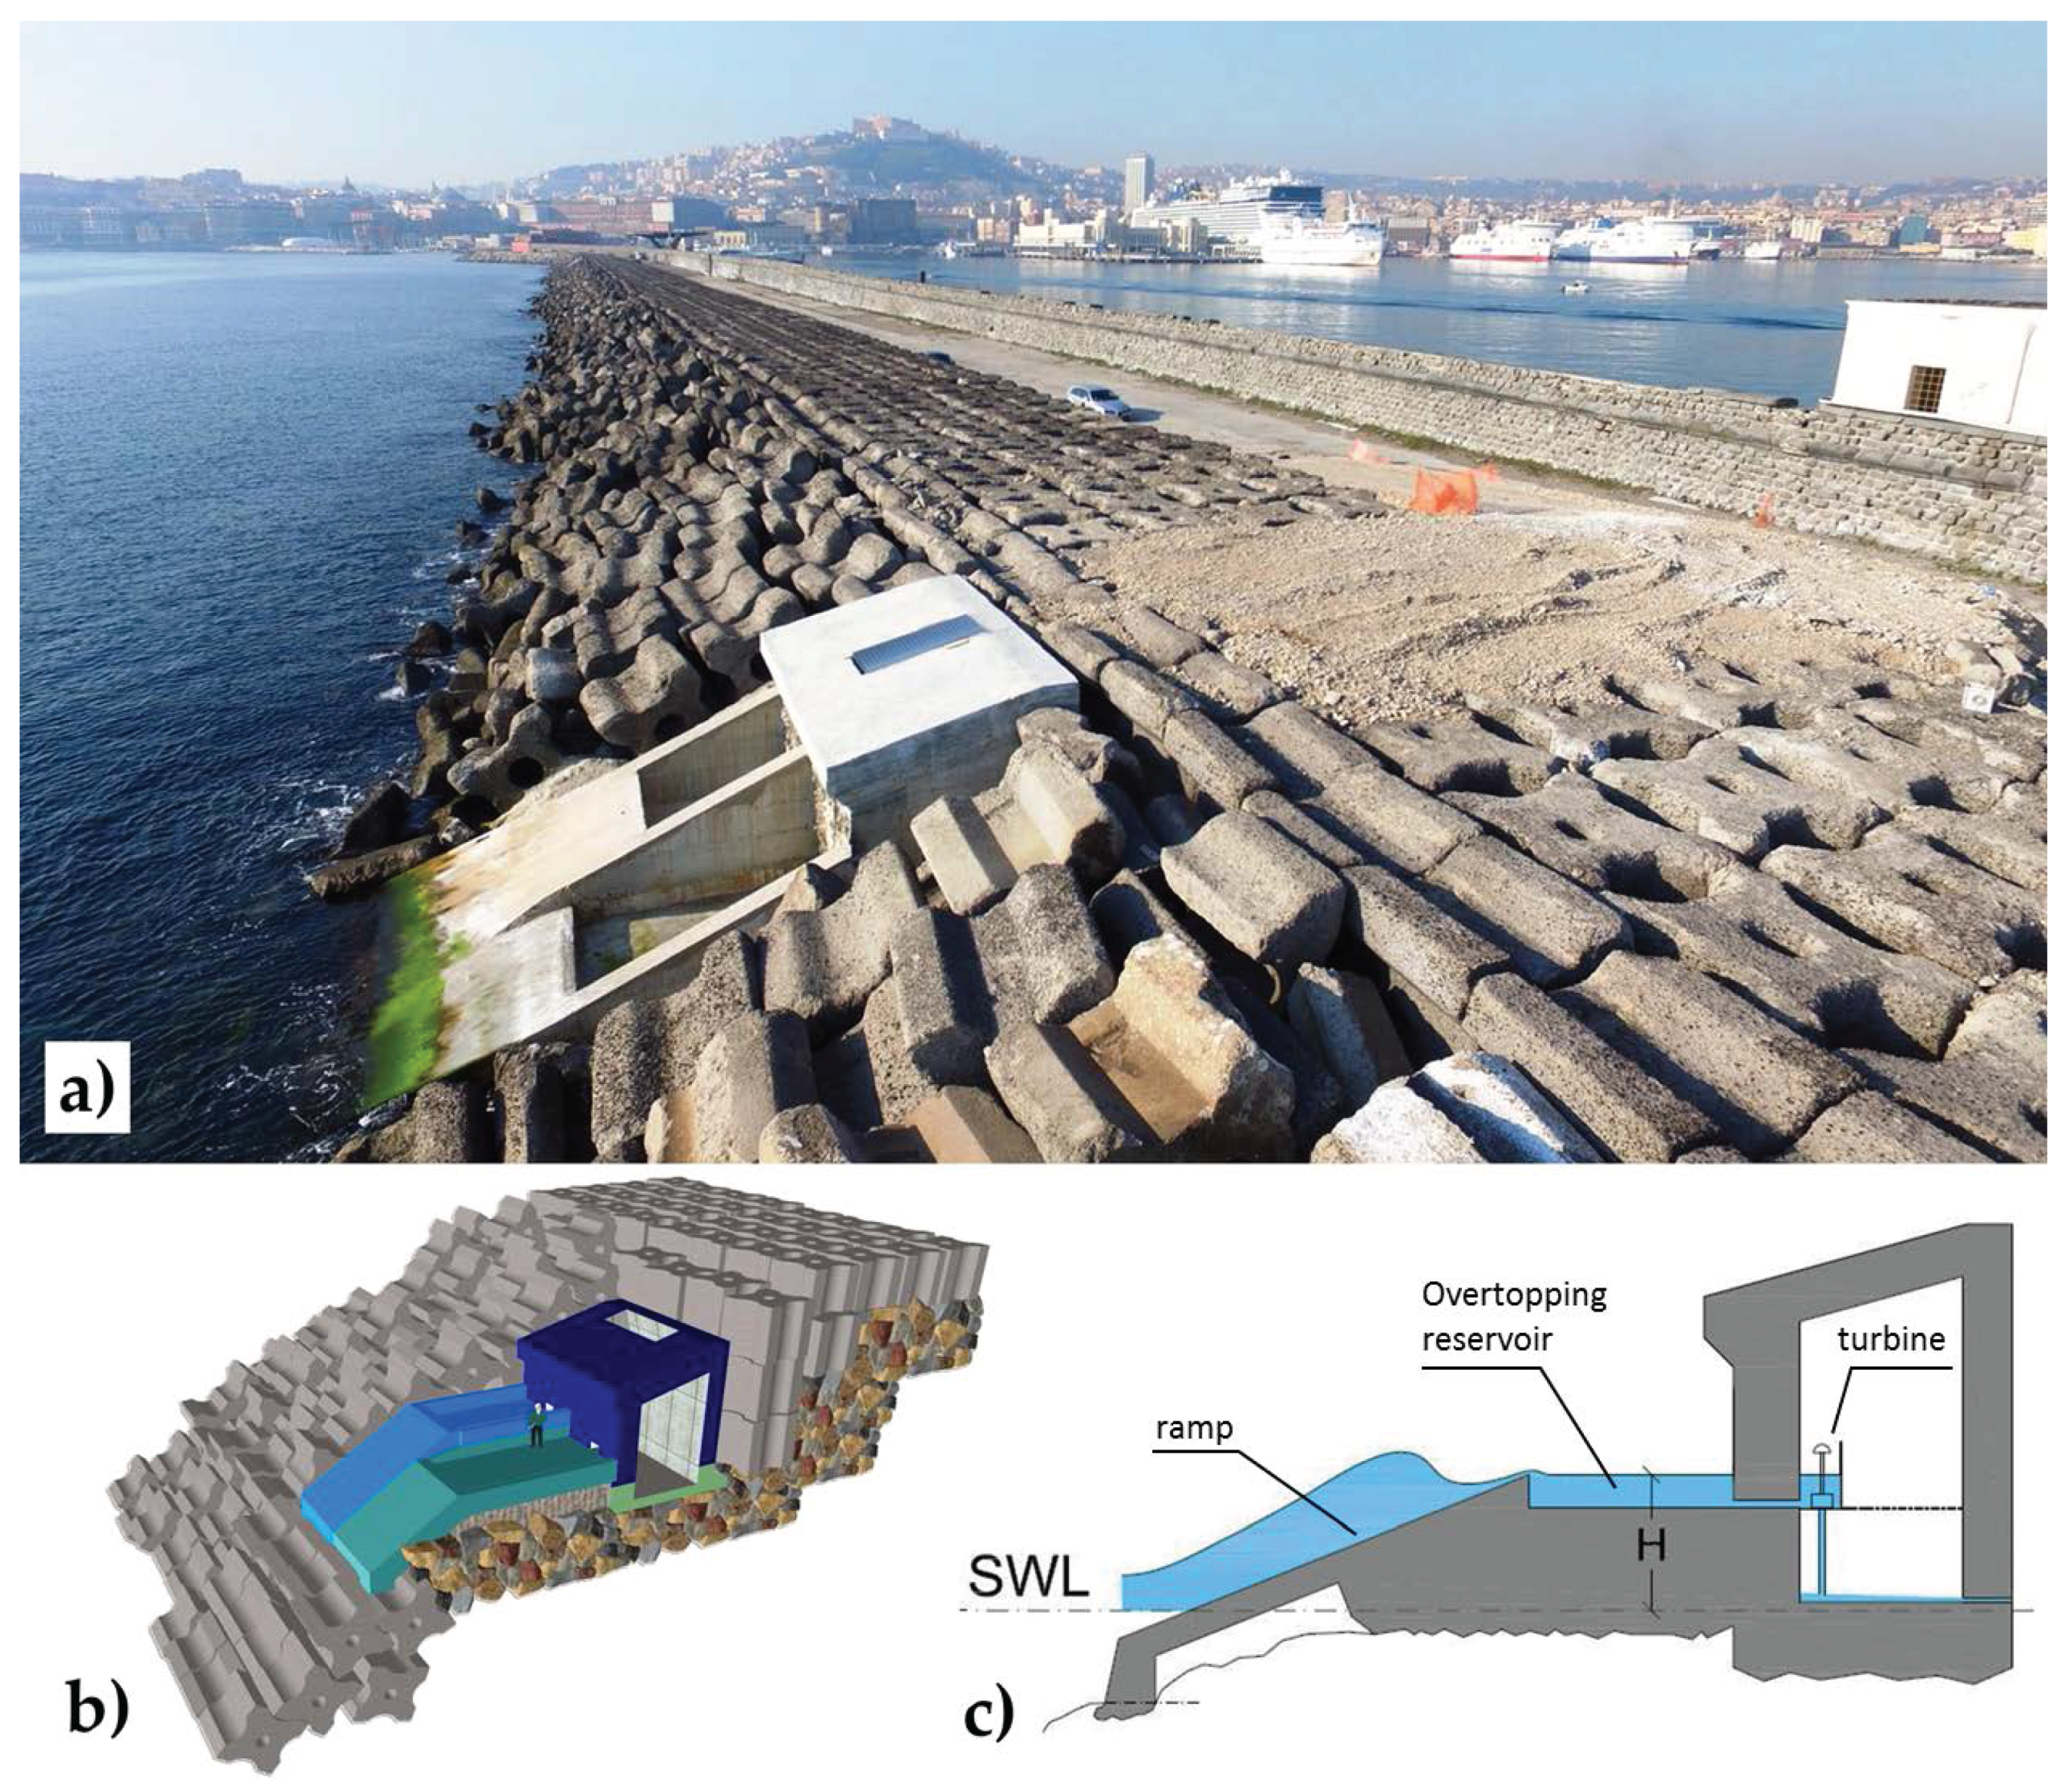
:1. Introduction
- (1)
- the device shows a similar or even reduced reflection coefficient with respect to traditional rubble mound breakwater;
- (2)
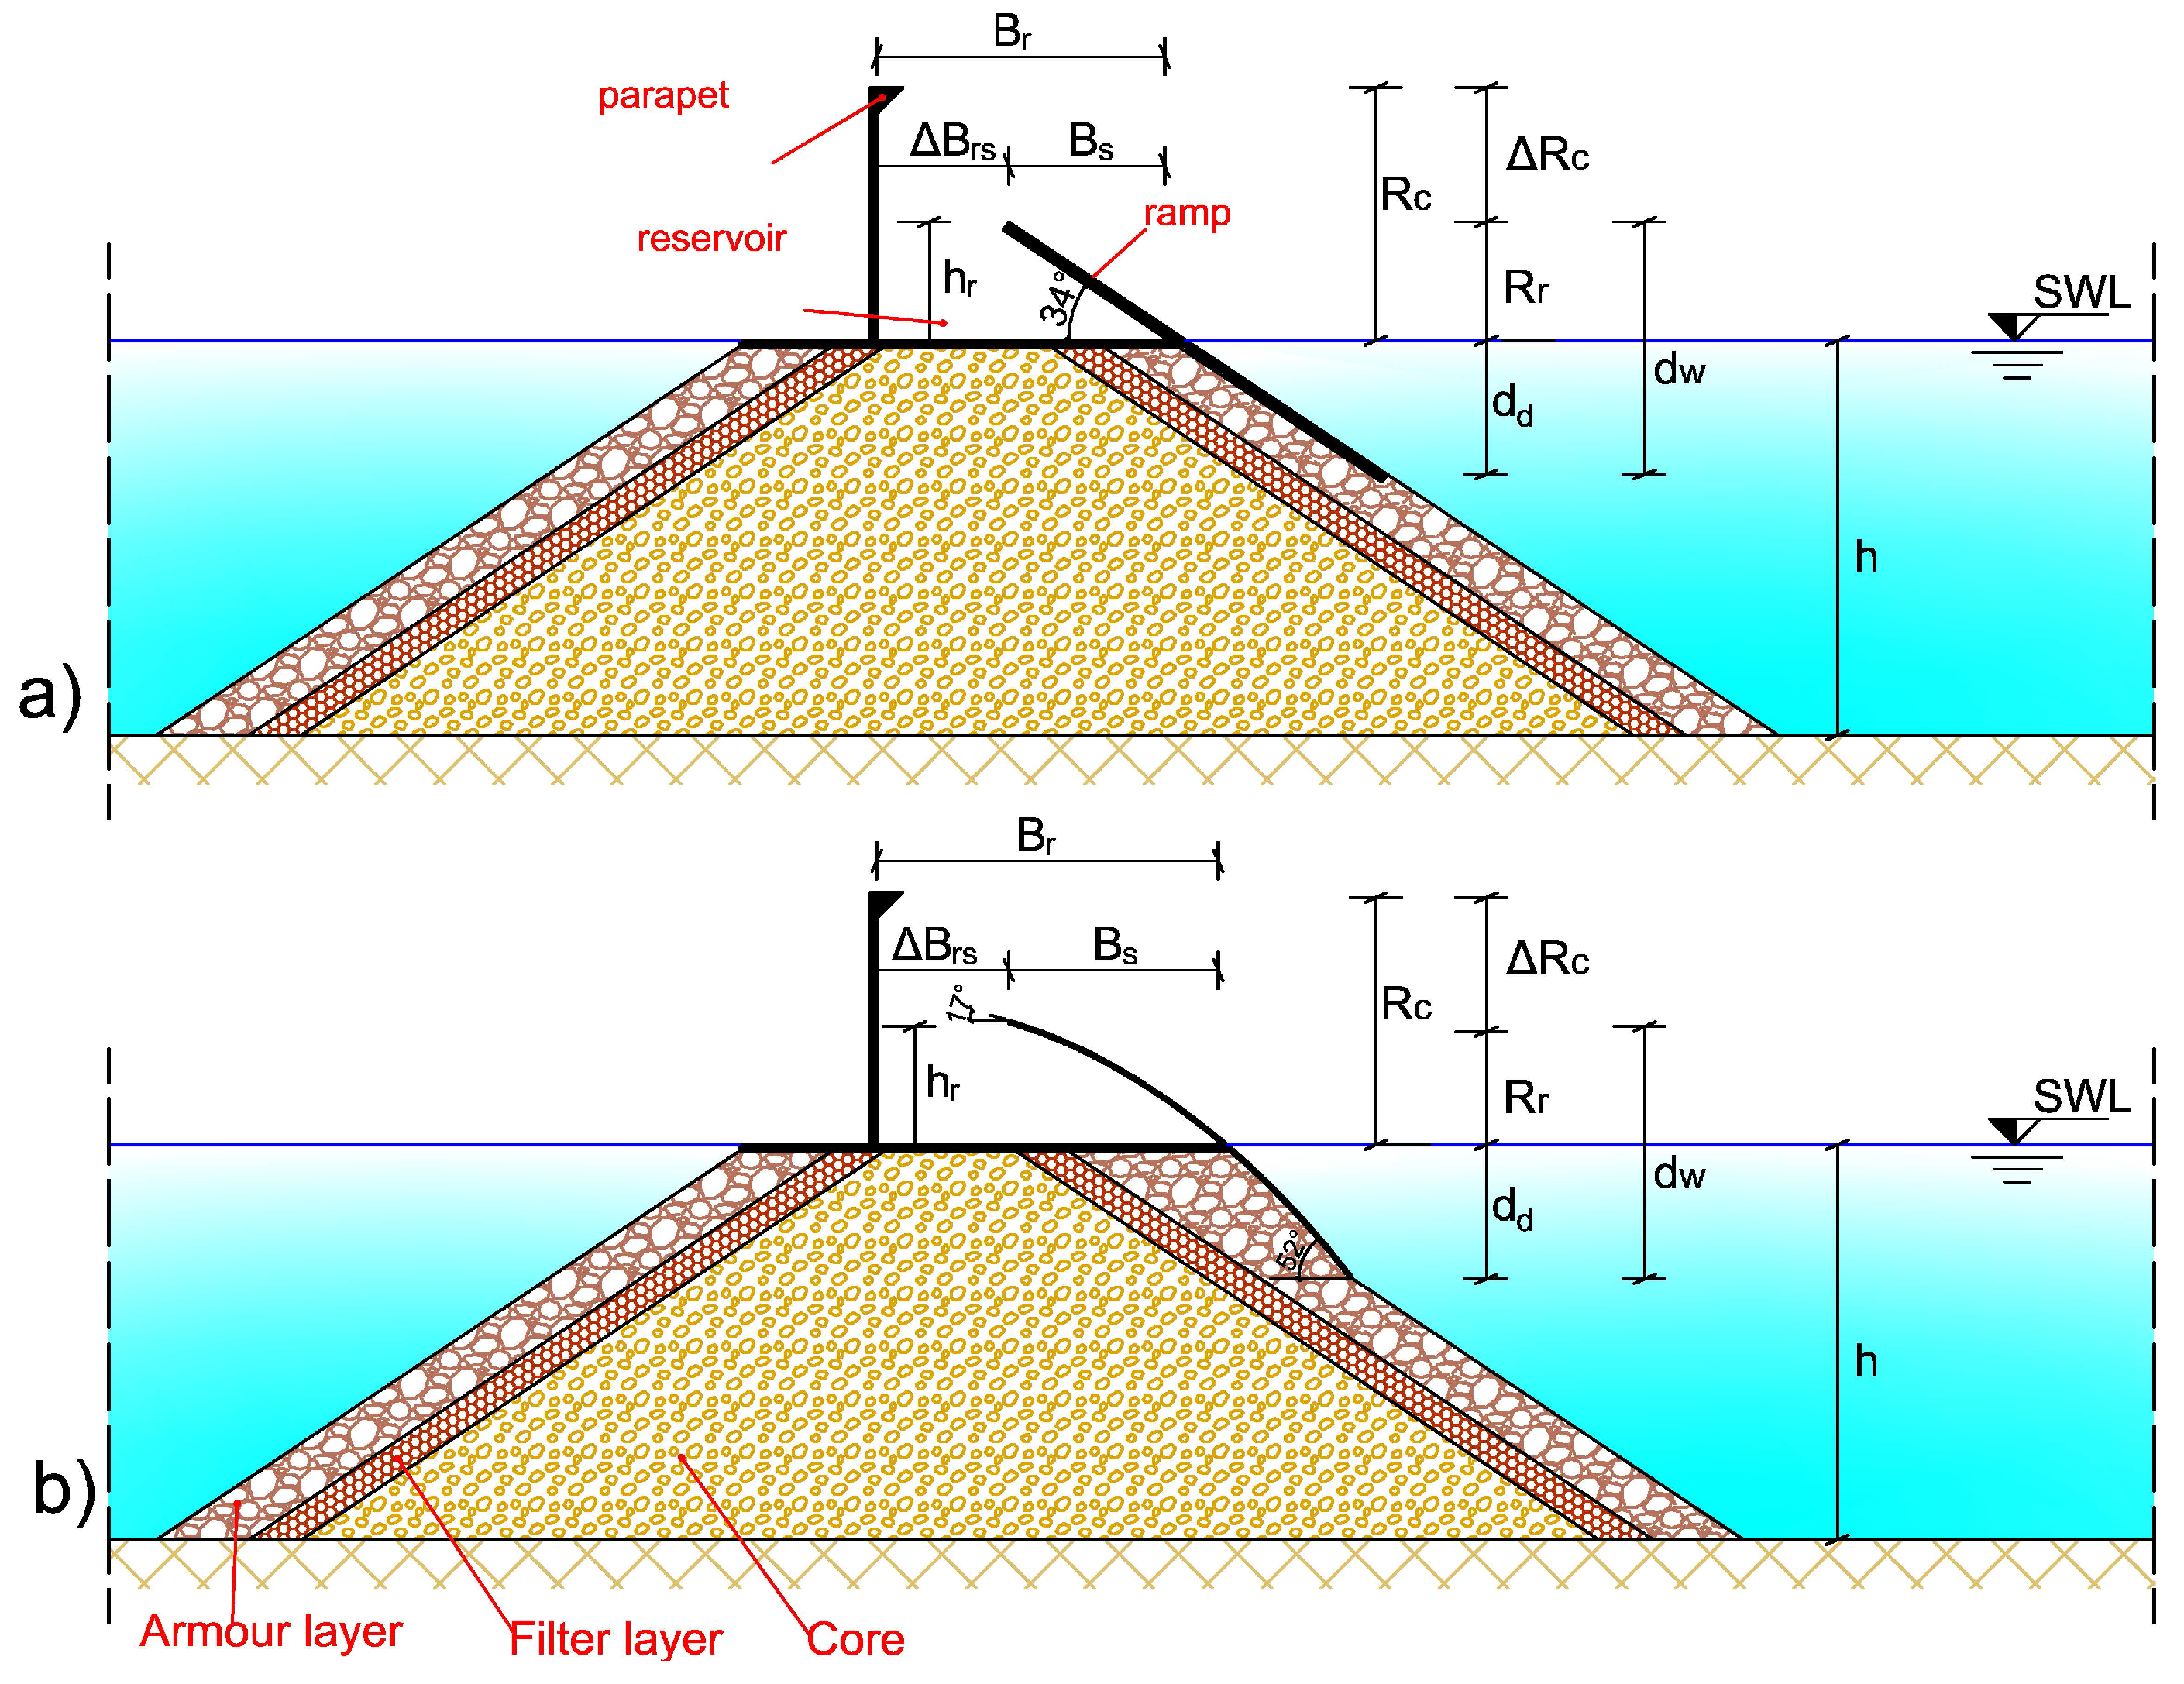
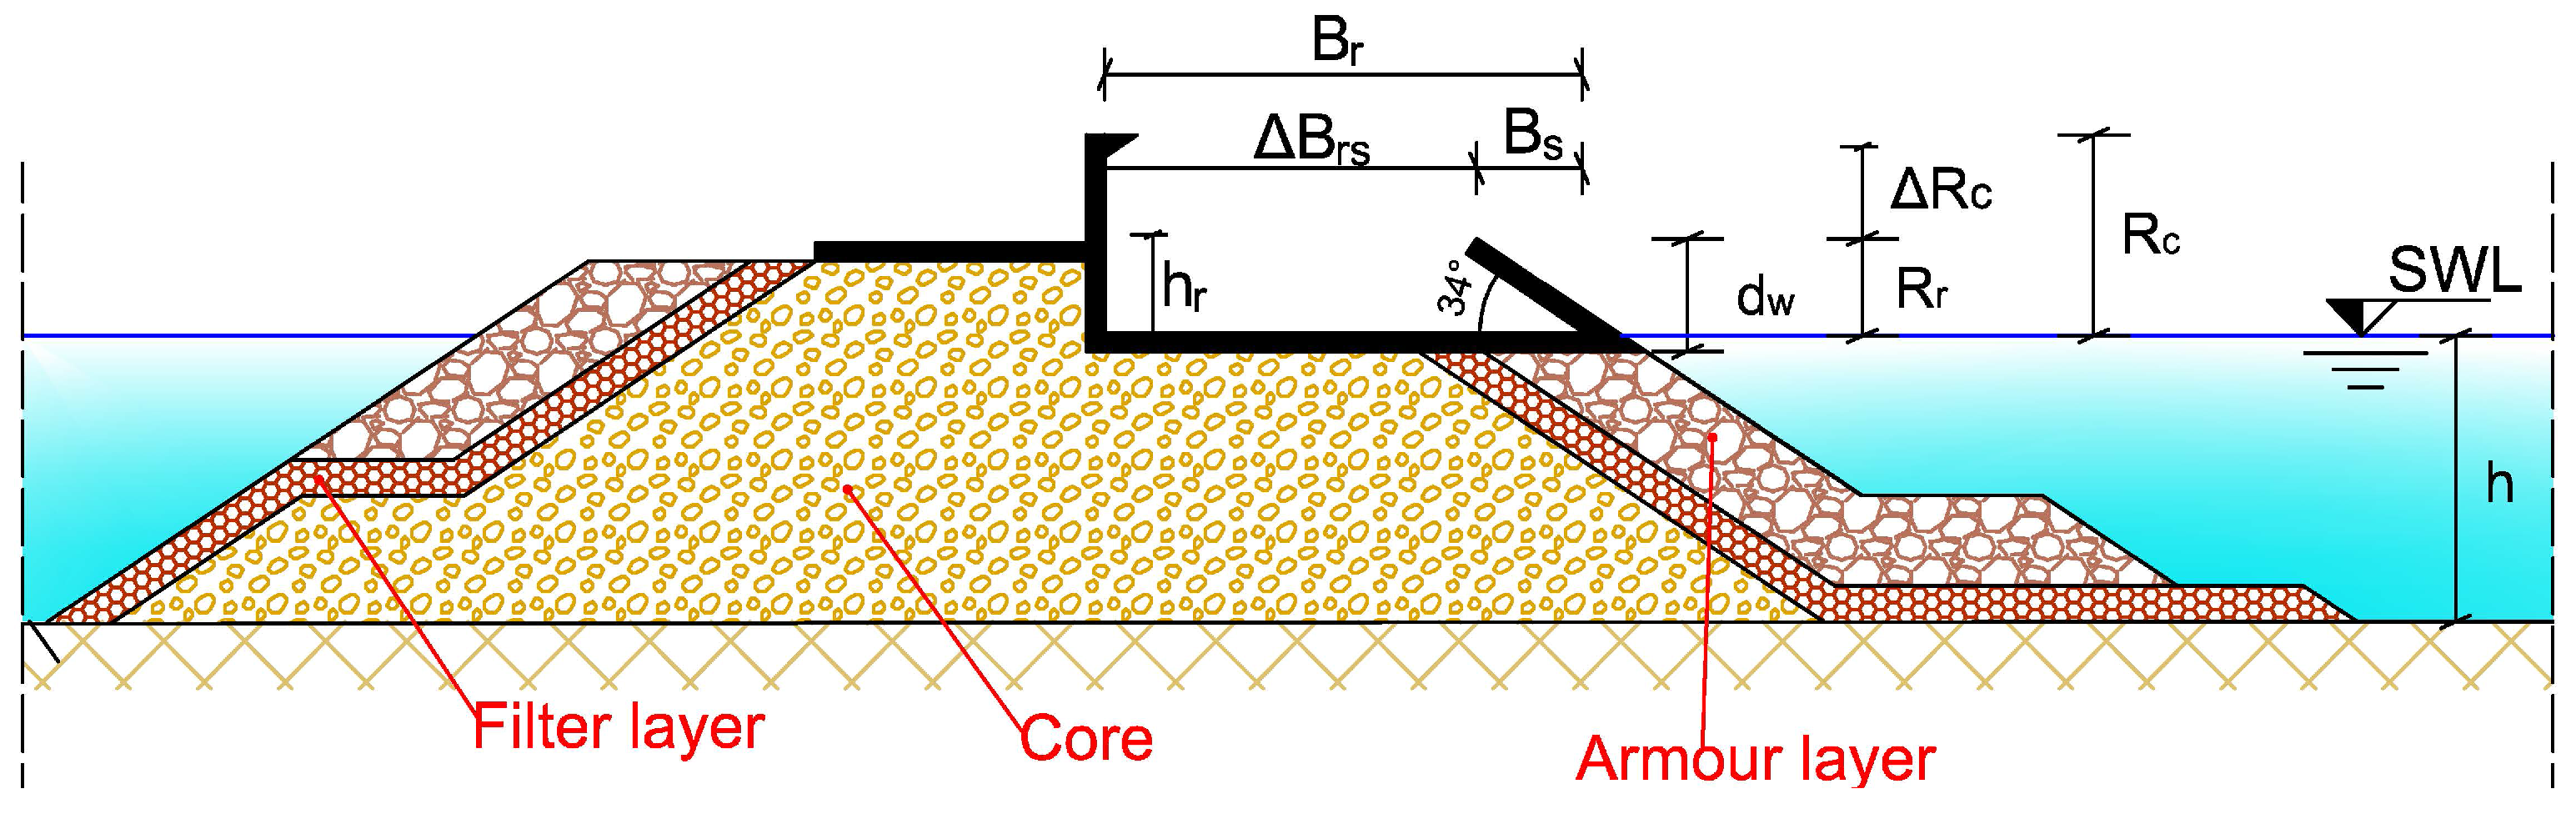
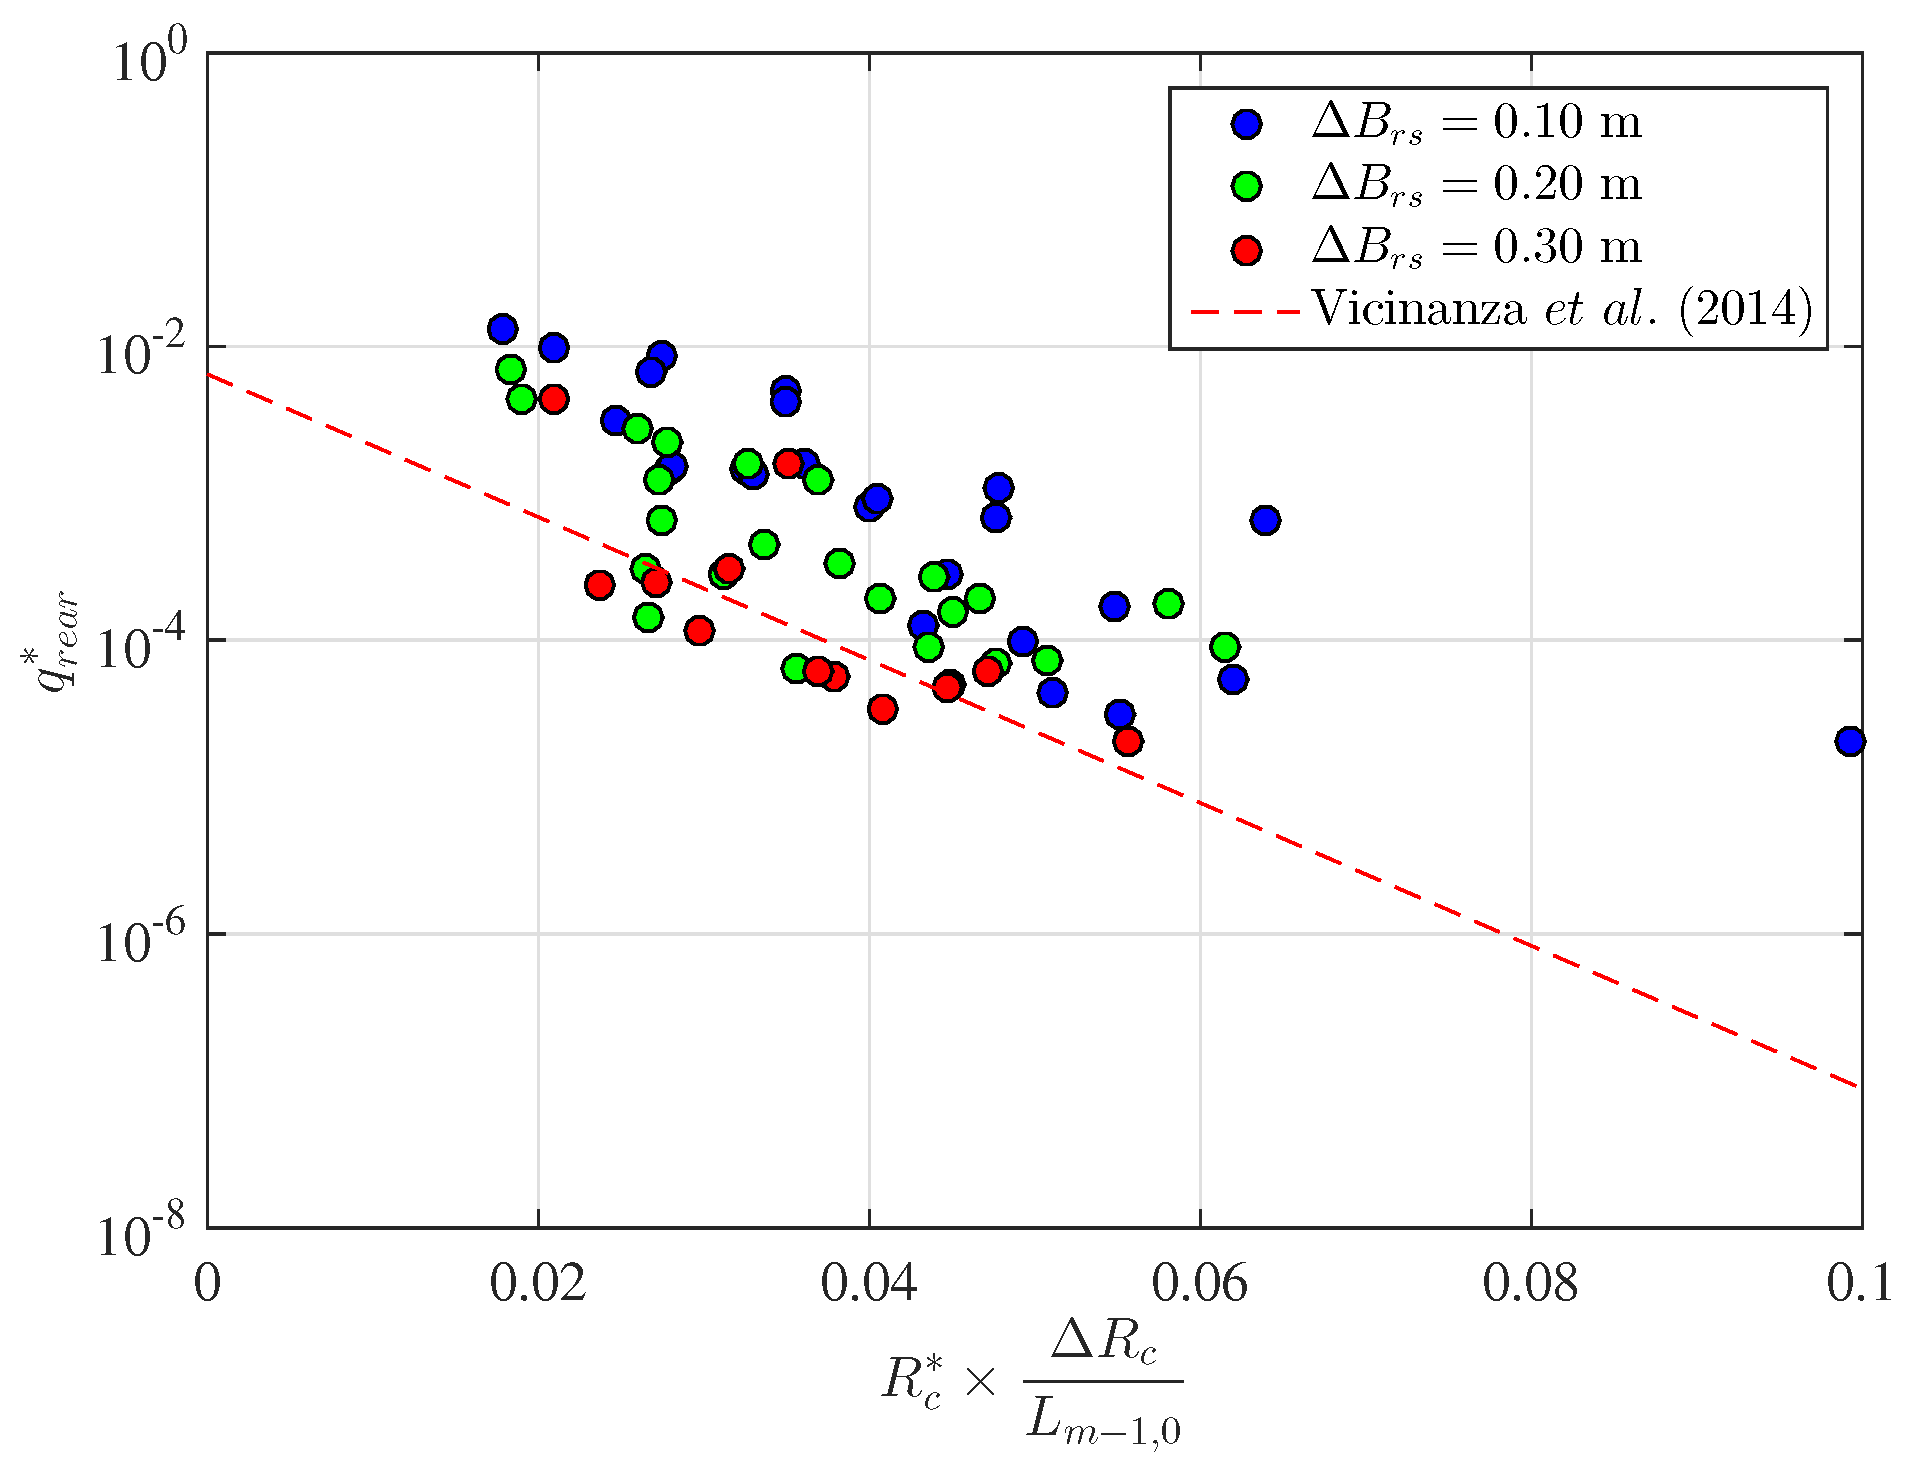
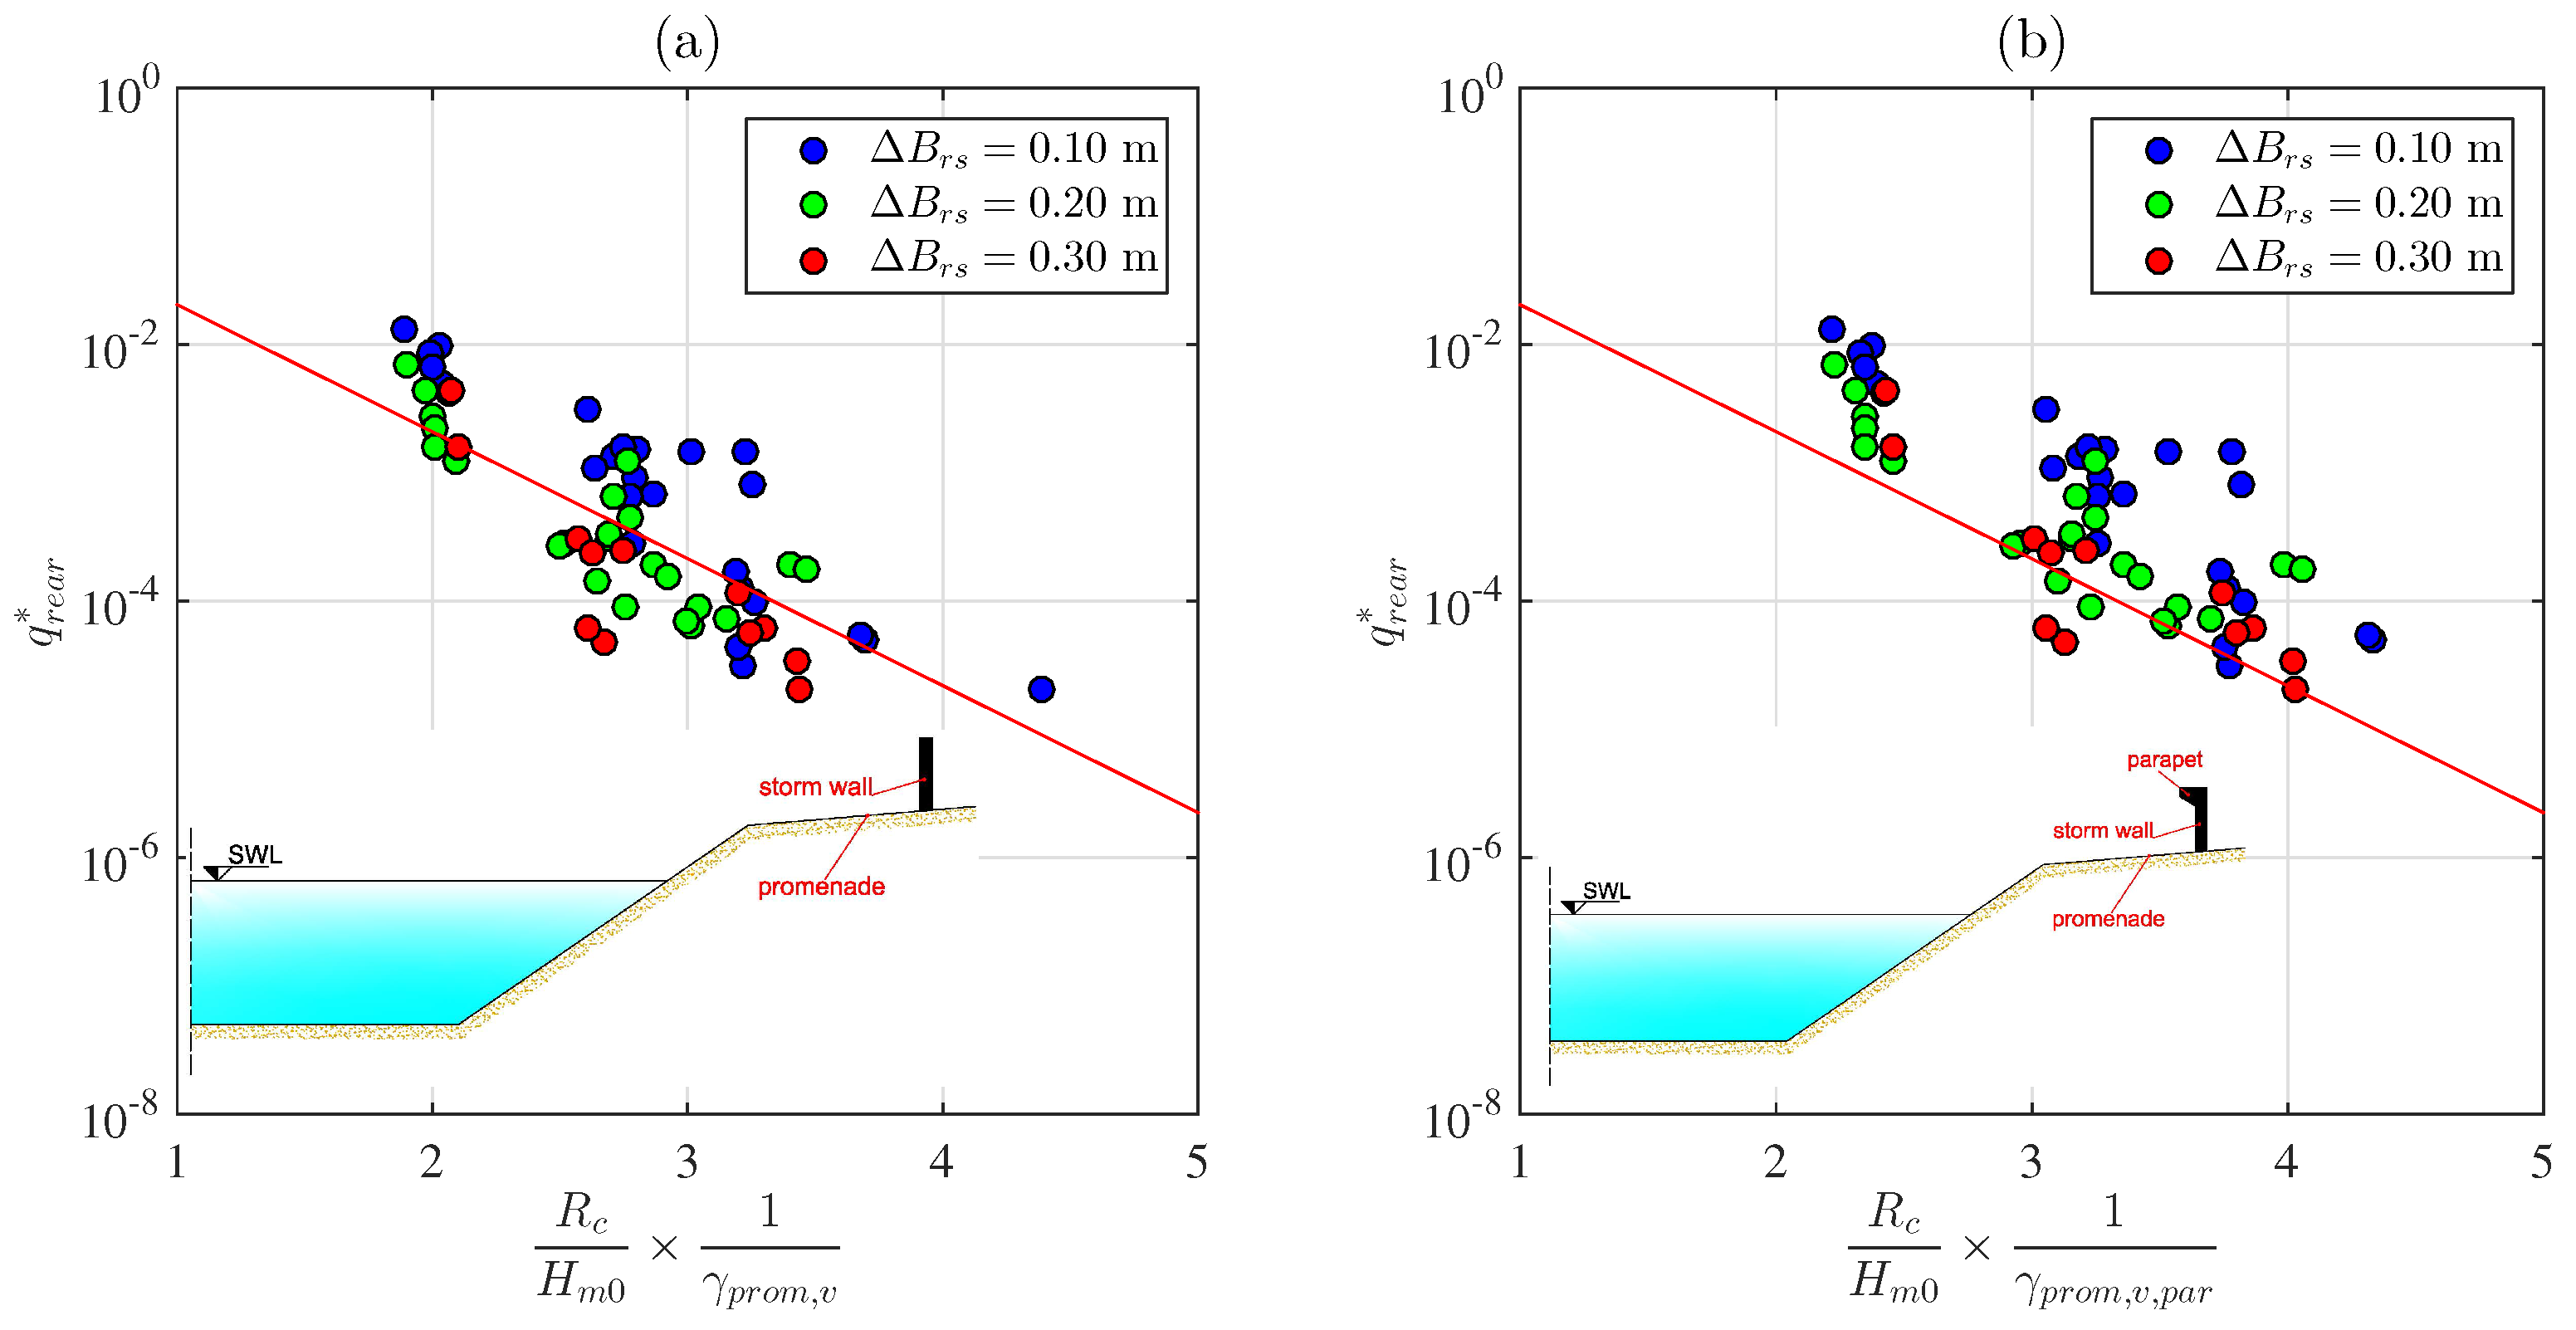
- overtopping at the rear side of the structure is reduced by adopting appropriate precautions, e.g., the realization of a parapet at the crest of the OBREC crown wall;
- (3)
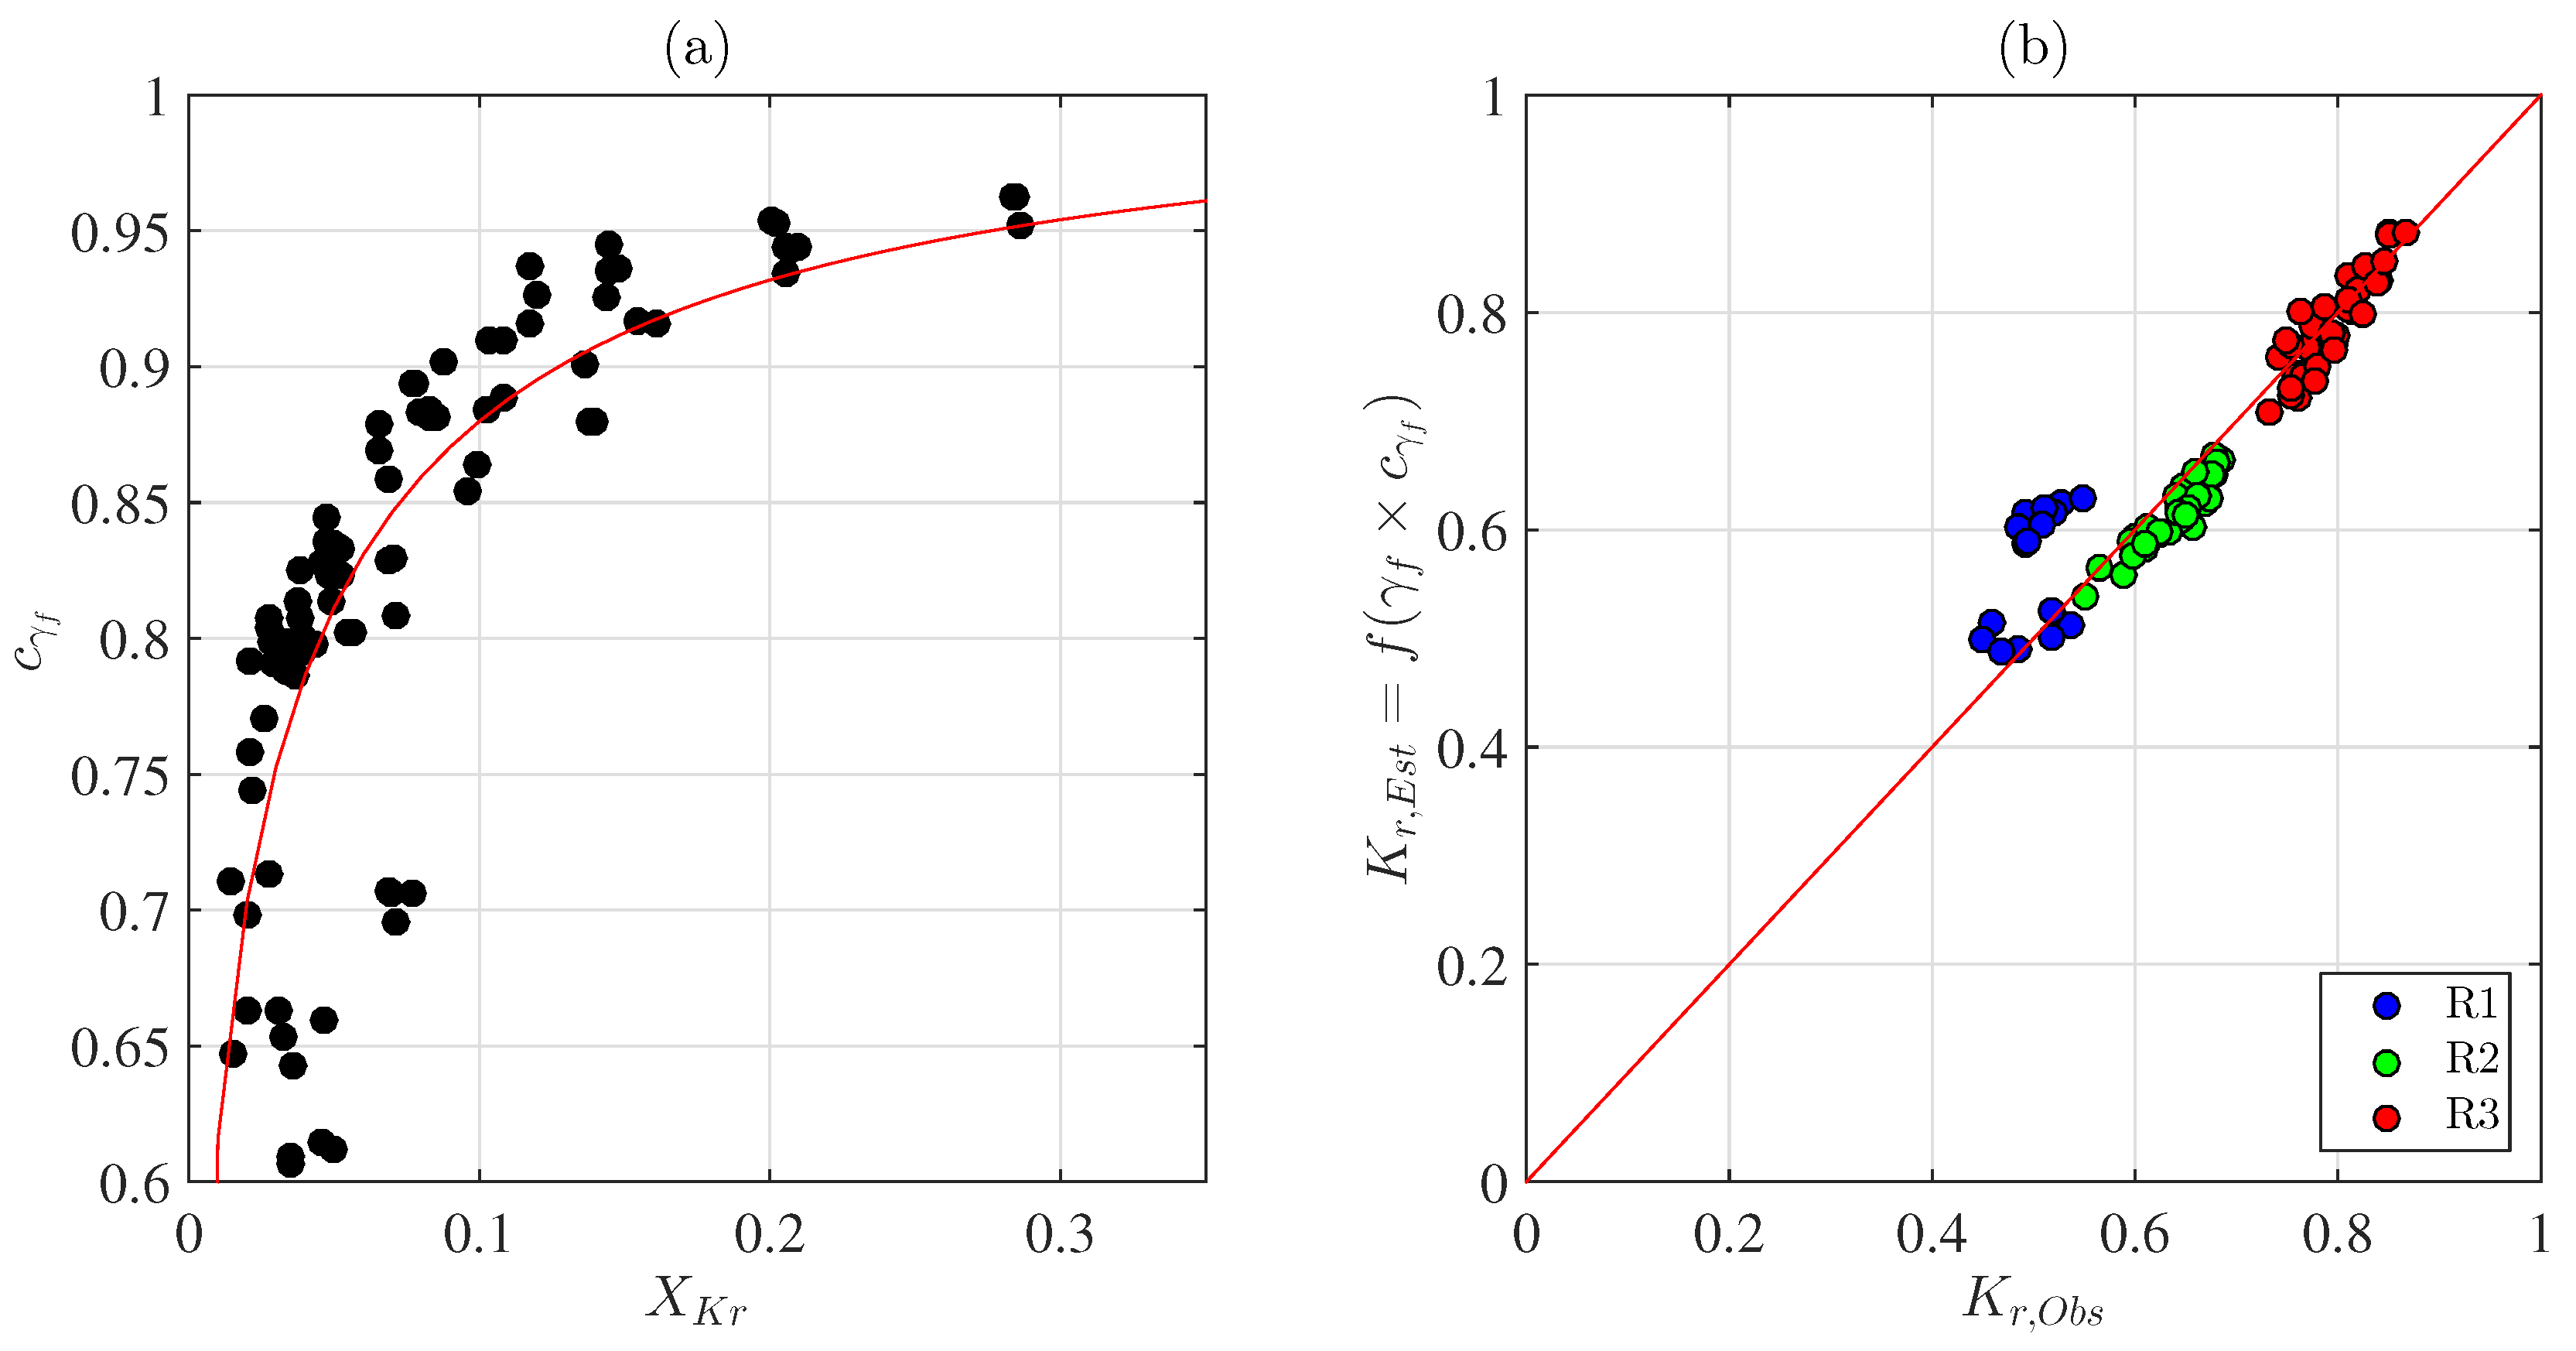
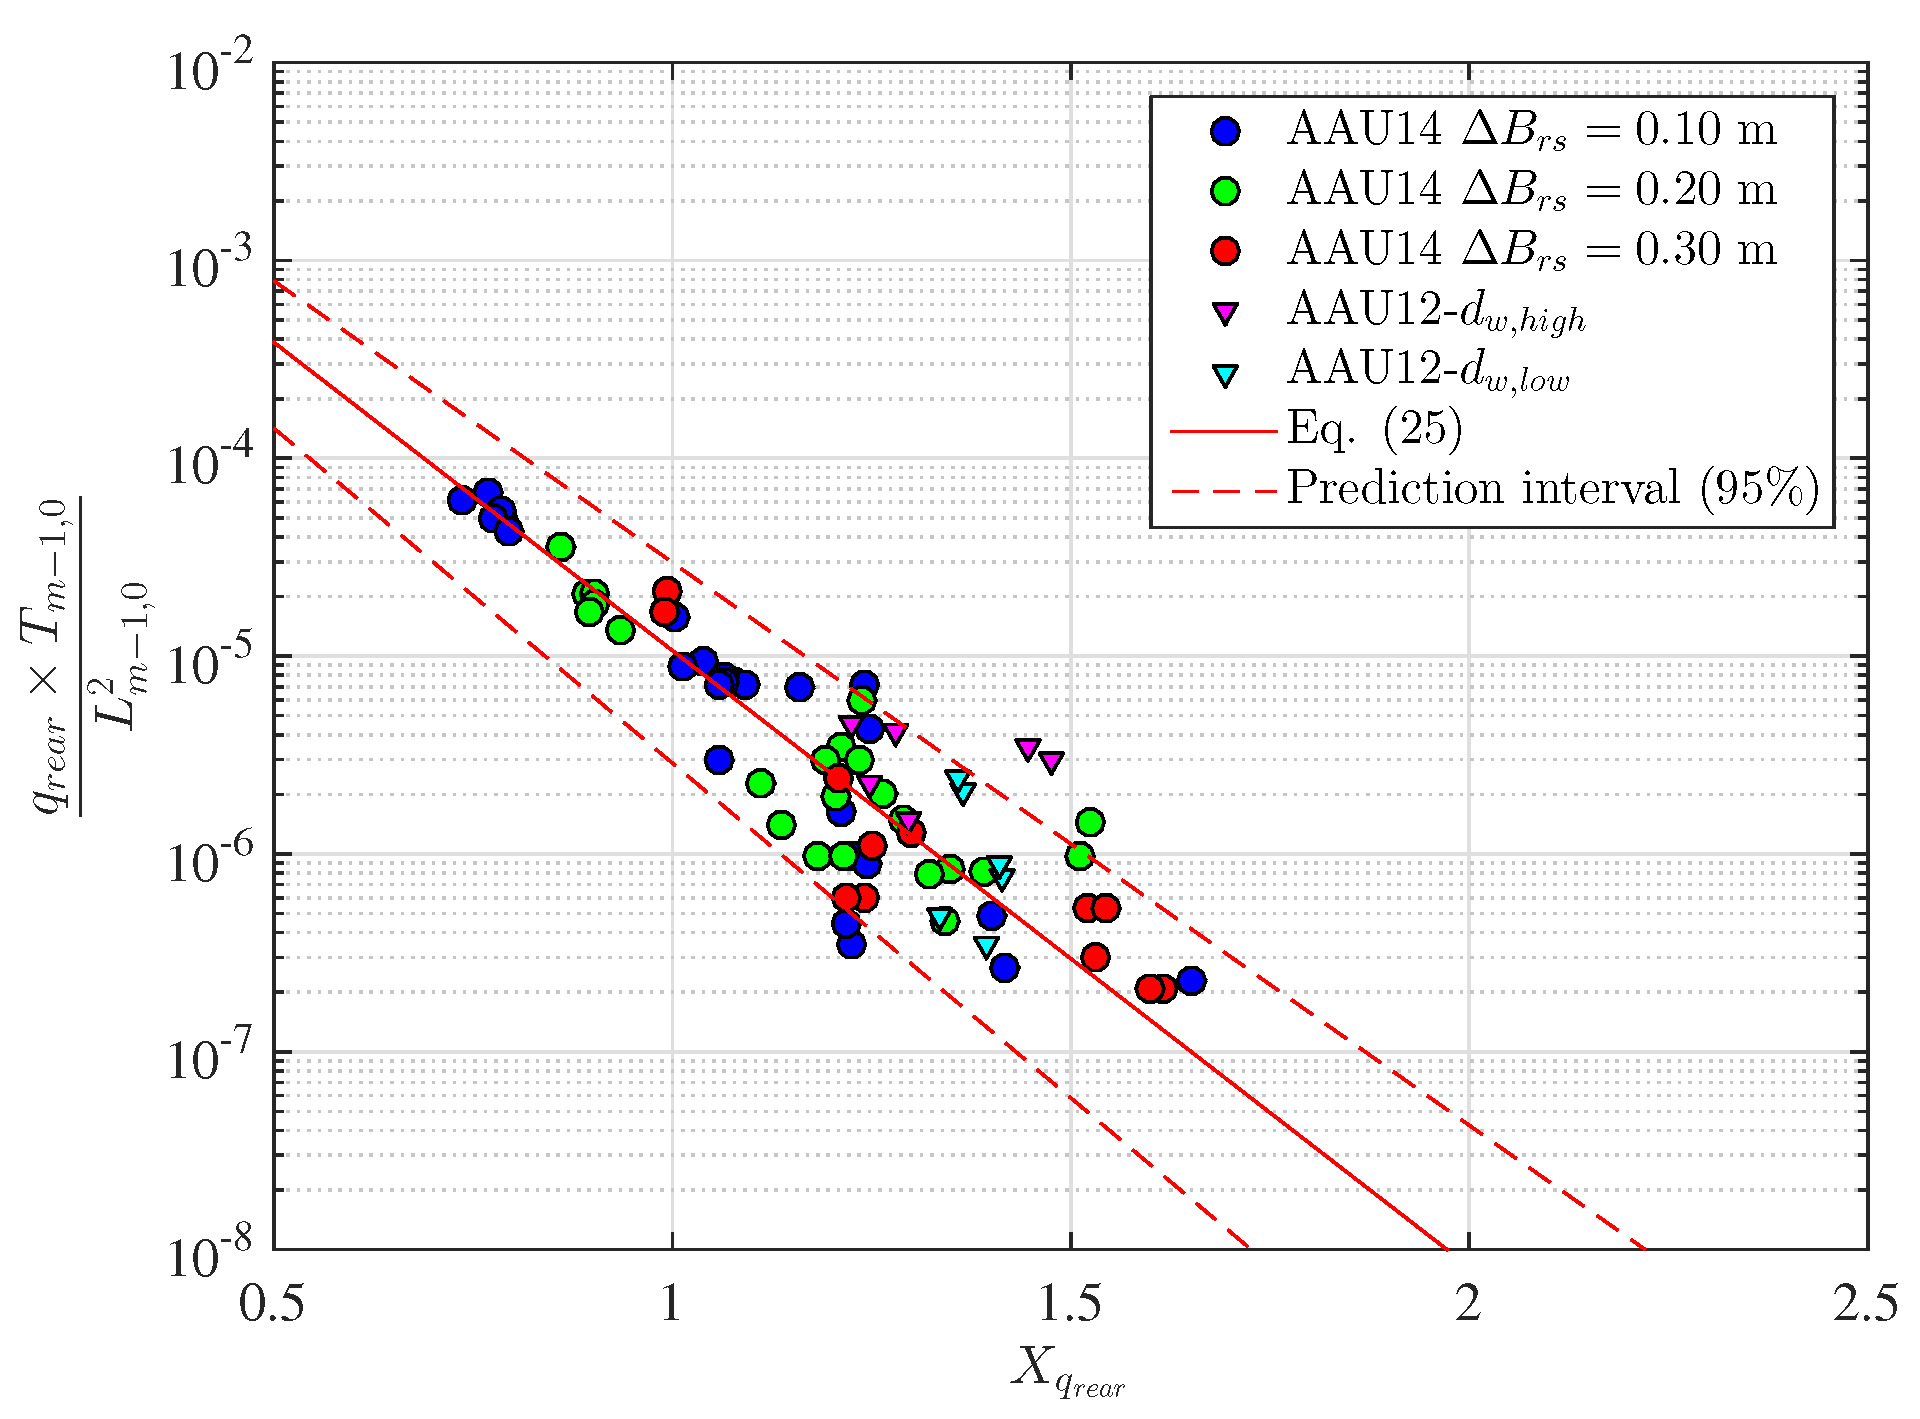
- new design methods have been proposed for the estimation of the reflection coefficient, overtopping at the rear side of the structure and overtopping volume in the front reservoir.
2. Experimental Procedure and Setup
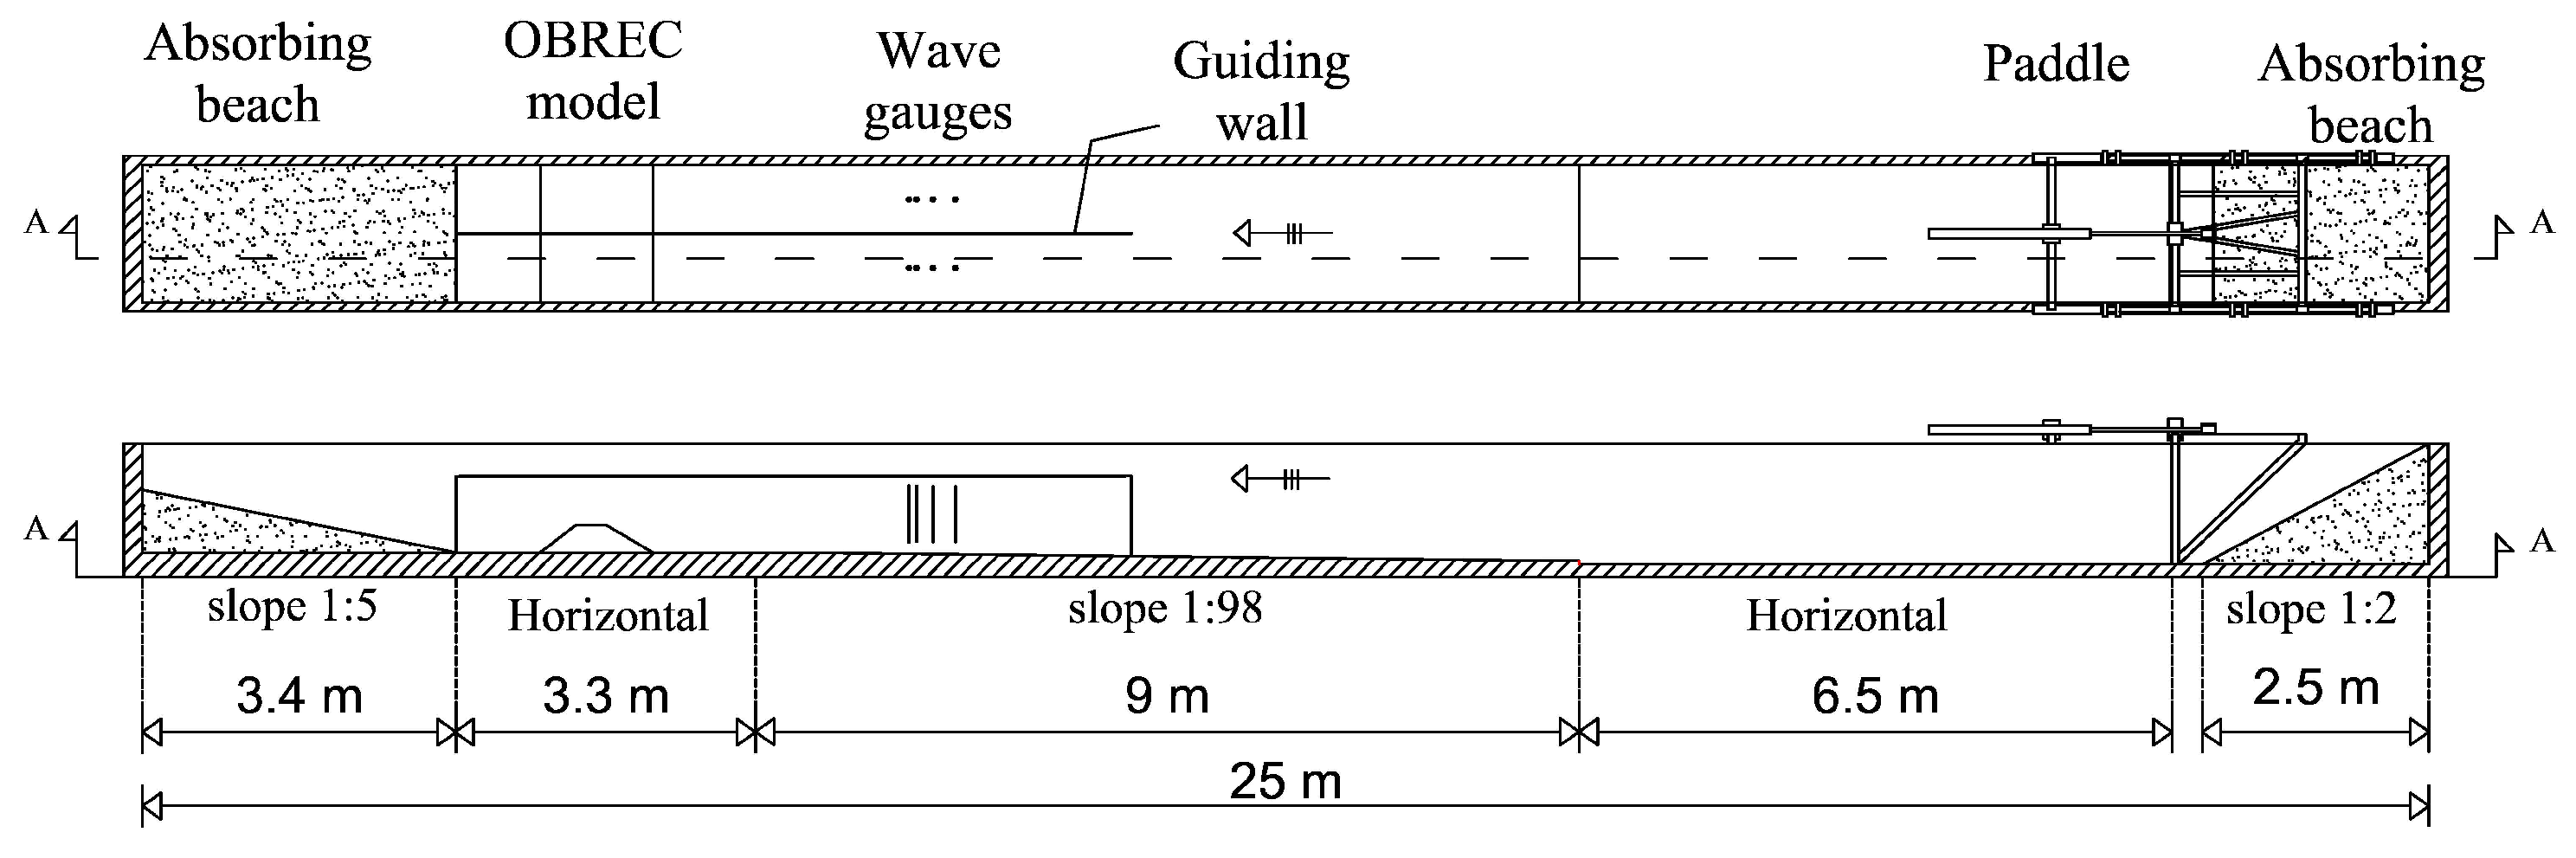
2.1. Wave Flume
2.2. Tested Configurations
2.3. Wave Characteristics
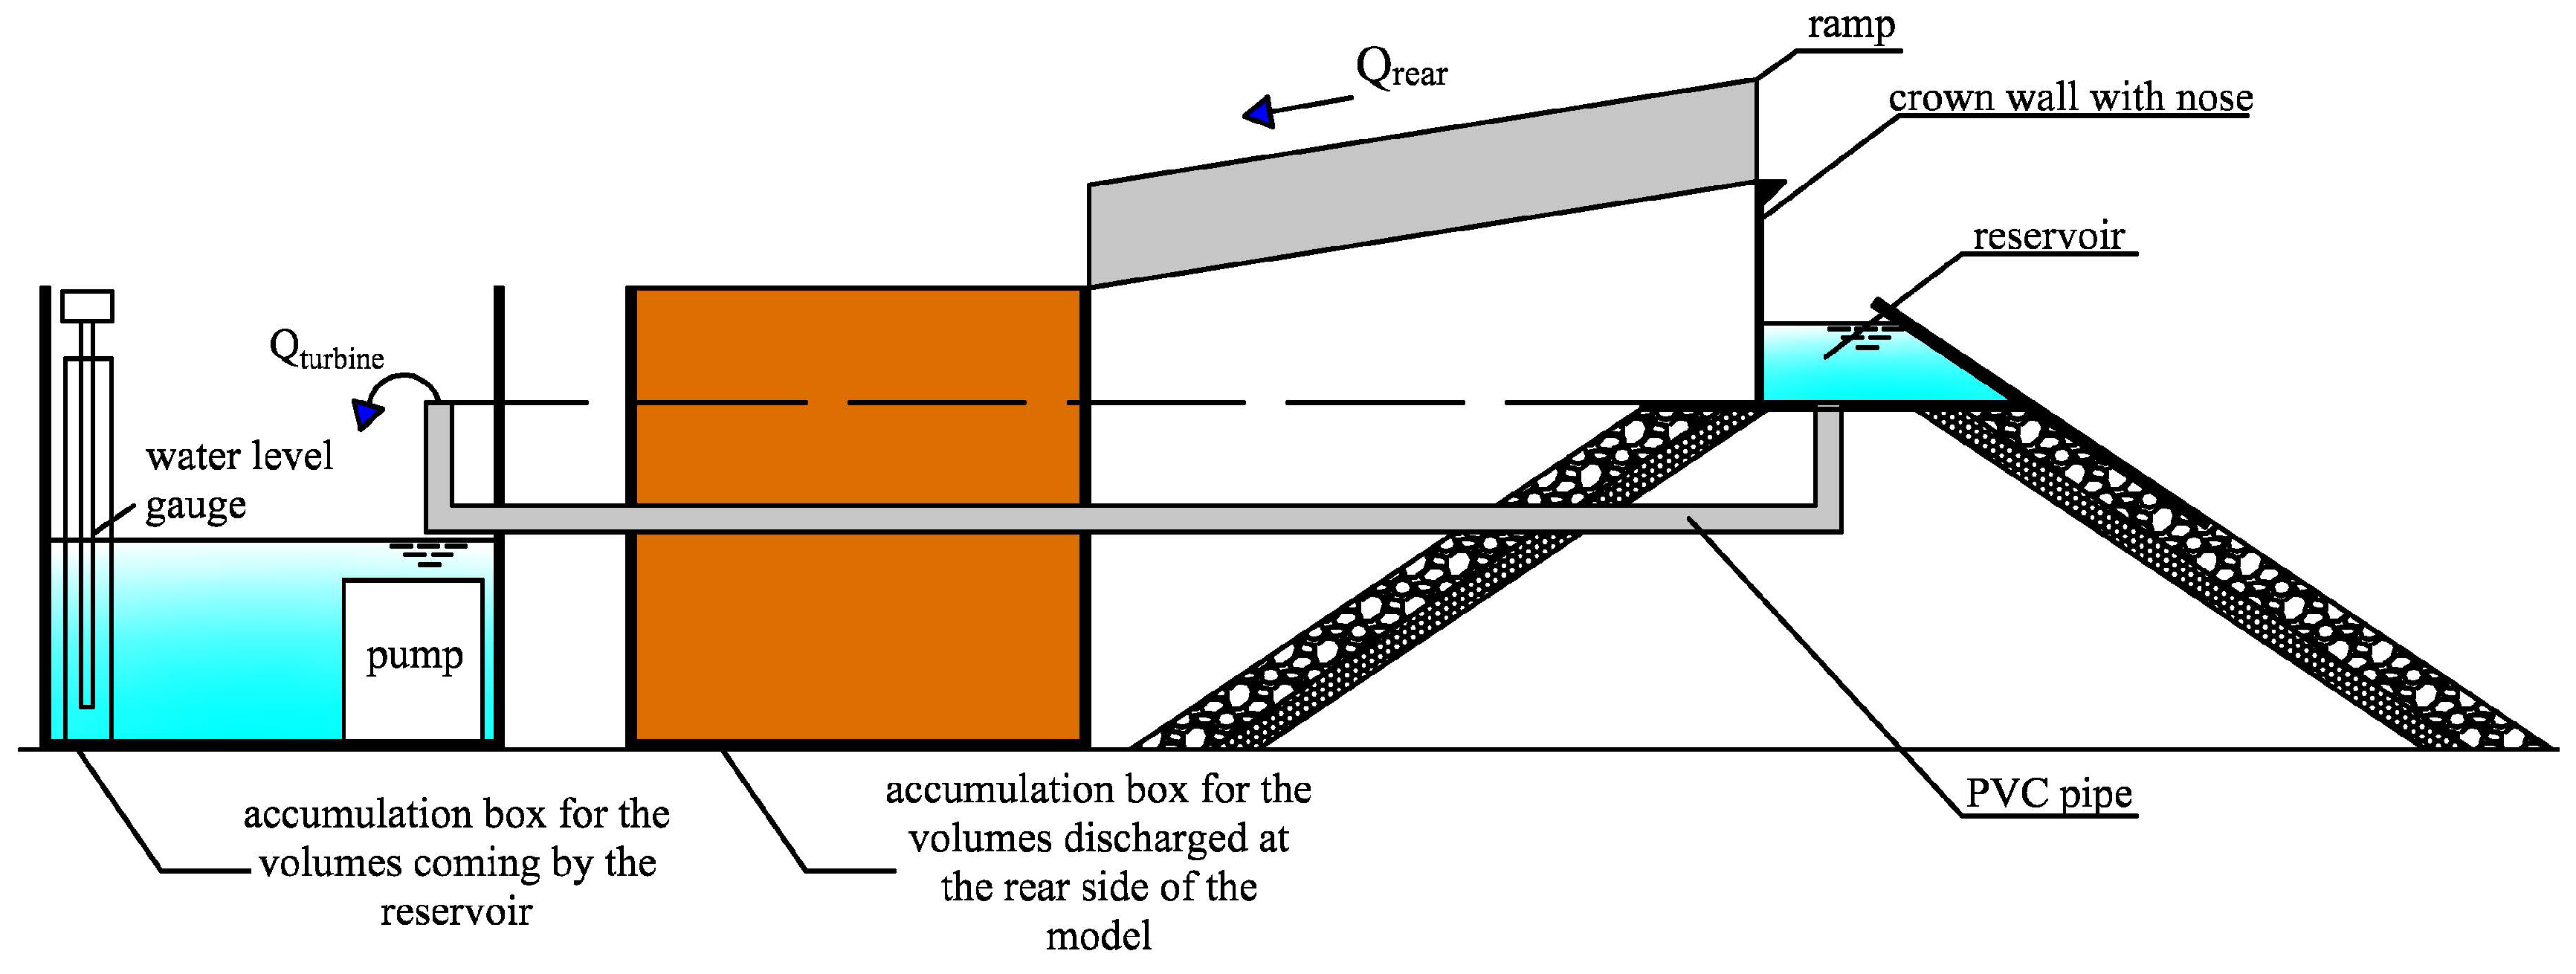
2.4. Instruments
3. Results
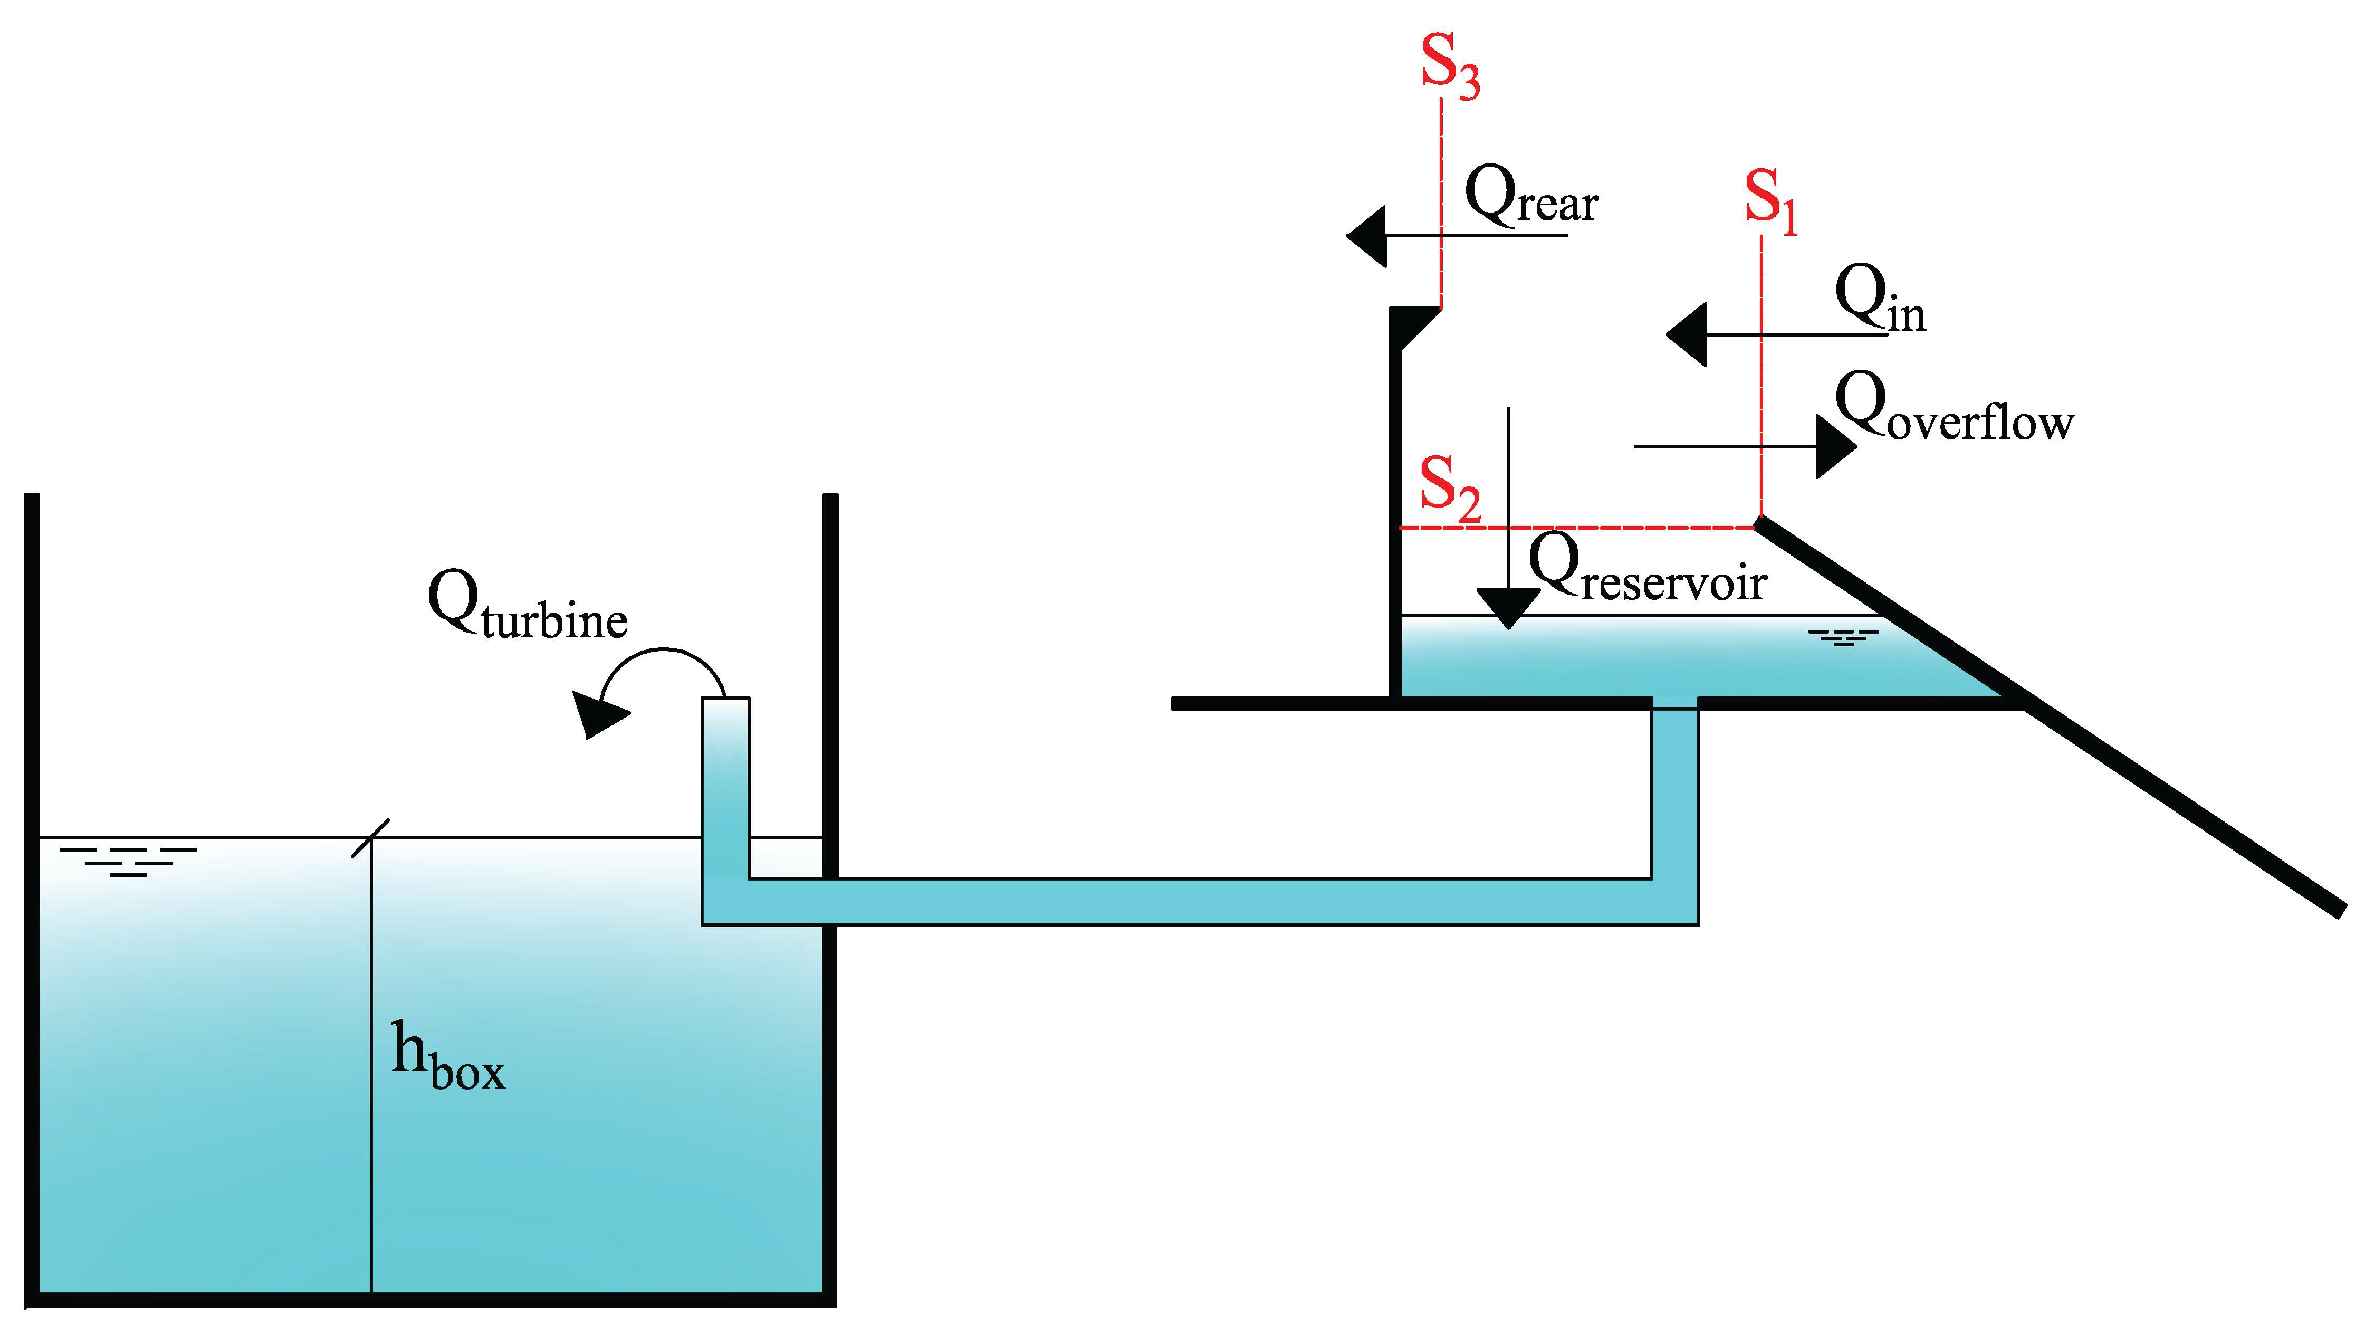
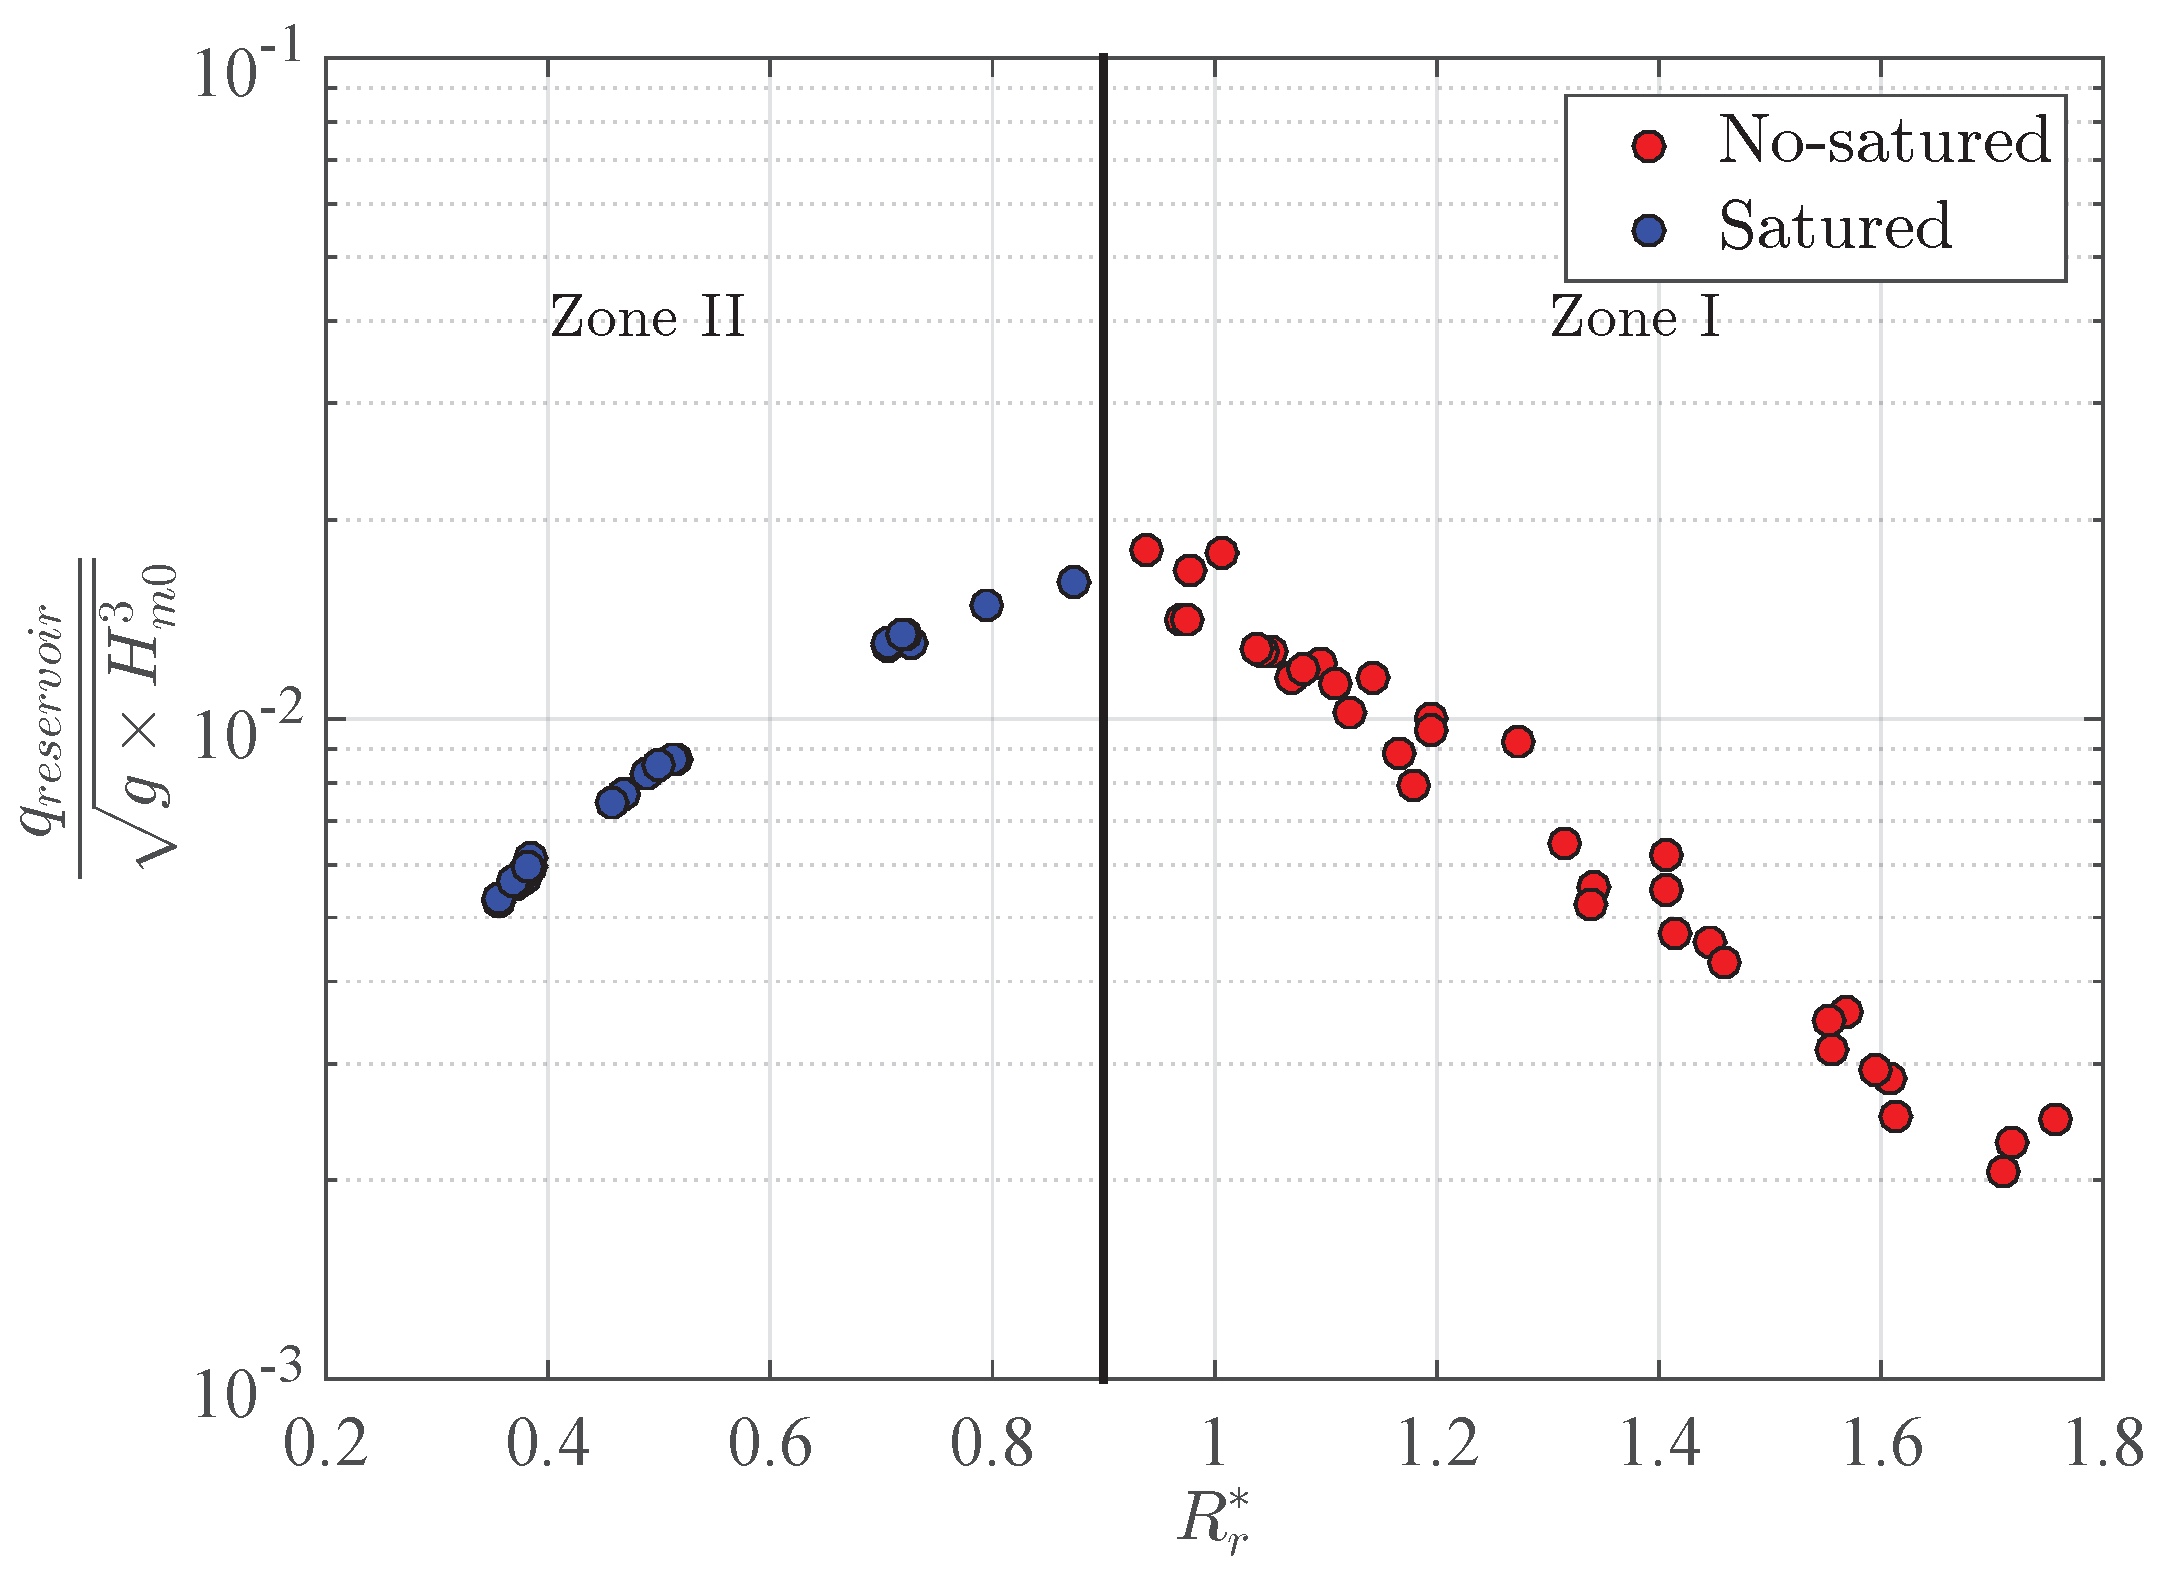
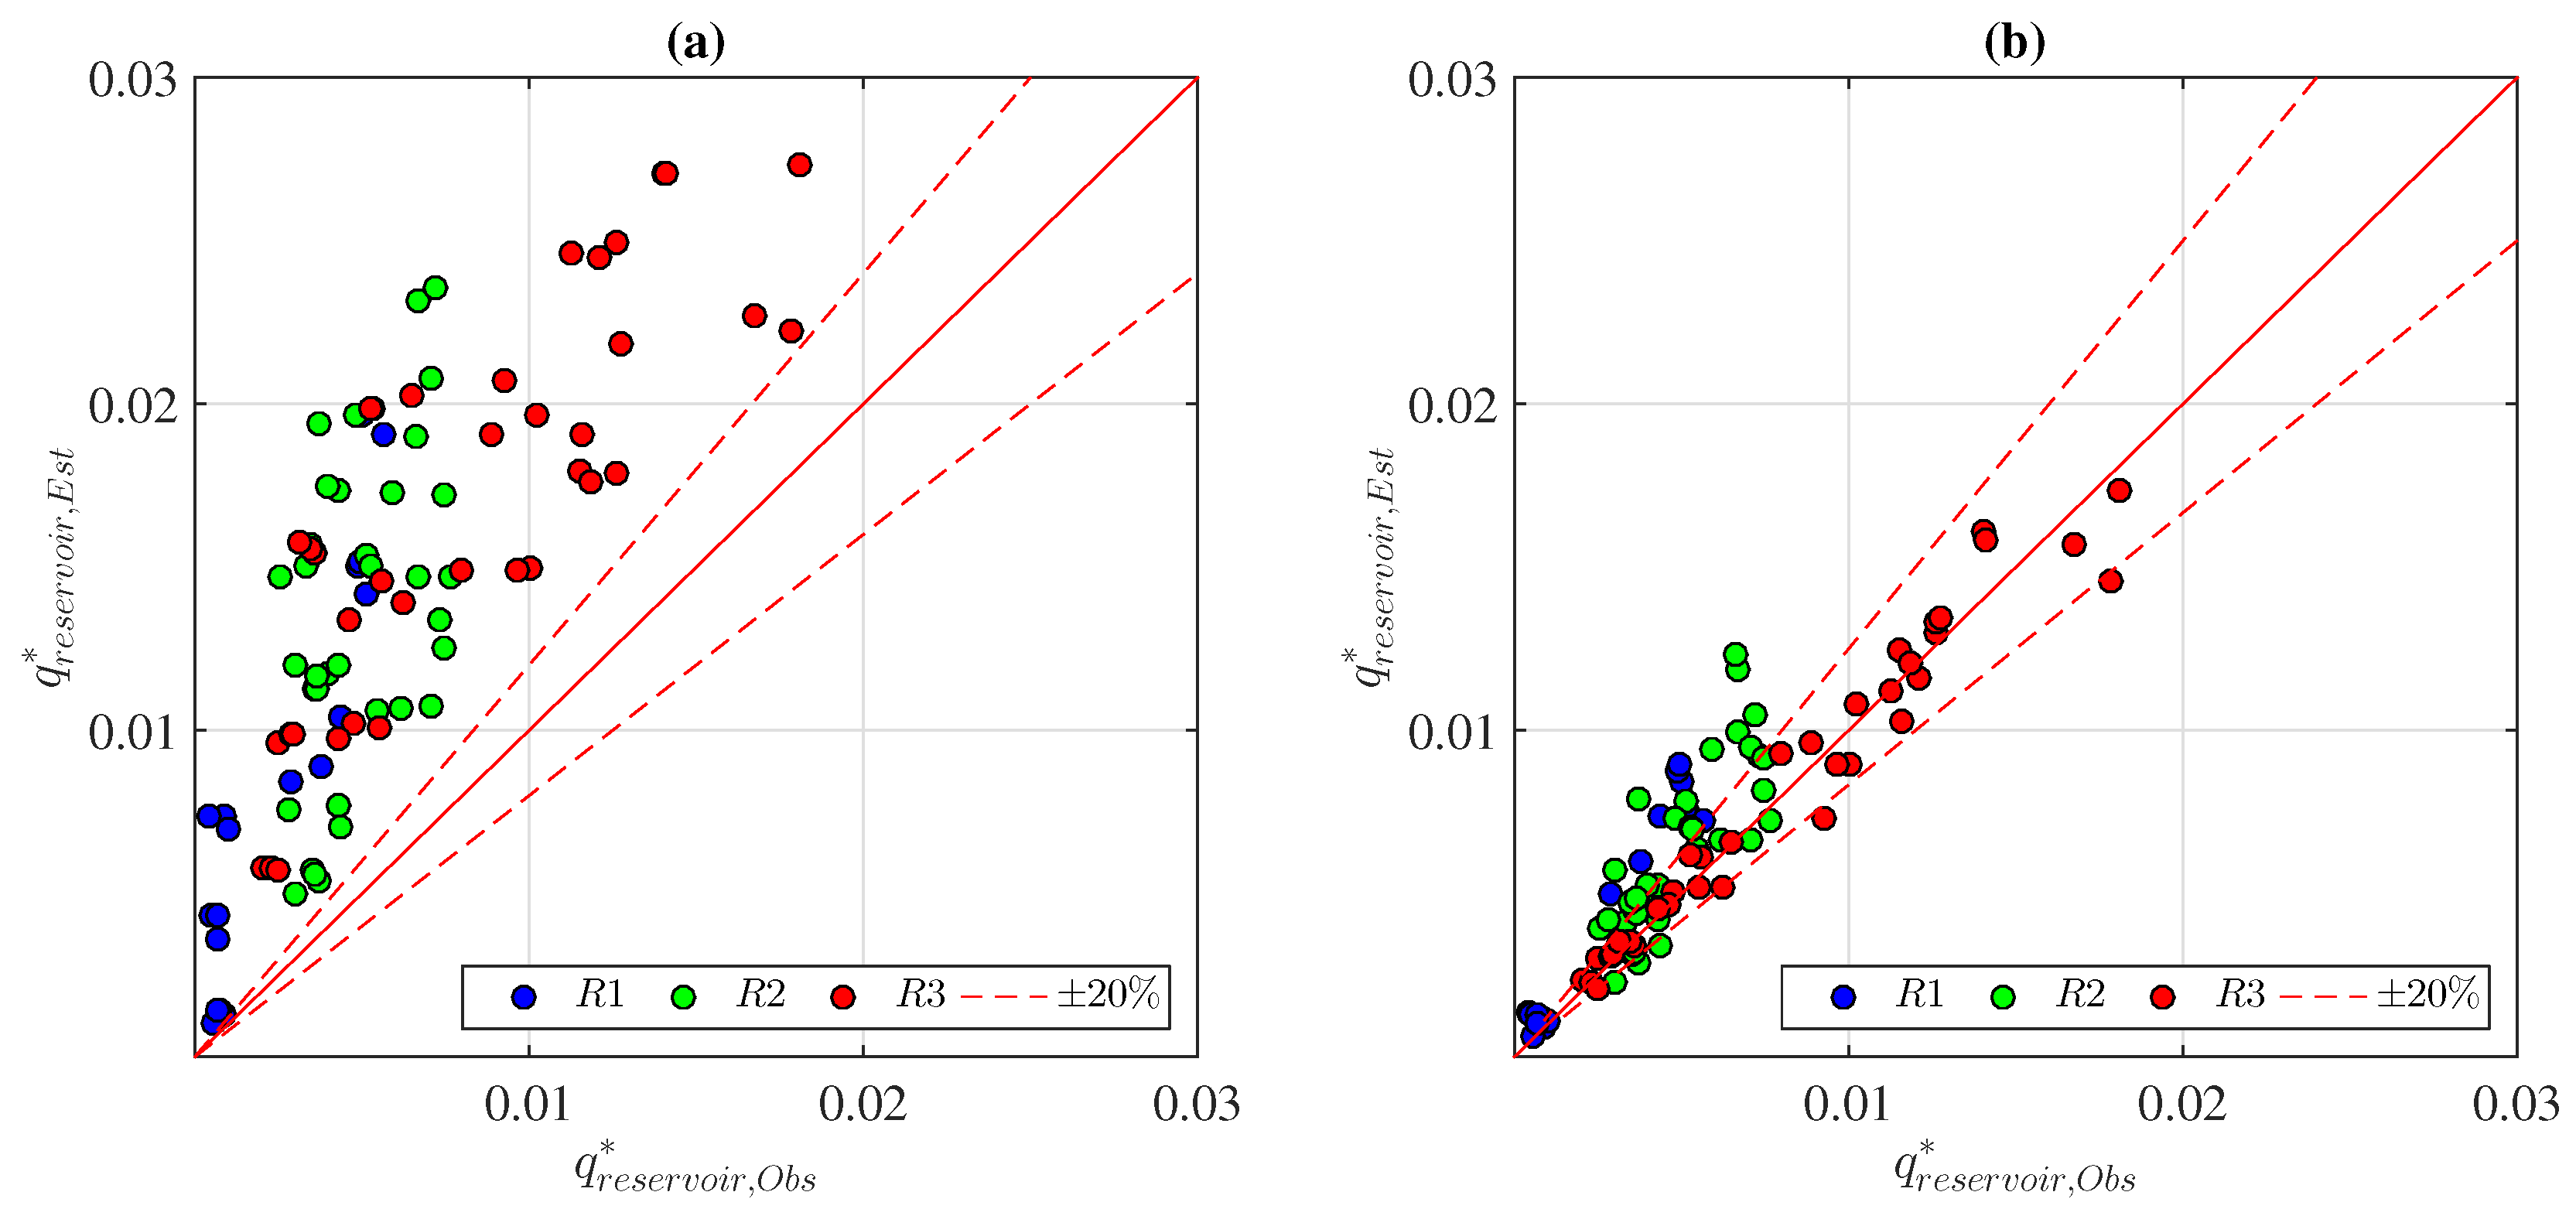
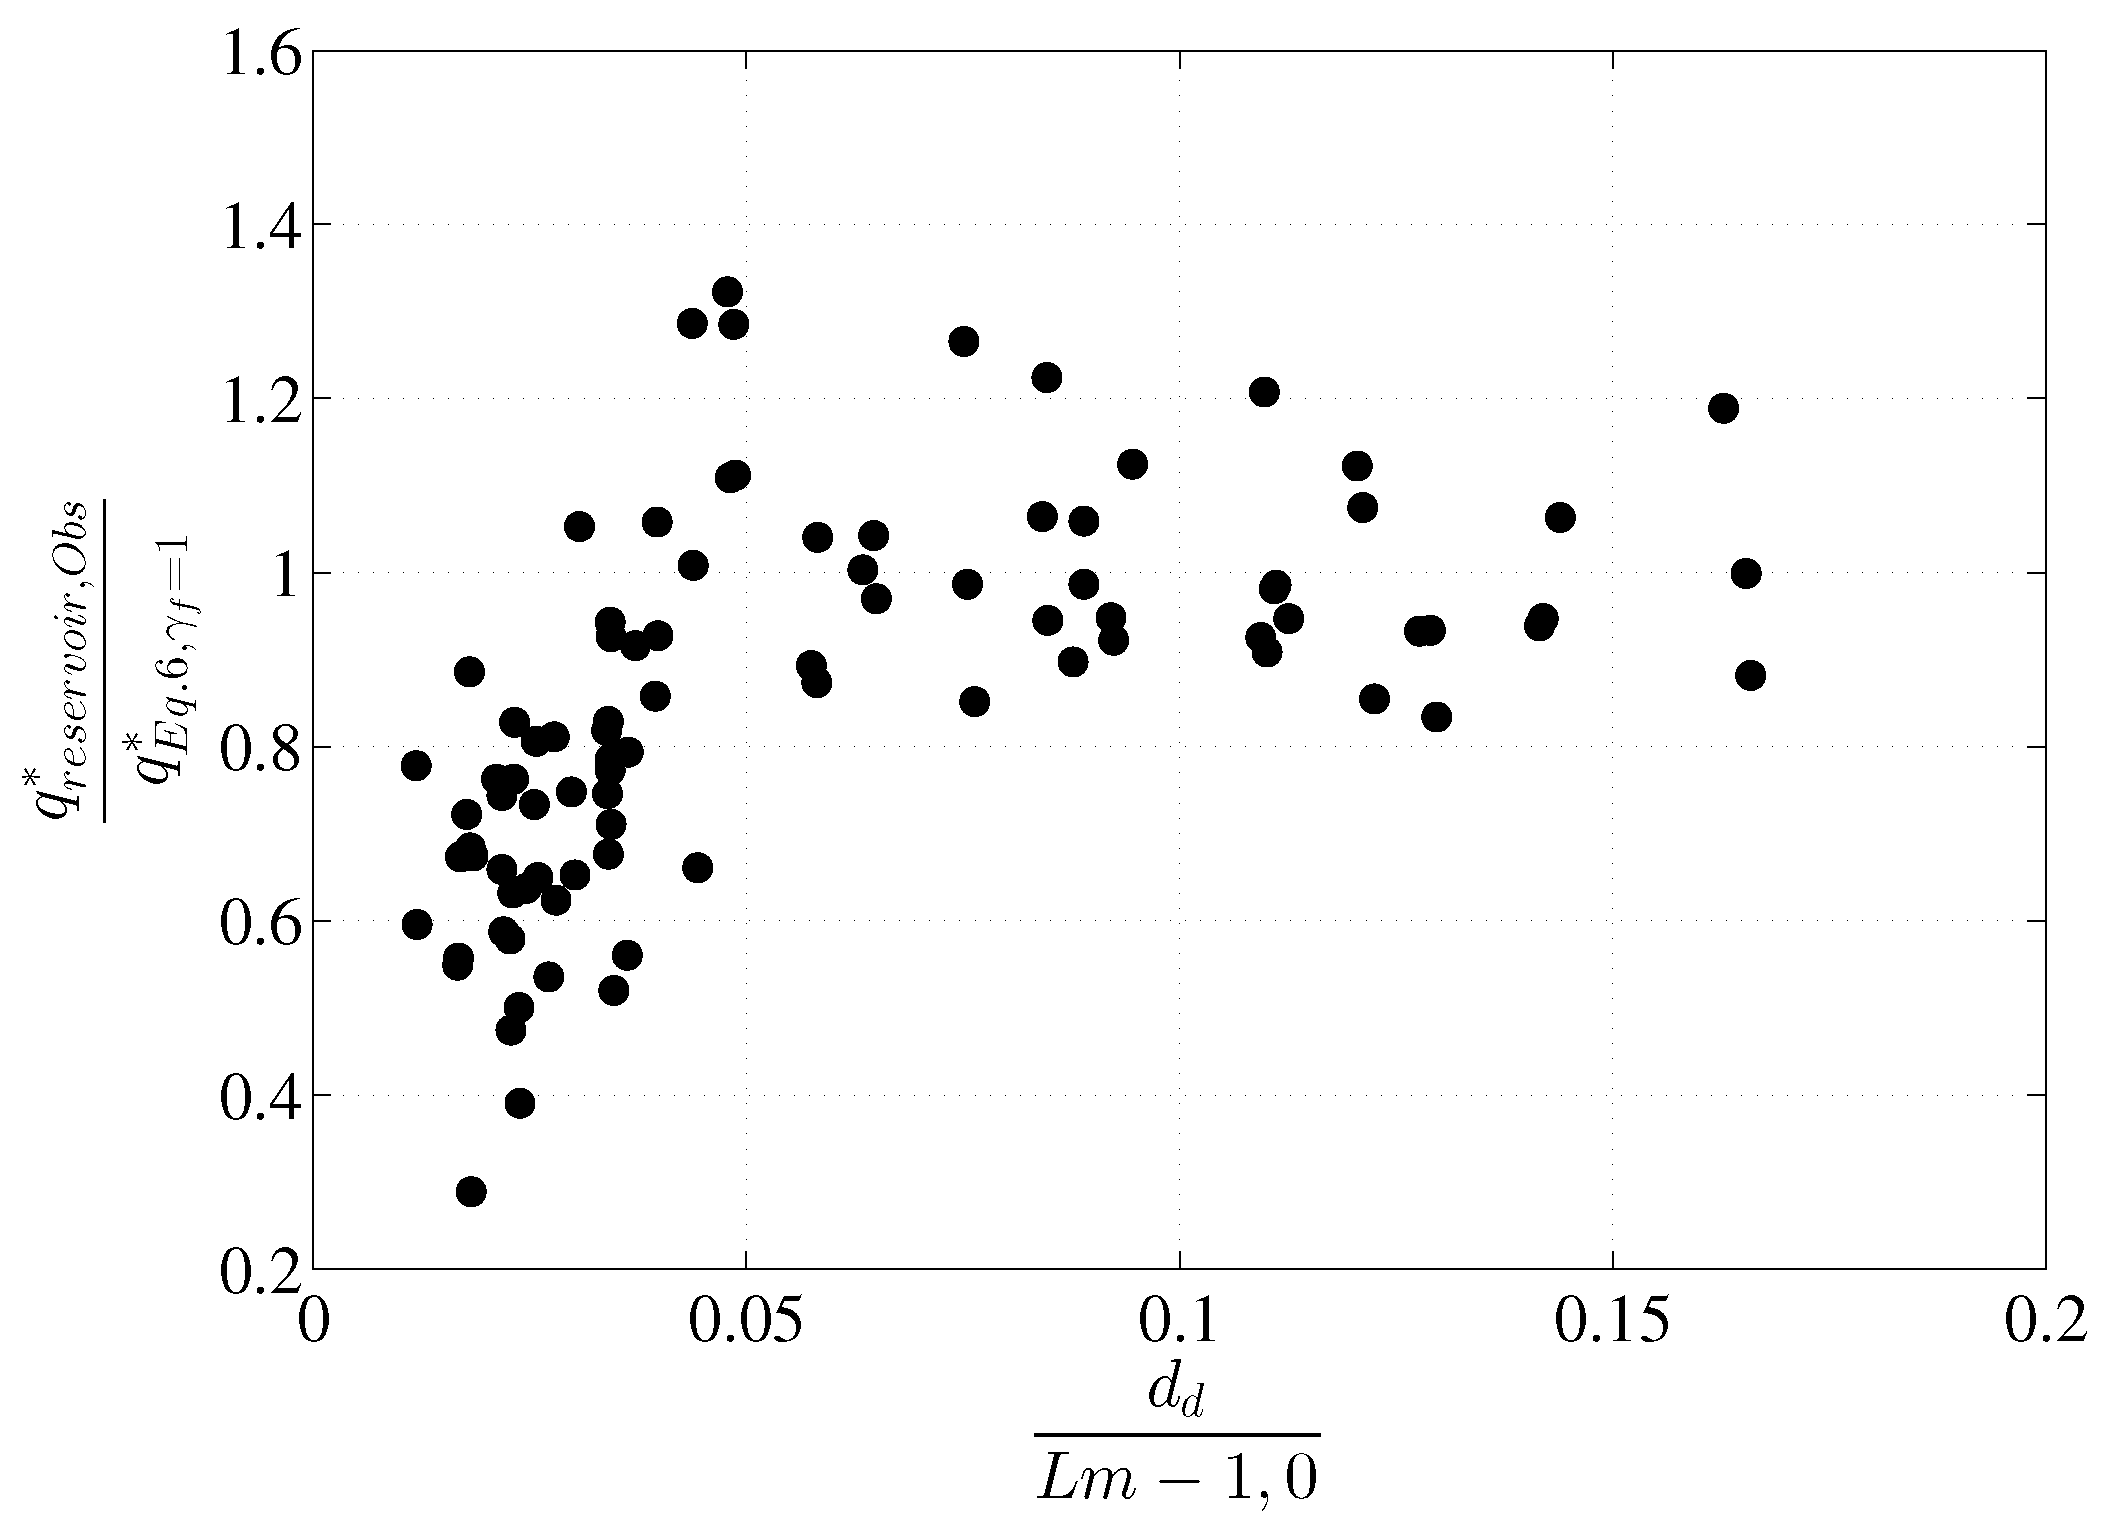
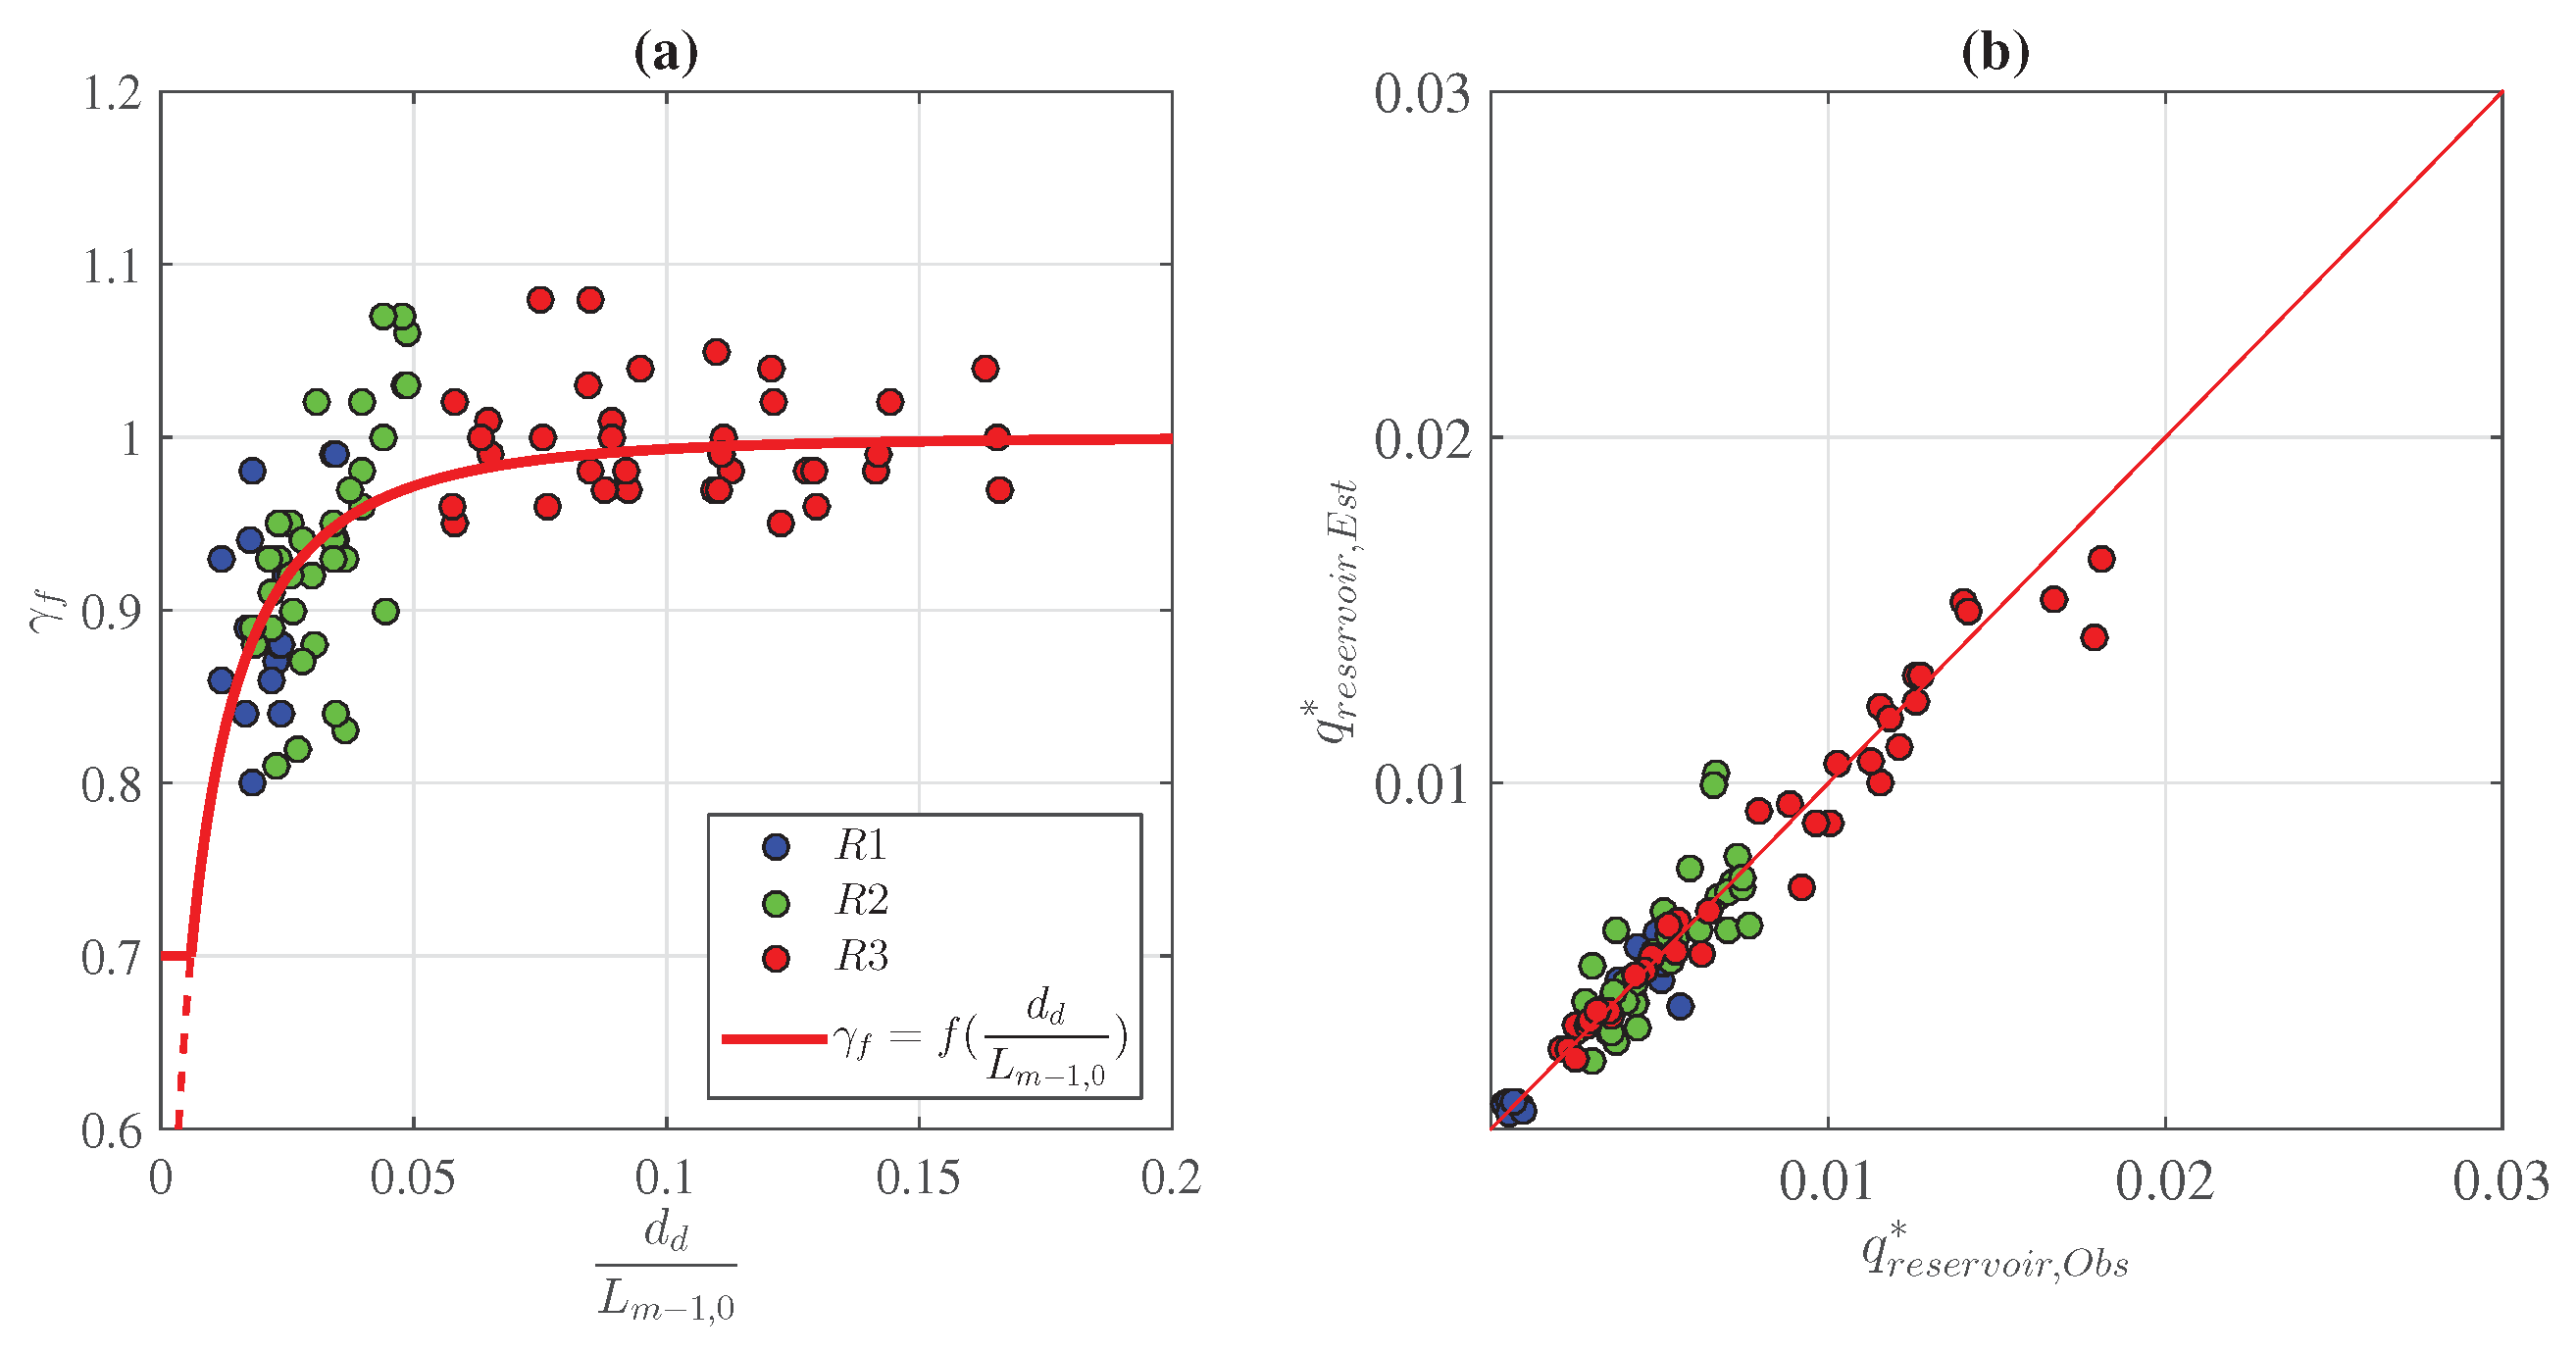
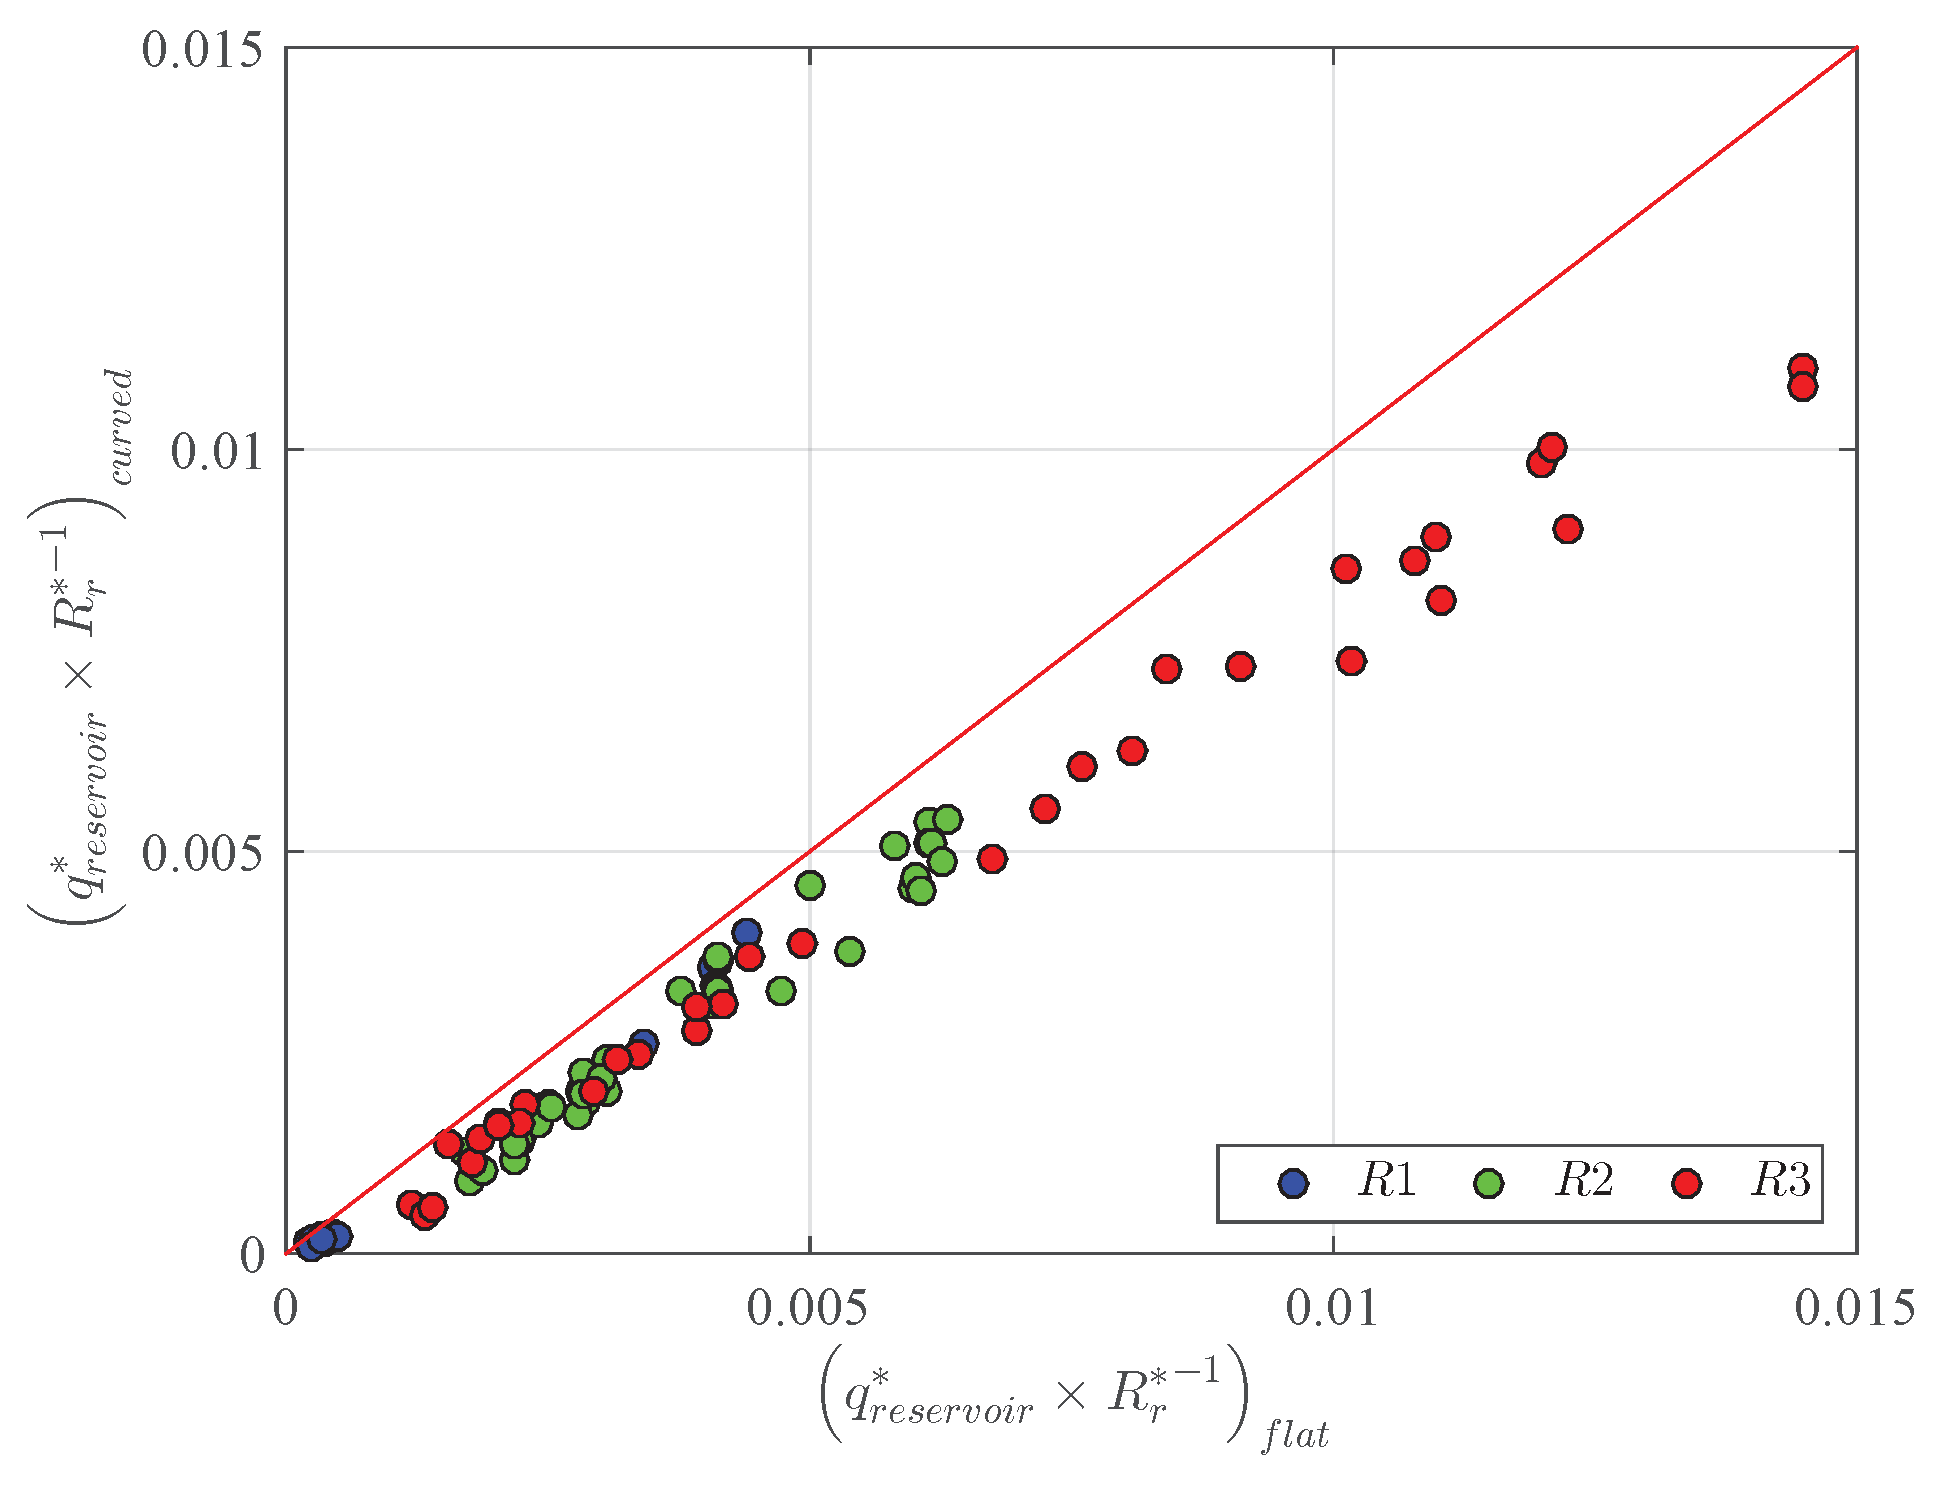
3.1. Overtopping Discharge in the Front Reservoir
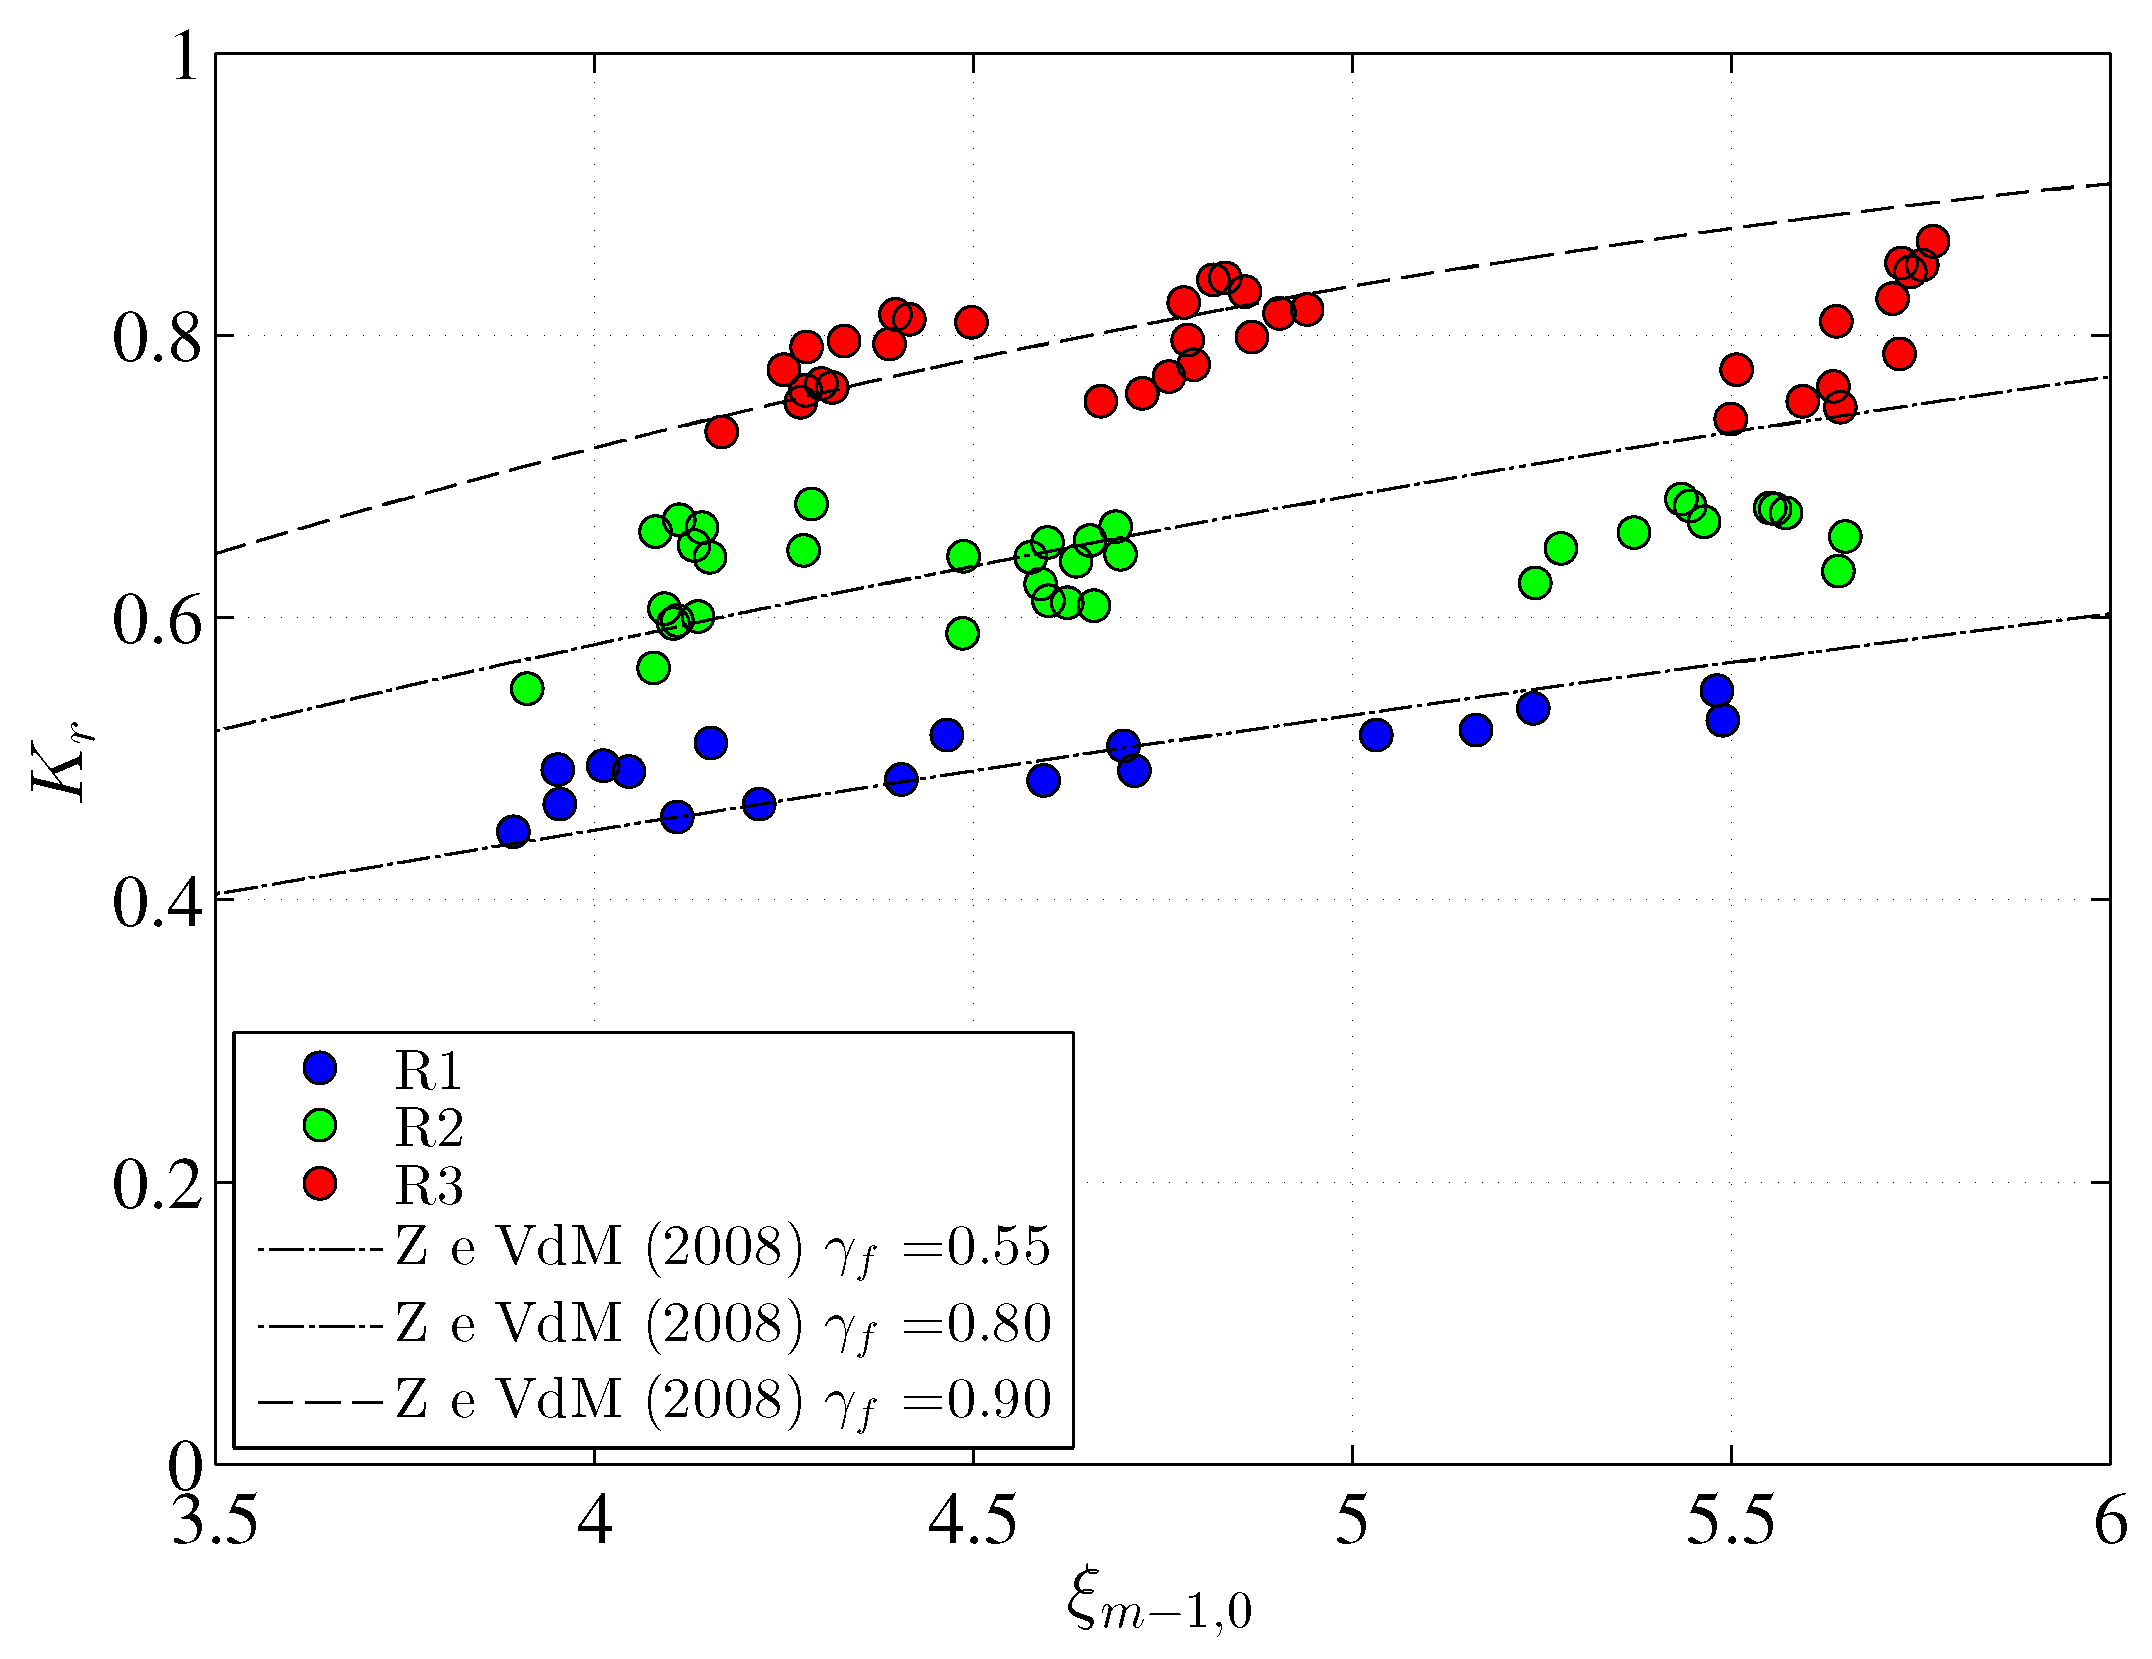
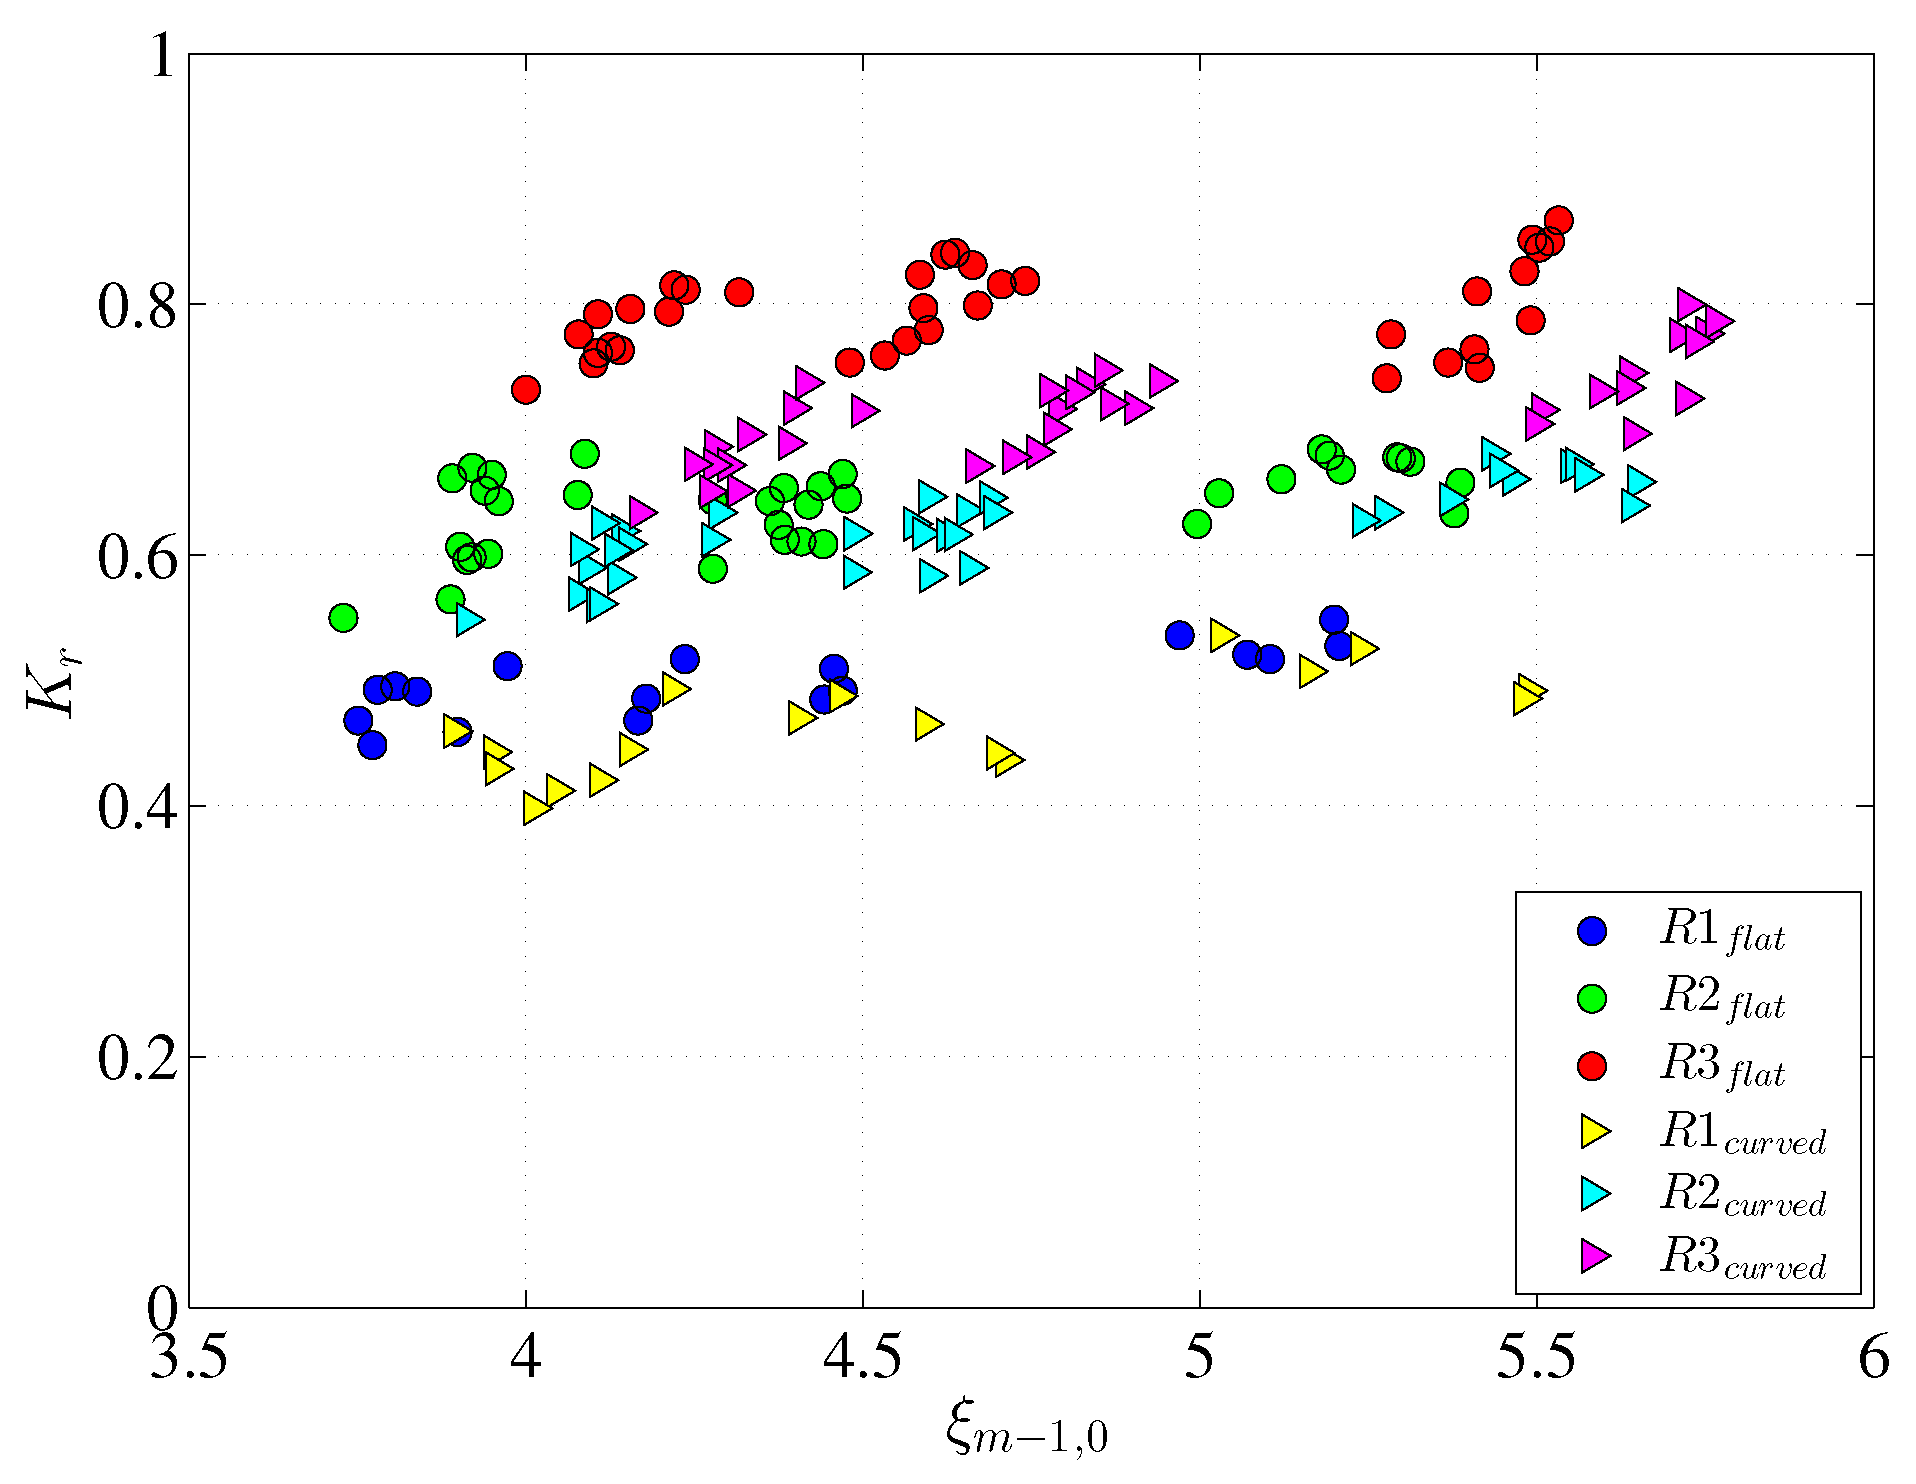
3.2. Reflection
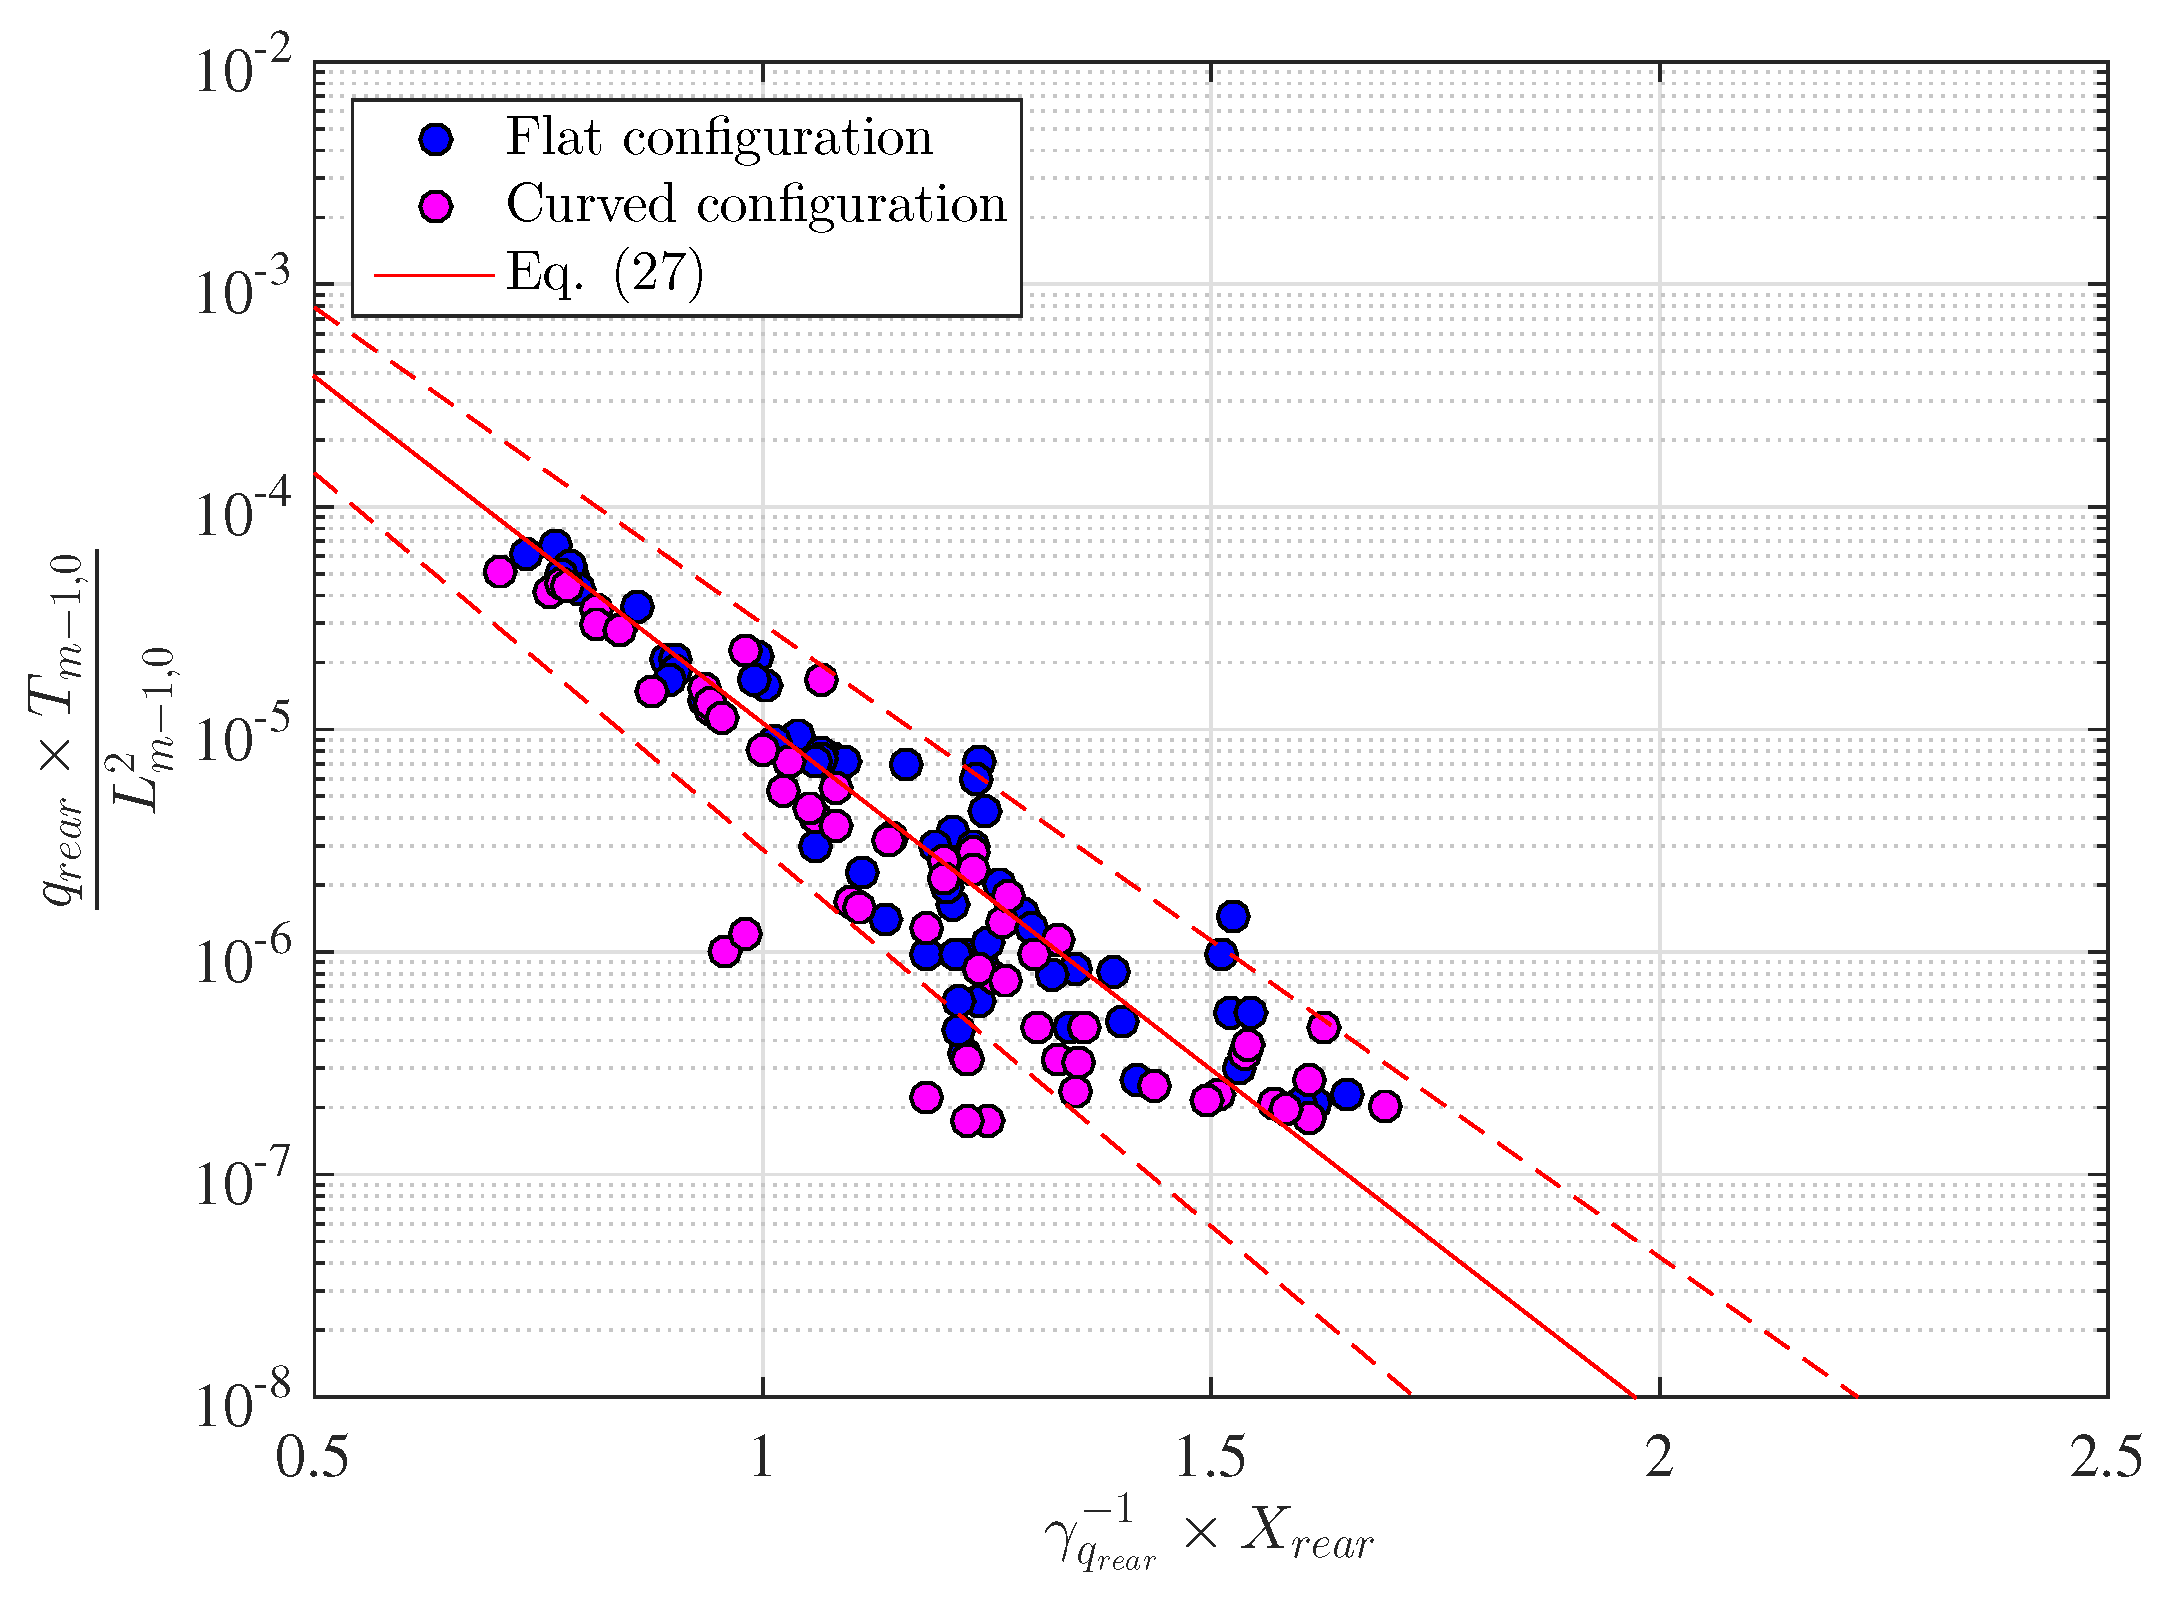
3.3. Wave Overtopping at the Rear Side of the Structure
4. Conclusions
Acknowledgments
Author Contributions
Conflicts of Interest
Nomenclature
| (m) | reservoir width |
| (m) | emerged sloping plate width |
| (m) | height of the submerged sloping plate |
| (m) | equivalent cube side length exceed by 50% of the stones |
| (m) | height of sloping plate |
| g () | gravity acceleration |
| h (m) | depth at the toe of the structure |
| (m) | depth in the accumulation box |
| (m) | reflected significant wave height at the toe of the structure |
| (m) | incident significant wave height at the toe of the structure |
| (m) | depth in the front reservoir |
| (-) | reflection coefficient |
| (m) | deep water wavelength referenced to |
| () | spectral moment of order 0 |
| () | spectral moment of order −1 |
| (-) | non-dimensional overtopping discharge towards the rear of the traditional rubble mound breakwater crown wall or towards the rear OBREC crown wall |
| (-) | non-dimensional overtopping discharge into the reservoir |
| () | average overtopping discharge towards the rear of the traditional rubble mound breakwater crown wall or towards the rear of the OBREC crown wall |
| [] | average overtopping discharge into the reservoir |
| R [m] | crest free-board of the structure |
| [-] | relative crest free-board of crown wall |
| [-] | relative crest free-board of front reservoir |
| [m] | crest free-board of crown wall, i.e., the vertical distance between the crest of the vertical walland the still water level |
| [m] | crest free-board of front reservoir, i.e., the vertical distance between the crest of the sloping plate and the still water level |
| [-] | root mean square error |
| [-] | wave steepness at the toe of the structure |
| [-] | non-dimensional wave-structure steepness |
| [s] | spectral incident energy wave period at the toe of the structure |
| [s] | incident peak wave period |
| α [°] | slope angle of the structure |
| γ [-] | peak-enhancement factor |
| [-] | reduction factor for oblique wave attack |
| [-] | reduction factor for berm |
| [-] | reduction factor for slope roughness |
| [-] | reduction factor for the storm wall |
| [-] | reduction factor for the parapet |
| [-] | reduction factor for the promenade |
| ρ [] | water density |
| [-] | breaker parameter referenced to |
| [m] | horizontal distance between the crown wall and the crest of the ramp |
| [m] | vertical distance between the crown wall and the crest of the ramp |
References
- Mofor, L.; Goldsmith, J.; Jones, F. OCEAN ENERGY: Technology Readiness, Patents, Deployment Status and Outlook; International Renewable Energy Agency (IRENA): Masdar City, United Arab Emirates, 2014. [Google Scholar]
- Pastor, J.; Liu, Y. Power absorption modeling and optimization of a point absorbing wave energy converter using numerical method. J. Energy Resour. Technol. 2014, 136, 021207. [Google Scholar] [CrossRef]
- Drew, B.; Plummer, A.; Sahinkaya, M.N. A review of wave energy converter technology. Proc. Inst. Mech. Eng. A. J. Power Energy 2009, 223, 887–902. [Google Scholar] [CrossRef]
- Azzellino, A.; Conley, D.; Vicinanza, D.; Kofoed, J.P. Marine renewable energies: Perspectives and implications for marine ecosystems. Sci. World J. 2013, 2013. [Google Scholar] [CrossRef] [PubMed]
- Peres, D.; Iuppa, C.; Cavallaro, L.; Cancelliere, A.; Foti, E. Significant wave height record extension by neural networks and reanalysis wind data. Ocean Model. 2015, 94, 128–140. [Google Scholar] [CrossRef]
- Falcão, A. Wave energy utilization: A review of the technologies. Renew. Sustain. Energy Rev. 2010, 14, 899–918. [Google Scholar] [CrossRef]
- Clément, A.; McCullen, P.; Falcão, A.; Fiorentino, A.; Gardner, F.; Hammarlund, K.; Lemonis, G.; Lewis, T.; Nielsen, K.; Petroncini, S.; et al. Wave energy in Europe: Current status and perspectives. Renew. Sustain. Energy Rev. 2002, 6, 405–431. [Google Scholar] [CrossRef]
- Vicinanza, D.; Contestabile, P.; Nørgaard, J.Q.H.; Andersen, T.L. Innovative rubble mound breakwaters for overtopping wave energy conversion. Coast. Eng. 2014, 88, 154–170. [Google Scholar] [CrossRef]
- Viviano, A.; Naty, S.; Foti, E.; Bruce, T.; Allsop, W.; Vicinanza, D. Large-scale experiments on the behavior of a generalised Oscillating Water Column under random waves. Renew. Energy 2016, 99, 875–887. [Google Scholar] [CrossRef]
- Pastor, J.; Liu, Y. Frequency and time domain modeling and power output for a heaving point absorber wave energy converter. Int. J. Energy Environ. Eng. 2014, 5, 1–13. [Google Scholar] [CrossRef]
- Vicinanza, D.; Nørgaard, J.H.; Contestabile, P.; Andersen, T.L. Wave loadings acting on overtopping breakwater for energy conversion. J. Coast. Res. 2013, 65, 1669–1674. [Google Scholar] [CrossRef]
- Iuppa, C.; Cavallaro, L.; Foti, E.; Vicinanza, D. Potential wave energy production by different wave energy converters around Sicily. J. Renew. Sustain. Energy 2015, 7, 061701. [Google Scholar] [CrossRef]
- Iuppa, C.; Cavallaro, L.; Vicinanza, D.; Foti, E. Investigation of suitable sites for wave energy converters around Sicily (Italy). Ocean Sci. 2015, 11, 543–557. [Google Scholar] [CrossRef]
- Kofoed, J.P.; Frigaard, P.; Friis-Madsen, E.; Sørensen, H.C. Prototype testing of the wave energy converter wave dragon. Renew. Energy 2006, 31, 181–189. [Google Scholar] [CrossRef]
- Vicinanza, D.; Frigaard, P. Wave pressure acting on a seawave slot-cone generator. Coast. Eng. 2008, 55, 553–568. [Google Scholar] [CrossRef]
- Margheritini, L.; Vicinanza, D.; Frigaard, P. SSG wave energy converter: Design, reliability and hydraulic performance of an innovative overtopping device. Renew. Energy 2009, 34, 1371–1380. [Google Scholar] [CrossRef]
- Vicinanza, D.; Ciardulli, F.; Buccino, M.; Calabrese, M.; Koefed, J. Wave loadings acting on an innovative breakwater for energy production. J. Coast. Res. 2011, 64, 608–612. [Google Scholar]
- Vicinanza, D.; Margheritini, L.; Kofoed, J.P.; Buccino, M. The SSG wave energy converter: Performance, status and recent developments. Energies 2012, 5, 193–226. [Google Scholar] [CrossRef]
- Buccino, M.; Banfi, D.; Vicinanza, D.; Calabrese, M.; Giudice, G.D.; Carravetta, A. Non breaking wave forces at the front face of seawave slotcone generators. Energies 2012, 5, 4779–4803. [Google Scholar] [CrossRef]
- Veigas, M.; López, M.; Iglesias, G. Assessing the optimal location for a shoreline wave energy converter. Appl. Energy 2014, 132, 404–411. [Google Scholar] [CrossRef]
- Buccino, M.; Vicinanza, D.; Salerno, D.; Banfi, D.; Calabrese, M. Nature and magnitude of wave loadings at seawave slot-cone generators. Ocean Eng. 2015, 95, 34–58. [Google Scholar] [CrossRef]
- Contestabile, P.; Ferrante, V.; Di Lauro, E.; Vicinanza, D. Prototype Overtopping Breakwater for Wave Energy Conversion at Port of Naples. In Proceedings of the 26th International Conference ISOPE, Rhodes, Greece, 26 June–2 July 2016; pp. 616–621.
- Vicinanza, D.; Stagonas, D.; Müller, G.; Nørgaard, J.H.; Andersen, T.L. Innovative breakwaters design for wave energy conversion. Coast. Eng. Proc. 2012, 1. [Google Scholar] [CrossRef]
- Iuppa, C.; Contestabile, P.; Cavallaro, L.; Foti, E.; Lykke Andersen, T.; Vicinanza, D. Experimental investigation of rubble mound breakwaters for wave energy conversion. In Proceedings of the 11th European Wave and Tidal Energy Conference, Nantes, France, 6–11 September 2015; pp. 1–7.
- Kofoed, J.P. Experimental Hydraulic Optimization of the Wave Energy Converter Seawave Slot-Cone Generator; Department of Civil Engineering, Aalborg University: Copenhagen, Denmark, 2005. [Google Scholar]
- Kofoed, J.P. Wave Overtopping of Marine Structures: Utilization of Wave Energy. Available online: http://vbn.aau.dk/files/55289605/Wave_Overtopping-ofMarine_Structures_utilization_of_wave_energy.pdf (assesses on 19 November 2016).
- Andersen, T.L.; Clavero, M.; Frigaard, P.; Losada, M.; Puyol, J. A new active absorption system and its performance to linear and non-linear waves. Coast. Eng. 2016, 114, 47–60. [Google Scholar] [CrossRef]
- Zelt, J.; Skjelbreia, J.E. Estimating incident and reflected wave fields using an arbitrary number of wave gauges. In Coastal Engineering Conference; American Society of Civil Engineers (ASCE): Reston, Virginia, 1992; Volume 1, p. 777. [Google Scholar]
- Klopman, G.; van der Meer, J.W. Random wave measurements in front of reflective structures. J. Waterw. Port Coast. Ocean Eng. 1999, 125, 39–45. [Google Scholar] [CrossRef]
- EurOtop Manual. EurOtop—Wave Overtopping of Sea Defences and Related Structures–Assessment Manual. Available online: https://www.gov.uk/government/uploads/system/uploads/attachment_data/file/290261/scho0308bnvi-e-e.pdf (assessed on 19 November 2016).
- Victor, L.; Troch, P. Wave overtopping at smooth impermeable steep slopes with low crest free-boards. J. Waterw. Port Coast. Ocean Eng. 2012, 138, 372–385. [Google Scholar] [CrossRef]
- Bruce, T.; Van der Meer, J.; Franco, L.; Pearson, J.M. Overtopping performance of different armor units for rubble mound breakwaters. Coast. Eng. 2009, 56, 166–179. [Google Scholar] [CrossRef]
- Zanuttigh, B.; van der Meer, J.W. Wave reflection from coastal structures in design conditions. Coastal Eng. 2008, 55, 771–779. [Google Scholar] [CrossRef]
- Van Doorslaer, K.; De Rouck, J.; Audenaert, S.; Duquet, V. Crest modifications to reduce wave overtopping of non-breaking waves over a smooth dike slope. Coast. Eng. 2015, 101, 69–88. [Google Scholar] [CrossRef]


| AAU14 | AAU12 | ||
|---|---|---|---|
| Flat Configuration | Curved Configuration | Flat Configuration | |
| (m) | 0.090 | 0.094 | 0.100 |
| (m) | 0.119 | 0.160 | 0.534 |
| (m) | 0.100, 0.200, 0.300 | 0.100, 0.200, 0.300 | 0.415, 0.488 |
| (m) | 0.192 | 0.192 | 0.075, 0.125 |
| (m) | 0.045 (), 0.095 (), 0.125 () | 0.049 (), 0.099 (), 0.129 () | 0.035–0.155 |
| (m) | 0.102 | 0.098 | 0.045–0.165 |
| h (m) | (m) | (s) | (m) | |||||
|---|---|---|---|---|---|---|---|---|
| min | max | min | max | min | max | min | max | |
| = 0.1 m | 0.27 | 0.35 | 0.02 | 0.12 | 0.76 | 2.2 | 0.92 | 7.56 |
| = 0.2 m | 0.27 | 0.35 | 0.05 | 0.13 | 0.76 | 2.2 | 0.92 | 7.56 |
| = 0.3 m | 0.27 | 0.35 | 0.05 | 0.118 | 0.77 | 2.2 | 0.93 | 7.57 |
| = 0.1 m | = 0.2 m | = 0.3 m | ||
|---|---|---|---|---|
| / | min | 0.016 | 0.015 | 0.015 |
| max | 0.031 | 0.033 | 0.031 | |
| /h | min | 0.07 | 0.061 | 0.069 |
| max | 0.500 | 0.479 | 0.479 | |
| / | min | 0.370 | 0.370 | 0.399 |
| max | 2.344 | 2.528 | 2.280 | |
| / | min | 1.120 | 1.110 | 1.970 |
| max | 6.020 | 6.890 | 6.130 | |
| / | min | 0.035 | 0.049 | 0.064 |
| max | 0.284 | 0.388 | 0.497 | |
| h/ | min | 0.037 | 0.039 | 0.037 |
| max | 0.382 | 0.377 | 0.378 | |
| min | 3.910 | 3.890 | 3.940 | |
| max | 5.750 | 5.720 | 5.770 |
© 2016 by the authors; licensee MDPI, Basel, Switzerland. This article is an open access article distributed under the terms and conditions of the Creative Commons Attribution (CC-BY) license (http://creativecommons.org/licenses/by/4.0/).
Share and Cite
Iuppa, C.; Contestabile, P.; Cavallaro, L.; Foti, E.; Vicinanza, D. Hydraulic Performance of an Innovative Breakwater for Overtopping Wave Energy Conversion. Sustainability 2016, 8, 1226. https://doi.org/10.3390/su8121226
Iuppa C, Contestabile P, Cavallaro L, Foti E, Vicinanza D. Hydraulic Performance of an Innovative Breakwater for Overtopping Wave Energy Conversion. Sustainability. 2016; 8(12):1226. https://doi.org/10.3390/su8121226
Chicago/Turabian StyleIuppa, Claudio, Pasquale Contestabile, Luca Cavallaro, Enrico Foti, and Diego Vicinanza. 2016. "Hydraulic Performance of an Innovative Breakwater for Overtopping Wave Energy Conversion" Sustainability 8, no. 12: 1226. https://doi.org/10.3390/su8121226