1. Introduction
The importance of culture to socio-economic development seems indisputable, and has long been recognized by not only politicians, philosophers, artists and scholars, but also ordinary people. However, as a factor, it has often been omitted by economists [
1]. However, the study conducted by Tubadji, A., Osoba, B.J. and Nijkamp, P. on culture-based development in the USA at a county level has proved that culture as a factor imposes a significantly positive impact on economic welfare and social well-being [
2]. In addition, the research done by Gábor Hajdu and Tamás Hajdu reinforced the theory that, besides economic and social variables, institutions and personal characteristics, cultural factors play an even more important role in life satisfaction and well-being [
3].
Regarding the role of culture on social organization, the famous founder of Chinese philosophy, Confucius [
4], as far back as 2500 years ago, had already expressed that once every citizen is self-disciplined enough to follow traditional courtesy, the country can easily be governed and harmonized, indicating the importance of intrinsic culture to society. Aristotle, the great western counterpart in ancient Greece, shared a similar idea yet phrased it in a different way, “good moral character is not something that we can achieve on our own. We need a culture that supports the conditions under which self-love and friendship flourish” [
5], meaning the significance of culture-embeddedness to people’s behavior. Marcus Garvey, an influential political leader from Jamaica in the early 20th century, addressed the importance of culture in a more concrete way, “A people without the knowledge of their past history, origin and culture is like a tree without roots” [
6], expressing that cultural evolution is the source of strength and wisdom of human society. Jiddu Krishnamurti, a renowned Indian philosopher in the late 20th century, explored the relationship between culture and people in such a way, “Look what is happening in the world—we are being conditioned by society, by the culture we live in, and that culture is the product of man” [
7], reinforcing the synergy effect of culture and mankind in social progressive development.
Within the social and institutional organization, corporate culture is the most dynamic aspect, and it draws much attention. It is understandable that corporations or enterprises, being the economic backbone of society, usually play a dominant role in socio-economic development. Therefore, a large volume of research results can be easily found in a literature review. In the past, research has mainly focused on one or some dimensions such as value attitude [
8], behavior [
9] and management [
10] within corporations, with a relatively narrow aim to enhance enterprises’ efficiency and profit. However, recently, more emphasis has shifted to an innovation-oriented perspective, i.e., how to make up a truly innovative company through the construction of corporate culture as a whole. The empirical report done by Barry Jaruzelski, John Loehr, and Richard Homan, based on the global innovation 1000 study, pointed out that company innovation is more heavily dependent on the role played by the organizations’ self-sustaining patterns of behaving, feeling, thinking and believing all tied together [
11]. This finding is echoed by the workshop theme “Culture matters: International research collaboration in a changing world,” which more explicitly expressed that innovation was not determined by the number of engineers in the workforce, nor the expenditure on R&D, but the culture of institutions and the country [
12].
Apart from the deep impact on overall social organization, the importance of culture can be further reflected in nearly all aspects of sustainability [
13], including economic development mode, social disparity and stability, political confront [
14] and compromise [
15], urban–rural spatial arrangement [
16], as well as environmental protection awareness and consciousness [
17]. As Mauro Van Aken convincingly proved, culture can bring forth fundamental changes to future environmental settings in an indirect way, through the integration of perceiving, imagination and incorporation in its practice [
18]. The special thematic debate on culture and sustainable development in the post-2015 development agenda, organized by the UN General Assembly in 2014 in New York, attempted to explore the importance of culture to sustainable development, in terms of “poverty eradication, quality education, human rights, gender equality, sustainable environmental management and more livable and attractive cities” [
19], with the announcement that “culture must be integrated in the post-2015 agenda, as a driver and as an enabler of sustainable development” [
20,
21]. A consensus was reached in the debate that “culture is a thread that binds together the social fabric of our societies and that it can be a crucial factor for reconstruction and reconciliation in the aftermath of conflicts.” Internationally, culture can also help to “craft a more balanced and meaningful development model for the people, by the people, widening development pathways, fighting poverty, combatting inequalities and promoting human rights” [
20], if inter-cultural dialogue can be respectfully and intensively conducted.
The key question then emerged as to what is culture, and what is the essence of culture? In fact, there are mounting definitions on culture by people from all walks of life. In the book Culture: A Critical Review of Concepts and Definitions [
22], Kroeber and Kluckhohn collected and elaborated up to 166 representative definitions from all over the world, of which 162 are in English. Although it is useful to have a theoretical exploration of culture definitions in an academic way, it is still essential to have a working definition for people to understand culture better and implement culture’s benefit in the real world. As the Chinese scholar Qiuyu Yu argued, the existing definitions of culture are colorful but too complicated to understand for most people. He then proposed a relatively simple definition which stated that culture is a value-based, lifestyle-reflected collective personality, and a shared ecosystem formed through a process of historic accumulation and forward orientation [
23].
To better understand culture, besides its definition, it may be more urgent to measure the importance of culture in a quantitative way based on the analysis of its essence, yet most of the existing research and studies have mainly focused on a qualitative description of culture’s importance. Based on our comprehensive literature search and review, there seems to be only a few research studies aspiring for measurement in a quantitative way. As an initial pursuit, an international comparative study on the measurement of economic and social importance of culture was conducted in 2006 by John Gordon and Helen Beilby [
24]. It systematically calculated the value-added culture sectors in five OECD (Organization for Economic Co-operation and Development) countries, including Australia, Canada, France, the UK and the US. Another example is the research done by Susie Ruqun Wu, Peilei Fan and Jiquan Chen, which explored a cultural sustainability index framework for green buildings [
25], a valuable reference for index system construction.
However, these studies either focused on a micro scale or just evaluated the value of the culture sector itself without exploring the comprehensive impact of culture on the socio-economic system and spatial restructuring in a holistic way, which is badly needed and required if one is to convince government decision makers and public society that culture matters. This also strongly indicates that there is a wide gap for proposing a systematic protocol to measure and analyze quantitatively the importance of culture. To fill in this gap, this paper is therefore aimed at constructing a preliminary methodology for evaluating the importance of culture in a quantitative way, through proposing a Culture Quotient (CQ) index system, and applying the CQ system to the empirical cases of 297 prefectural-level Chinese cities to test its effectiveness and the spatial distribution by CQ tiers in China. Particularly from a geographical perspective, this paper also intends to address the relationship between culture and space/place for better place-making.
According to the Chinese literature review by keywords in CNKI [
26], over the last 10 years from 2006 to 2015, the number of articles about culture reached 38,575, of which 50 are from geography journals; the number of articles about space/place reached 7919, of which 57 are from geography journals; the number of articles about culture AND space/place reached 165, of which one is from geography journals; the number of articles about local culture OR cultural space reached 7299, of which 24 are from geography journals. It can be seen from the review that the number of studies on culture itself are enormously high, proving importance of culture and its wide recognition, while the number of studies from a geographical perspective is low, reflecting the lack of sensitivity by geographic science for this key research issue or topic. Meanwhile, the current research focus is more on physical resources rather than human-oriented soft amenity for attracting talents by satisfying their needs and culture embeddedness. More seriously, there is virtually no research on integration between culture and space/place, which should be the paramount priority of mission and commitment in human geography. This paper therefore has another objective, namely, to serve as an entry point on how to implant culture as a key element in place-making in an organic and systematic way. It should be known that cultural policies could play a big role in the integration of culture and place-making, such as policies in the areas of culture heritage renewal and creative park redevelopment. Yet, the cultural policy system in China is too complex to be integrated into the study scope of this paper. Furthermore, cultural policies have changed frequently over time, resulting in diversified typologies and rich contents varying from city to city. Therefore, the cultural policy system itself is worthy of a separate in-depth study.
2. Methodology
Despite the fact that there are various definitions of culture, a more practical working definition needs to be established for constituting an implementable CQ system. Culture is the unseen permeated ambience that is nonetheless able to be sensed, felt and experienced [
27], and manifested in accumulated tangible and intangible heritages [
28,
29]; it contains value systems, religions, ethics, art, ritual, customs [
30], architecture, lifestyle, management, governance, institution, etc. [
31,
32], inherently adopted and widely recognized by the whole society [
33]; it can shape or change people’s perception of external environs [
34] and induce organic reactions; it can also set the tune for the human–human [
35] and human–nature relationships [
36,
37].
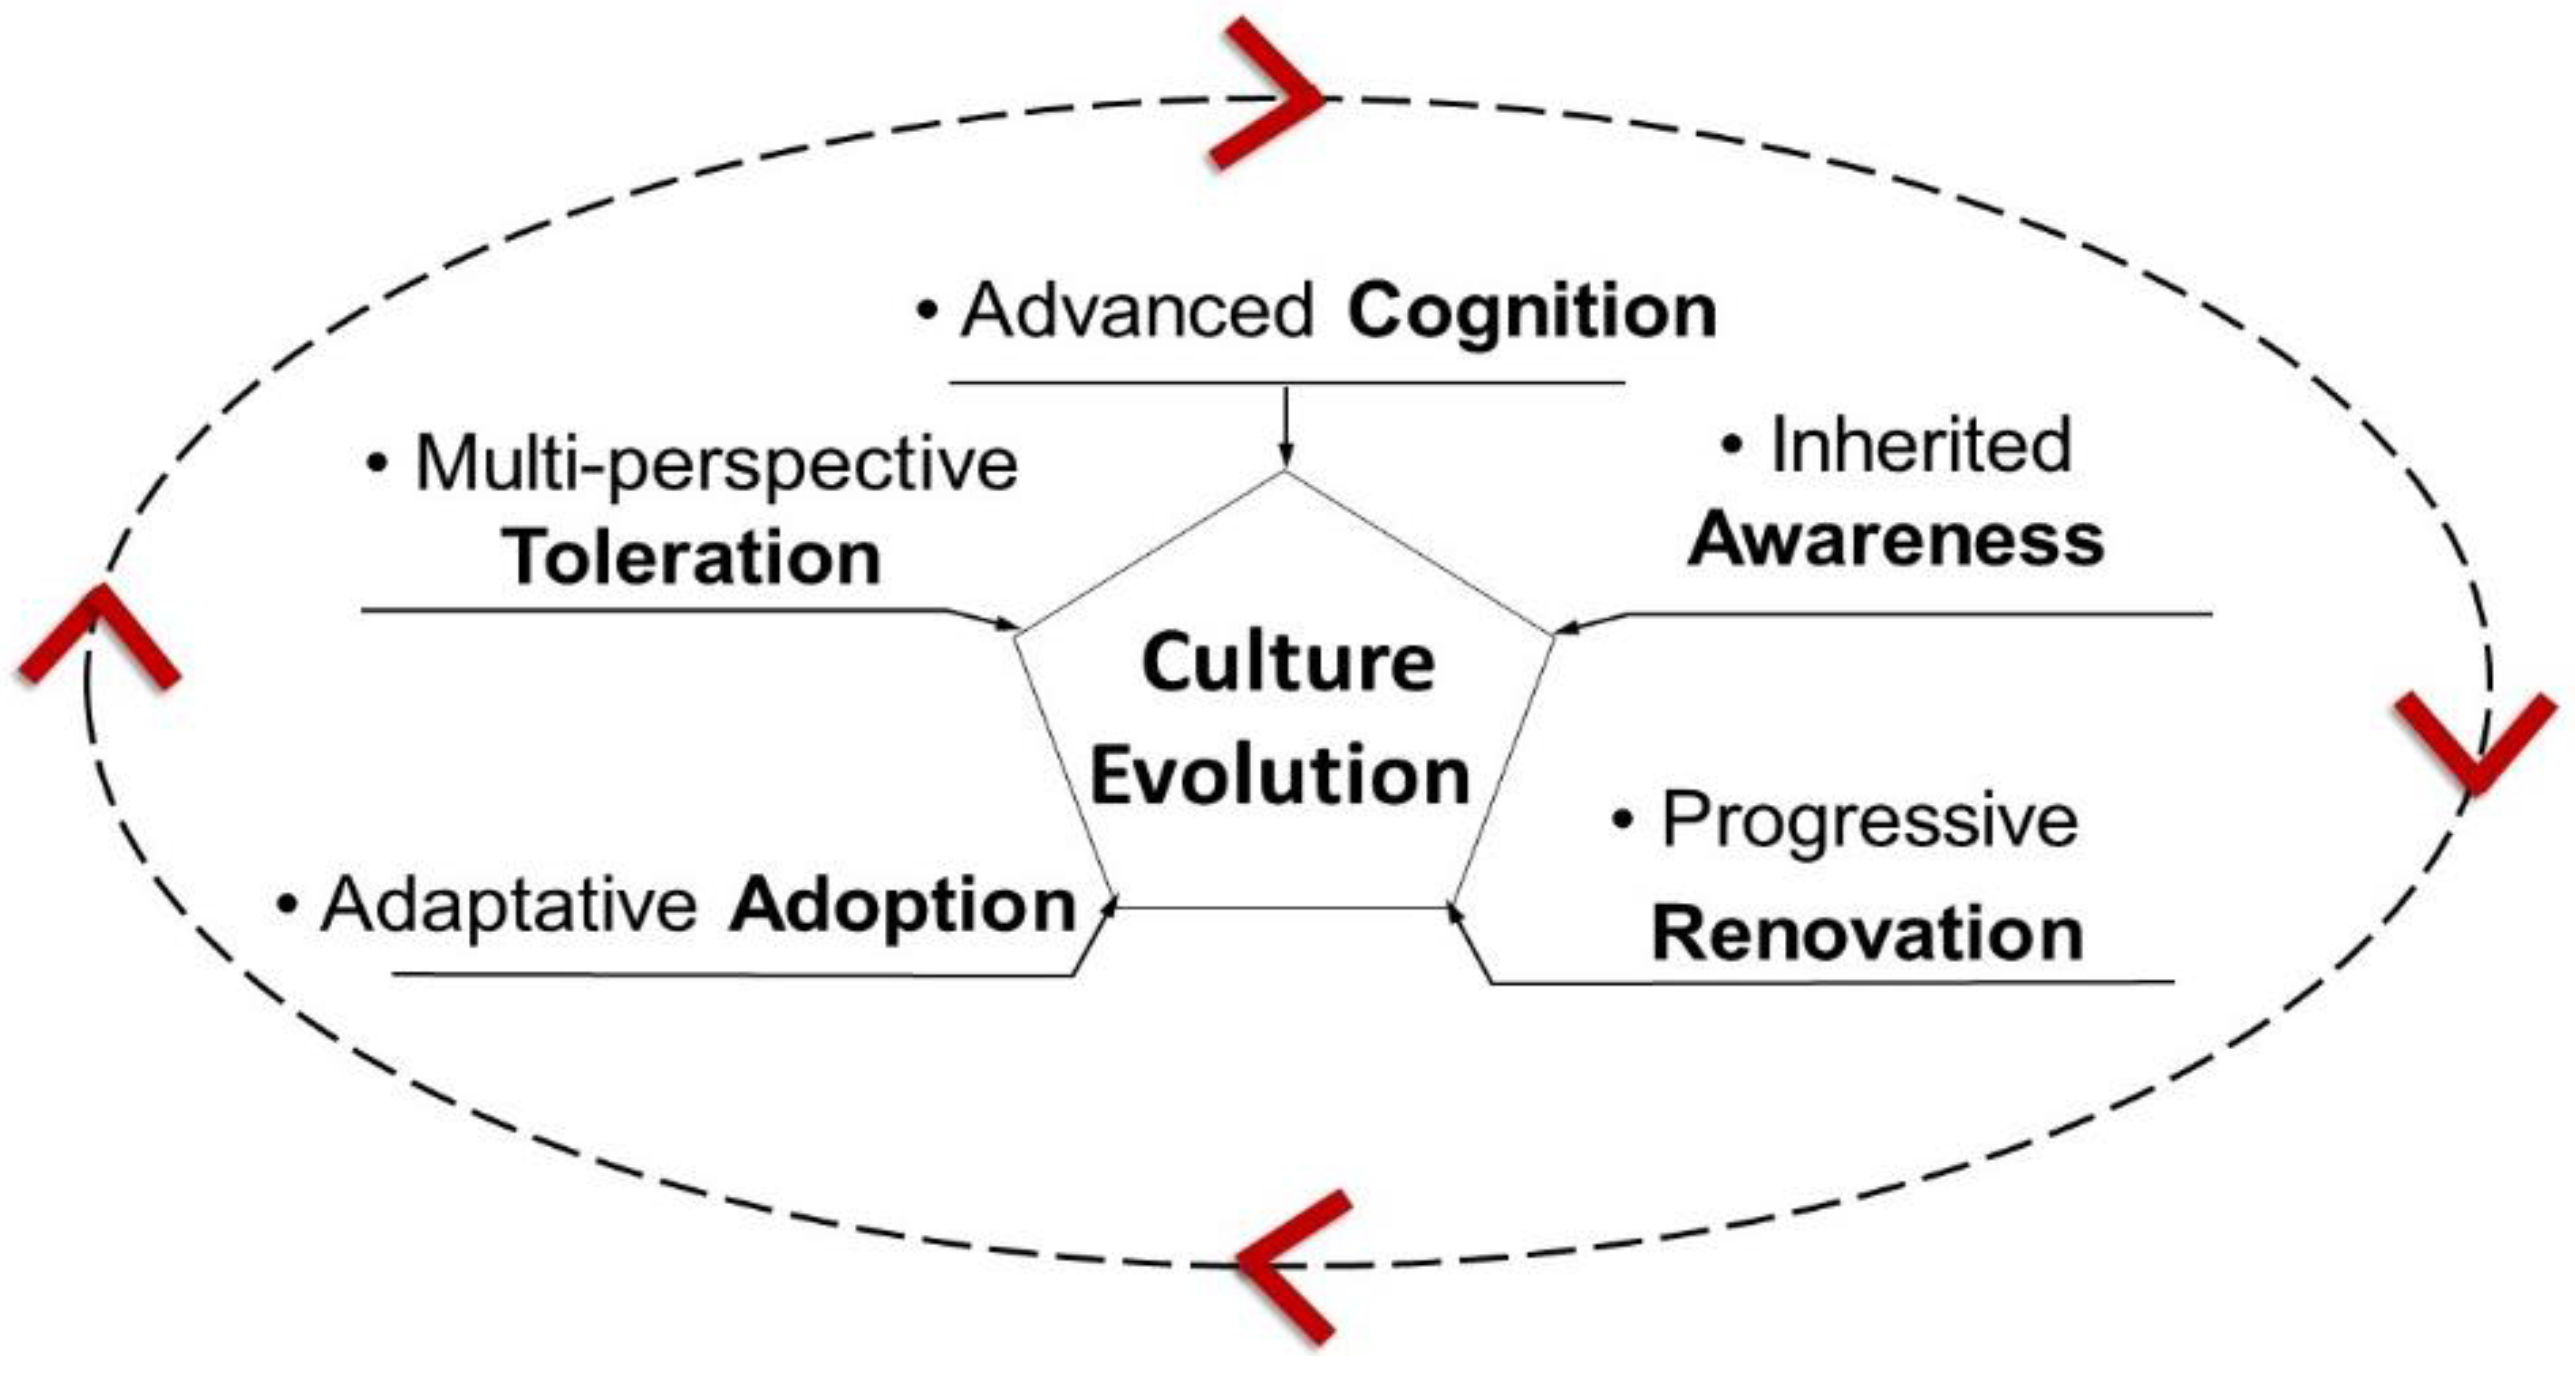
Following this understanding and the intensive literature review, a culture evolution pattern could be extracted as shown in
Figure 1, to serve as the theoretical basis for CQ variable selection.
It can be seen from the figure that culture evolution roughly experiences five phases. In the initial phase, people are born with their own socially-recognized advanced cognition, which is the starting point for learning anything new. In phase II, people learn the socially inherited and existing knowledge, habits, customs, regulation, etc., and then they can gradually increase their awareness such as eco-harmony and environmental protection. Progressively, in phase III, there comes a point for innovation and renovative reform which can be good or bad; therefore, people need to be able to adapt and adopt in order to maximize the benefits and minimize the drawbacks in phase IV. As culture becomes more diversified and complex in a cosmopolitan environment in phase V, people become more tolerant via multiple perspectives, which explains why megacities are more inclusive and dynamic. Through this inclusive process, people gain more sophisticated cognition, which in turn kicks off a new round of culture evolution. Based on these features, a target-oriented indicator system for CQ construction is explored and established.
In exploring methodology, three related index systems are selected as the references for the CQ index system, i.e., City Innovation Index (CII), Innovation Cities Index (ICI), and Urban Sustainability Competitiveness Index (USCI).
CII 2015 is an updated index system introduced by the China Society of Urban Development for the annual report of China’s city innovation. This index system includes three dimensions and 25 indicators, and is applied in 659 cities in China. The merit of this index system is its simplicity and its logical construction, i.e., from input to the output through the mechanism process.
ICI is an international index system introduced by 2thinknow, an Australian think tank with a focus on the innovation index from 2006: this index system the most advanced and sophisticated methodology thus far in assessing and evaluating the innovation performance of cities across the world. It contains three factors, 31 segments, 162 indicators and has been applied in 445 benchmark cities globally. In the most updated 2015 innovation ranking of the top 100 cities, 22 Chinese cities are listed, of which Shanghai, Beijing and Shenzhen placed in the top three.
USCI is an index system introduced by the Urban Competitiveness Research Center, Chinese Academy of Social Sciences. It includes six aspects: economy, society, ecology, culture, urban–rural integration and openness, of which 54 indicators are selected, and then applied to 289 Chinese cities. This index system has been consecutively issued for 14 years. The merit and specialty of the latest index system is that it has become an open system in which different indicators are applied for different typologies of cities. In so doing, it can better reflect the unique advantages of each kind of city.
Accordingly, six principles in data collection and selection are applied to the current research methodology in this paper, i.e., data availability, accessibility, comparability, consistency, transferability and target-orientation. By taking these principles into account, a large database with 53 indicators is initially designed and established, but due to data unavailability and incomparability, 25 effective indicators qualified for selection.
Table 1 shows the list of 25 indicators. Following on the established database, a systematic analysis is conducted.
3. Data Analysis and Findings
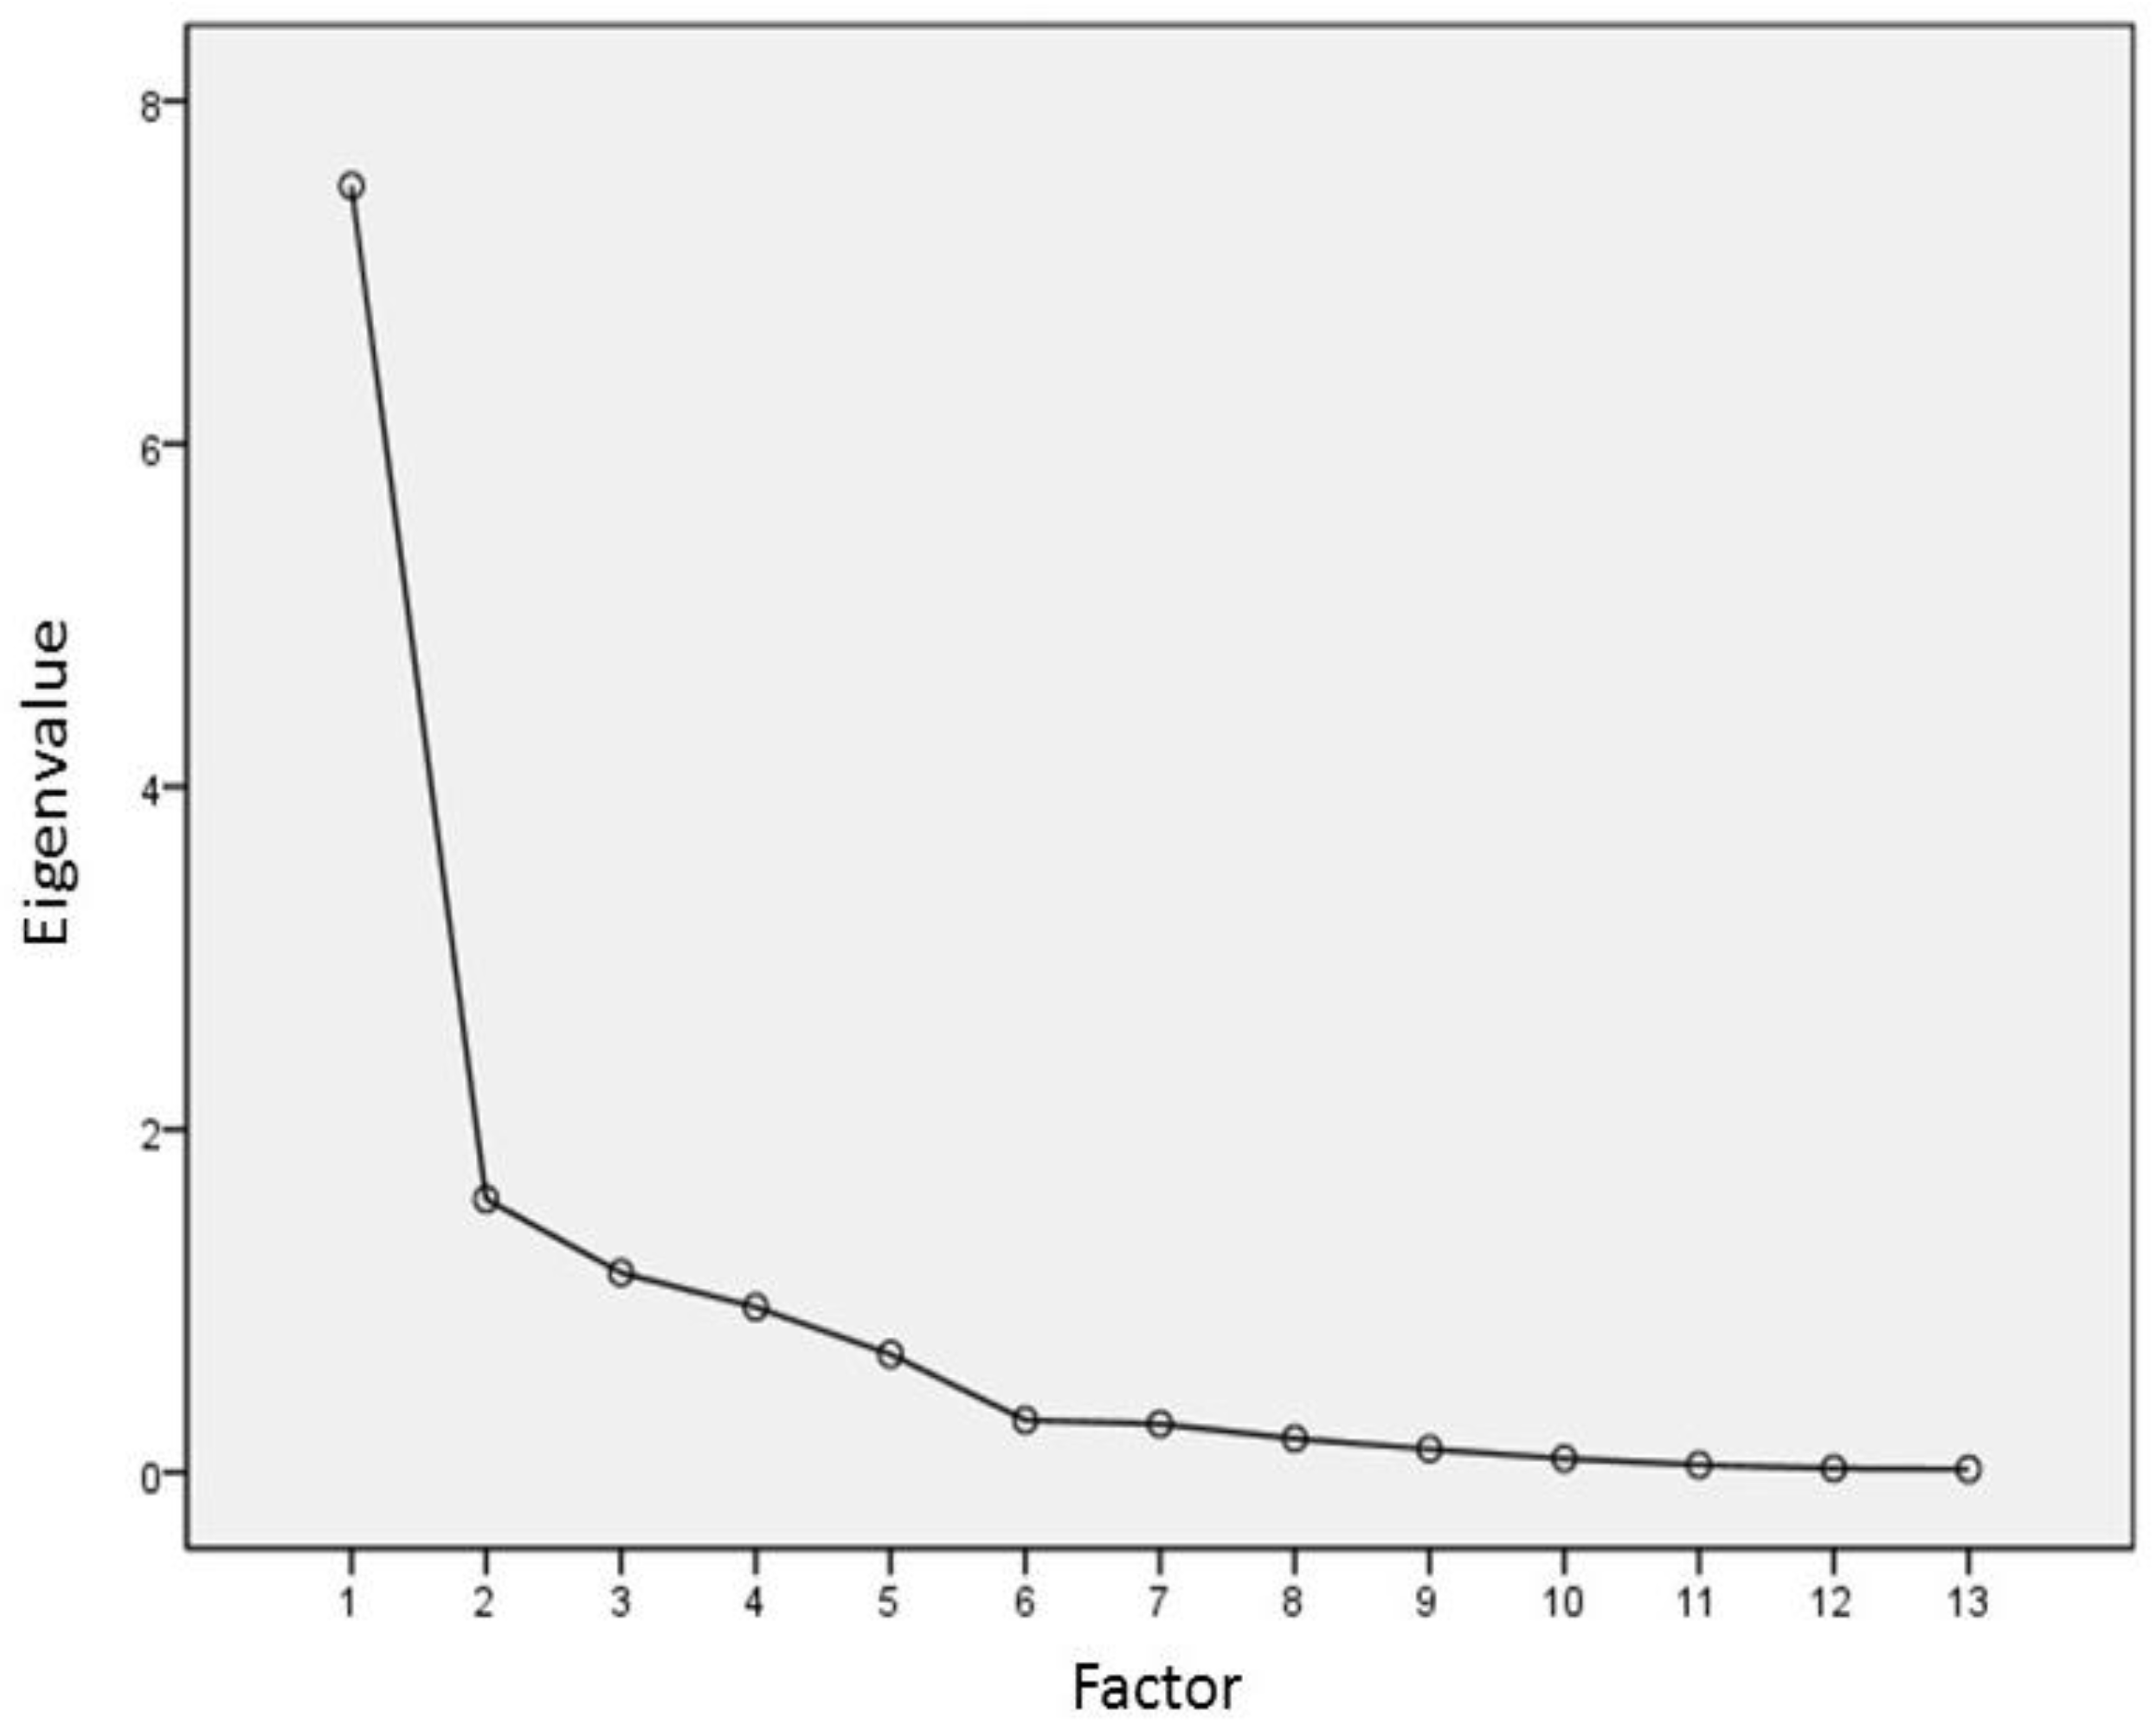
First of all, based on the objective weight-value method, a principal component analysis is employed. After six rotations of the matrix, the selected 25 indicators are boiled down to 13 independent factors with the loading weight by eigenvalue shown in
Figure 2. From the scree plot, it can be seen that the first three factors are the most important contributors to the CQ. Factors four and five are also significant.
Table 2 further indicates the details of the factor loads, which can be used to make the final decision as to how many and which factors should be selected for Culture Quotient (CQ) analysis. Given that factors one to five have already accounted for nearly 92% of the total explanation accumulatively, these factors are identified for calculating the CQ value.
To further identify the characters of each factor, a rotating component matrix is conducted, as shown in
Table 3. It can be illustrated from the table that these factors/variables represent five aspects which can constitute a cultural organic integrated system, and largely reflect the culture evolution pattern elaborated above (see
Figure 1), i.e., factor 1 for cultural resources, factor 2 for cultural services, factor 3 for entrepreneurship and administrative level, factor 4 for education capacity, factor 5 for climate amenity.
Cultural resources provide the basis for advanced cognition. Through cultural services, people’s inherited awareness can be repeatedly reinforced. Afterwards, entrepreneurship with a high level of administration will greatly boost innovation and renovation, then, those outcomes can be well-filtered by education through the adaptative adoption approach. Climate amenity can offer a good local setting for diversified population, including talents and their intensive social interaction, which in turn makes people more tolerant. Based on the identified five factors and their respective loading value, a formula for CQ then can be formulated as follows:
where F1, F2 … F5 respectively stands for Factor 1, Factor 2 … Factor 5.
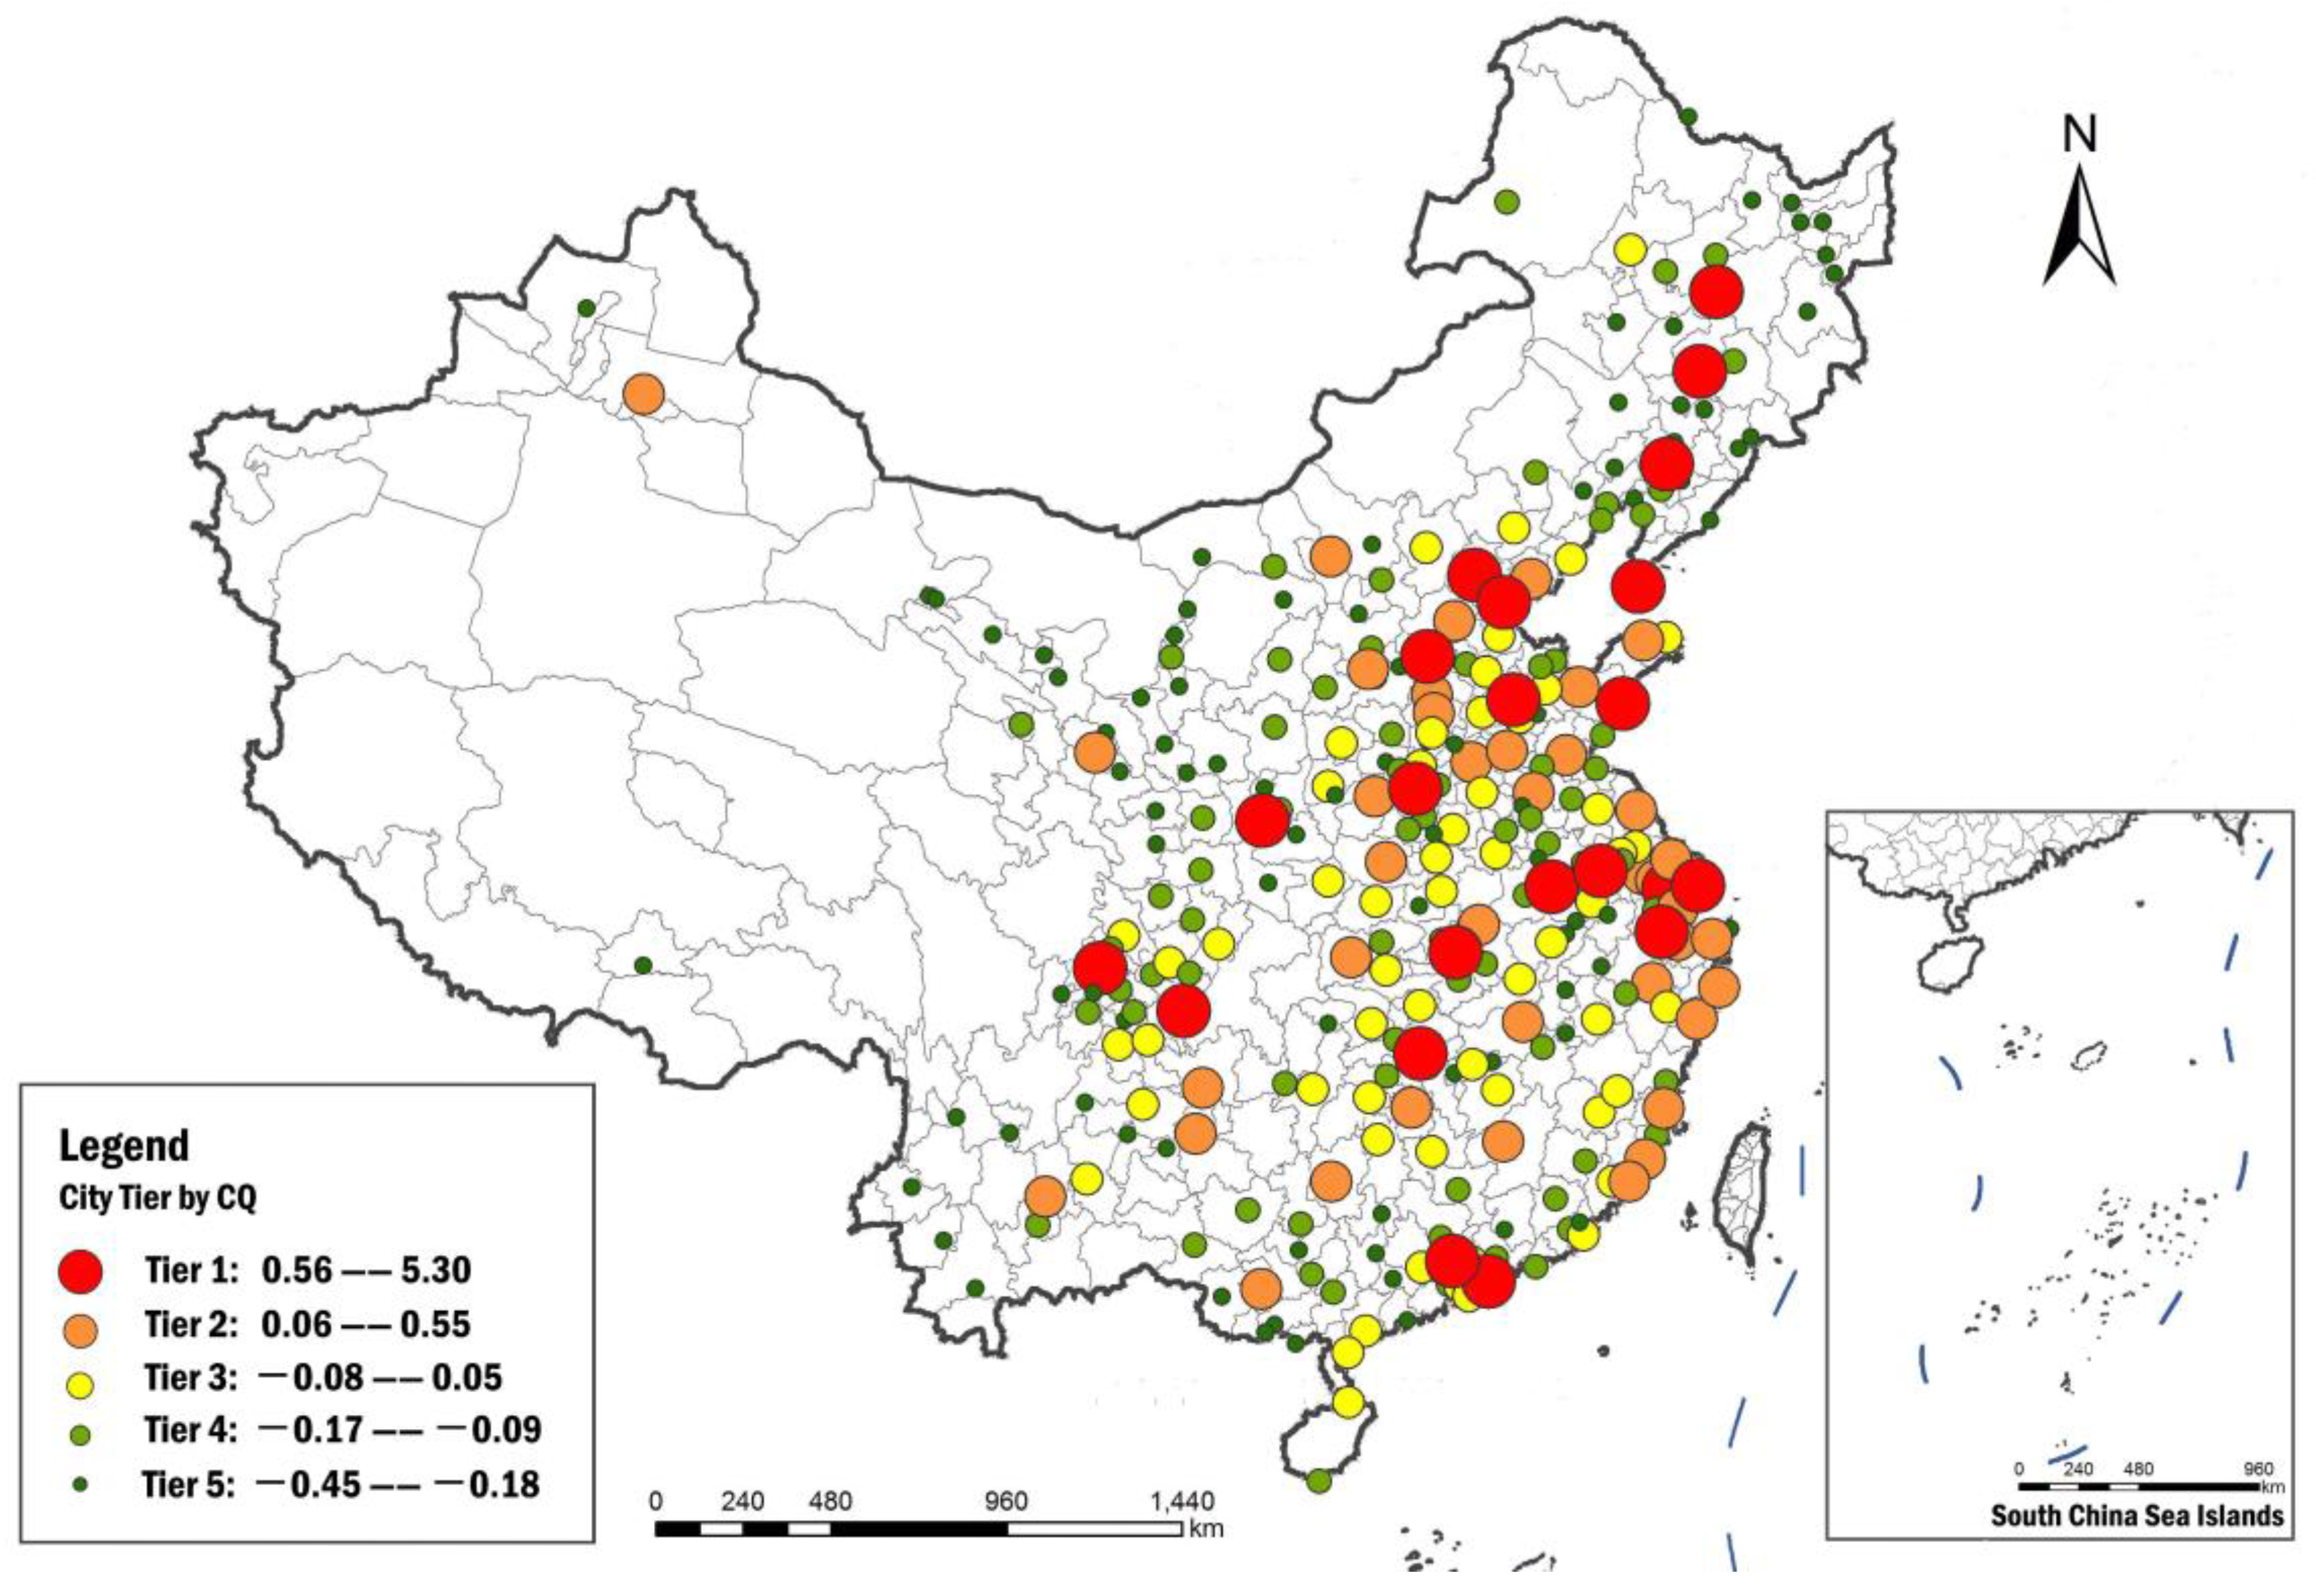
To further empirically test the effectiveness of CQ, the Formula (1) is applied to China’s 297 prefectural-level Chinese cities for calculating each of their CQ values. By using the Nature Breaks method in ArcGIS, the CQ values are then divided into five tiers, from the highest Tier 1 (T1) to the lowest Tier 5 (T5).
Figure 3 shows a general spatial pattern of cities with different CQ tiers. It can be seen that cities with CQ T1 are mainly located in coastal areas, specifically, the Jing (Beijing)-Jin (Tianjin)-Ji (Hebei province)-based Bohai rim region, Yangtze River delta, Pearl River delta, Chengdu-Chongqing urban cluster, plus cities along the Harbin to Dalian High Speed Railway (HSR). Cities with CQ T2 follow a similar pattern to those with T1 but extend widely into and are scattered around Central China. In contrast, CQ T5 cities are mostly distributed in Northeast and Northwest China.
The results are highly aligned with the urban development status quo of China, in which megacities with a high administrative level and big cities in key urban clusters have all the advantages in terms of cultural resources, culture services, entrepreneurship, education and talent, as well as diversity and inclusiveness. For example, the CQ top 10 cities are Beijing, Shanghai, Chongqing, Chengdu, Wuhan, Guangzhou, Tianjin, Nanjing, Hangzhou and Harbin, which may basically reflect the actual situation of the “winner-take-all” phenomenon. In contrast, low CQ cities are mainly concentrated in Northwest and Northeast China, with the worst 10 cities including Guyuan, Baiyin, Jinchang and Jiayuguan in Gansu province; Wuzhong, Shizuishan and Zhongwei in Ningxia Autonomous Region; as well as Shuangyashan, Hegang and Qitaihe in Heilongjiang province. Among them, cities like Jiayuguan, Jiuquan, Zhangye in Gansu province all boast rich cultural resources for a long-standing history due to their good locations as important nodes along the traditional Silk Road, yet they share very low CQ values. The obvious reason for this lies in the fact that these cities are deeply struggling with the poor quality of culture services and lack of entrepreneurship, according to the index system analysis in the CQ model.
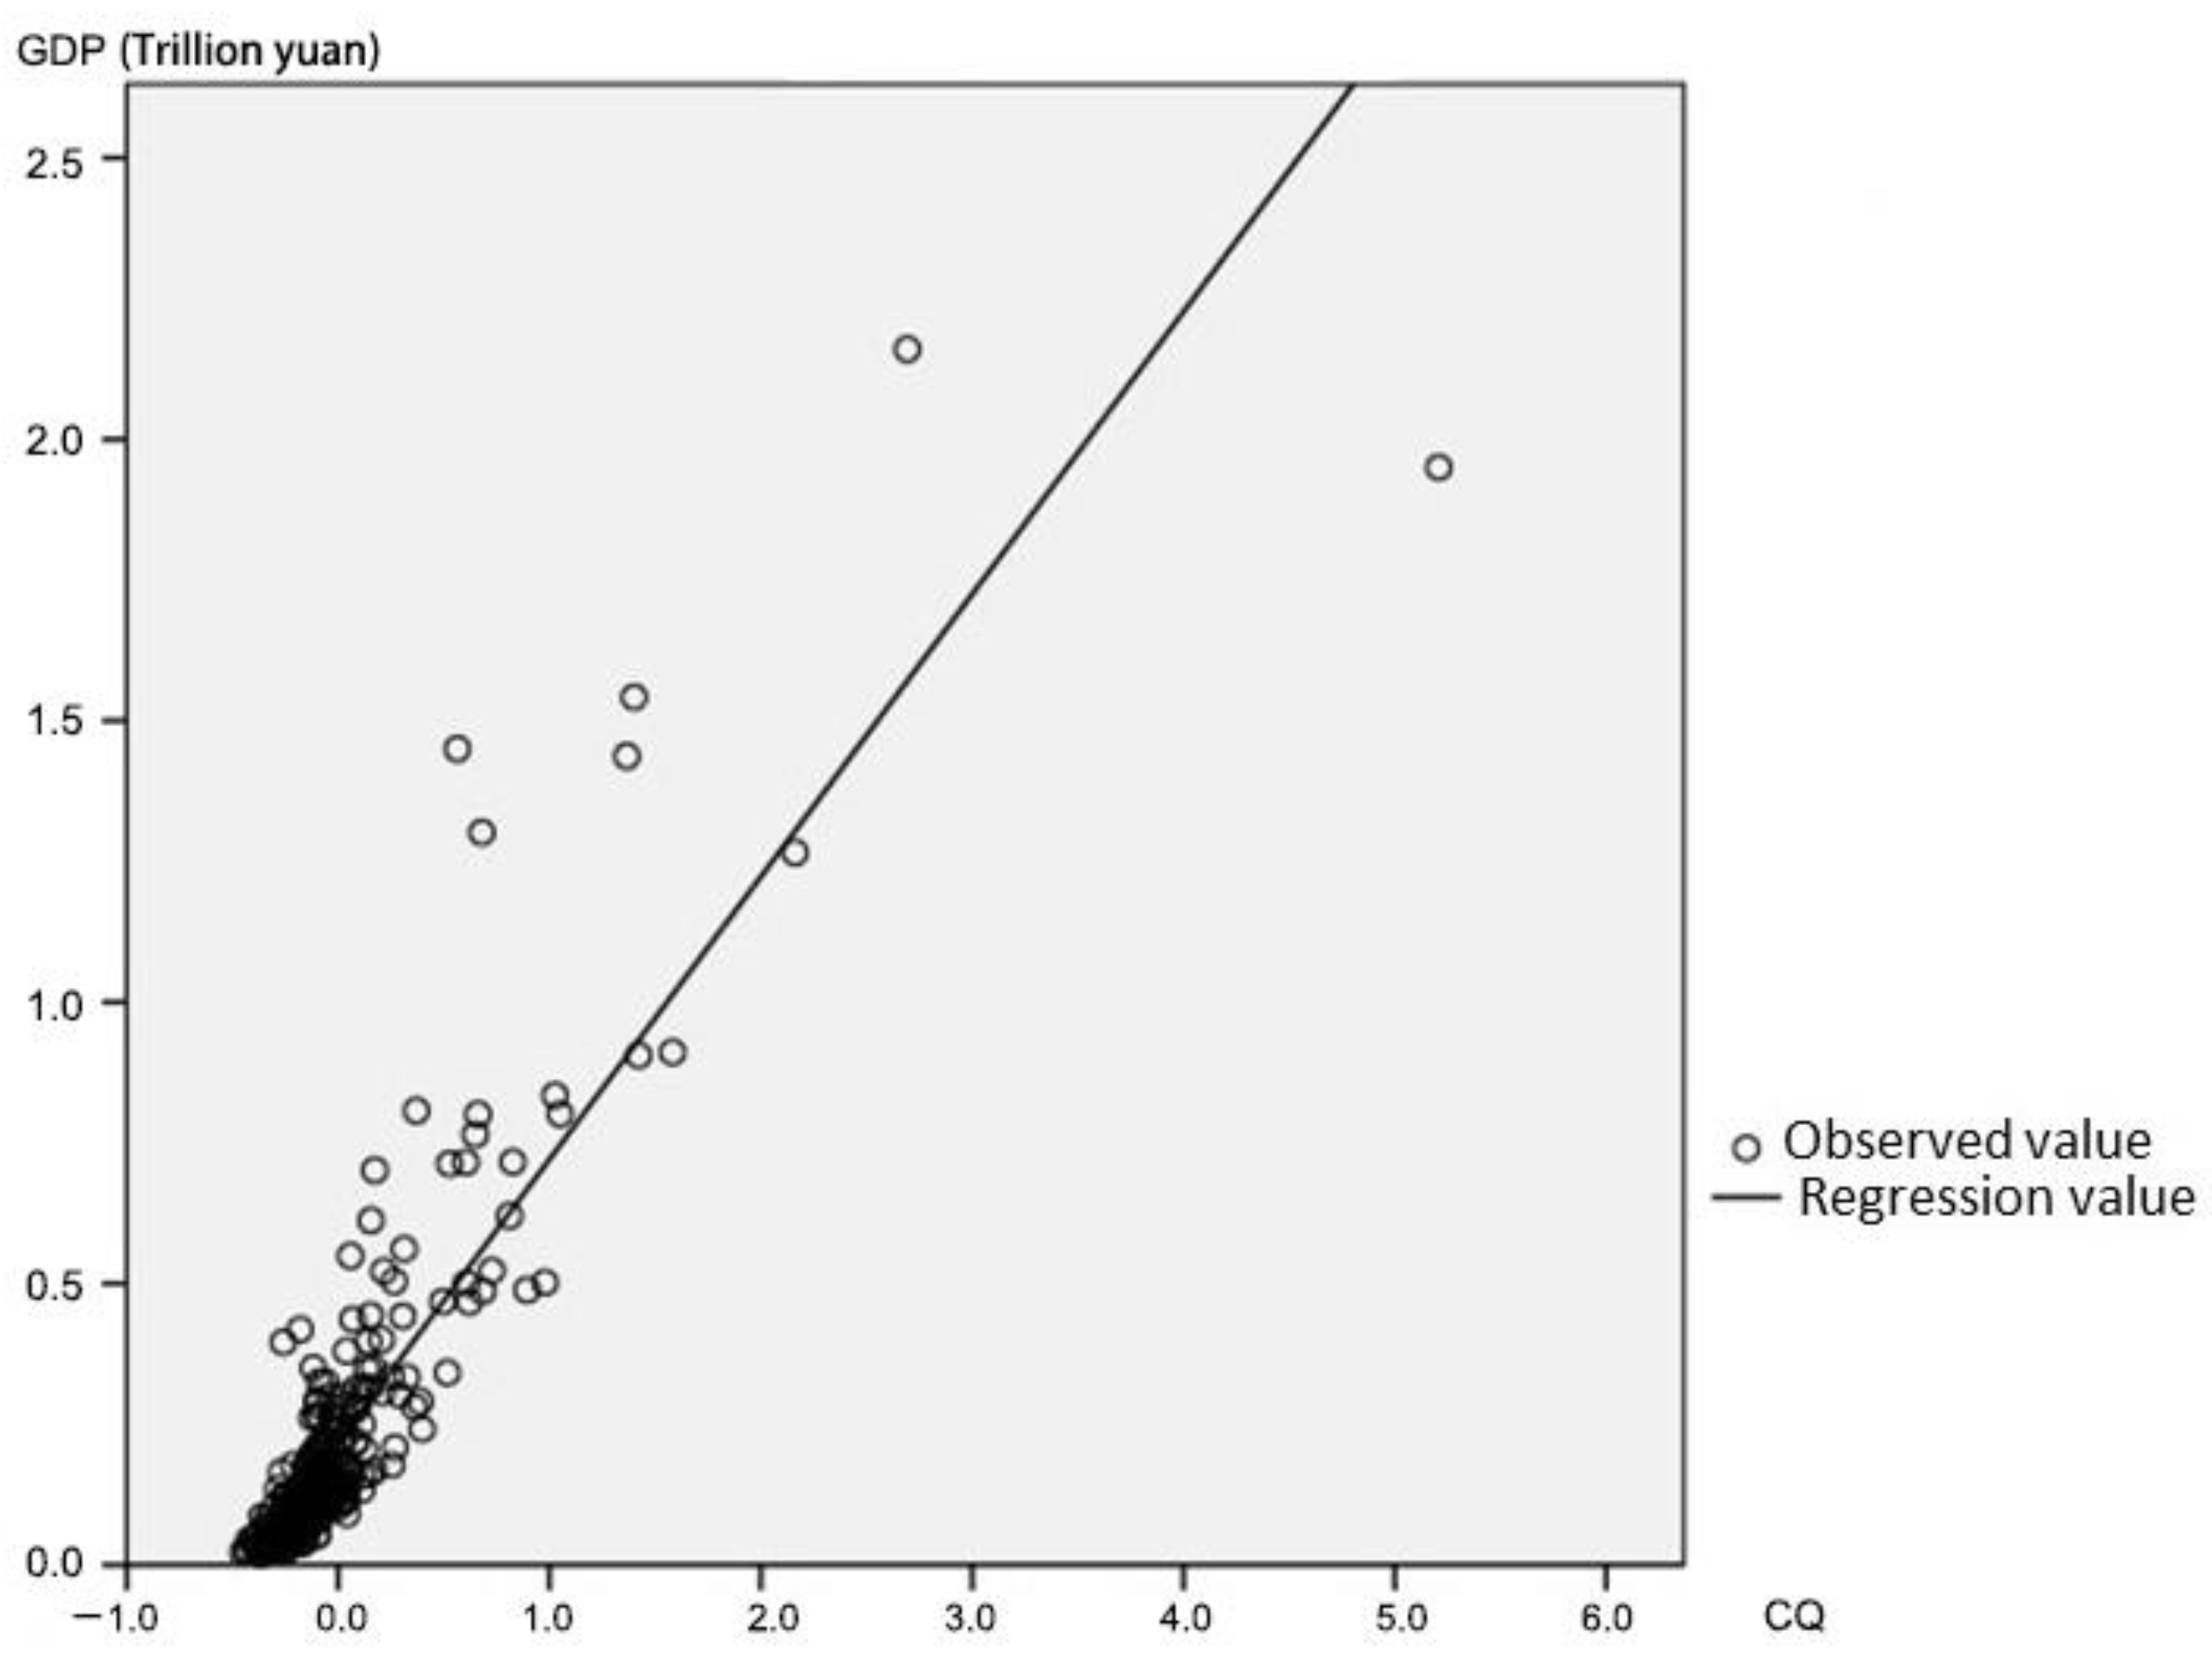
To further explore the inter-relationship between CQ and gross domestic product (GDP) for each prefectural-level city, a simple and standardized regression analysis is then conducted in a quantitative way. The analysis proves that CQ and GDP have a strongly positive linear relationship, as shown in
Figure 4, with the precise regression equation as follows:
with the statistics result as: R
2 = 0.76, Beta = 0.872, t = 30.1, F = 905.989.
It can be seen from the Formula (2) that the regression coefficient is very high with R2 = 0.76, meaning that it can be used to measure the intensity between CQ and GDP. In other words, based on the empirical test in China’s prefectural-level cities, this indicates that every increase of one percentage point in CQ of one city will induce five percentage points increment in GDP of that city.
4. Conclusions
There seems no doubt that culture sustainability can make high contributions to sustainability as a whole. Moreover, culture is a very important component for urban–rural sustainable development. Based on the literature review, although no consensus is reached on the definition of culture, the core components towards the essence of culture can be summarized as follows: (1) permeated ambience, which cannot be seen or touched, yet able to be sensed, felt and experienced; (2) accumulated heritages both in tangible and intangible forms; (3) intrinsic norms adopted and widely recognized individually and collectively by the whole society, including value system, religions, ethics, art, ritual, customs, architecture, lifestyle, management, governance, institution, etc.; (4) perception and organic reactions towards external environs; (5) long-term relationship, including the relationship between humans and society, and the relationship between humans and nature.
Based upon this understanding, it can be postulated that culture matters considerably, which can be manifested at least in the following aspects: (1) culture can guide people’s cognition and social behavior; (2) culture is increasingly becoming a key driver and enabler for innovation in a globalizing era, particularly for transitional economies, including China, which calls for the transformation from “Made in China” to “Created in China”; (3) benign culture can lead to a better quality of life through building a harmonized society. In fact, the current pursuit of new urbanization and eco-civilization in China is trying to enhance socio-economic sustainability through mobilizing the excellence of its traditional culture carried forward from the ancient civilization, with an emphasis on the creation of a more harmonized relationship between man and nature by respecting nature in any kind of development, ranging from a mansion to a courtyard, garden, village, city or region.
Given the importance of culture and the lack of quantitative measurement, this paper’s merits are in constructing a CQ index system, in order to fill in the research gap. Up to 25 effective indicators have been selected, which broadly cover the five aspects of culture’s core components mentioned above, although it might be better if the initially designed 53 indicators could be obtained and applied into the CQ index system. However, the outcome from the existing CQ index system is fairly convincing that culture importance can be quantitatively measured.
Application of the CQ index system into China’s 297 prefectural-level cities further proved its effectiveness. According to the principal component analysis, 13 factors can be identified, of which the first five factors have accumulatively explained up to nearly 92% of the variables. The CQ value of each city, calculated based on the five principal components and the CQ formula, shows that the typologies of the Chinese case cities can be divided into five categories, with the distinctive spatial distribution pattern illustrated in
Figure 3. It can be seen that there is a “winner-takes-all” effect in favor of big cities which have all the comprehensive cultural advantages. Spatially, those big cities are mainly located in coastal areas, particularly the three mega urban clusters, i.e., Bohai rim region, Yangtze River delta, and Pearl River delta. Meanwhile, cities with the lowest CQ value are mostly distributed in Northeast and Northwest China.
Strikingly, this paper precisely proves that there is a high positive correlation between CQ and economic performance (represented by GDP in this analysis). The empirical study of China’s cases by the linear regression analysis shows that the correlation coefficient R2 between CQ and GDP can be as high as 0.76, with the F test above 905. More impressively, if the regression analysis is largely believable, it will further indicate that every increase of one percentage point in CQ value will induce five percentage points growth in GDP of the case city.
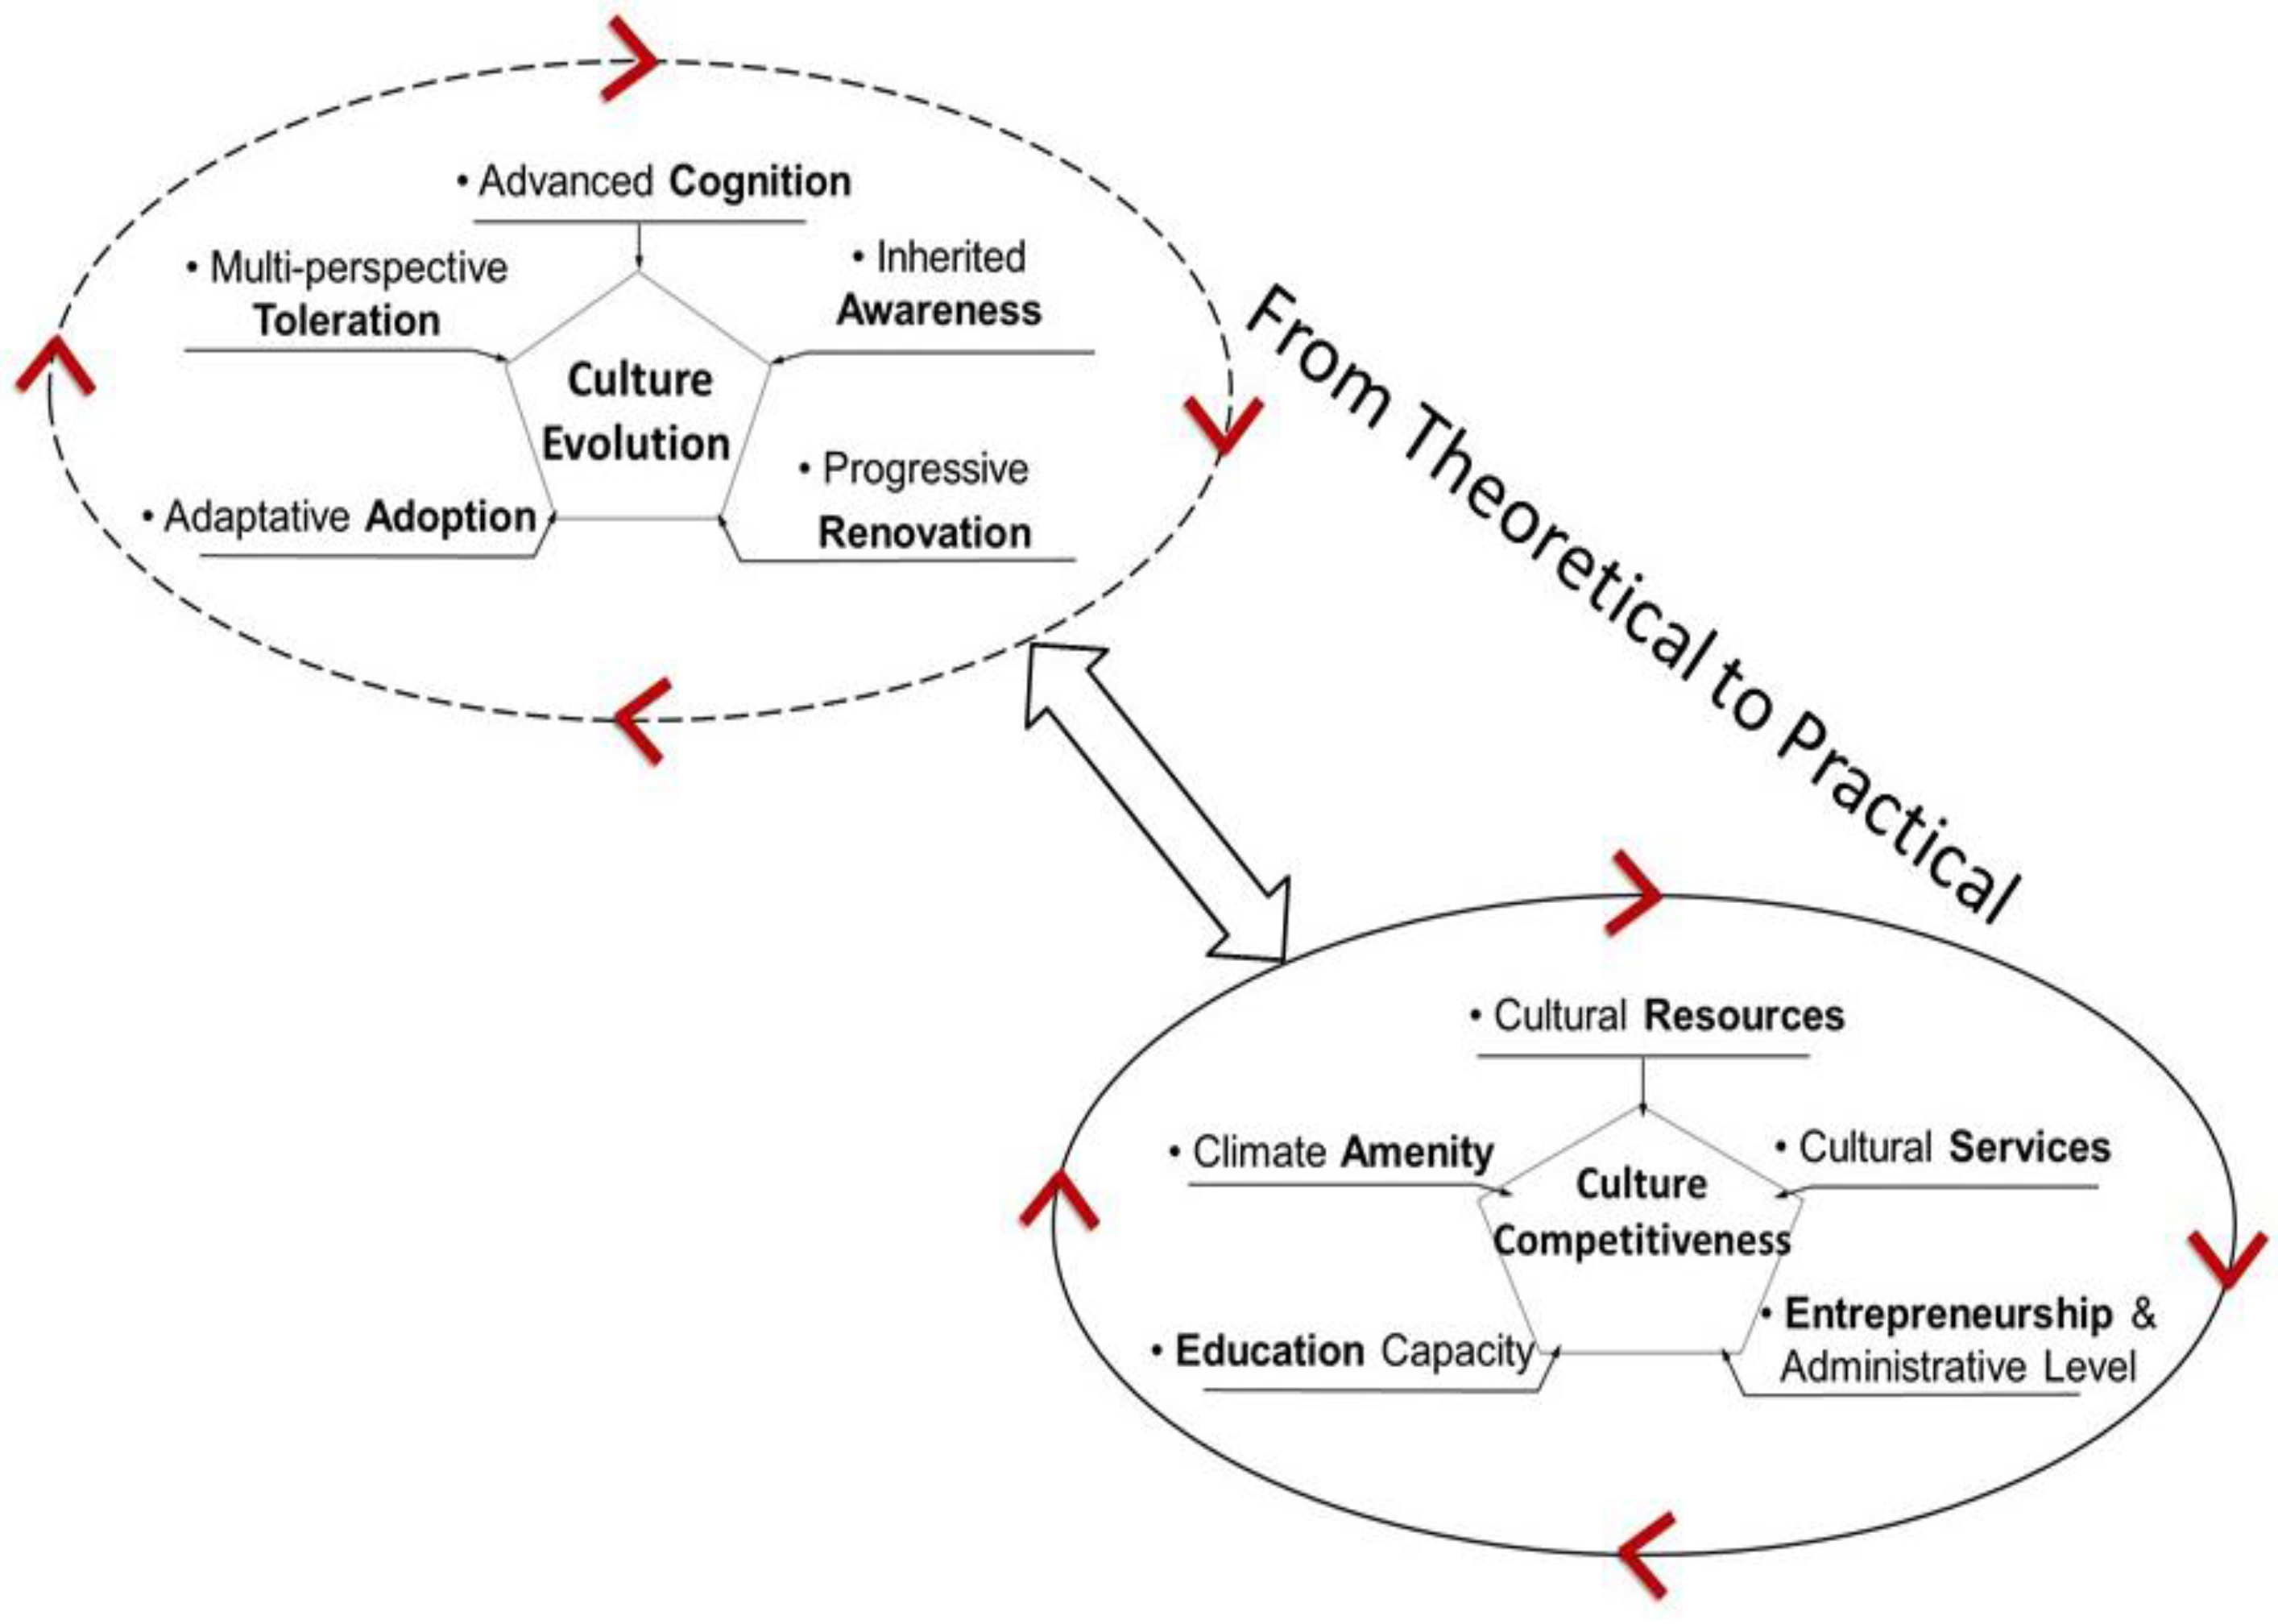
As a process, culture development theoretically follows the evolution pattern shown in
Figure 1, while the empirical study in China’s case proves that this pattern can be reflected by and applied to reality. In fact, the five factors identified in the CQ index system could constitute a culture competitiveness model. By comparing the theoretical culture evolution pattern and the practical culture competitiveness model, as shown in
Figure 5, we demonstrate that they are largely correspondent to and highly aligned with each other in terms of their progressive features.
It can be further elaborated from
Figure 5 that cultural resources could be regarded as the foundation for advanced cognition, while cultural services could be taken as an approach for reinforcing people’s inherited awareness. Entrepreneurship with a high level of administration can serve as the engine for innovation and renovation, particularly in China, where the government administration is so powerful in terms of development. The high education capacity can lead people to be more adaptative in a positive way. Climate amenity can usually provide comfortable natural settings for attracting diversified population [
39,
40], especially talent, which in turn helps to form the diversified and cosmopolitan environment, making people more tolerant and inclusive.
Within the whole process, these features play relatively different roles with respective weights in different development stages. However, it should be noted that the performance of culture competitiveness highly depends on the comprehensive enhancement of a well-integrated system of all the progressive features, rather than a single feature, even though this feature bears exceptional advantage. For example, the possible explanation of low CQ values for cities in Northwest China is basically attributed to their over-dependence on local rich cultural resources, while paying less attention to culture services and entrepreneurship, which may partially be because they are still in the early stage of development as a whole.
5. Discussion
It should be pointed out that, in addition to effectively measuring the culture importance, CQ can be a useful tool for a quick diagnosis of urban economic development potential and dynamic performance, and help cities in their policy making to enhance culture competitiveness in two ways: (1) help cities reposition themselves by CQ within the national or even international urban system; (2) help cities pinpoint specific aspects, including uniqueness, drawbacks, vulnerable points, and development stage, to further improve their cultural competitiveness and enhance economic performance by more customized policy intervention.
CQ can also provide a good and practical perspective for place-making, particularly for innovation district in their culture-embedded planning and design. By using the CQ model, it can be easily identified which cultural aspects can be implanted into which typology of innovation district for their customized development. However, caution should be taken that culture is treated as a multi-faceted [
41] yet systematic process, in which an upward spiral can be formed when all the culture features are properly embedded into place making for the construction of “spaces of hope” [
42], otherwise, a downward spiral will occur. This means that a good organic integration of culture and place is acutely demanded for better and sustainable place-making. This involves calling for more attention and contributions from geographical academic society, particularly in such key research issues as micro-scale innovation district-making, culture-embedded lifestyle community design, senior care place-making, etc., where geographers currently lack the needed due sensitivity.
However, due to data unavailability and inaccessibility, the proposed CQ index system in this paper should be further improved in the following aspects: (1) improve the database by completing the data for initially designed indicators; (2) more analytical methods should be applied into the comparative analysis for more convincing results; (3) apply the current CQ index system to other countries to test its effectiveness and local applicability; (4) more importantly, international comparative study in this regard should be urgently conducted to hopefully harvest a possible universal CQ index system by joint research efforts. As culture is becoming increasingly important for quality and sustainable development, international comparative study in this regard should become a paramount agenda for the academic community, particularly for geographers. This paper is just an initial investigation; however, the results are surprisingly exciting and promising. Although this study can largely serve as a basis for theoretical and conceptual building, as well as a pragmatic framework for the construction of economic growth policies, it still needs to emphasize that the current CQ theory and model is not a complete one from a social anthropological cultural perspective. Therefore, more in-depth and comprehensive research is badly needed and invited.


