Article

Impact of Precipitation Fluctuation on Desert-Grassland ANPP

1
Northwest Institute of Eco-Environment and Resources, Chinese Academy of Sciences, Lanzhou 730000, China
2
Department of Geography and Tourist Science, Lu Dong University, Yantai 264025, China
*
Author to whom correspondence should be addressed.
Sustainability 2016, 8(12), 1245; https://doi.org/10.3390/su8121245
Submission received: 29 October 2016 / Revised: 23 November 2016 / Accepted: 28 November 2016 / Published: 30 November 2016

Abstract

:
Precipitation change has significantly influenced annual net primary productivity (ANPP) at either annual or seasonal scales in desert steppes in arid and semi-arid regions. In order to reveal the process of precipitation driving ANPP at different time scales, responses of different ANPP levels to the inter-annual and intra-annual precipitation fluctuations were analyzed. ANPP was reversed by building a ground reflectance spectrum model, from 2000 to 2015, using the normalized differential vegetation index of the Moderate-Resolution Imaging Spectroradiometer (MODIS-NDVI) data at 250 m × 250 m spatial resolution. Since the description of the differently expressing forms of precipitation are not sufficient in former studies in order to overcome the deficiency of former studies, in this study, intra-annual precipitation fluctuations were analyzed not only with precipitation of May–August, June–August, July–August, and August, respectively, which have direct influence on vegetation productivity within the year, but quantitative description, vector precipitation (R), concentration ratio (Cd), and concentration period (D), were also used to describe the overall characteristics of intra-annual precipitation fluctuations. The concentration ratio and the maximum precipitation period of the intra-annual precipitation were represented by using monthly precipitation. The results showed that: (1) in the period from 1971 to 2015, the maximum annual precipitation is 3.76 times that of the minimum in the Urat desert steppe; (2) vector precipitation is more significantly related to ANPP (r = 0.7724, p = 0.000) compared to meteorological annual precipitation and real annual precipitation influence; and (3) annual precipitation is almost concentrated in 5–8 months and monthly precipitation accumulation has significantly effected ANPP, especially in the period of June–August, since the vegetation composition in the study area was mainly sub-shrubs and perennial grasses, which were more sensitive to precipitation accumulation. These findings suggest that: (1) In the desert steppe, the inter-annual fluctuation and the intra-annual distribution of precipitation have a direct impact on ANPP; (2) the annual vector precipitation showed an extremely significant regression relationship with ANPP; and (3) monthly precipitation fluctuations (May–August) possess the accumulative effect on ANPP during the growing period in the desert steppe, while precipitation accumulation from June to August shows the most significant impact.

1. Introduction

Precipitation, and its pattern changes, is a key point of shaping the regional annual net primary productivity (ANPP) [1,2,3] and to be the main driving factors, precipitation has significantly influenced various biological processes of the ecosystem, especially in arid and semi-arid grasslands [4,5,6,7]. Precipitation always occurs in different forms, with different time scales, different occurrence times, durations, and intensities, leading to the lag of soil water and nutrition which becomes the main driving force of grassland ecosystem changes. Therefore, it is very important to understand the interaction between the grassland ecosystem and varied precipitation process [8].
Especially in arid and semi-arid regions, vegetation pattern is mainly determined by precipitation distribution at different time scales [5,9]. The impact of precipitation changes over 10 years can change the vegetation function types and species composition of an ecological system, and the precipitation change in annual and seasonal scales can change the vegetation phenology and ecosystem productivity [10,11]. Meanwhile, the vegetation pattern also directly affects the effectiveness of precipitation supply to vegetation, and the interrelationship between precipitation fluctuations and vegetation patterns is one of the current key research points of eco-hydrology [6,8,12,13,14].
At the regional scale, previous studies mostly focused on the impact of precipitation fluctuation on ecological processes in the time scales of years, seasons, and months [15,16,17,18]. Yang et al. [15], analyzed the temporal variability in growing season precipitation and normalized differential vegetation index (NDVI), but did not take other precipitation forms into account in the study. Wang et al. [16] used biweekly and monthly climate data to analyze the relationship between NDVI and precipitation and temperature, but did not involve other precipitation mathematic expressions. Du Plessiss et al. [17], compared 10-day interval cumulative rainfall, annual rainfall with 10-day intervals, and rainy season NDVI and MVC (Maximum Value Composite) using linear regression analysis, but also seldom involve with other inter-annual precipitation expressions. The ten-day composite NDVI values and the integrals of NDVI for each growing season were closely correlated with rainfall 10-day interval cumulative rainfall, as well as annual rainfall are compared with 10-day interval and rainy season NDVI and MVC using linear regression analysis in the study of Hielkema et al. [18]. The results achieved were mainly concentrated in the impact of precipitation seasonal distribution in larger spatial scales on productivity, water restriction, and vegetation function types of ecosystems, or in the role of precipitation and evapotranspiration shaping the vegetation pattern and the ecological process [14,16].
Yet, the description of different expression forms of precipitation are not sufficient in former studies. These kinds of expressions of precipitation in years, seasons, and monthly scales cannot cover all intra-annual precipitation characters. In spite of considering data availability and calculating convenience, the mathematical expression about precipitation fluctuations is still insufficient [8,16,19,20]. Therefore, in this study, in order to overcome the deficiency of former studies, intra-annual precipitation fluctuations were analyzed not only with precipitation during the growing season of May–August, June–August, July–August, and August, respectively, as the former studies involved, which have direct influence on vegetation productivity within the year, but also used quantitative description, vector precipitation (R), concentration ratio (Cd), and concentration period (D), to describe the overall characteristics of intra-annual precipitation fluctuations, which represented the concentration ratio and the maximum precipitation period of the intra-annual precipitation using monthly precipitation [21]. Concentration ration (Cd) represented the proportion of the concentration period precipitation in the total annual precipitation, and concentration period (D) approximately represented the maximum precipitation time in the year.
In the 1970s, studies about the correlation between spectrum reflectance and aboveground biomass had been reported to estimate vegetation productivity [19,20]. It was demonstrated that the fresh weight of the green part had a significant linear relationship with the greenness of grasslands, while correlation models between the grassland spectrum and aboveground production could be established with a high confidence degree model by using the same reflectance of the satellite band. Numata et al. analyzed the correlation between south pasture grass yield production and hyperspectral features of the ground reflection in South American steppes [22]. Fava et al. [23] studied vegetation index characteristics of European Mediterranean grasslands with hyperspectral technology. In recent years, ‘3S’ technology (remote sensing, RS; geographical information systems, GIS; and global positioning system, GPS) have been applied in China to construct ground-based linear or nonlinear remote sensing models for real yield estimation and prediction [24,25]. The relationship of vegetation indices and grassland biomass was studied, and many regression models have been established, most of them being linear or non-linear, that improved the accuracy of biomass estimates and determined grassland ANPP patterns in different regions. However, many researchers established the regression model between the vegetation index measured by satellite remote sensing and grassland biomass by directly using NDVI in Thematic Mapper™/Moderate-Resolution Imaging Spectroradiometer (MODIS) data and GPS, respectively, in order to study grassland productivity distribution patterns and to improve biomass estimation precision in different areas [26,27]. There is a severe lack of vegetation spectrometric data measured in the field for grasslands with which to estimate grassland ANPP, particularly in the desert steppe of China. Since the MOD13Q1 product of MODIS data is at a resolution of 250 m × 250 m, which is suitable for field investigation and has a moderate accuracy, in this study, we calculated NDVI in the same manner as MODIS-NDVI, which is a narrowband vegetation index in contrast to the traditional NDVIs. We investigated the potential of the ground narrowband NDVI for the estimation of grassland ANPP using the technique of ground hyperspectral measurement [26].
Desert steppes in arid and semi-arid areas are more sensitive to precipitation change [13], and an effective precipitation in the growing season significantly change the population dynamics, community structure, and productivity [8,28]. These areas are also the direct borderline of desert steppe to desert land. The vegetation dynamic in these areas determine the transition between desert ecosystems and desert steppes. Thus, the study of ANPP response to precipitation in this type of area is necessary and important. In this study, the correlation models between ground NDVI and aboveground productivity was established with a high confidence model. Since the NDVI was calculated using the same satellite band, this regression model could be used on satellite data to reverse ANPP.
In this paper, we selected accumulation precipitation and annual vector precipitation in different time scales as the main features to analyze (1) the impact of precipitation fluctuation on the ANPP of desert steppe vegetation in different time scales; and (2) the impact of intra-annual precipitation distribution affecting ANPP in a desert steppe.

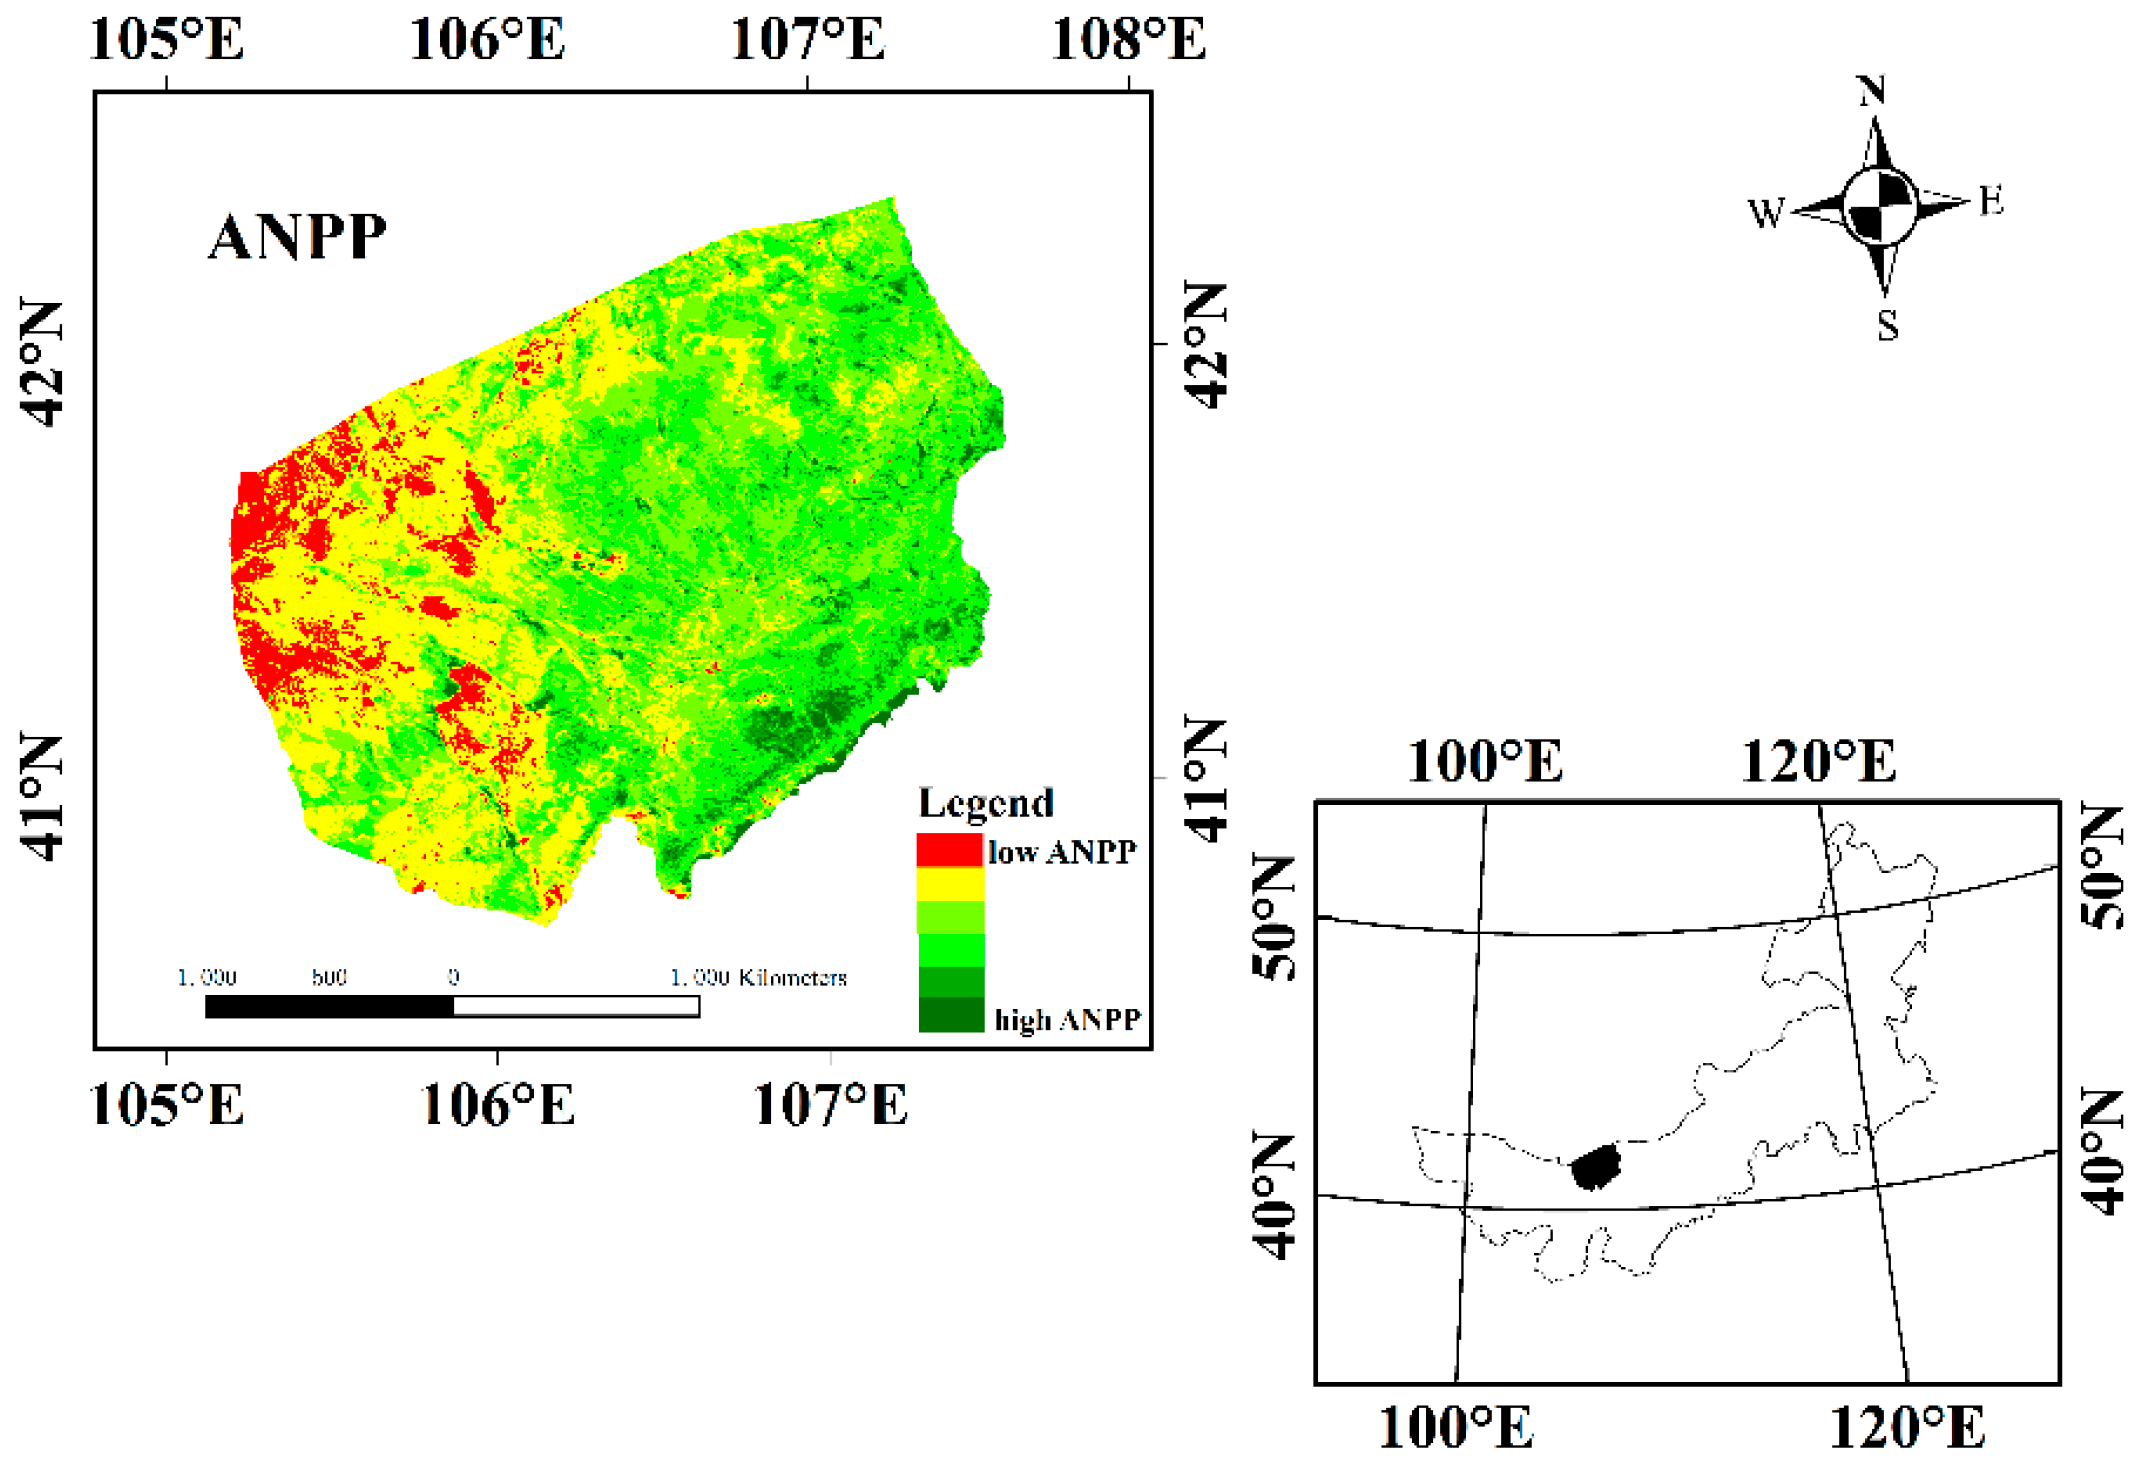
2. Overview of Research Regions

The research region was in the Urat Banner in Inner Mongolia. Its topography mainly comprises Gobi plateaus with sand gravels and Gobi deserts, as well as an elevation of 1500~1600 m (Figure 1), while it has a typical temperate continental monsoon climate and is impacted by the Mongolian high pressure continental air mass.
From 1971 to 2011, the average annual temperature is 5.3 °C. The average annual precipitation is 139.5 mm and the rainfall in July and August account for about 70%. The average annual wind speed is up to 5 m/s, causing up to 28 sandstorm days and the frost-free period being 130 days. The soil types in the study area mainly consist of brown soil and grey brown desert soil, the latter accounting for the vast majority. The vegetation is dominated by super dry shrubs, sub-shrubs, and meat leaf shrubs, with a very low ANPP. The constructive species were mainly Reaumuria songarica (Pall.) Maxim., Stipa glareosa P. Smirn. Caragana tibetica Kom., Stipa glareosa P. Smirn, and the dominant species were mainly Cleistogenes songorica (Roshev.) Ohwi, Ajania fruticulosa (Ledeb.) Poljak., Allium polyrhizum Turcz. ex Regel, Heteropappus altaicus (Willd.) Novopokr., Potaninia mongolica Maxim., Salsola laricifolia Turcz. ex Litv., and so on.

3. Materials and Methods

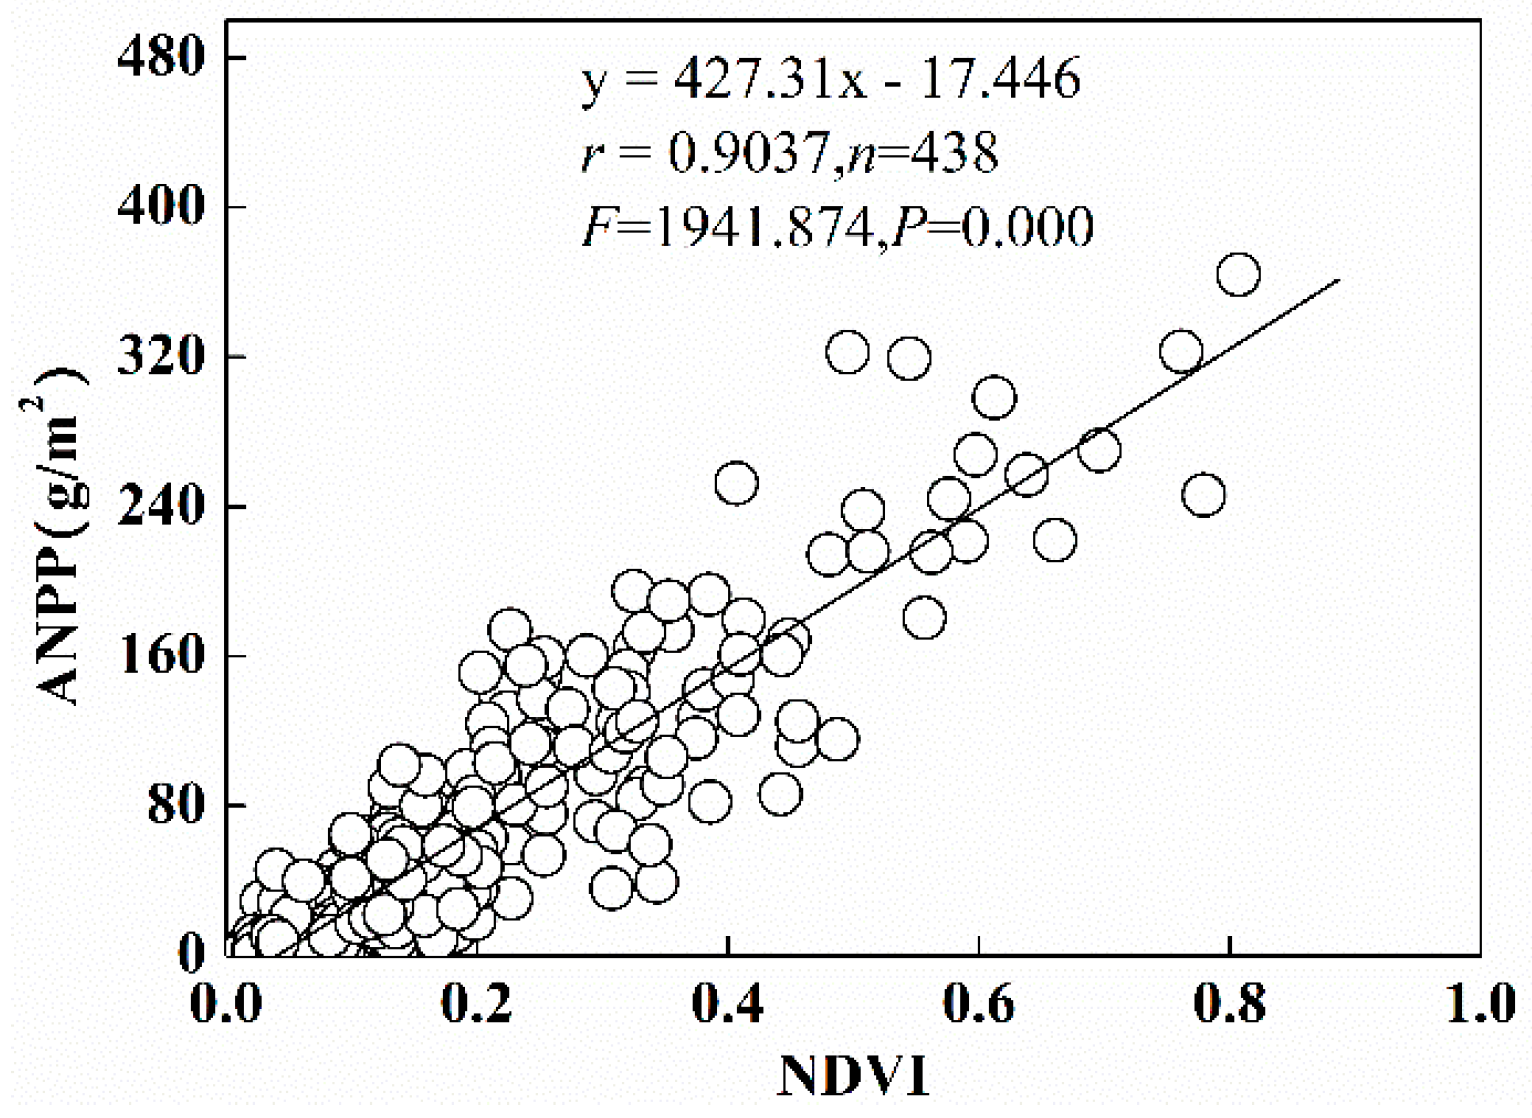
3.1. Establishinga Ground Vegetation Reflectance Spectrum-ANPP Model

The grassland vegetation spectrum was collected with a handheld spectrometer (Fieldspec HH, ASD, USA), which is a full range spectrometer (350–2500 nm) with a resolution of 1.5 nm in the 350–1000 nm and 2 nm in the 1000–2500 nm ranges, used for field optical measurements for all samples, and is suitable for fully meeting the requirements of this study. The ASD spectra were collected with a 25° field of view and the sensor for observation was kept vertically downward with a distance of 67 cm. It should be corrected every 10–15 min with a white board as the solar elevation changes. In order to reduce the influence of shadows, this collection should be done between 10:00 a.m. to 15:00 p.m. in sunny and cloudless weather with the wind being relatively mild and stable. Since the view field angle of the machine was 22.5°, this distance (67 cm) would ensure that the area of the sample point was a circle 30 cm in diameter. Every spectrum collection of each sample point should repeat five times and the last data was the average of the five in order to reduce personal and systematic errors. When spectrum collecting was finished, all spectrum data was analyzed in View Spec pro 6.0 software (Analytical Spectral Devices Inc., Boulder, CO, USA), using lambda integration to extract the wave band the same as the MODIS-NDVI infrared band (0.841~0.876 μm), and near infrared band (0.620~0.670 μm). The measured NDVI was calculated by Equation (1):
N D V I = ( ρ NIR ρ Red ) / ( ρ NIR + ρ Red )
where ρ NIR represents the near-infrared band and ρ Red represents the infrared band.
A total of 438 samples were measured from 21 to 31 July in 2014 and 2015, according to the vegetation biomass gradient of the desert steppe. While the biomass was represented by dry weight, vegetation ANPP was shown as the aboveground biomass in the same year. The part of the underground biomass and grazers feed intake were not considered because they could not be measured accurately [26].
When ANPP was calculated, a statistical model was built between the measured NDVI and ANPP in the same sample point using a regression analysis method. The equation with the best statistical test was chosen in the model. The equation between the measured NDVI and ANPP was made as shown in Figure 2, r = 0.9037 and p = 0.000, passing the statistical test. An F test reflects the degree of linear regression fitting. The p value reflects the significant level of fitting.
Previous studies showed that the measured ground vegetation spectrum can represent that measured by satellite remote sensing since there is an inherent connection between them [26].

3.2. Quantitative Expression of Precipitation Fluctuation

3.2.1. Inter-Annual Precipitation Fluctuation

The inter-annual fluctuations were expressed directly by the meteorological annual precipitation. However, the time the MODIS data was obtained and the meteorological annual precipitation were unmatched. Hence, considering the MODIS data was obtained on 14 August every year, the precipitation data in this study was not only using meteorological annual precipitation (1 January to 31 December) but also the real precipitation from 14 August to 14 August of the following year to match MODIS data. However, it was not enough to describe the fluctuations of the intra-annual precipitation distribution.

3.2.2. Intra-Annual Precipitation Fluctuations

Intra-annual precipitation fluctuations were analyzed with precipitation from May to August, June to August, July to August, and precipitation accumulation in August, respectively, which have direct influence on ANPP in the same year. Meanwhile, a quantitative description for the overall characteristics of intra-annual precipitation fluctuations within one year was expressed with vector precipitation (R, Equations (2)–(4)), concentration ratio (Cd, Equation (5)), and concentration period (D, Equation (6)) [21]. By using the above method, the concentration ratio of the intra-annual precipitation and the maximum precipitation period were represented by monthly precipitation.
Concretely speaking, the monthly precipitation was used as the vector with its size as the vector length and the time as the vector direction. That is, one day was approximately equal to 0.986 degrees, a precipitation vector in January was equal to zero, and 365 days in one year were regarded as a circle. The precipitation in every month was decomposed into y and x components in two directions, and the total vector synthesis of y and x components and the precipitation vector of each month was shown as follows:
R x = i = 1 12 r xi = i = 1 12 r i sin θ i
R y = i = 1 12 r yi = i = 1 12 r i cos θ i
R = R x 2 + R y 2 = ( i = 1 12 r i sin θ i ) 2 + ( i = 1 12 r i cos θ i ) 2
where ri and θi represent the magnitude and direction of the monthly precipitation vector, respectively. Rx and Ry represent the vector synthesis in the x and y directions, respectively; R represents the total vector synthesized with Rx and Ry, and the concentration ratio (Cd) and concentration period (D) were defined as:
C d = R / i = 1 12 r i × 100 %
D = arctg ( R x / R y )
By Equations (6) and (7), the concentration ratio (Cd) represented the proportion of the concentration period precipitation in the total annual precipitation, and the concentration period (D) approximately represented the maximum precipitation time in the year, which was specifically determined based on the quadrant between the positive and negative relationship of Rx and Ry.

3.3. Impact of Precipitation Fluctuations on ANPP

The impact of precipitation fluctuations on desert steppe productivity was analyzed from three levels: (1) the inter-annual precipitation fluctuation was represented by the meteorological annual precipitation (P) and the real annual precipitation (Pm) defined by the MODIS data acquisition time (14 August); (2) the accumulative effect of precipitation, the annual precipitation accumulation from 14 May to August (PMA), 14 June to August (PJA), precipitation accumulation from 14 June to August (PJNA), and that from 14 August (PJLA), as well as from 1 to 14 August (PA) in every year were adopted; and 3) the intra-annual precipitation distribution pattern: vector precipitation (R), concentration ratio (Cd), and concentration period (D) were applied. In order to facilitate and simplify the calculation, all above analyses were carried out with the statistic software Statistical Product and Service Solutions, version 11.0 (SPSS 11.0).

4. Results

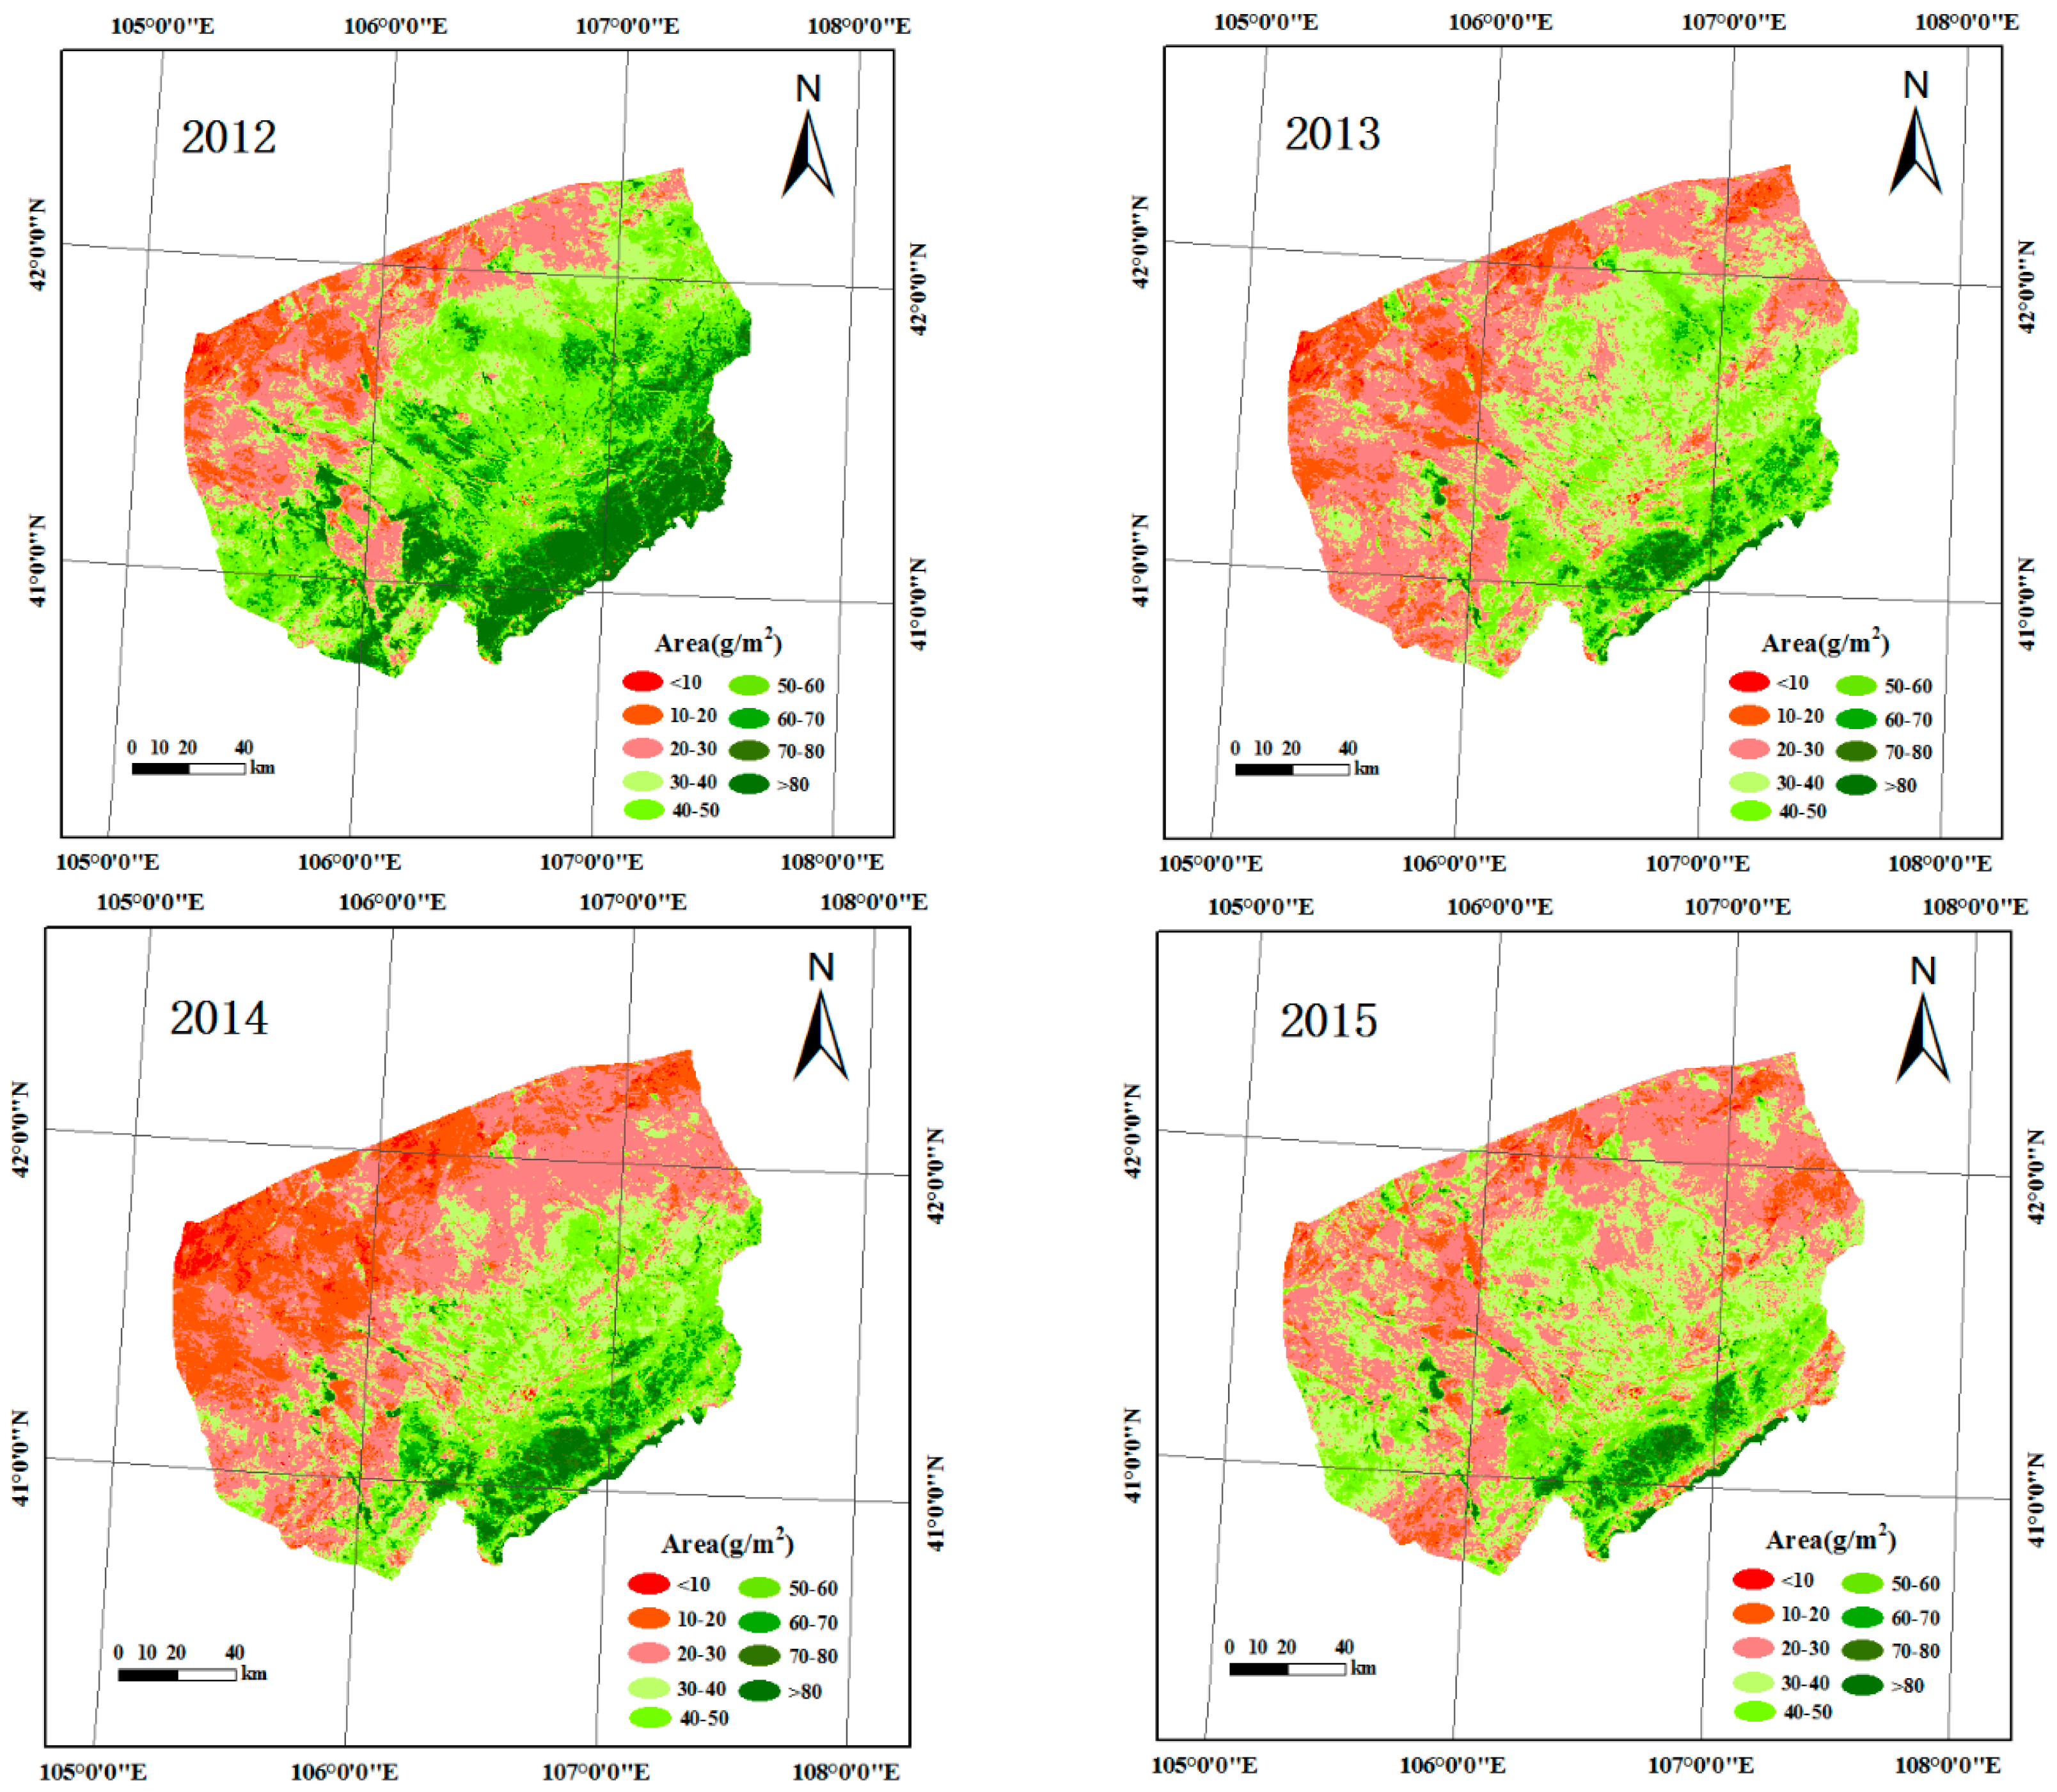
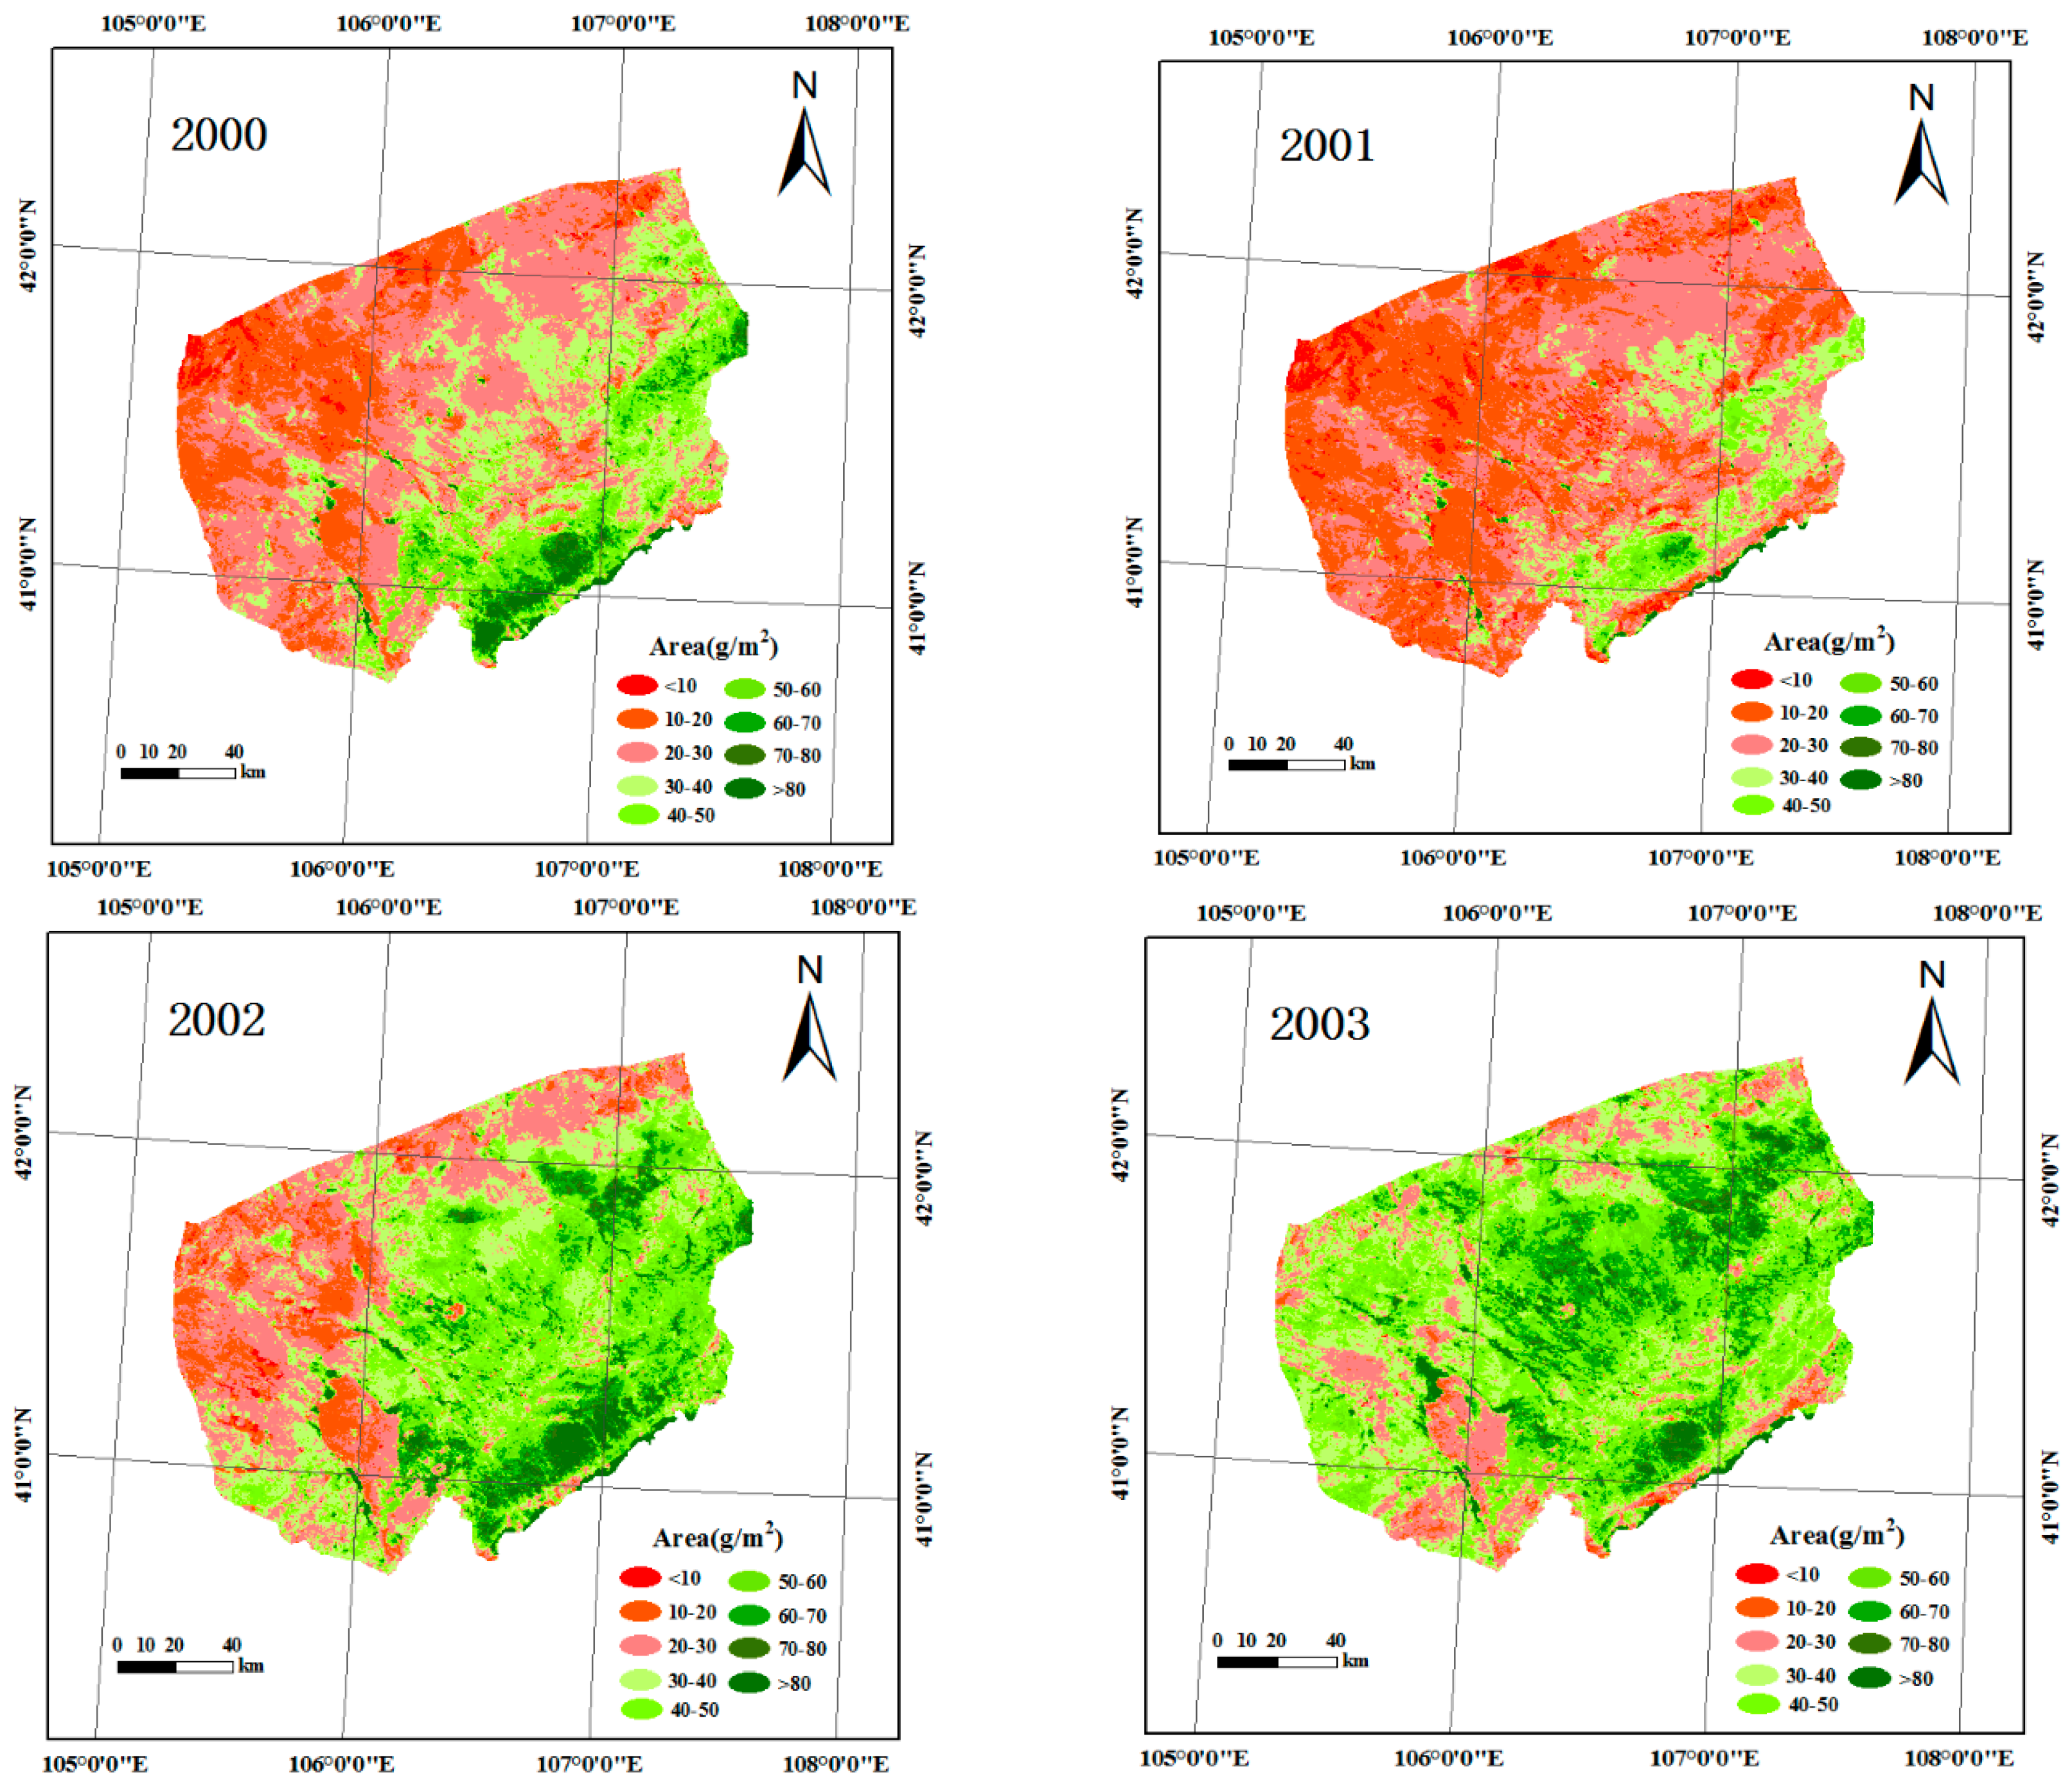
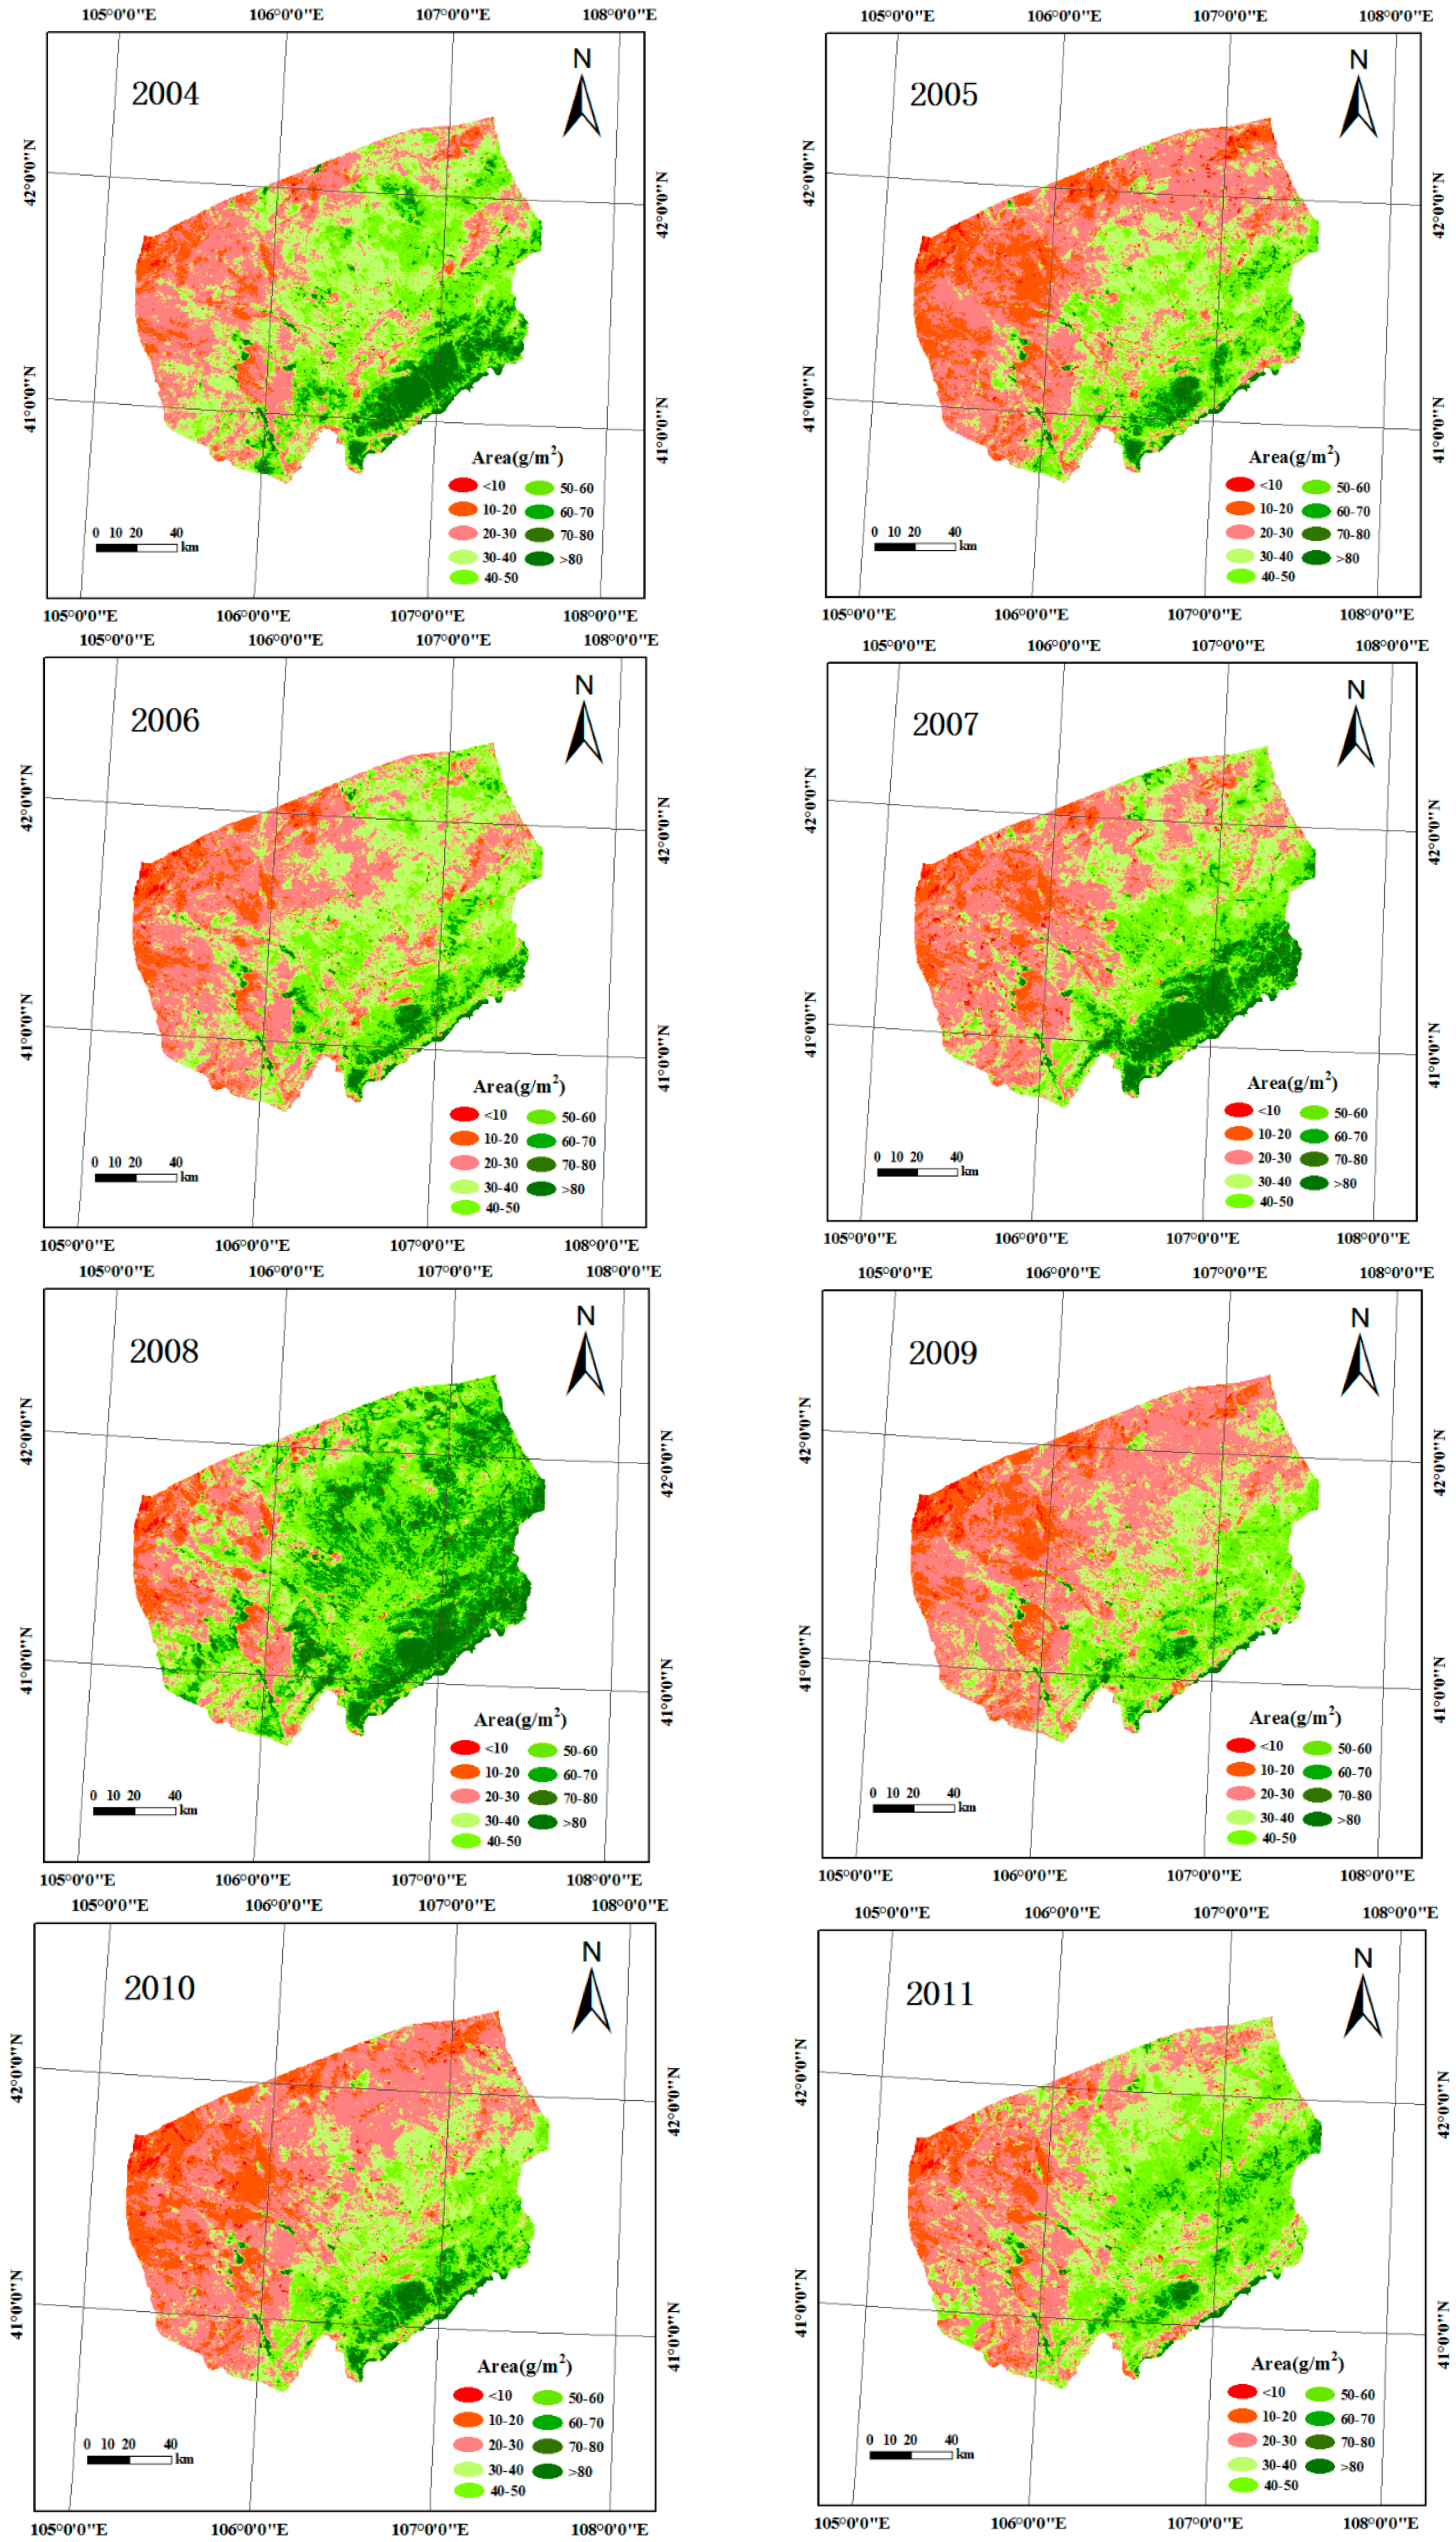
4.1. ANPP Distribution in Different Years

The ANPP distributions were generated after geometric correction of MODIS data by regional standard Landsat data, and its subsequent conversion was done with the Raster Calculate module according to the model in Figure 2. Then the regional ANPP in different years were calculated, respectively, with the MODIS NDVI data (with a resolution of 250 m) for 16 days (to 13 or 14 August each year, using Terra satellite data) under the support of ERDAS [15,16,17] and ArcGIS [26].
It is shown in Figure 3 that the ANPP distribution fluctuated greatly from 2000 to 2015 in the study area. The ANPP decreased from 2000 to 2001, which the area <10 g/m2 took majority of the whole area and the ANPP significantly rose from 2002 to 2003, in which an area of approximately 50–60 g/m2 had the largest area. Subsequently, the ANPP declined and retained a low level from 2004 to 2006, and increased from 2007 to 2008, of which the level recovered to that in 2004. It finally increased in 2012, after the decline in 2009, while it decreased from 2012 to 2015 again.

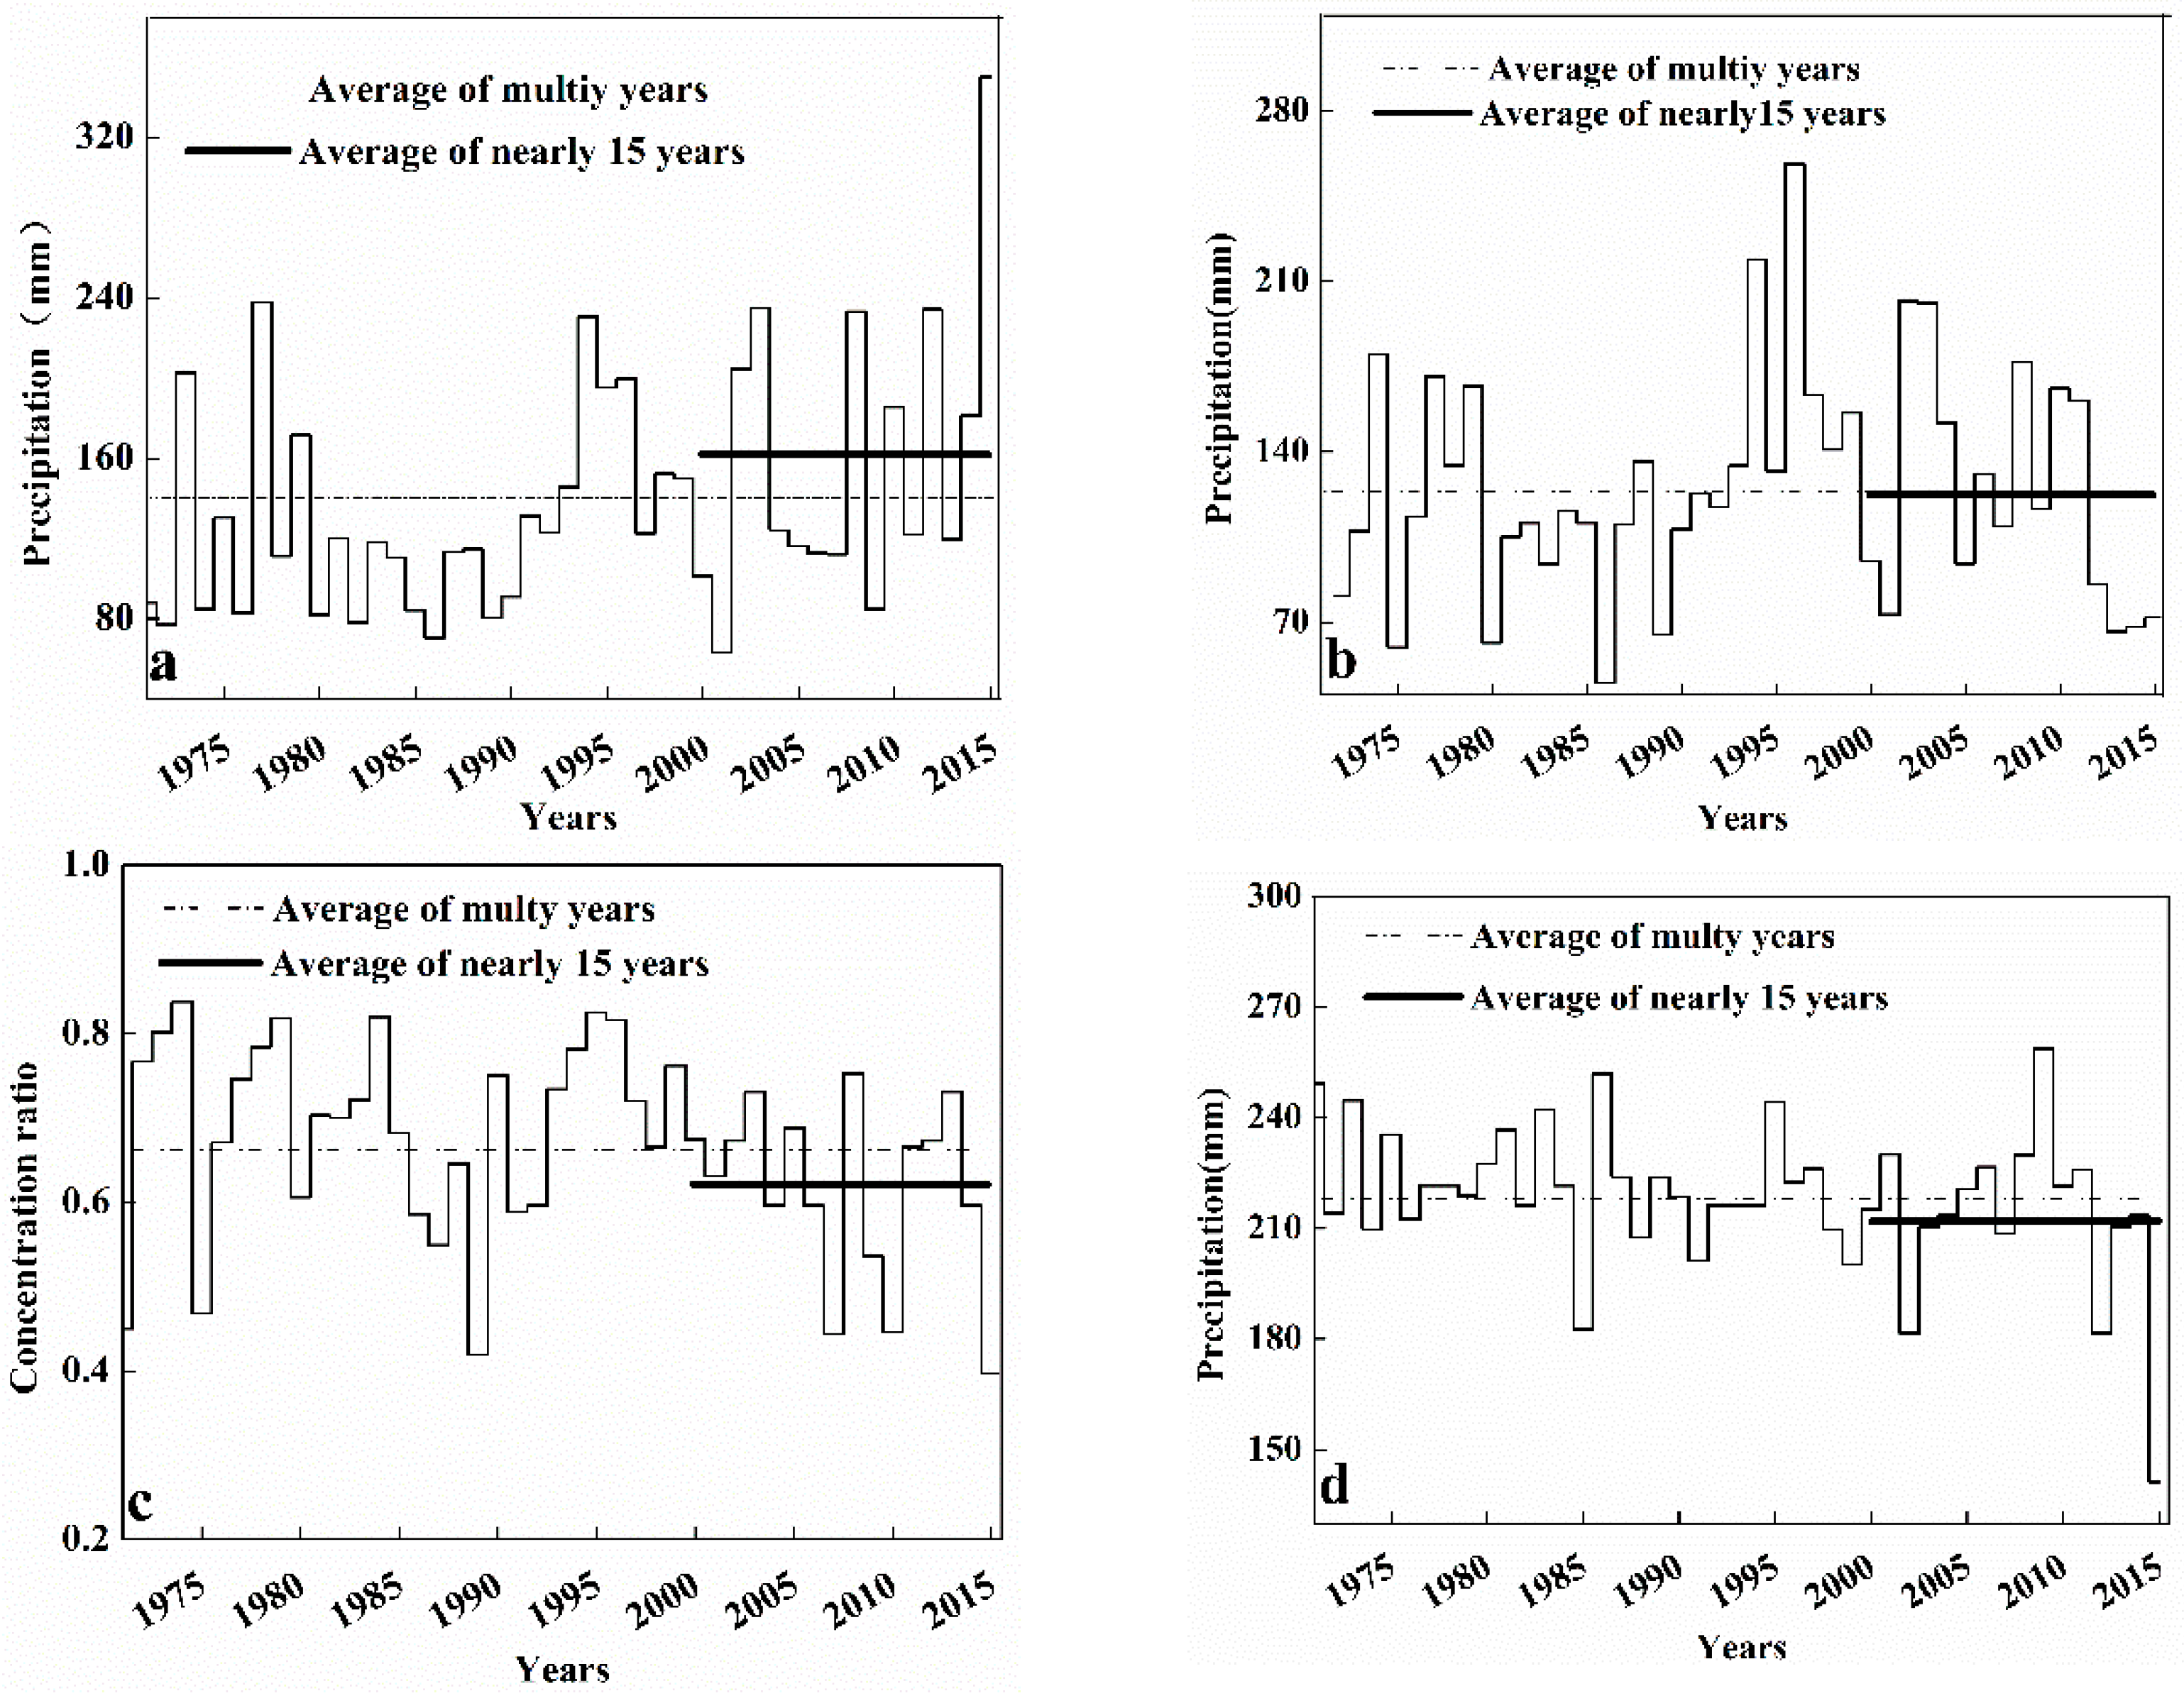
4.2. Precipitation Fluctuation Characteristics

As for the inter-annual precipitation fluctuation, the meteorological annual precipitation changed from 63.2 to 350.8 mm from 1971 to 2015, the average being 139.5 ± 50.0 mm (Figure 4a). In addition, precipitation was above the average for 17 years; lower than the average level for 28 years; and close to the average for four years. The inter-annual average (151.2 ± 55.6 mm) of the last 15 years was significantly higher than the multi-year average. The real precipitation changed 45.0–258.3 mm (Figure 4b), and the average was 129.9 ± 45.5 mm. Additionally, precipitation was above the average for 14 years; lower than the average level for 22 years; and close to the average for five years. The inter-annual average (141.2 ± 55.6 mm) of the last 15 years was significantly higher than the multi-year average.
As for intra-annual precipitation fluctuations, the precipitation concentration changed from 0.419 to 0.838 from 1971 to 2015, the average being 0.670 ± 0.11 (Figure 4c). In addition, precipitation was above the average for 19 years; lower than the average level for 15 years; and close to the average for seven years. The inter-annual average (0.620 ± 0.10 mm) of the last 15 years was significantly lower than the multi-year average. The precipitation period changed 181.5~258.8 days, the average was 221.4 ± 15.9 days (Figure 4d). Additionally, precipitation was above the average for 14 years; lower than the average level for 19 years; and close to the average for eight years. The precipitation period (220.2 ± 17.2 days) of the last 15 years was close to the multi-year average.

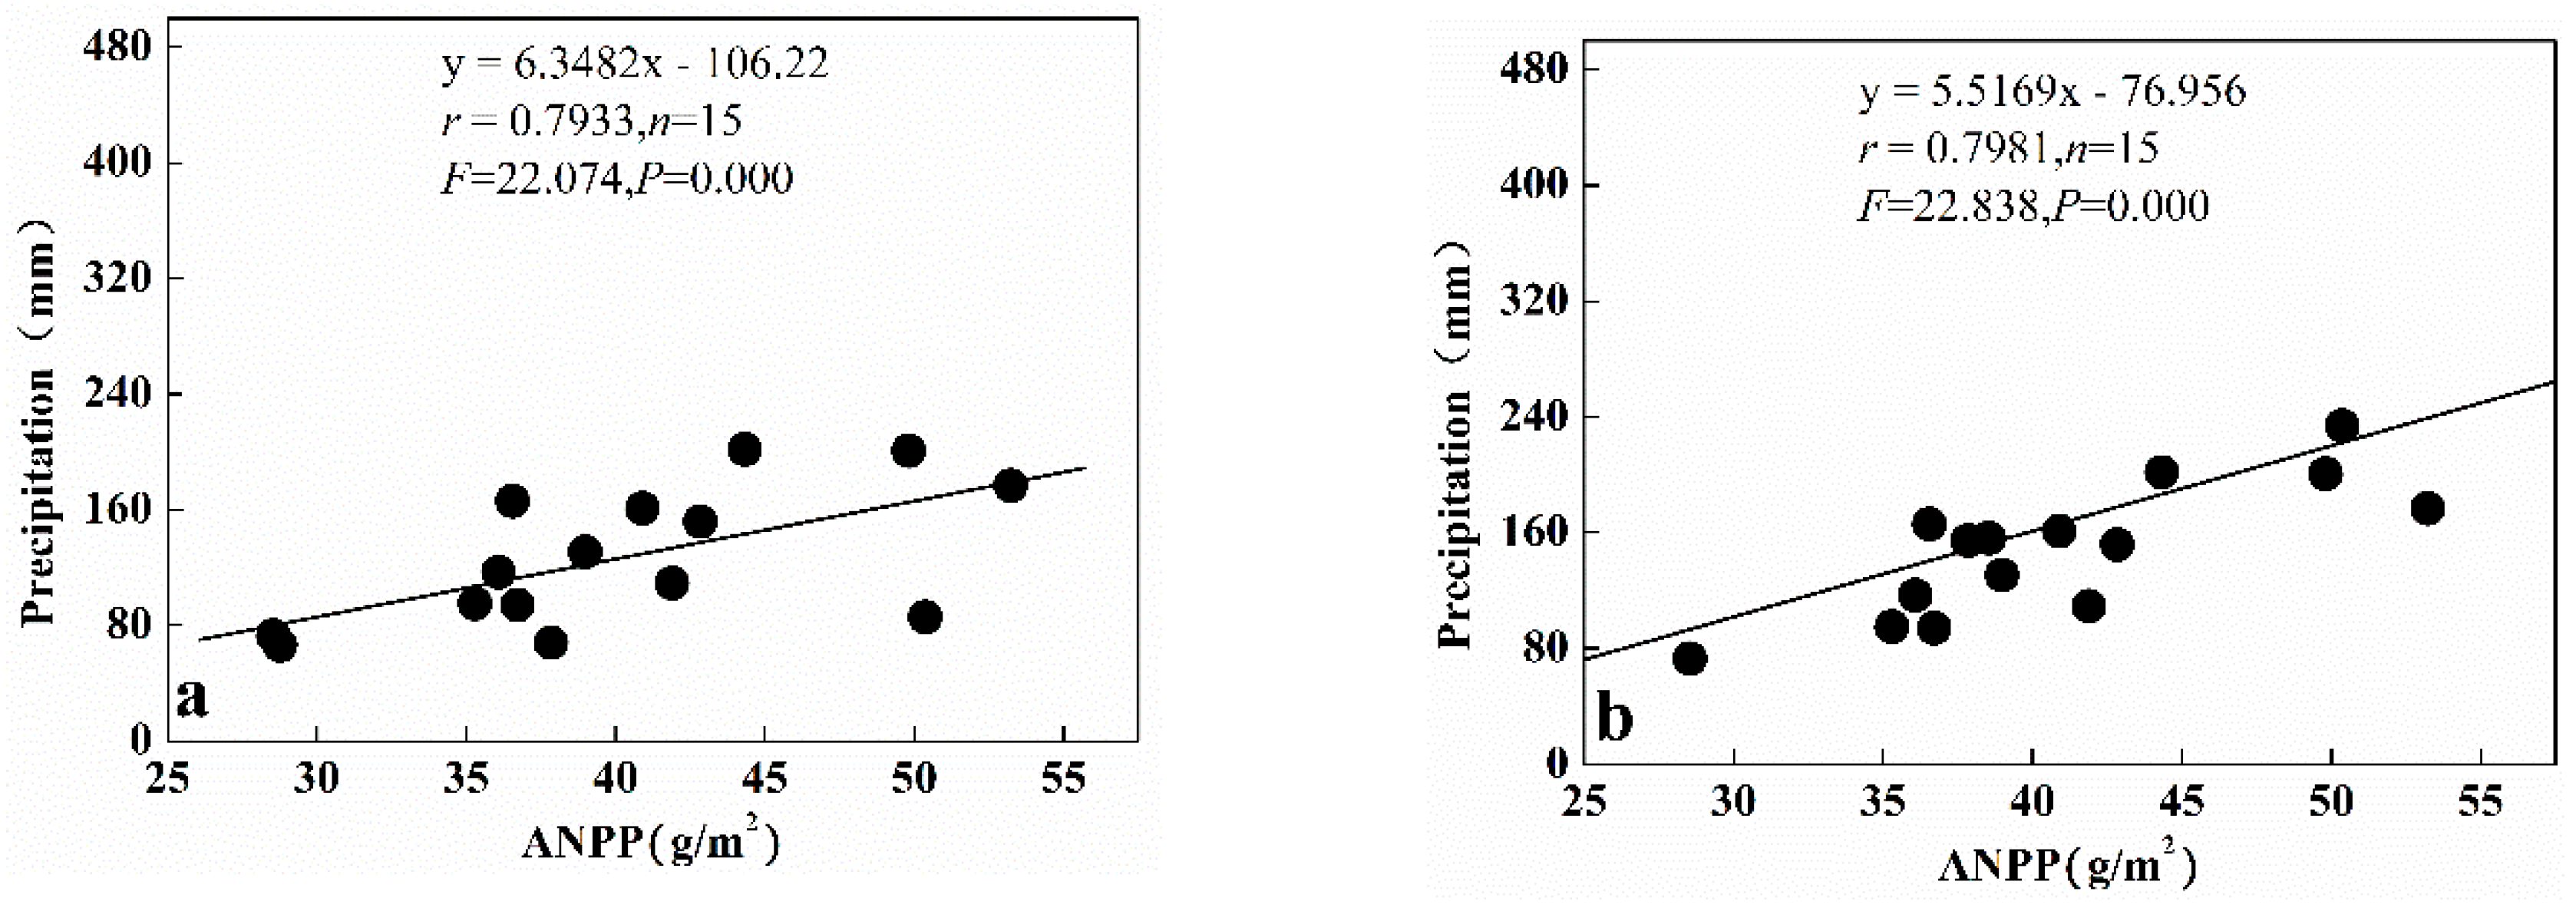
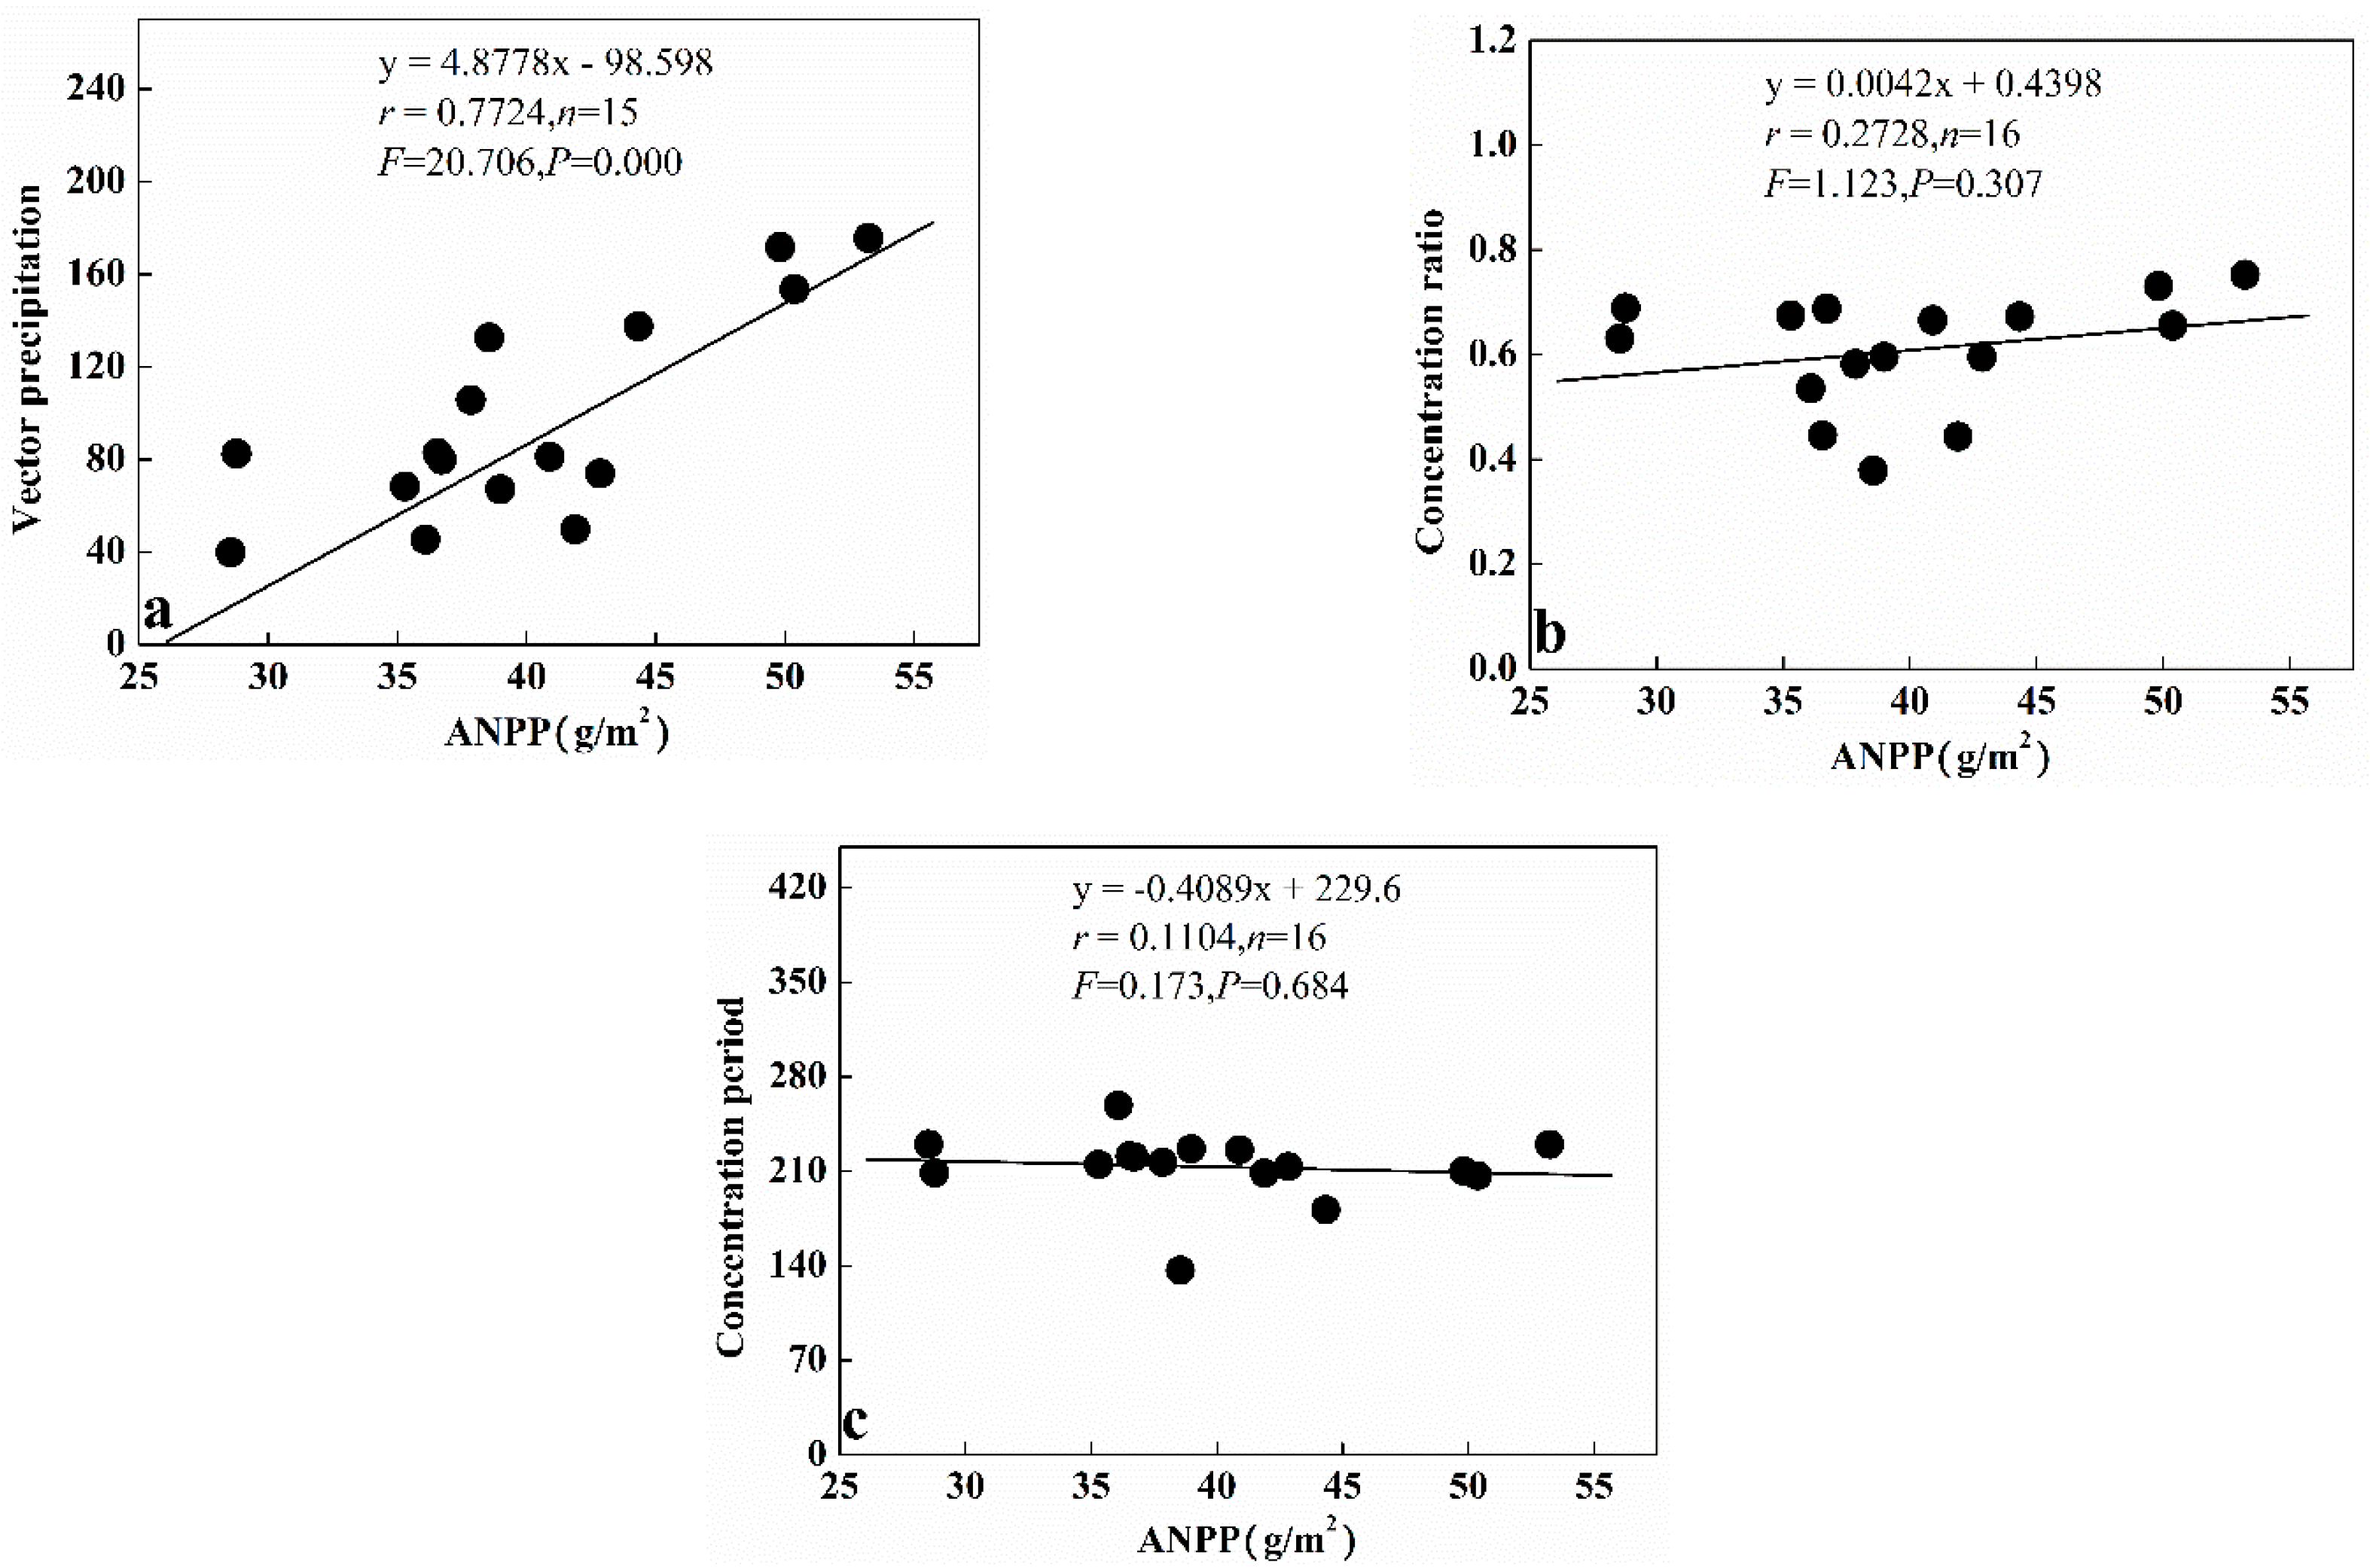
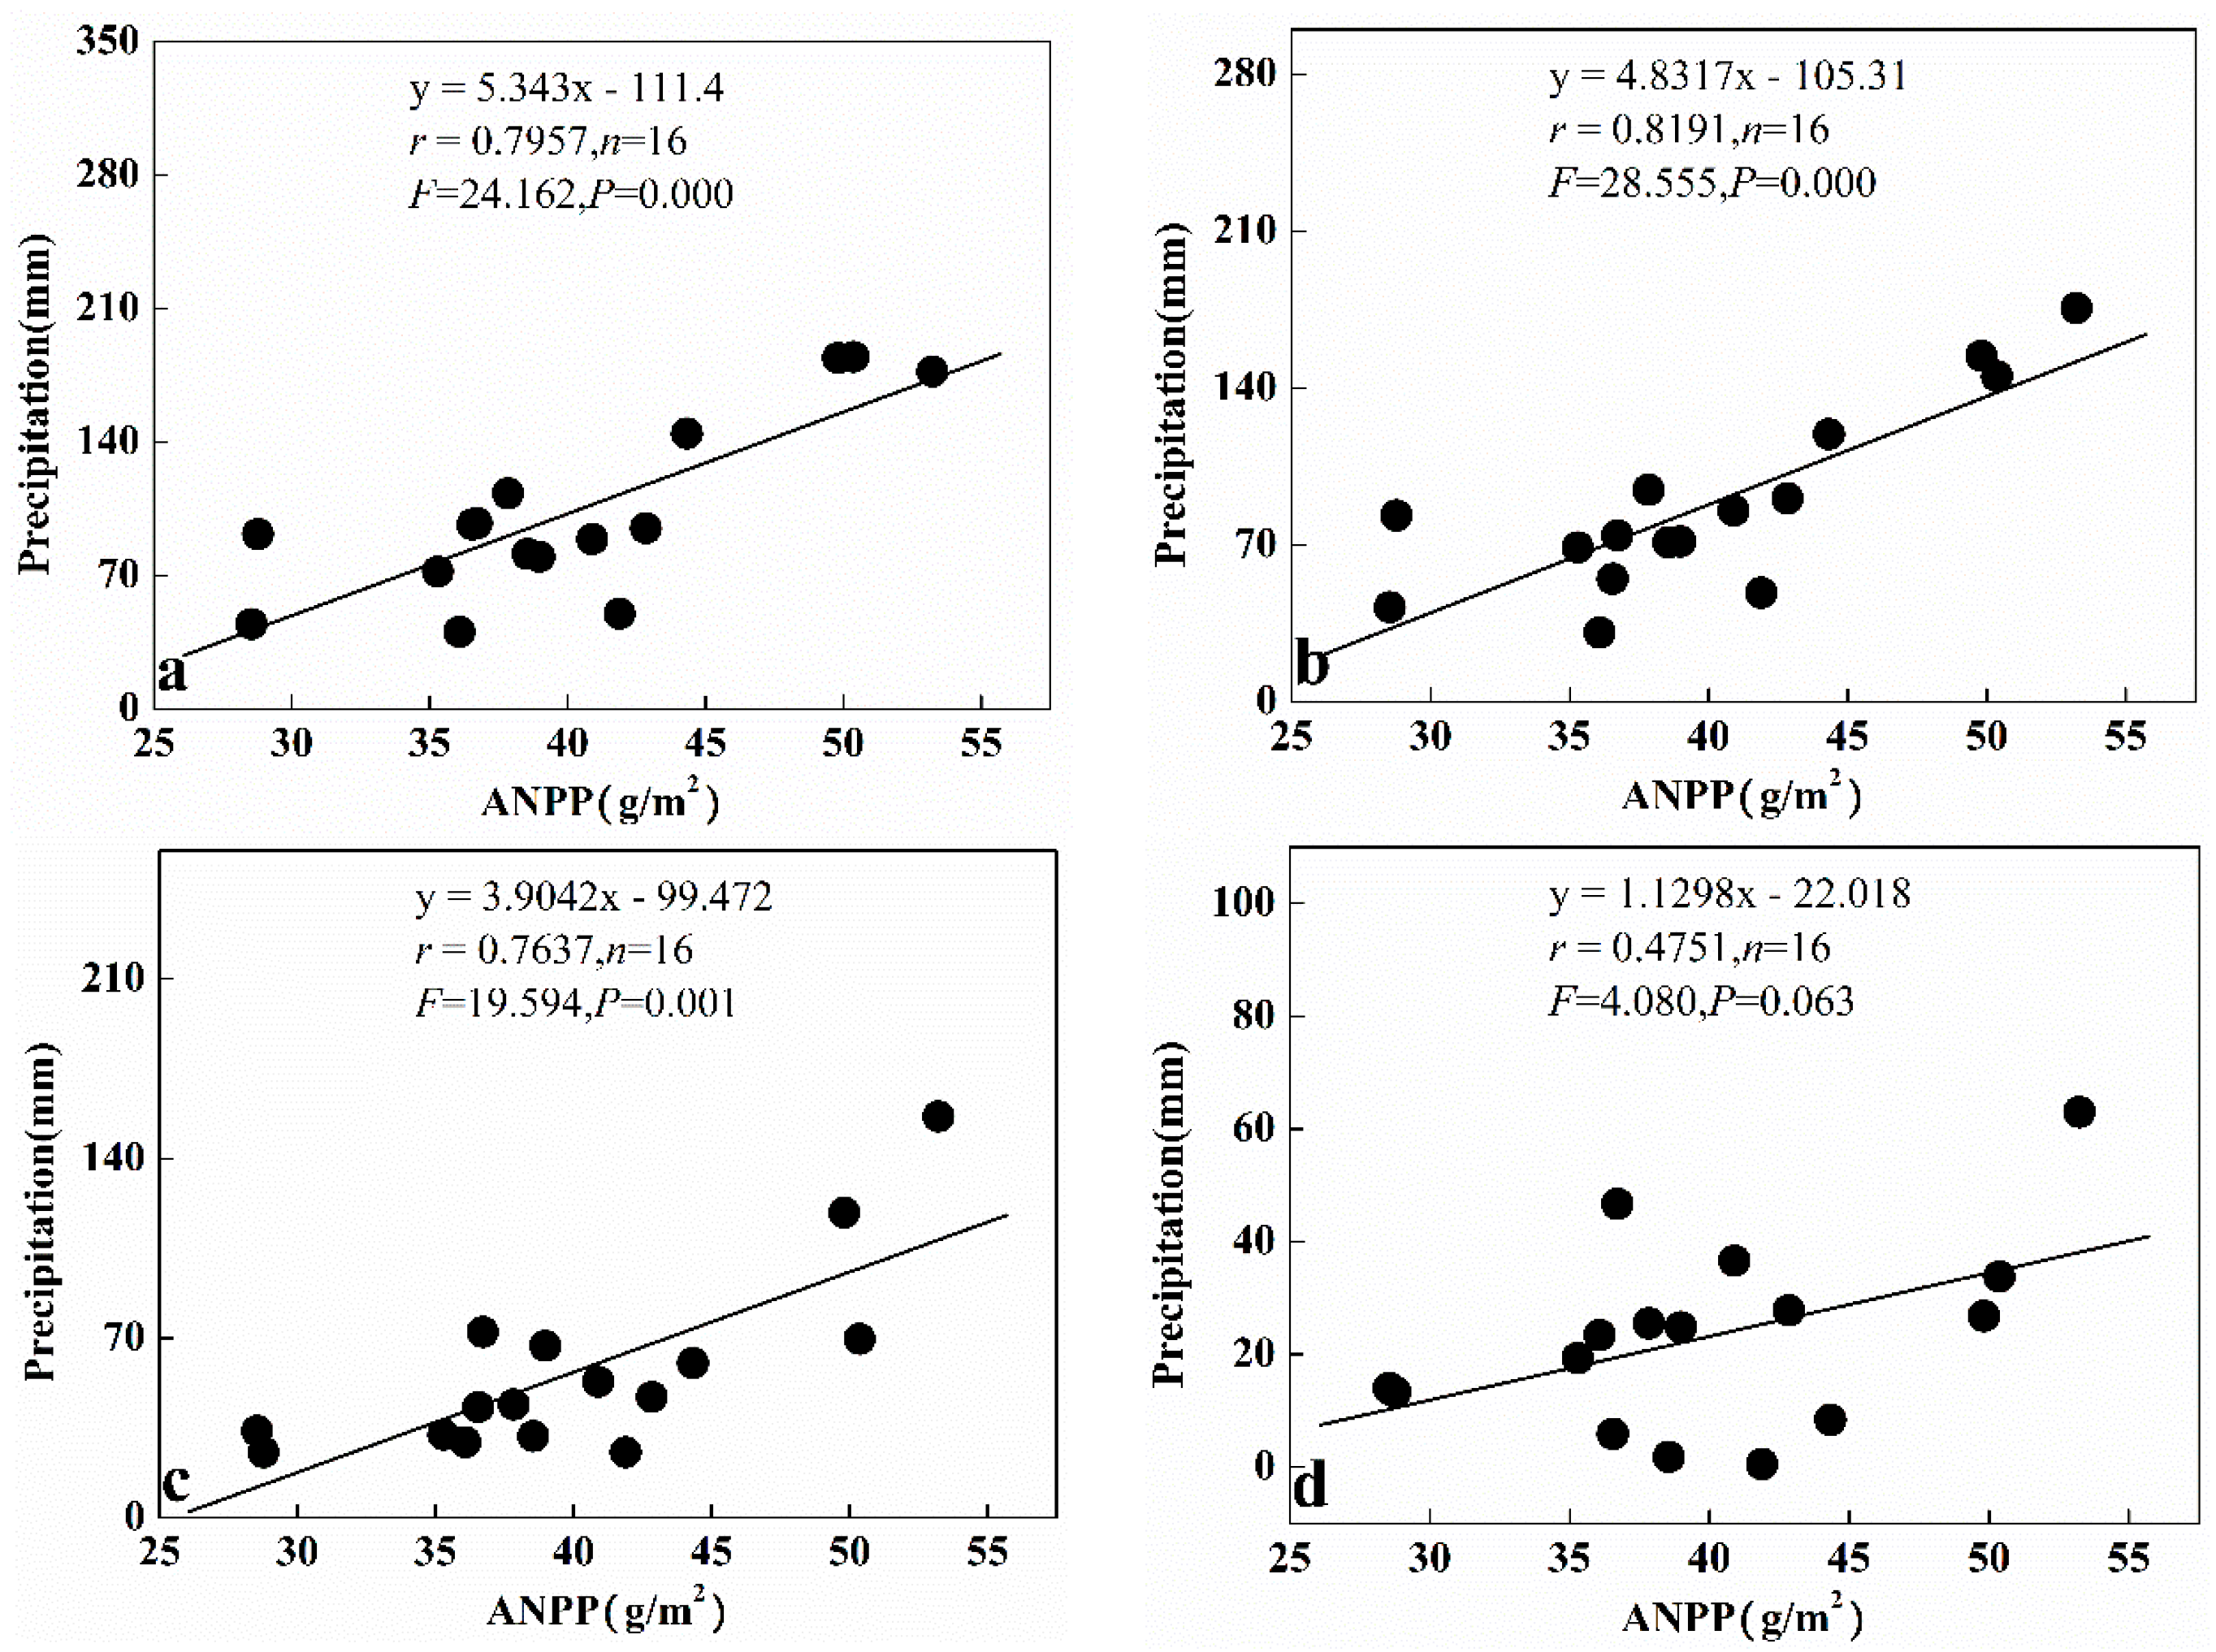
4.3. Impact of Precipitation Fluctuations on the ANPP of the Desert Steppe

From the aspect of the relationship between inter-annual precipitation fluctuations and the ANPP, both inter-annual fluctuations of meteorological precipitation and real precipitation had a significant impact on the ANPP of the desert steppe (p = 0.000, F = 22.074 Figure 5a; p = 0.000, F = 22.838). The linear regression relationship between real precipitation and the ANPP (Figure 5a, p = 0.000, r = 0.7981) was almost the same as the meteorological precipitation (Figure 5b, p = 0.000, r = 0.7933), while they had a similar trend, the ANPP increased with rising precipitation, no matter the meteorological precipitation or real precipitation.
From the aspect of the relationship between intra-annual precipitation distribution patterns and the ANPP, the vector annual precipitation had a positive correlation with the ANPP (Figure 6a) with a significant linear regression relationship (p = 0.000, r = 0.7724, F = 20.706); the concentration ratio did not have a significant regression relationship with the ANPP (Figure 6b, p = 0.307, r = 0.2728, F = 1.123), but did have a positive correlation. The concentration period had a negative correlation with the ANPP (Figure 6c) with no significant relationship (p = 0.684, r = 0.1104, F = 0.173).
From the analysis of the accumulative effect of intra-annual precipitation, the cumulative precipitation at different time scales had a significant effect on the ANPP, especially in the key period (May–August) of the growing season. The regression equation established according to the cumulative precipitation and the ANPP in the maximum time scale (May–August) had a high significance level (p = 0.000, r = 0.7957); the regression relationship between the two in the time scale of June–August was extremely significant (p = 0.000, r = 0.8191); the regression equation in the time scale of July–August was also of significance (p = 0.001, r = 0.7637); and the regression equation of August was not significant (p = 0.063, r = 0.4751).

5. Discussion

It is widely recognized that precipitation fluctuations have a significant impact on the ANPP of grassland in arid and semi-arid regions [10,13,29]. However, previous studies regarding the characteristics of precipitation fluctuations in desert steppes, and the relationship between them, are still insufficient. Results in this paper showed that meteorological annual precipitation in the desert steppe in Urat of Inner Mongolia had remarkable inter-annual fluctuations with no obvious regularity (Figure 4a) in the last 45 years (1971–2015) and the maximum annual precipitation was 3.76 times of the minimum, which had a larger rangeability than that in Hulunbeier Grassland and Horqin sandy land [30,31]. That means the precipitation in the desert steppe was more changeable.
Meanwhile, changes of the real annual precipitation, matching with the obtained time of the ANPP, had no obvious regularity with larger rangeability, as well (Figure 4b). The maximum precipitation was 5.74 times that of the minimum. The common characteristic was the average precipitation (9.7 mm) over the last 15 years (2000–2015), which was higher than that (8.0 mm) seen in multiple years.
In the intra-annual precipitation distribution of the same period in multiple years (Figure 4c,d), the variation amplitude of the concentration ratio and concentration period is lower than the annual precipitation, and the ratio of maximum and minimum was 2.0 and 1.4, respectively, which means fluctuations of intra-annual precipitation distribution are smaller than that of the inter-annual precipitation in the time period of the research. However, it does not mean that the inter-annual precipitation had greater impacts on the ANPP, and the impact of the two on the ANPP in the desert steppe needs further comparative analysis and study of multi-scale observation over a long period.
The analysis of impact of the meteorological annual precipitation and the real annual precipitation to the ANPP showed that both had significant impacts on vegetation productivity of the desert steppe (Figure 5), while the latter had a higher correlation coefficient. The relationship between the annual precipitation and the ANPP could fit the linear regression model with high confidence in the desert steppe. This is different from some results in meadow steppes and alpine grasslands. The high confidence model in meadow steppes was a power function in others’ research [26], and in the alpine grasslands the model between precipitation and he ANPP were more complex [30,31,32,33]. This is because the precipitation-ANPP model for the meadow steppe and alpine grassland is determined not only by the factor of precipitation, but also by other factors like heat. So they need a simple multi-equation or a differential equation, which are established between heat, precipitation and ANPP, to explain the impact of meteorological factors on the ANPP [27,31,32,33]. For a desert steppe in arid and semi-arid regions, because the most important factor that influence ANPP is precipitation and the non-decisive factor is heat, using precipitation without heat to build model is decisive. In analysis about intra-annual precipitation distribution and the ANPP, the annual vector precipitation not only represented the inter-annual distribution of precipitation (a value for each year), but also contains the distribution characteristics of intra-annual precipitation (the resultant vector value of 12 months), which had the closest correlation with ANPP (Figure 6a). The concentration ratio calculated by Equation (5) means the ratio of the vector precipitation in the total precipitation of the same year and concentration period calculated by Equation (6) is the data that vector precipitation appeared, neither of them having a significantly close relationship with the ANPP, and both of the regression equations passed the significance test of p < 0.1. Since the precipitation in the desert steppe was mostly concentrated to the growing season (5–8 months), and the vector precipitation showed the sum of the precipitation character of each month, it had a close relationship with the ANPP, which meant the monthly precipitation had a large contributed to the ANPP. The concentration ratio and concentration period did not have a close relationship with the ANPP, meaning the precipitation was mostly concentrated in several months of the year, but not distributed over the whole year. The research of Guo et al. [31] also showed similar results. They mentioned that the September precipitation accounted for 60%–70% of the annual precipitation in the region, which was favorable for the growth of vegetation.
The intra-annual precipitation accumulation at different time scales shows a significant accumulative effect on the ANPP in the desert steppe (Figure 7), and the precipitation accumulation from June to August significantly influenced the formation of the ANPP, while at other time scales it showed a smaller affecting trend in the ANPP formation, especially in August which showed no significant impact. This result was similar with the results in the research of Moxi et al. [34], in which they mentioned that the accumulation of precipitation significantly affected the NDVI, especially the first two or three months’ precipitation. The difference came from the composition characteristics of the local vegetation, the dominant plant species in the desert, such as Reaumuria songarica (Pall.) Maxim., Caragana tibetica Kom., Ajania fruticulosa (Ledeb.) Poljak., and Cousinia thomsonii C. B. Clarke, which could respond to the effective precipitation, especially during the growing period (except at the end of growing season) to maintain growth and complete their respective life cycles [4]. In addition, some perennial sub-dominant and companion species, such as Cleistogenes songorica (Roshev.) Ohwi, Allium polyrhizum Turcz. ex Regel, Heteropappus altaicus (Willd.) Novopokr., Salsola laricifolia Turcz. ex Litv., etc., possess the characteristics of growing several times in a year. That is to say, multiple growth would happen with multiple intervals of effective precipitation in the growing period. Furthermore, the precipitation from June to August accounted for 70%~80% of the whole year’s precipitation in the arid and semi-arid area, and ultimately ensured a significant precipitation accumulation effect on desert steppe ANPP from May to August.

6. Conclusions

In this study, intra-annual precipitation fluctuations were analyzed not only with precipitation of May–August, June–August, July–August, and August, respectively, which have direct influence on vegetation productivity within the year, but also using quantitative description, vector precipitation (R), concentration ratio (Cd), and concentration period (D) to describe the overall characteristics of intra-annual precipitation fluctuations. The main conclusions were that, in the desert steppe, (1) the inter-annual fluctuation and the intra-annual distribution of precipitation have a direct impact on ANPP; (2) the annual vector precipitation showed an extremely significant regression relationship with ANPP; and (3) monthly precipitation fluctuations (May–August) possess the accumulative effect on ANPP during the growing period in desert steppe, while precipitation accumulation from June to August shows the most significant impact.
Although the mathematic expression of precipitation was mentioned a lot in this study, the analysis method was slightly old compared with the latest studies, especially the new methods in machine learning and neural networks [35,36,37,38,39,40], which should be strengthened in follow-up studies. The mechanism of ANPP response to precipitation fluctuation should be revealed more clearly in further studies.

Acknowledgments

The authors would like to thank all the members of Urat Desert-grassland Research Station, China Academy of Sciences (CAS), for their help in field work. This research is funded by Integrative research in key techniques for sustainable restoration of Sandy Land Ecosystems (2011BAC07B02), Research in techniques for risk assessment and prediction of Sandy Land Ecosystem (Y439K71001). Mechanism of landscape process response of precipitation fluctuation on Kerqin Sandy Land (41271193).

Author Contributions

Liangxu Liu performed the experiments, analyzed most of the data and wrote the paper; Xueyong Zhao conceived and designed the experiments; Xueli Chang complemented the experiment and contributed analysis tools; Jie Lian help Liangxu Liu analyzed part of the data.

Conflicts of Interest

The authors declare no conflict of interest. The founding sponsors had no role in the design of the study; in the collection, analyses, or interpretation of data; in the writing of the manuscript, and in the decision to publish the results.

References

  1. Scheuring, I.; Riedi, R.H. Application of multifractals to the analysis of vegetation pattern. J. Veg. Sci. 1994, 5, 489–496. [Google Scholar] [CrossRef]
  2. Baird, A.J.; Wilby, R.L. Eco-Hydrology: Plants and Water in Terrestrial and Aquatic Environments; Psychology Press: London, UK, 1999. [Google Scholar]
  3. Rodriguez-Iturbe, I. Ecohydrology: A hydrologic perspective of climate-soil-vegetation dynamies. Water Resour Res. 2000, 36, 3–9. [Google Scholar] [CrossRef]
  4. Ehleringer, J.R.; Phillips, S.L.; Schuster, W.S.; Sandquist, D.R. Differential utilization of summer rains by desert plants. Oecologia 1991, 88, 430–434. [Google Scholar] [CrossRef]
  5. Noy-Meir, I. Desert ecosystems: Environment and producers. Annu. Rev. Ecol. Evol. Syst. 1973, 4, 25–51. [Google Scholar] [CrossRef]
  6. Reynolds, J.F.; Kemp, P.R.; Ogle, K.; Fernández, R.J. Modifying the ‘pulse–reserve’ paradigm for deserts of North America: Precipitation pulses, soil water, and plant responses. Oecologia 2004, 141, 194–210. [Google Scholar] [CrossRef] [PubMed]
  7. Sala, O.; Lauenroth, W. Small rainfall events: An ecological role in semiarid regions. Oecologia 1982, 53, 301–304. [Google Scholar] [CrossRef]
  8. Knapp, A.K.; Fay, P.A.; Blair, J.M.; Collins, S.L.; Smith, M.D.; Carlisle, J.D.; Harper, C.W.; Danner, B.T.; Lett, M.S.; McCarron, J.K. Rainfall variability, carbon cycling, and plant species diversity in a mesic grassland. Science 2002, 298, 2202–2205. [Google Scholar] [CrossRef] [PubMed]
  9. Ludwig, J.A.; Wilcox, B.P.; Breshears, D.D.; Tongway, D.J.; Imeson, A.C. Vegetation patches and runoff–erosion as interacting ecohydrological processes in semiarid landscapes. Ecology 2005, 86, 288–297. [Google Scholar] [CrossRef]
  10. Snyder, K.; Tartowski, S. Multi-scale temporal variation in water availability: Implications for vegetation dynamics in arid and semi-arid ecosystems. J. Arid Environ. 2006, 65, 219–234. [Google Scholar] [CrossRef]
  11. Knapp, A.K.; Briggs, J.M.; Collins, S.L.; Archer, S.R.; Bret-Harte, M.S.; Ewers, B.E.; Peters, D.P.; Young, D.R.; Shaver, G.R.; Pendall, E. Shrub encroachment in North American grasslands: Shifts in growth form dominance rapidly alters control of ecosystem carbon inputs. Glob. Chang. Biol. 2008, 14, 615–623. [Google Scholar] [CrossRef]
  12. Breshears, D.D.; Rich, P.M.; Barnes, F.J.; Campbell, K. Overstory-imposed heterogeneity in solar radiation and soil moisture in a semiarid woodland. Ecol. Appl. 1997, 7, 1201–1215. [Google Scholar] [CrossRef]
  13. Le Houerou, H.; Bingham, R.; Skerbek, W. Relationship between the variability of primary production and the variability of annual precipitation in world arid lands. J. Arid Environ. 1988, 15, 1–18. [Google Scholar]
  14. Loik, M.E.; Breshears, D.D.; Lauenroth, W.K.; Belnap, J. A multi-scale perspective of water pulses in dryland ecosystems: Climatology and ecohydrology of the western USA. Oecologia 2004, 141, 269–281. [Google Scholar] [CrossRef] [PubMed]
  15. Yang, L.; Wylie, B.K.; Tieszen, L.L.; Reed, B.C. An analysis of relationships among climate forcing and time-integrated NDVI of grasslands over the US northern and central Great Plains. Remote Sens. Environ. 1998, 65, 25–37. [Google Scholar] [CrossRef]
  16. Wang, J.; Rich, P.; Price, K. Temporal responses of NDVI to precipitation and temperature in the central Great Plains, USA. Int. J. Remote Sens. 2003, 24, 2345–2364. [Google Scholar] [CrossRef]
  17. Du Plessis, W. Linear regression relationships between NDVI, vegetation and rainfall in Etosha National Park, Namibia. J. Arid Environ. 1999, 42, 235–260. [Google Scholar] [CrossRef]
  18. Hielkema, J.; Prince, S.; Astle, W. Rainfall and vegetation monitoring in the savanna zone of the Democratic Republic of Sudan using the NOAA Advanced Very High Resolution Radiometer. Int. J. Remote Sens. 1986, 7, 1499–1513. [Google Scholar] [CrossRef]
  19. Everitt, J.; Hussey, M.; Escobar, D.; Nixon, P.; Pinkerton, B. Assessment of grassland phytomass with airborne video imagery. Remote Sens. Environ. 1986, 20, 299–306. [Google Scholar] [CrossRef]
  20. Tucker, C.J. Red and photographic infrared linear combinations for monitoring vegetation. Remote Sens. Environ. 1979, 8, 127–150. [Google Scholar] [CrossRef]
  21. Markham, C.G. Seasonality of precipitation in the United States. Ann. Assoc. Am. Geogr. 1970, 60, 593–597. [Google Scholar] [CrossRef]
  22. Numata, I.; Roberts, D.A.; Chadwick, O.A.; Schimel, J.P.; Galvão, L.S.; Soares, J.V. Evaluation of hyperspectral data for pasture estimate in the Brazilian Amazon using field and imaging spectrometers. Remote Sens. Environ. 2008, 112, 1569–1583. [Google Scholar] [CrossRef]
  23. Fava, F.; Colombo, R.; Bocchi, S.; Meroni, M.; Sitzia, M.; Fois, N.; Zucca, C. Identification of hyperspectral vegetation indices for Mediterranean pasture characterization. Int. J. Appl. Earth Obs. 2009, 11, 233–243. [Google Scholar] [CrossRef]
  24. Alexandrov, G.; Oikawa, T.; Yamagata, Y. The scheme for globalization of a process-based model explaining gradations in terrestrial NPP and its application. Ecol. Model 2002, 148, 293–306. [Google Scholar] [CrossRef]
  25. Turner, D.P.; Ritts, W.D.; Cohen, W.B.; Gower, S.T.; Running, S.W.; Zhao, M.; Costa, M.H.; Kirschbaum, A.A.; Ham, J.M.; Saleska, S.R. Evaluation of MODIS NPP and GPP products across multiple biomes. Remote Sens. Environ. 2006, 102, 282–292. [Google Scholar] [CrossRef]
  26. Gao, J.-X.; Chen, Y.-M.; Lü, S.-H.; Feng, C.-Y.; Chang, X.-L.; Ye, S.-X.; Liu, J.-D. A ground spectral model for estimating biomass at the peak of the growing season in Hulunbeier grassland, Inner Mongolia, China. Int. J. Remote Sens. 2012, 33, 4029–4043. [Google Scholar] [CrossRef]
  27. Qin, N.; Xu, J.; Ji, M.; Cao, L.; Yang, Y.; Hong, Y. The Vegetation Coverage Dynamic Coupling with Climatic Factors in Northeast China Transect. Environ. Manag. 2012, 50, 405–417. [Google Scholar]
  28. Schwinning, S.; Starr, B.I.; Ehleringer, J.R. Dominant cold desert plants do not partition warm season precipitation by event size. Oecologia 2003, 136, 252–260. [Google Scholar] [CrossRef] [PubMed]
  29. Cleveland, C.C.; Townsend, A.R.; Taylor, P.; Alvarez-Clare, S.; Bustamante, M.M.; Chuyong, G.; Dobrowski, S.Z.; Grierson, P.; Harms, K.E.; Houlton, B.Z.; et al. Relationships among net primary productivity, nutrients and climate in tropical rain forest: A pan-tropical analysis. Ecol. Lett. 2011, 14, 939–947. [Google Scholar] [CrossRef] [PubMed]
  30. Zhang, M.; Xi, C.; Liang, A.; Liu, M.; Liu, Y. Climate changes in Horqin Sandy Land in recent 60 years. J. Arid Land Resour. Environ. 2012, 26, 8–16. [Google Scholar]
  31. Guo, R.; Wang, X.-K.; Ouyang, Z.-Y.; Li, Y.-N. Spatial and temporal relationships between precipitation and ANPP of four types of grasslands in northern China. J. Integr. Environ. Sci. 2006, 18, 1024–1030. [Google Scholar] [CrossRef]
  32. Ladwig, L.M.; Collins, S.L.; Swann, A.L.; Xia, Y.; Allen, M.F.; Allen, E.B. Above- and belowground responses to nitrogen addition in a Chihuahuan Desert grassland. Oecologia 2012, 169, 177–185. [Google Scholar] [CrossRef] [PubMed]
  33. Michaletz, S.T.; Cheng, D.; Kerkhoff, A.J.; Enquist, B.J. Convergence of terrestrial plant production across global climate gradients. Nature 2014, 512, 39–43. [Google Scholar] [CrossRef] [PubMed]
  34. Moxi, Y.; Ling, Z.; Wenai, L.; Jihong, Z. Analyzing dynamic vegetation change and response to climatic factors in Hubei Province, China. Acta Ecol. Sin. 2016, 36, 5315–5323. [Google Scholar]
  35. Wang, W.; Xu, D.; Chau, K.; Lei, G.-J. Assessment of river water quality based on theory of variable fuzzy sets and fuzzy binary comparison method. Water Resour. Manag. 2014, 28, 4183–4200. [Google Scholar] [CrossRef]
  36. Wu, C.L.; Chau, K.W.; Li, Y.S. Methods to improve neural network performance in daily flows prediction. J. Hydrol. 2009, 372, 80–93. [Google Scholar] [CrossRef]
  37. Muttil, N.; Chau, K.W. Machine-learning paradigms for selecting ecologically significant input variables. Eng. Appl. Artif. Intell. 2007, 20, 735–744. [Google Scholar] [CrossRef] [Green Version]
  38. Zhao, M.Y.; Cheng, C.T.; Chau, K.W.; Li, G. Multiple criteria data envelopment analysis for full ranking units associated to environment impact assessment. Int. J. Environ. Pollut. 2006, 28, 448–464. [Google Scholar] [CrossRef]
  39. Xie, J.X.; Cheng, C.T.; Chau, K.W.; Pei, Y.-Z. A hybrid adaptive time-delay neural network model for multi-step-ahead prediction of sunspot activity. Int. J. Environ. Pollut. 2006, 28, 364–381. [Google Scholar] [CrossRef]
  40. Chau, K.W.; Wu, C.L. A hybrid model coupled with singular spectrum analysis for daily rainfall prediction. J. Hydroinform. 2010, 12, 458–473. [Google Scholar] [CrossRef]
Figure 1. Location of the studied area.
Sustainability 08 01245 g001
Figure 2. Vegetation reflectance spectrum-ANPP model of the desert steppe.
Sustainability 08 01245 g002
Figure 3. The ANPP distribution patterns in different years.
Sustainability 08 01245 g003aSustainability 08 01245 g003bSustainability 08 01245 g003c
Figure 4. Precipitation fluctuation characteristics ((a) meteorological annual precipitation; (b) real annual precipitation; (c) concentration ratio; and (d) concentration period).
Sustainability 08 01245 g004
Figure 5. The relation between annual precipitation and the ANPP of the desert steppe ((a) meteorological annual precipitation; and (b) real annual precipitation).
Sustainability 08 01245 g005
Figure 6. The relation between precipitation patterns in a year and the ANPP ((a) annual vector precipitation; (b) concentration ratio; and (c) concentration period).
Sustainability 08 01245 g006
Figure 7. The relation between precipitation accumulation and the ANPP ((a) precipitation from May to August; (b) precipitation from June to August; (c) precipitation from July to August; (d) precipitation in August).
Sustainability 08 01245 g007

