
Technology Clusters Exploration for Patent Portfolio through Patent Abstract Analysis

Abstract
:1. Introduction
2. Literature Review
2.1. Patent Research and Analysis
2.2. Strategy of the Exploring Technology Clusters
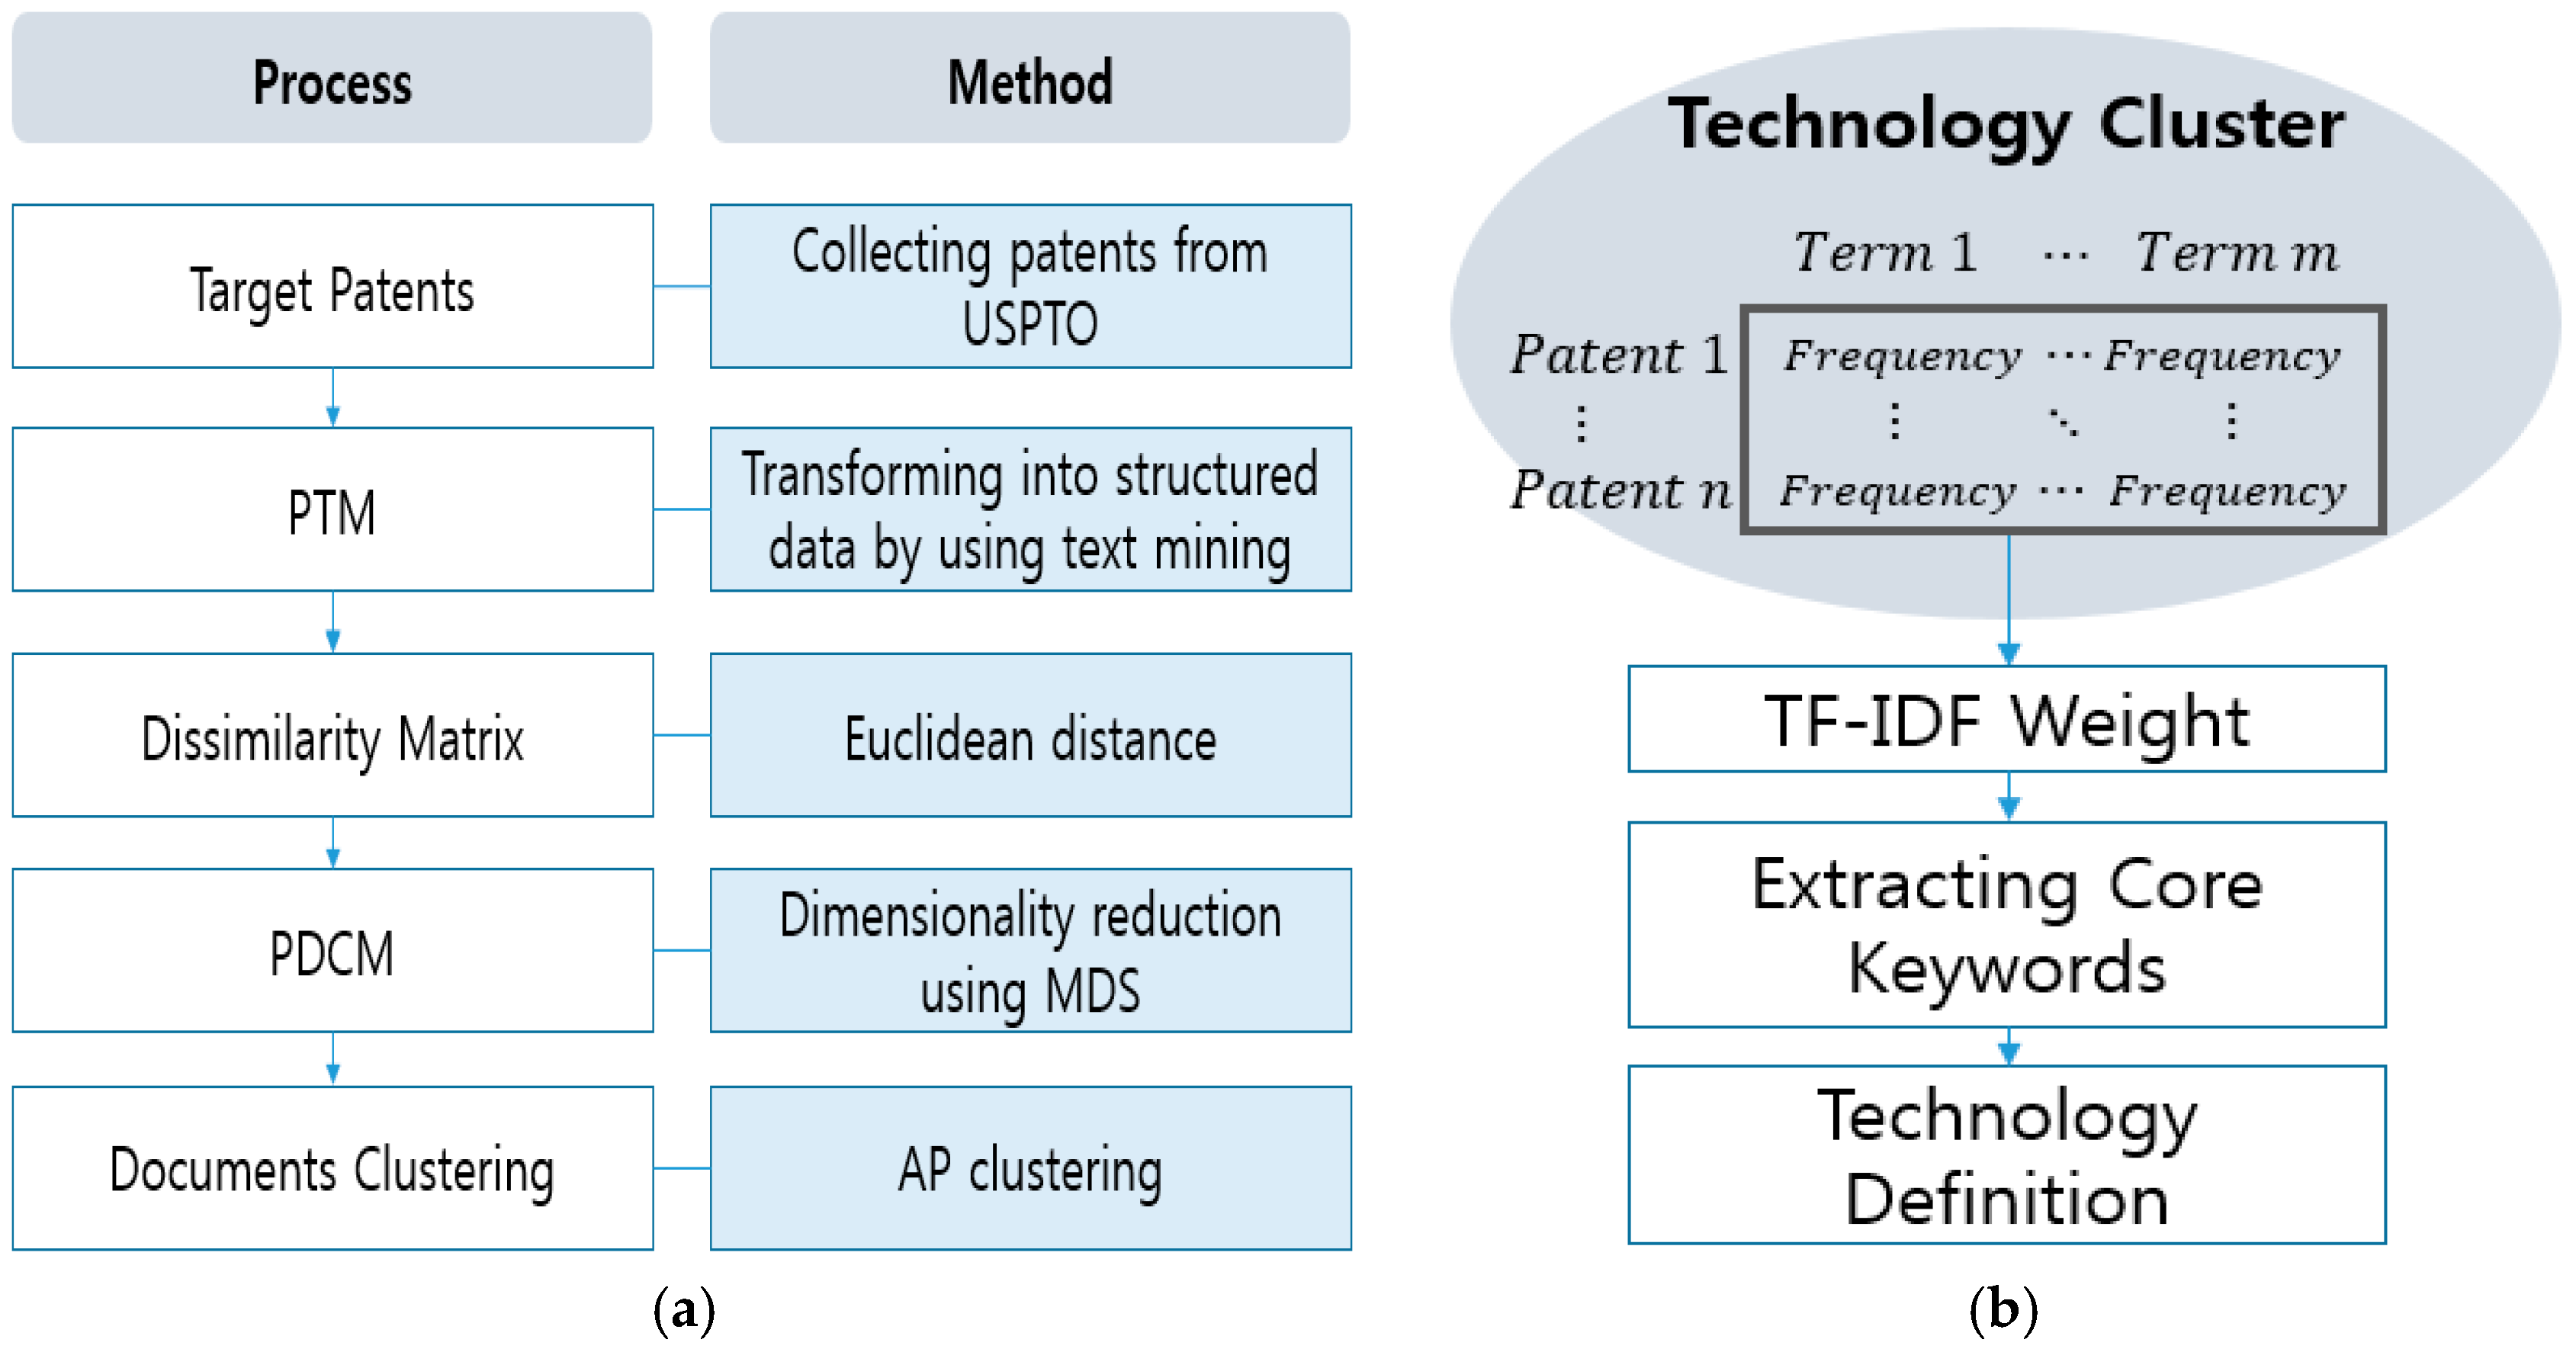
3. Methodology
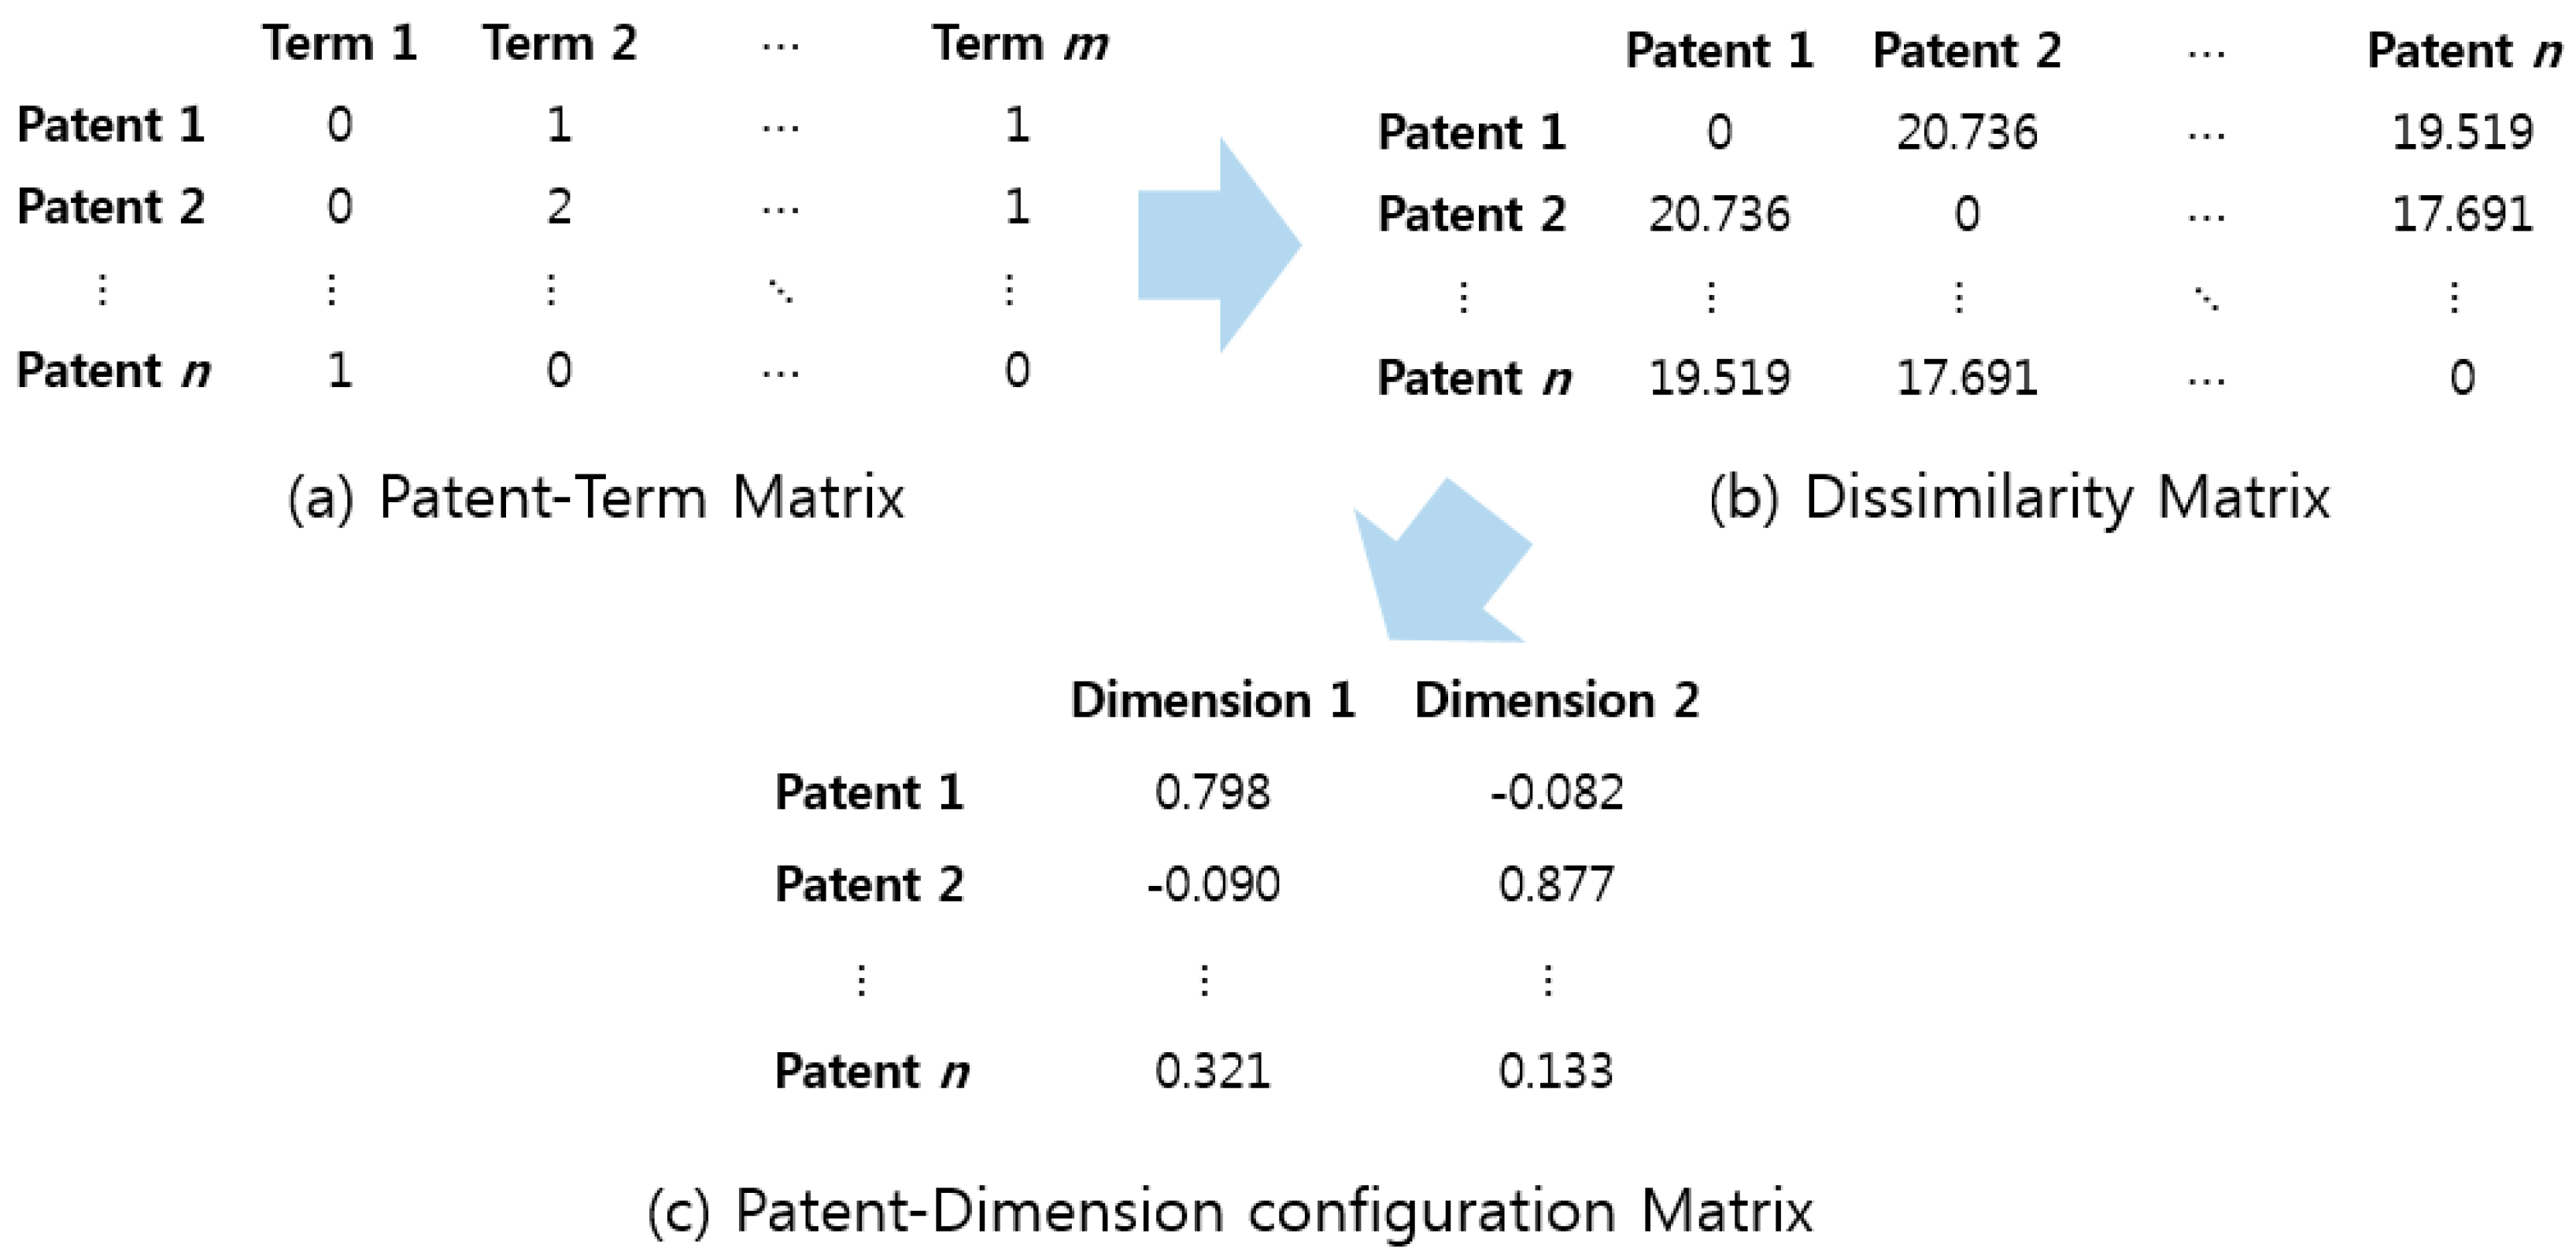
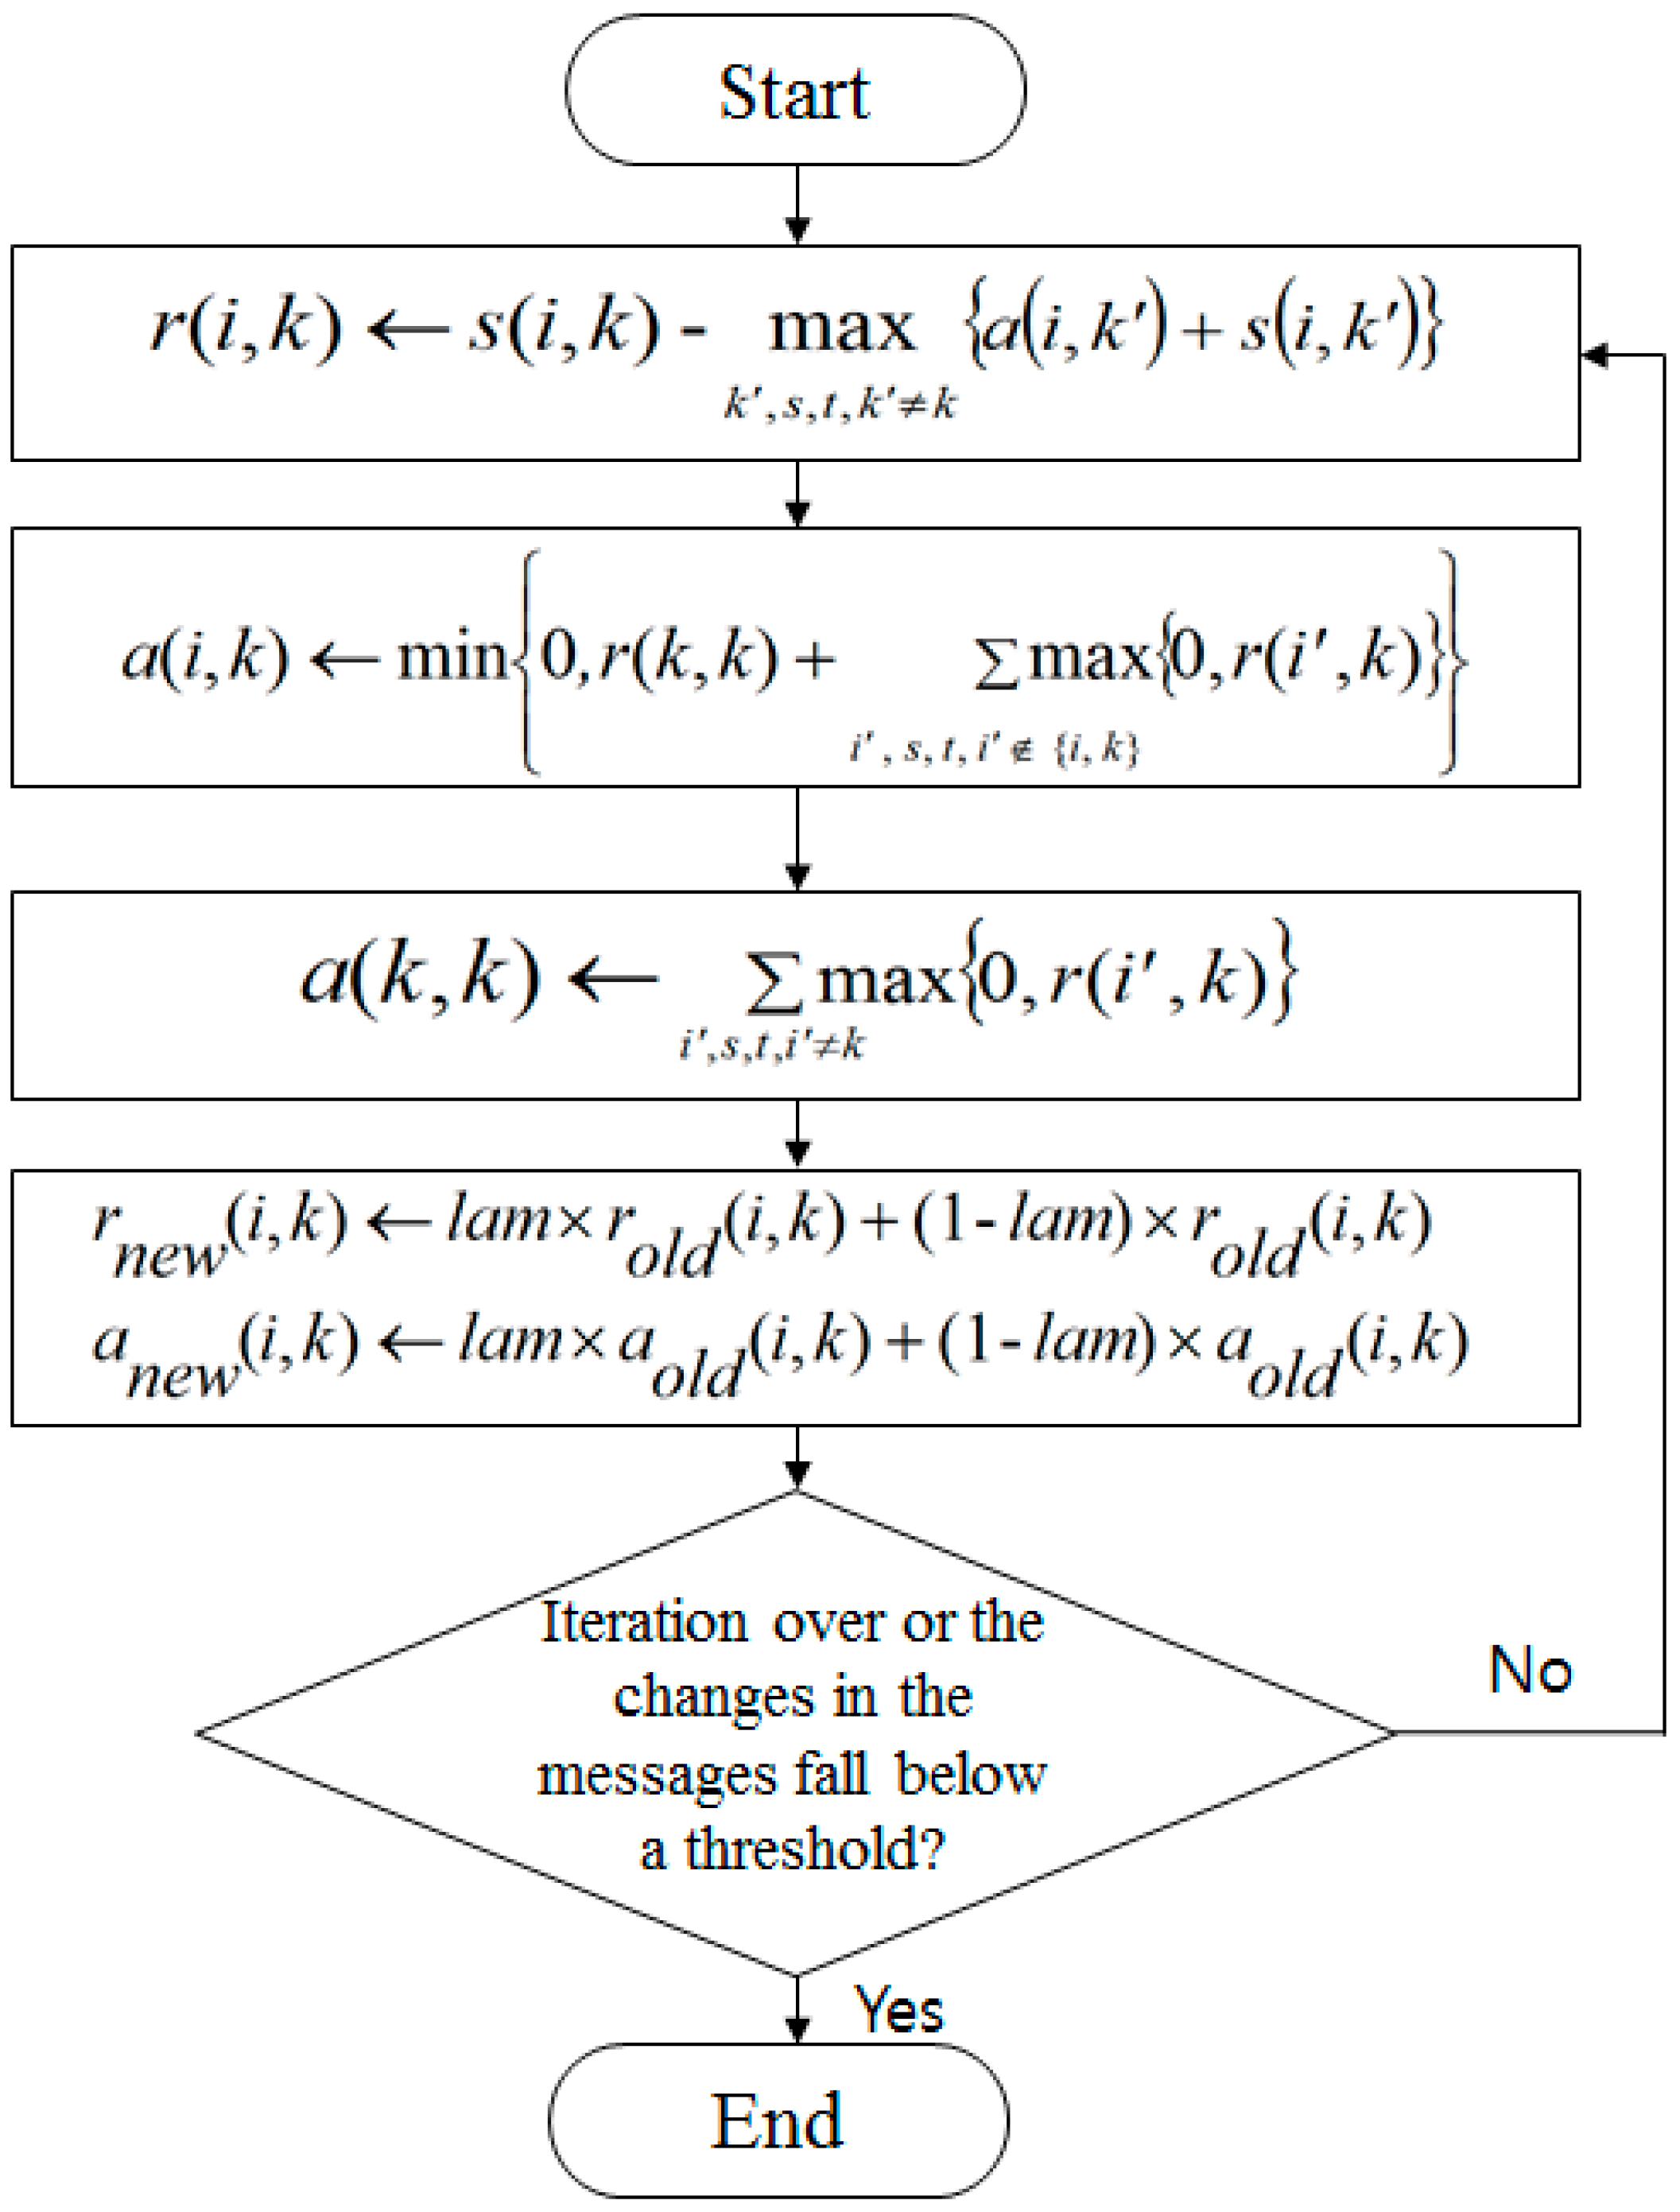
3.1. Formation of Technology Clusters
3.2. Definition of Technology Clusters
4. Case Study: Korean Electronic Car Fields
5. Conclusions
Acknowledgments
Author Contributions
Conflicts of Interest
References
- Dickinson, M.W.; Thornton, A.C.; Graves, S. Technology portfolio management: Optimizing interdependent projects over multiple time periods. IEEE Trans. Eng. Mang. 2001, 48, 518–527. [Google Scholar] [CrossRef]
- Dalkey, N.; Helmer, O. An experimental application of the Delphi method to the use of experts. Mang. Sci. 1963, 9, 458–467. [Google Scholar] [CrossRef]
- Silberglitt, R.; Anton, P.S.; Howell, D.R.; Wong, A. The Global Technology Revolution 2020, In-Depth Analyses; RAND Corporation: Santa Monica, CA, USA, 2006. [Google Scholar]
- Son, C.; Suh, Y.; Jeon, J.; Park, Y. Development of a GTM-based patent map for identifying patent vacuums. Expert Syst. Appl. 2012, 39, 2489–2500. [Google Scholar] [CrossRef]
- The United States Patent and Trademark Office. Available online: http://www.uspto.gov (accessed on 16 December 2013).
- Abbas, A.; Zhang, L.; Khan, S.U. A literature review on the state-of-the-art in patent analysis. World Pat. Inf. 2014, 1, 1–11. [Google Scholar] [CrossRef]
- Ejermo, O. Regional innovation measured by patent data-Does quality matter? Ind. Innov. 2009, 16, 141–165. [Google Scholar] [CrossRef]
- Chen, Y.; Chang, K.C. The relationship between a firm’s patent quality and its market value: The case of US pharmaceutical industry. Technol. Forecast Soc. 2010, 77, 20–33. [Google Scholar] [CrossRef]
- Hall, B.H.; Jaffe, A.B.; Trajtenberg, M. Market value and patent citations. Rand. J. Econ. 2005, 36, 16–38. [Google Scholar]
- Ernst, H. Patent information for strategic technology management. World Pat. Inf. 2003, 25, 233–242. [Google Scholar] [CrossRef]
- Jun, S.; Park, S.S. Examining technological innovation of Apple using patent analysis. Ind. Manag. Data Syst. 2013, 113, 890–907. [Google Scholar] [CrossRef]
- Lee, S.; Yoon, B.; Park, Y. An approach to discovering new technology opportunities: Keyword-based patent map approach. Technovation 2009, 29, 481–497. [Google Scholar] [CrossRef]
- Kim, Y.G.; Suh, J.H.; Park, S.C. Visualization of patent analysis for emerging technology. Expert Syst. Appl. 2008, 34, 1804–1812. [Google Scholar] [CrossRef]
- Jun, S.; Park, S.S.; Jang, D.S. Patent management for technology forecasting: A case study of the bio-industry. J. Intellect. Prop. Rig. 2012, 17, 539–546. [Google Scholar]
- Jun, S.; Park, S.S.; Jang, D.S. Technology forecasting using matrix map and patent clustering. Ind. Manag. Data Syst. 2012, 112, 786–807. [Google Scholar] [CrossRef]
- Choi, S.; Jun, S. Vacant technology forecasting using new Bayesian patent clustering. Technol. Anal. Strateg. 2013, 26, 241–251. [Google Scholar] [CrossRef]
- Toledo-Alvarado, J.I.; Guzmán-Arenas, A.; Martínez-Luna, G.L. Automatic Building of an Ontology from a Corpus of Text Documents Using Data Mining Tools. J. Appl. Res. Technol. 2012, 10, 398–404. [Google Scholar]
- Cox, T.; Cox, M. Multidimensional Scaling, 2nd ed.; Chapman Hall: Boca Raton, FL, USA, 2001. [Google Scholar]
- Yoon, B. Strategic visualization tools for managing technological information. Technol. Anal. Strateg. 2010, 22, 377–397. [Google Scholar] [CrossRef]
- Frey, B.J.; Dueck, D. Clustering by Passing Messages between Data Points. Science 2007, 315, 972–976. [Google Scholar] [CrossRef] [PubMed]
- Salton, G.; Buckley, C. Term-weighting approaches in automatic text retrieval. Inform. Process. Manag. 1998, 24, 513–523. [Google Scholar] [CrossRef]
- Virtanen, A.; Lee, Y.M. Electric Vehicles South Korea, Finpro, Seoul. Available online: http://www.finpro.fi/documents/10304/9b52fef5-e0d1-4938-8ec8-961ea6c87491 (accessed on 2 April 2014).
- Anderman, M. Assessing the Future of Hybrid and Electric Vehicles: The xEV Industry Insider Report Based on Private Onsite Interviews with Leading Technologists and Executives. Advanced Automotive Batteries. Available online: http://www.yano.co.jp/pdf/announce/Executive_Summary_Selections.pdf (accessed on 10 October 2016).
- Chandy, R.; Hopstaken, B.; Narasimhan, O.; Prabhu, J. From invention to innovation: Conversion ability in product development. J. Mark. Res. 2006, 43, 494–508. [Google Scholar] [CrossRef]


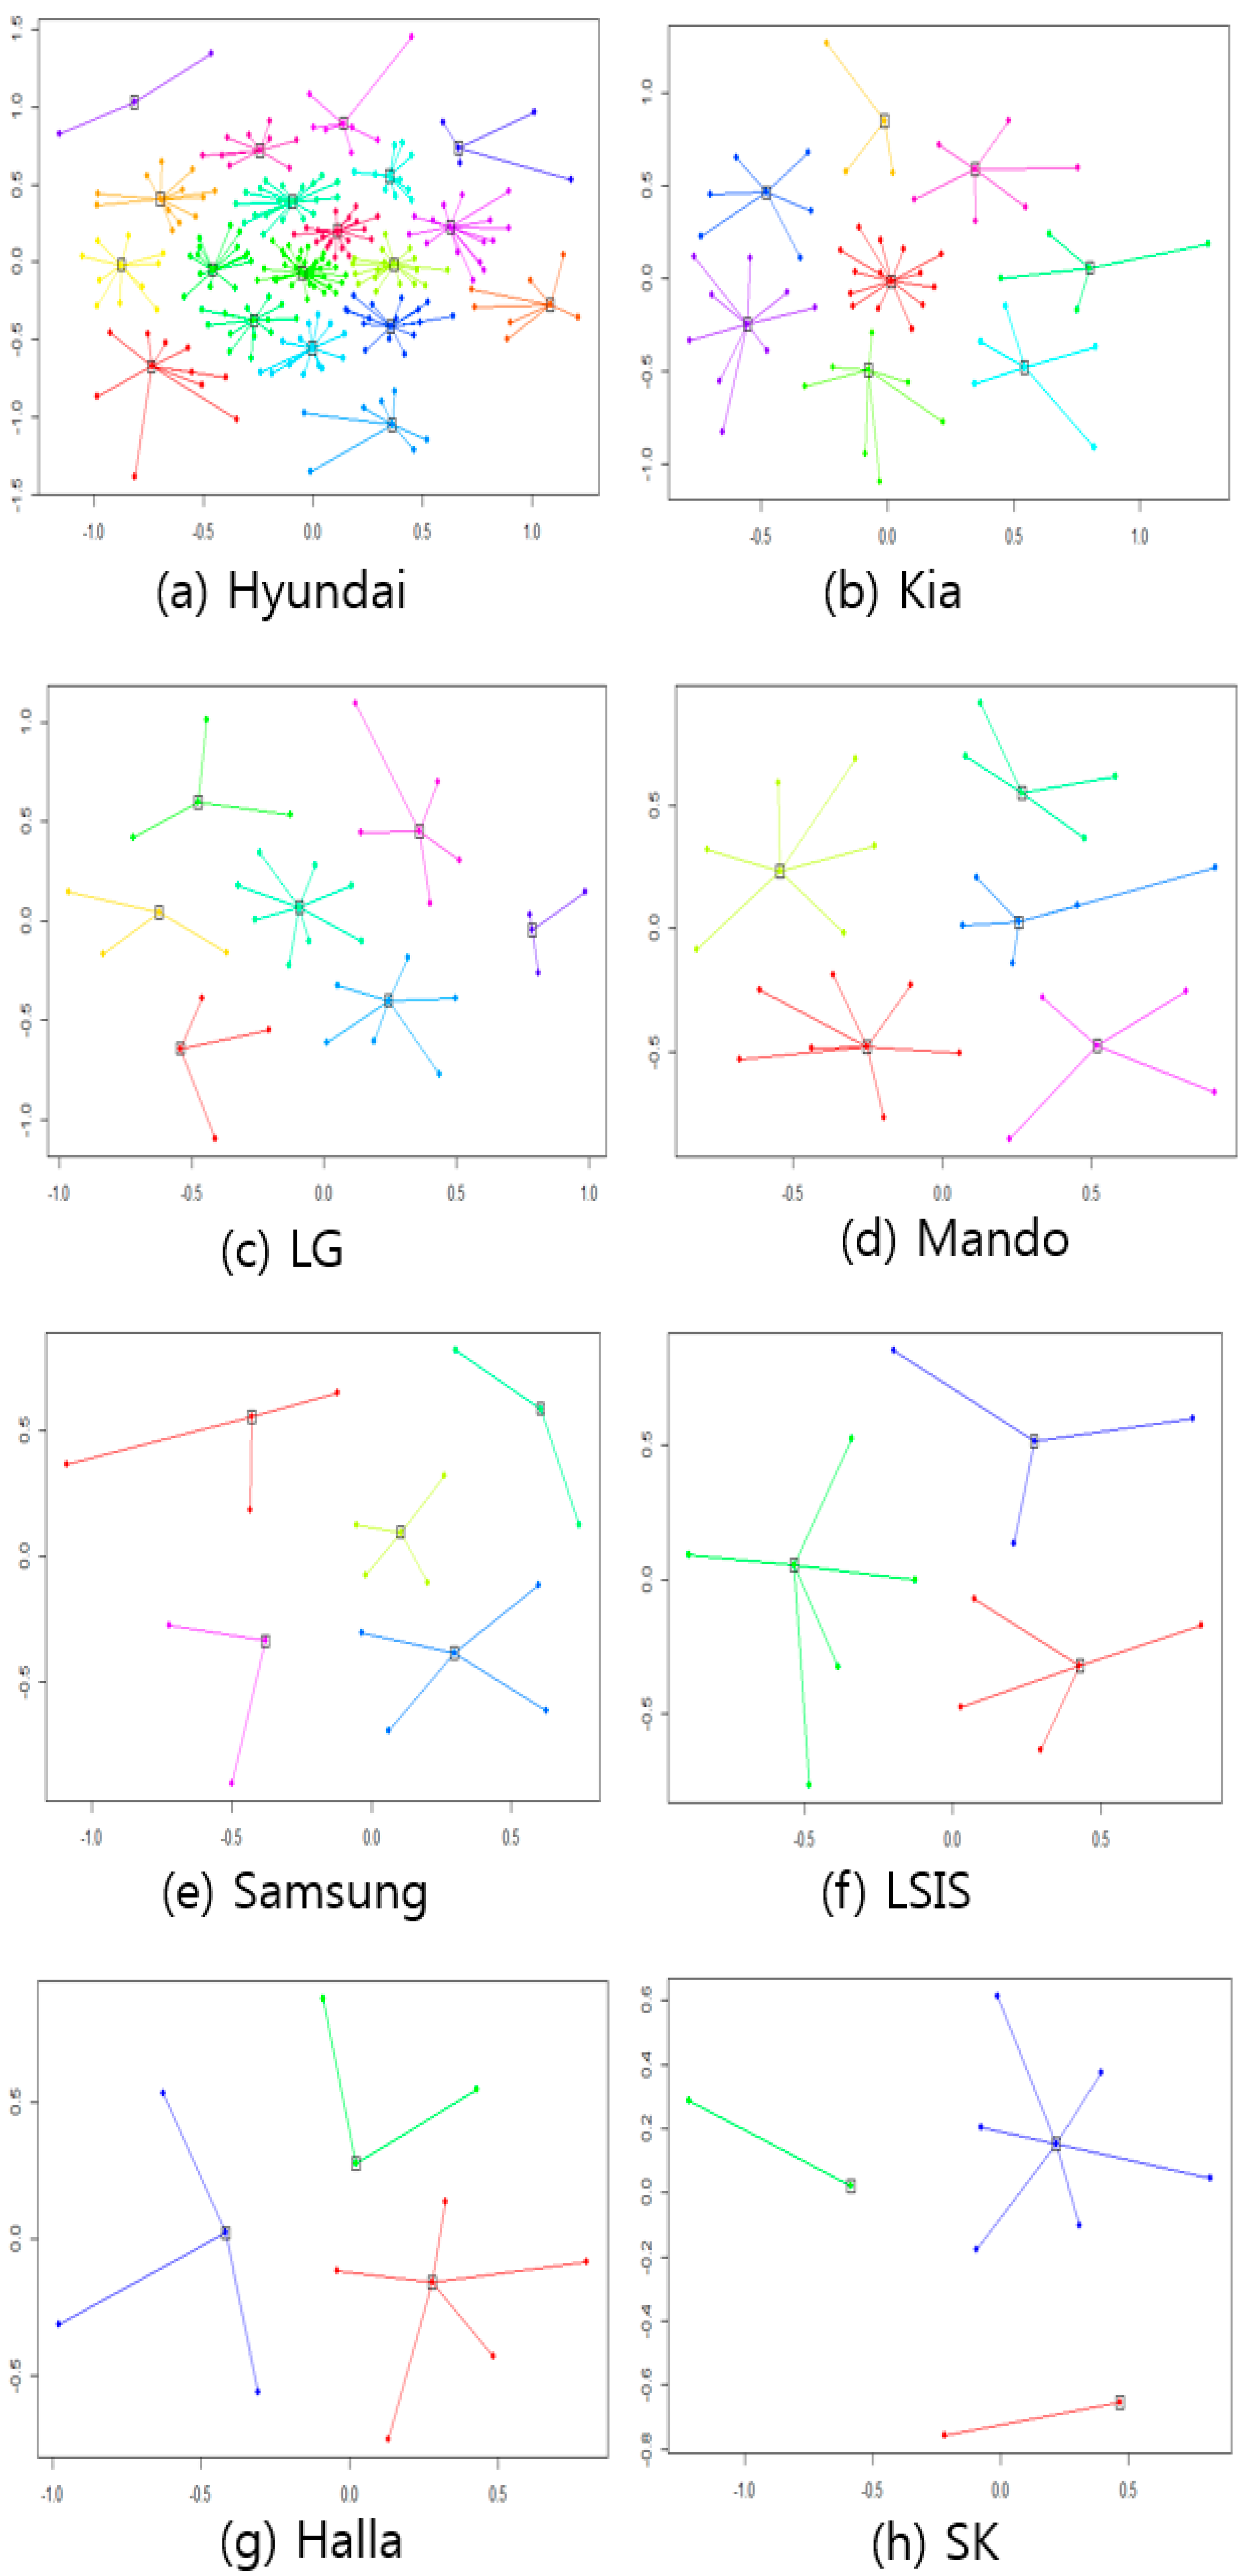
| Company | # of Clusters | Quantity | Net Similarity | Input Preference | # of Iterations |
|---|---|---|---|---|---|
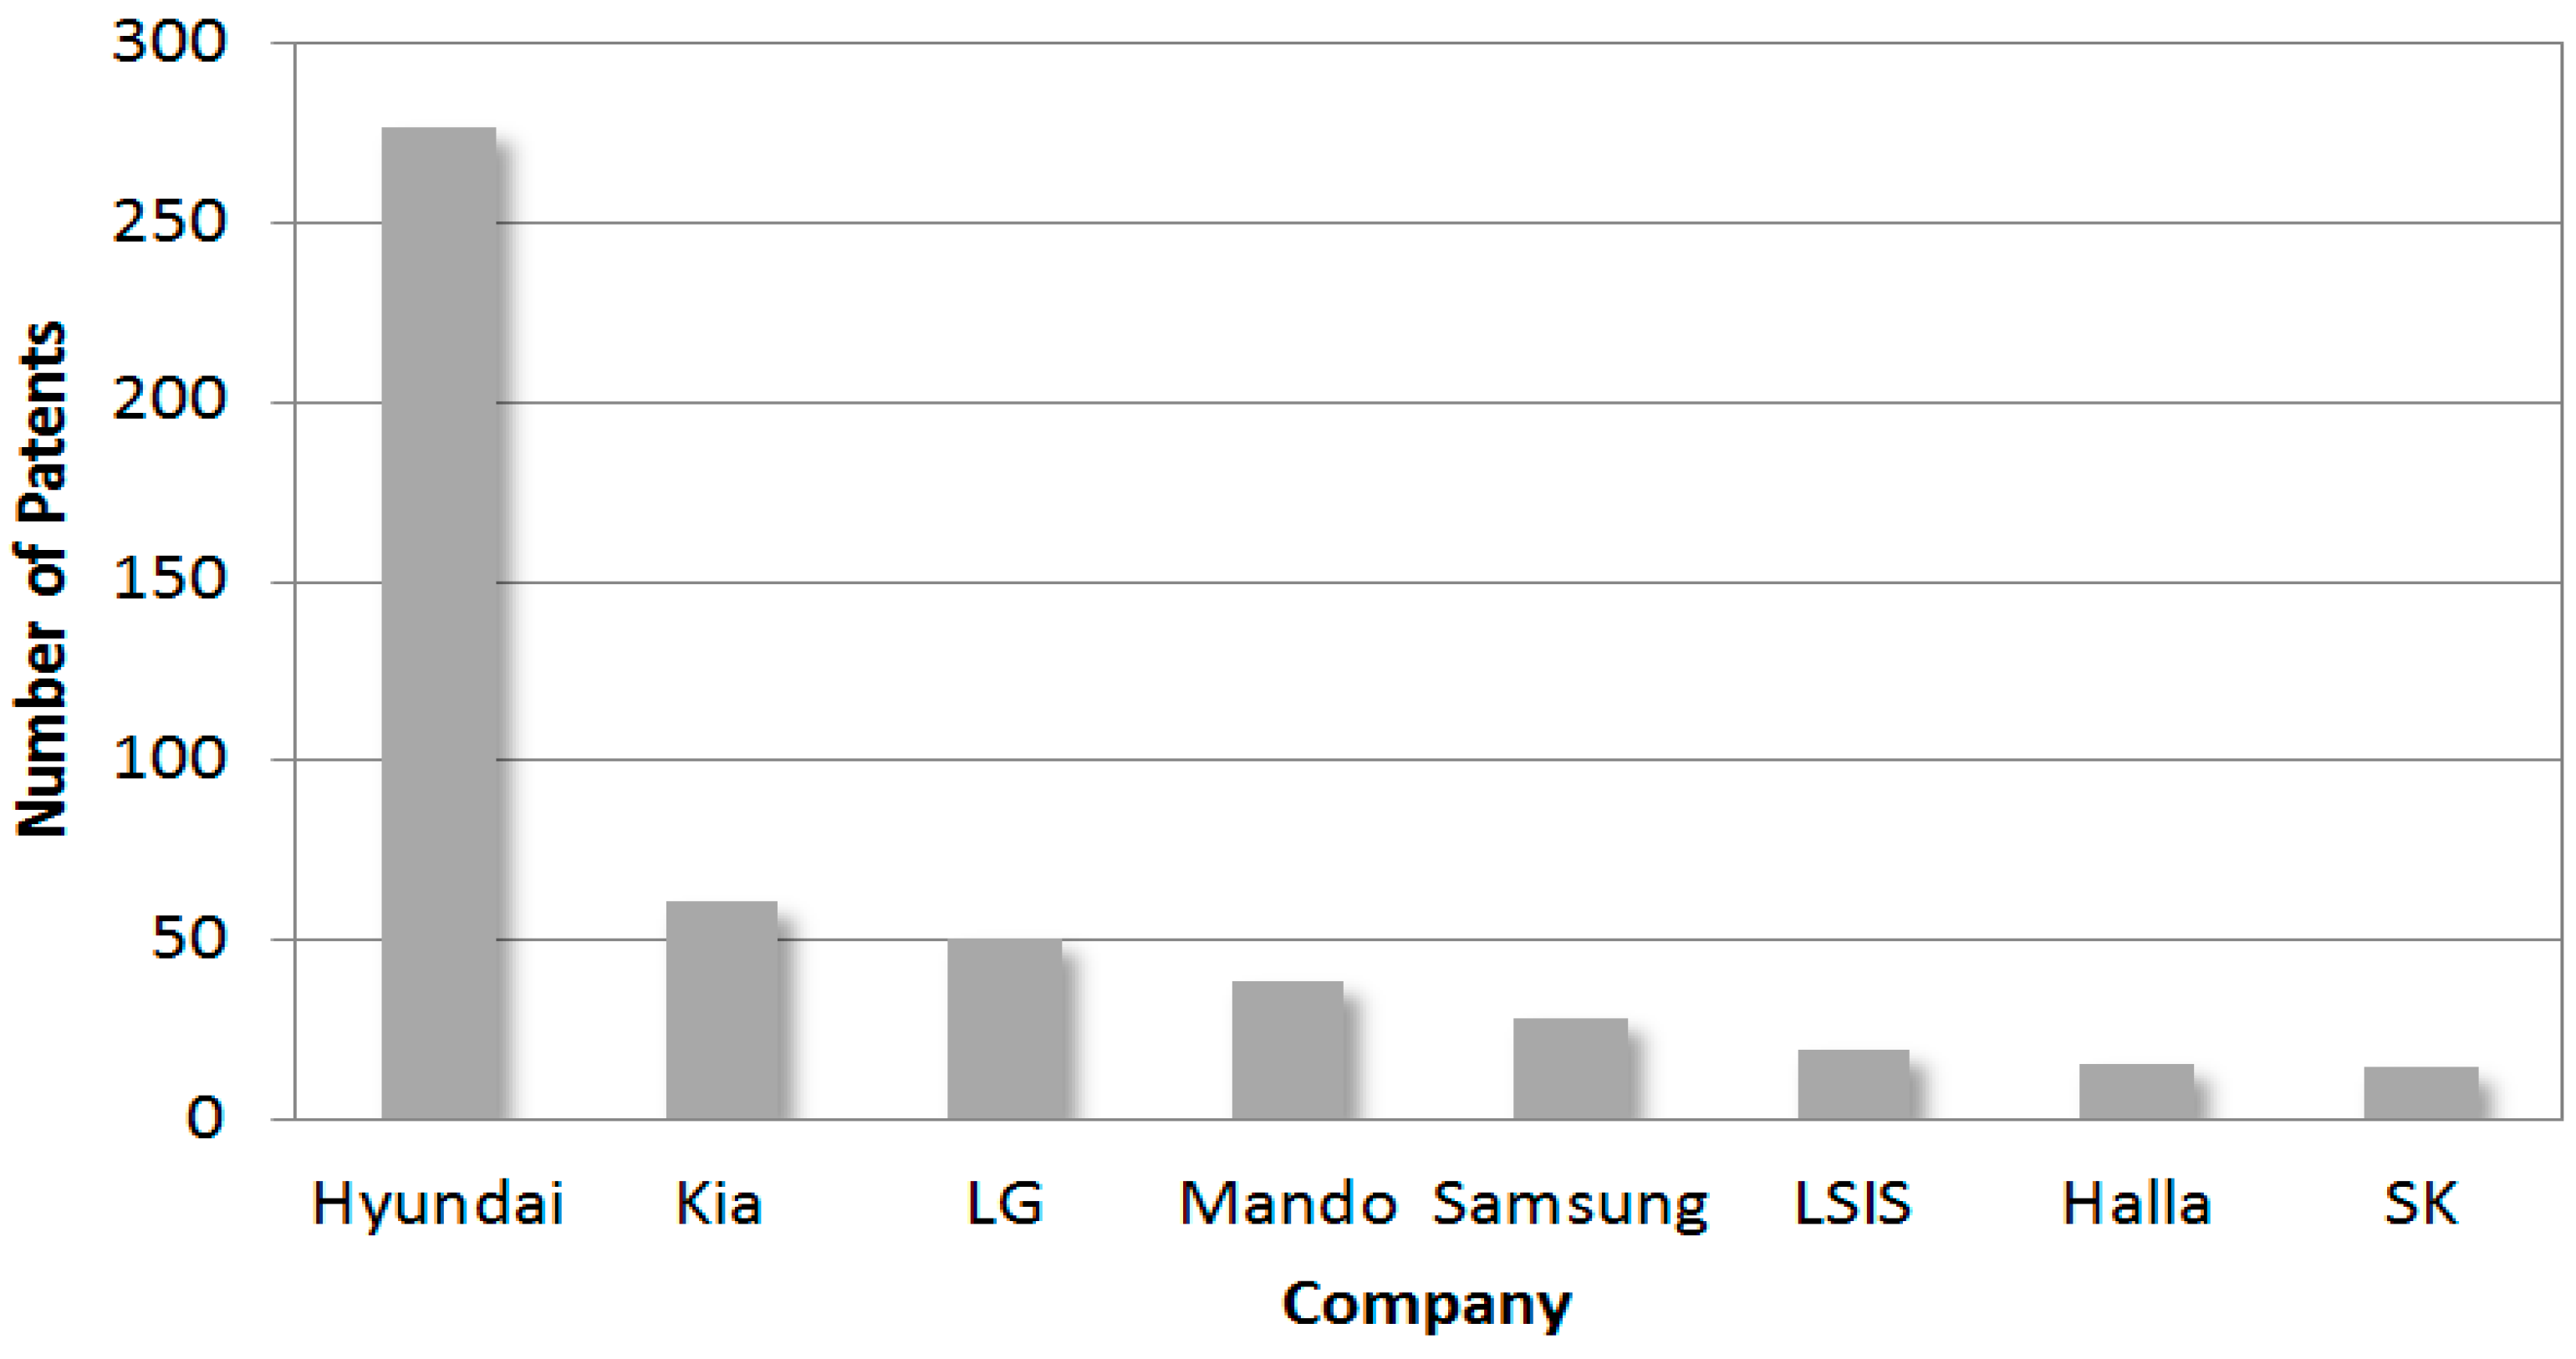
| Hyundai | 19 | 273 | −22.29912 | −0.607961 | 236 |
| Kia | 8 | 62 | −10.03241 | −0.635032 | 189 |
| LG | 7 | 38 | −7.79691 | −0.684630 | 139 |
| Mando | 5 | 31 | −6.66761 | −0.7047505 | 142 |
| Samsung | 5 | 20 | −5.510847 | −0.636161 | 133 |
| LSIS | 3 | 15 | −5.002043 | −0.710844 | 123 |
| Halla | 3 | 13 | −4.8123 | −0.727681 | 150 |
| SK | 3 | 11 | −4.061987 | −0.6754607 | 237 |
| Cluster | Quantity | Core Keywords | Defined Technology |
|---|---|---|---|
| 1 | 11 | three, phase, cam, haptic, set, multifunction, wire, conductive, steering, line | conductive charging |
| 2 | 8 | water, duct, pump, greater, pack, failure, dust, filter, subsequent, motor | water pump control |
| 3 | 13 | measure, PTC (positive temperature coefficient), magnet, limit, maximum, sensor, deceleration, mirror, heat, wheel | PTC |
| 4 | 11 | charge, hydraulic, line, power, tinting, pressure, measure, clutch, base, arm | hydraulic braking |
| 5 | 18 | plasma, grip, part, DTE (distance to empty), ion, noxious, protector, amplifier, coat, differential | plasma reactor for reducing noxious gas |
| 6 | 38 | sun, actuator, conductor, filler, open, slide, terminal, multiple, active, front | multi-zone air conditioning |
| 7 | 19 | heat, oil, temperature, wheel, steer, axle, leg, fashion, stop, speed | protecting a steering system from overheat |
| 8 | 15 | rotor, hydraulic, radiator, cart, wheel, rotary, steer, glass, pressure, drivetrain | cooling system |
| 9 | 20 | virtual, steer, convert, sound, sensor, SOC (state of charge), kick, manipulate, calculate, collect | virtual driving system |
| 10 | 11 | capacitor, link, delay, central, charge, force, pressure, left, right, economic | passive component (capacitor) |
| 11 | 16 | potential, torque, oil, temperature, data, part, type, detect, shaft, change | temperature detecting system |
| 12 | 10 | insert, rotary, aperture, dispose, configure, unit, synchronizer, device, least, provide | synchronize device |
| 13 | 20 | cup, arm, pedal, condenser, occupant, block, window, plate, property, support | vehicle interface devices |
| 14 | 5 | air, compress, force, brake, signal, driven, wheel, pressure, driver, torque | electric compressor (for cooling) |
| 15 | 3 | air, oil, pump, hydraulic, speed, heat, fluid, solenoid, motor, reference | heat pump (for heating) |
| 16 | 17 | high-voltage, recharge, low-voltage, derate, final, regenerative, switch, outlet, consist, remove | regenerative braking |
| 17 | 8 | oil, wiper, pump, available, tire, energy, shift, heat, accumulate, DTE | DTE estimation |
| 18 | 10 | high-voltage, limit, vibrate, oil, signal, bidirectional, grid, smart, unit, brake | smart grid |
| 19 | 20 | regenerator, sensor, coolant, air-condition, remote, house, determine, flow, electron, interior | air conditioning |
| Cluster | Quantity | Core Keywords | Defined Technology |
|---|---|---|---|
| 1 | 15 | creep, eco-route, current, door, slide, distance, empty, gradient, driver, manual | eco-routing navigation |
| 2 | 4 | hot, device, heat, configure, fuel, apparatus, first, hybrid, second, separate | heating system for a fuel cell vehicle |
| 3 | 8 | burn, lean, stall, end, apply, drive, energy, desire, HEV (hybrid electric vehicle), position | lean burn drive mode |
| 4 | 5 | count, convert, drive, route, pump, water, lamp, mirror, unit, decouple | control of a converter |
| 5 | 6 | peltier, decelerator, generate, element, exhaust, dispose, leachate, pump, layout, park | heating and cooling system using peltier device |
| 6 | 7 | voltage, high, duct, remain, route, cool, dust, filter, main, amount | high voltage system |
| 7 | 10 | creep, limit, motor/generator, instantaneous, second, capacity, controller, reduction, load, amplifier | creep torque control system |
| 8 | 7 | average, efficiency, past, port, engine, fire, canister, coolant, assemble, cool | temperature control apparatus |
| Cluster | Quantity | Core Keywords | Defined Technology |
|---|---|---|---|
| 1 | 4 | capacitor, device, relay, control, residual, terminal, strip, switch, measure, configure | relay control apparatus |
| 2 | 4 | cartridge, lead, lithium, connect, middle, film, secondary, accomplished, couple, case | secondary battery |
| 3 | 4 | state, flow, estimate, circuit, connect, charge, configure, module, cell, pre-charge | battery module |
| 4 | 9 | microprocessor, battery, block, interrelation, lead, great, monitor, voltage, calculate, extract | battery monitoring device |
| 5 | 7 | voltage, state, augment, switch, oil, case, make, predict, uncertainty, part | parameter estimation of augmented state |
| 6 | 4 | main, line, modulate, plus, width, condition, differ, energized, fault, feedback | driver circuit and diagnostic method |
| 7 | 6 | model, assemble, state, level, temperature, conduct, dispose, frame, interior, plastic | assembling the battery cell |
| Cluster | Quantity | Core Keywords | Defined Technology |
|---|---|---|---|
| 1 | 7 | recovery, gear, automobile, cooperate, step, configure, obtain, velocity, support, adjust | recovery control function |
| 2 | 6 | friction, pulley, light, determine, install, support, coefficient, inside, sense, cumulate | electric power steering |
| 3 | 5 | engine, point, improve, start, time, torque, auxiliary, portion, motor, amount | electronic parking brake |
| 4 | 6 | worm, system, magnet, switch, may, planetary, device, radiation, armature, contact | column-type electric power steering |
| 5 | 7 | coolant, mount, wheel, base, cylinder, hole, passage, plate, solenoid, valve | hydraulic power steering |
| Cluster | Quantity | Core Keywords | Defined Technology |
|---|---|---|---|
| 1 | 4 | turn, rotor, wind, sensor, stator, couple, driver, brake, motor, module | electric blower |
| 2 | 3 | catalyst, control, layer, operate, battery, state, automate, anode, cathode, module | battery development |
| 3 | 4 | air, fuel, electron, emission, output, rectifier, supply, source, oxidant, extend | fuel cell |
| 4 | 5 | stop, terminal, module, power, auxiliary, integrate, configure, charge, contactor, transistor | integrated charging module device |
| 5 | 5 | process, pack, unit, lithium, charge, discharge, current, period, end, consist | lithium battery pack |
| Cluster | Quantity | Core Keywords | Defined Technology |
|---|---|---|---|
| 1 | 5 | communication, program, metadata, first, capacitor, dc-link, power, manage, read, torque | charge management system |
| 2 | 6 | assemble, support, cover, guide, instruct, plate, torque, first, high-voltage, frequency | electric motor control |
| 3 | 5 | signal, communicate, emit, light, drive, shut, bidirectional, end, opposite, case | supplying and blocking of the battery power |
| Cluster | Quantity | Core Keywords | Defined Technology |
|---|---|---|---|
| 1 | 6 | Fix, wire, torque, clutch, cell, solar, voltage, eliminate, process, expose | HVAC (heating, ventilation, and air conditioning) |
| 2 | 3 | battery, supply, unit, cool, room, storage, time, duct, display, length | battery cooling |
| 3 | 4 | mode, switch, assemble, detent, load, number, revolution, air-condition, apparatus, value | air conditioner system |
| Cluster | Quantity | Core Keywords | Defined Technology |
|---|---|---|---|
| 1 | 6 | cell, module, battery, present, use, abnormal, capable, charge, circuit, connection | battery module |
| 2 | 3 | connect, control, dc/dc, convert, module, switch, circuit, SOCi (State of charge based on current), SOCv (state of charge based on voltage), voltage | DC/DC (direct current to direct current) converter |
| 3 | 4 | pre-charge, amount, reactive, cover, circuit, inter-lock, exterior, swell, power, calculate | pre-charge resistance protector |
| Company | Trends Report [22,23] | |
|---|---|---|
| Present Business Market | Future Business Plan and Technology | |
| Hyundai | FSEV (full speed electric vehicles) | Electric car manufacturing |
| Motor | Electric car charging technology | |
| Kia | FSEV | Electric car manufacturing |
| Motor | Electric car charging technology | |
| LG | Battery | Li-Ion HEV and PHEV (plug-in hybrid electric vehicle) battery |
| Renerative brakes | Rapid Charging system | |
| Mando | Renerative brakes | Electric car embedded charging system, charger, condenser development |
| Charger | ||
| Samsung | FSEV | Electric car charging system for parking lot of residential complex |
| Battery | ||
| Cell | ||
| LSIS | Inverter | Electric car charging stand manufacturing and electric car charging infrastructures construction |
| Motor | ||
| Halla | Work Machine | Battery pack Air conditioning System |
| Battery | ||
| Air conditioning System | ||
| SK | Battery | Combined Li-Ion Cell |
| Infrastructure | ||
© 2016 by the authors; licensee MDPI, Basel, Switzerland. This article is an open access article distributed under the terms and conditions of the Creative Commons Attribution (CC-BY) license (http://creativecommons.org/licenses/by/4.0/).
Share and Cite
Kim, G.; Lee, J.; Jang, D.; Park, S. Technology Clusters Exploration for Patent Portfolio through Patent Abstract Analysis. Sustainability 2016, 8, 1252. https://doi.org/10.3390/su8121252
Kim G, Lee J, Jang D, Park S. Technology Clusters Exploration for Patent Portfolio through Patent Abstract Analysis. Sustainability. 2016; 8(12):1252. https://doi.org/10.3390/su8121252
Chicago/Turabian StyleKim, Gabjo, Joonhyuck Lee, Dongsik Jang, and Sangsung Park. 2016. "Technology Clusters Exploration for Patent Portfolio through Patent Abstract Analysis" Sustainability 8, no. 12: 1252. https://doi.org/10.3390/su8121252