1. Introduction
Landfills, even when well organized, can cause many environmental nuisances worldwide [
1,
2,
3,
4,
5]. The risk of groundwater contamination by leachate is determined by many factors, including precipitation, hydrogeological conditions of the area, the toxicity, concentration and chemical composition of contaminants, solid waste composition, degree of compaction, absorptive capacity of the waste, landfill chemical and biological activities, landfill temperature, age of waste, and depth and distance from the pollution source or the direction of groundwater flow [
6,
7,
8,
9,
10,
11,
12,
13,
14,
15].
The leachate commonly contains large amounts of organic matter, ammonium, heavy metals, and chlorinated organic and inorganic salts, which cause a great threat to soil–water environment in the vicinity of a landfill site [
16,
17,
18,
19]. The compositions of leachate can be divided into four parts of pollutants: (1) Organic matter, COD (chemical oxygen demand) and TOC (total organic carbon); (2) specific organic compounds; (3) inorganic compounds; and (4) heavy metals [
6,
11,
20].
In comparison with soluble organics, the release of soluble nitrogen from municipal waste continues over a long period. Ammonium occurs in the leachate from old landfills owing to hydrolysis and fermentation of the nitrogenous fraction of biodegradable substrates. On the other hand, the processes of amino acids deamination during the degradation of organic compounds are responsible for ammonium occurrence in leachate from newly developed landfills [
14,
21,
22]. Ammoniacal nitrogen has a potential to act as one of the dominant environmental pollutants produced from landfills containing putrescible waste and hence poses problems for the management of all landfills. It has frequently been described as the most common pollutant of groundwater, emanating from landfills at concentrations of greater magnitude than emission of other nitrogen forms (N-NO
3, and N-NO
2) [
7,
23,
24,
25,
26].
Many factors have influence on temporal and spatial variations of nitrogen compounds concentration in the soil–water environment [
27,
28,
29,
30]. Ammonia is water-soluble, which is why it is deposited in land and vegetation very quickly. When ammonia reacts with acid gases, it can be transported over long distance from the source of emission and deposited much slower.
It is commonly believed that vertical barriers surrounding a landfill zone, as one of these factors, has significant impact on preventing or minimizing contaminant transport away from the source and limiting advective flux of the contaminant [
31,
32,
33]. Because of the properties of materials composing vertical barrier and its low permeability, there is a real opportunity to protect the soil–water environment against the harmful effects of sanitary landfills [
22,
34,
35,
36,
37].
The possibility of application of vertical barriers in the soil–water protection was confirmed in many monitoring studies reported, inter alia, by Anderson et al. [
38], Koda et al. [
39], Zhao et al. [
40], and Koda et al. [
22]. Regarding the issues mentioned above, the aim of this paper is to assess quality of soil–water environment (with particular focus on contamination caused by ammonium) in the landfill area, before and after a vertical barrier closure using monitoring techniques as well as determination of the vertical barrier influence on the change of the groundwater flow conditions.
2. Materials and Methods
2.1. Study Area
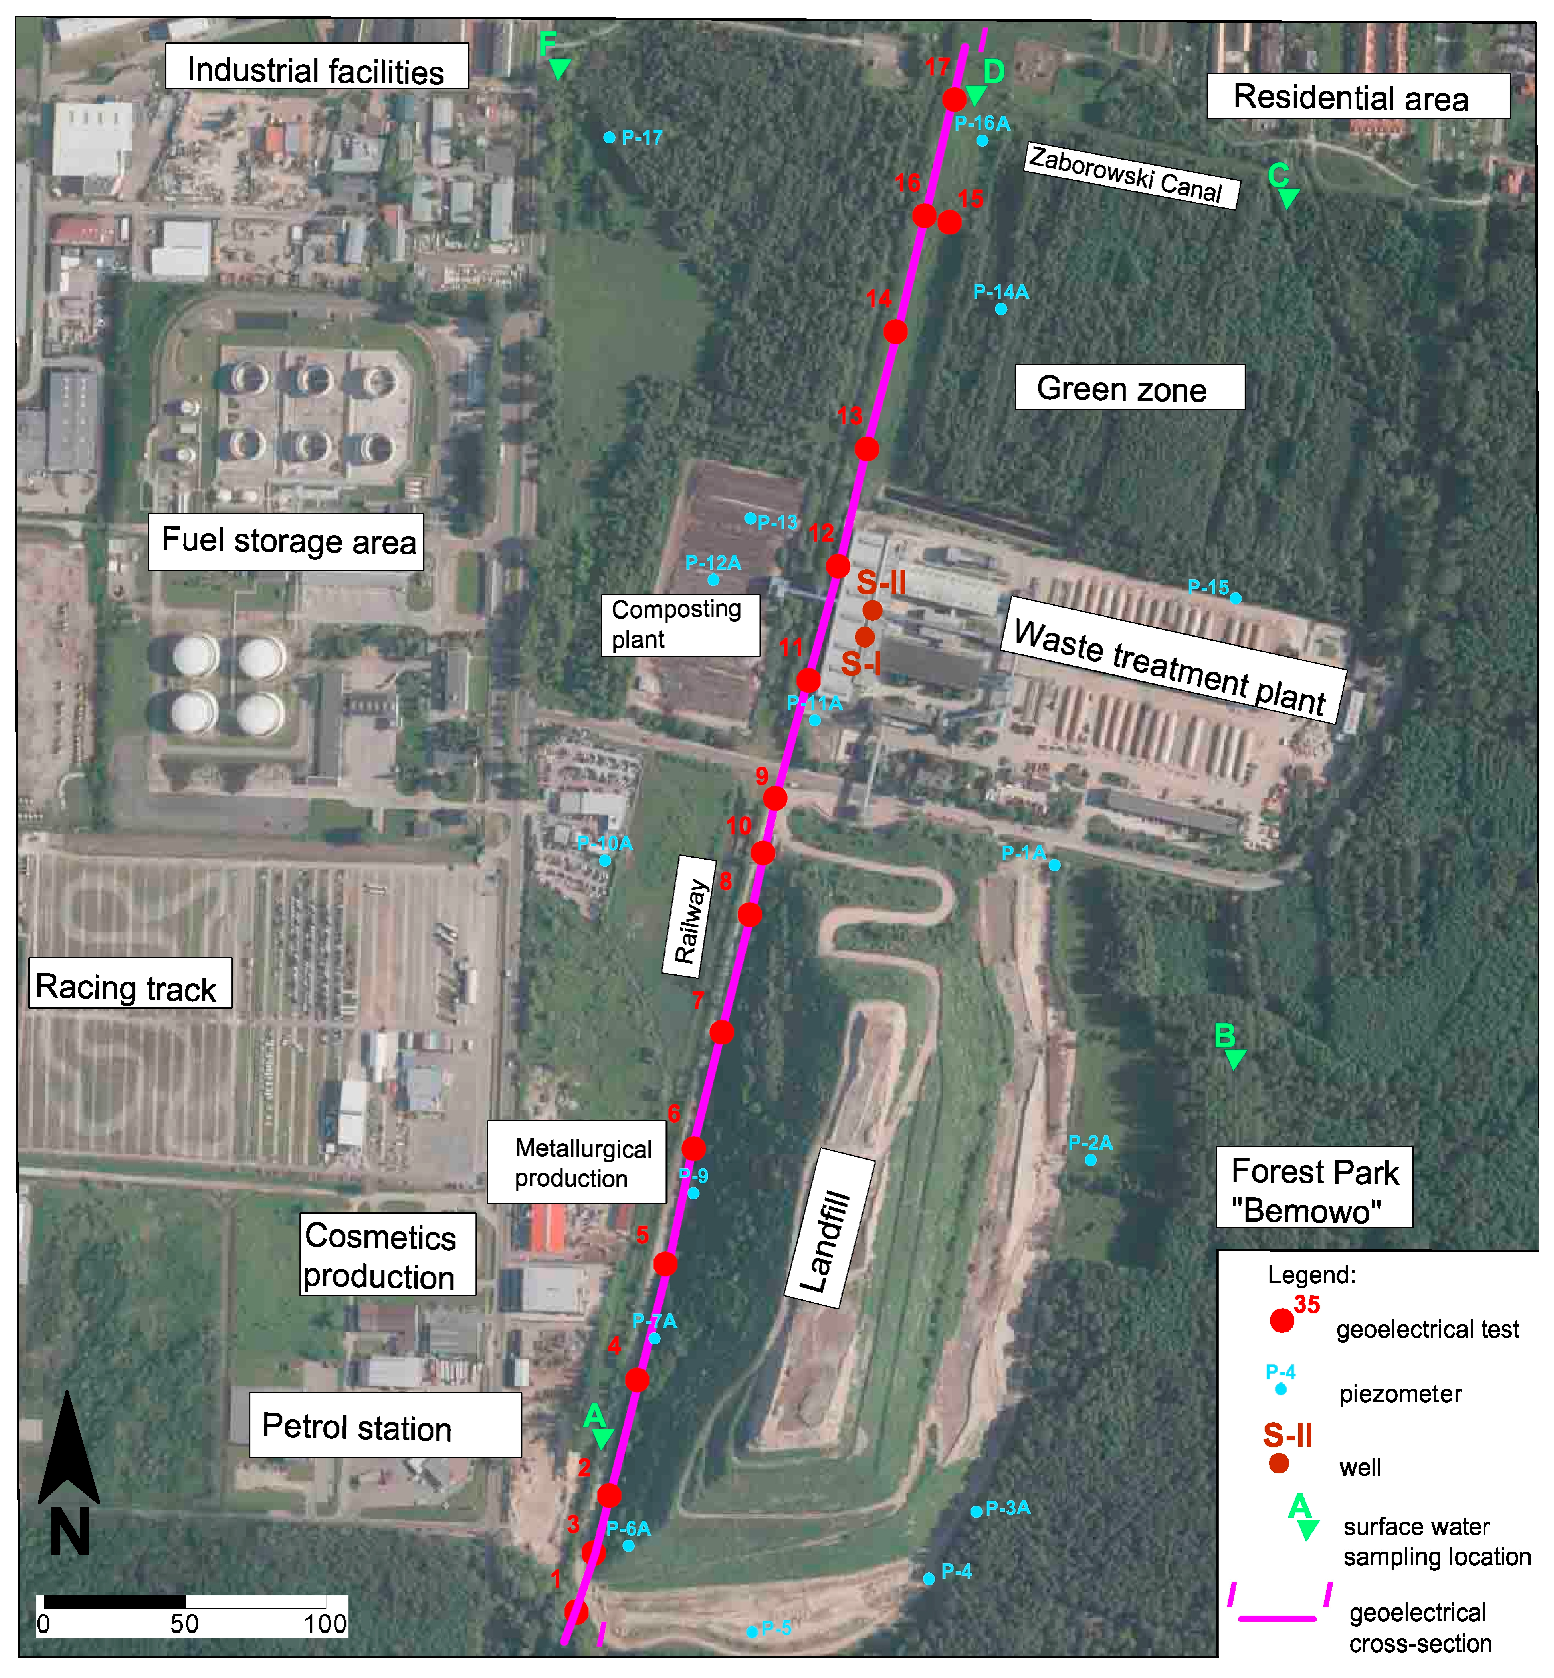
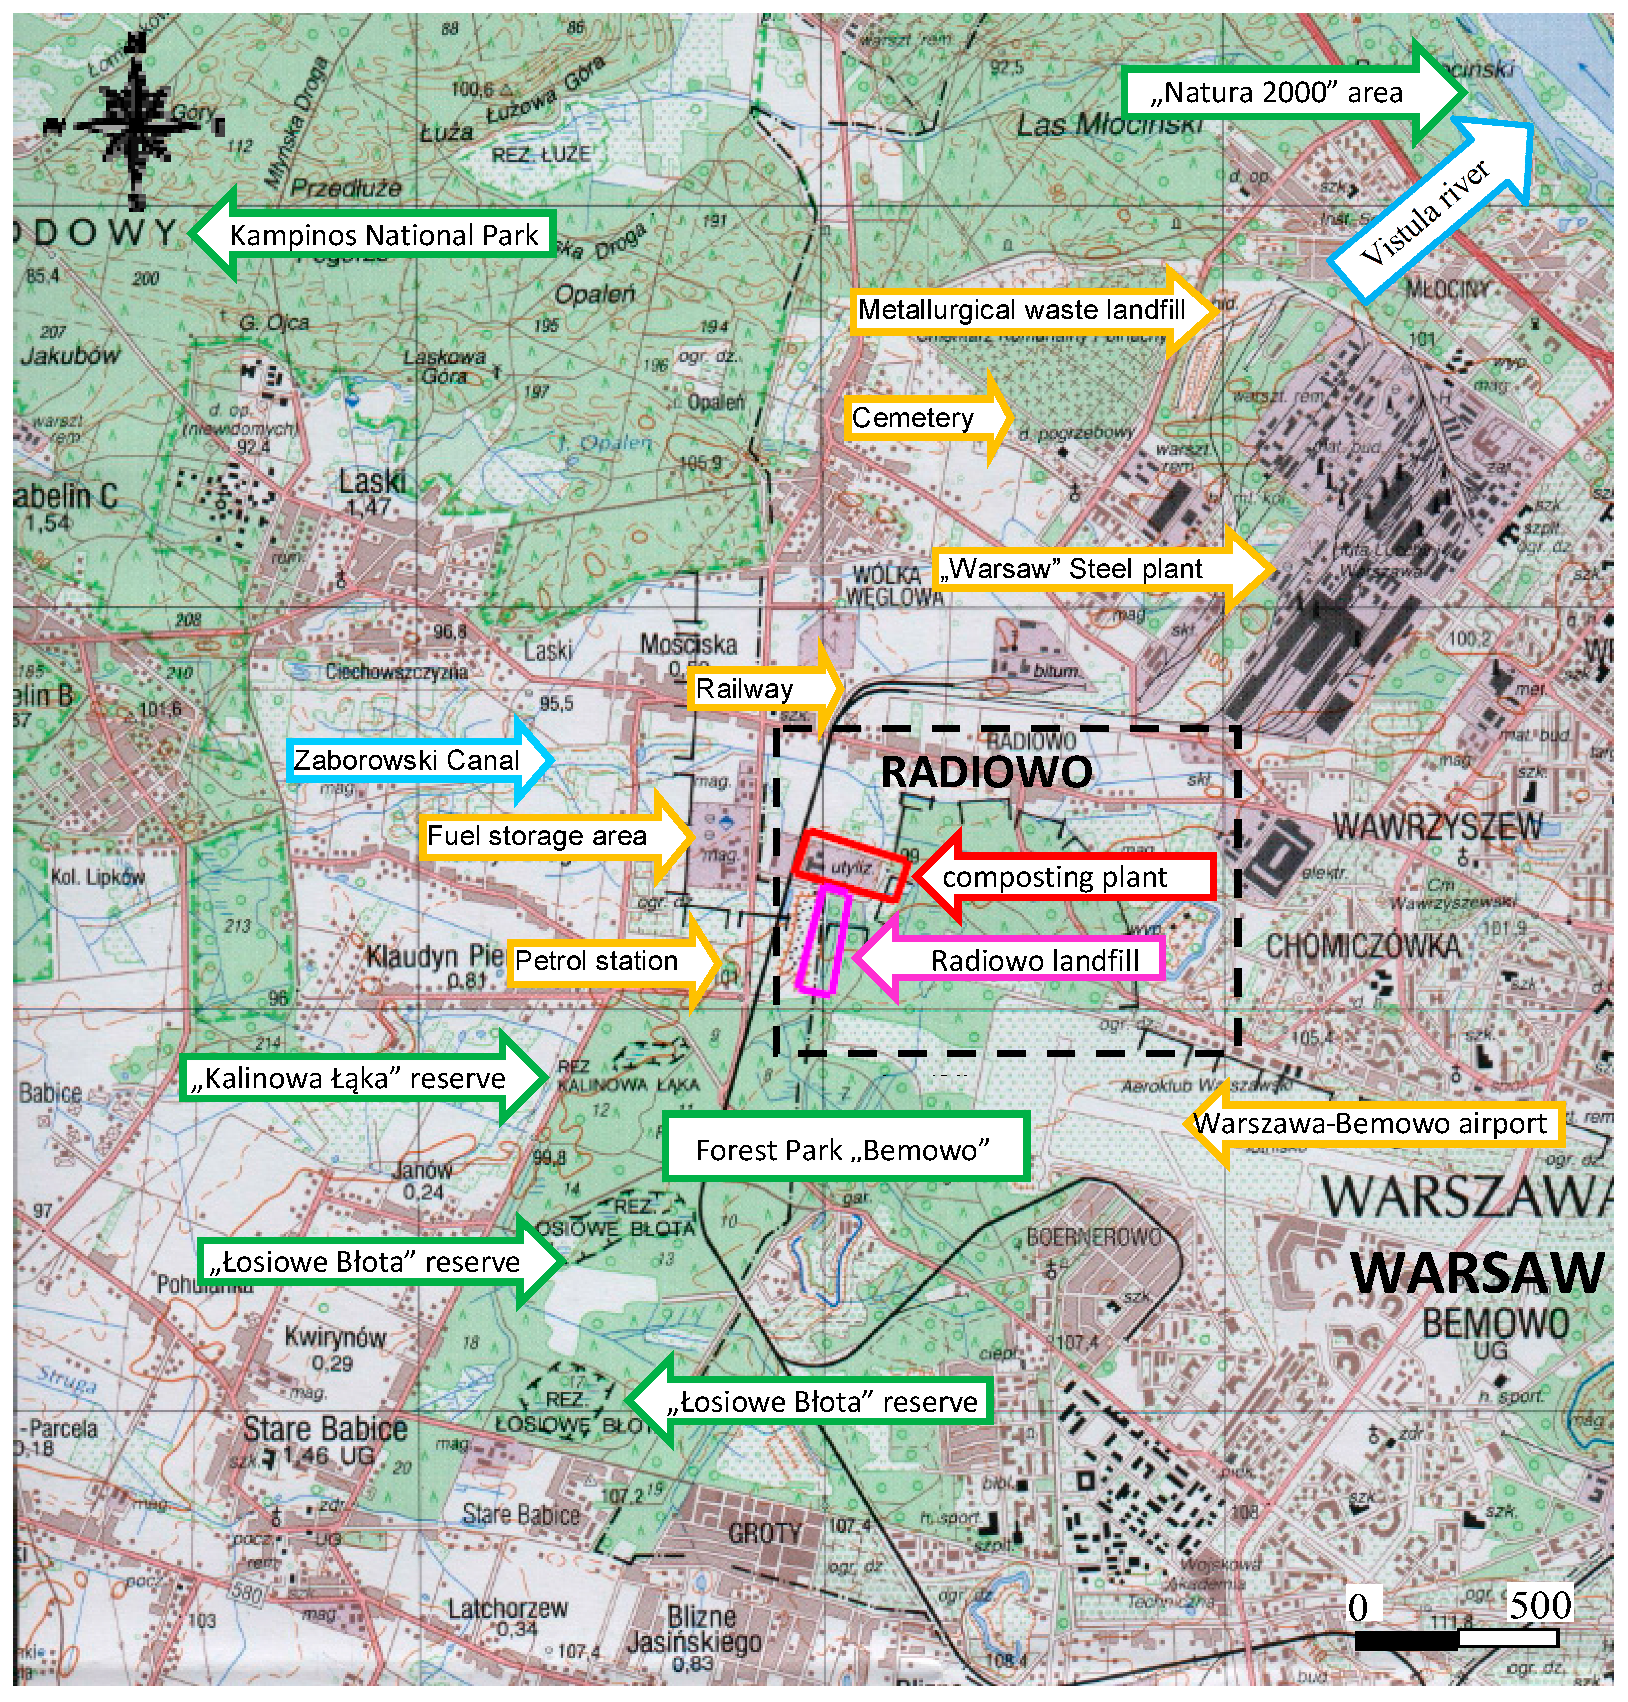
The Radiowo Landfill is located in the commune Stare Babice and partially (about 17% of the area) in Warsaw, the capital of Poland (
Figure 1). From the southern and eastern side, landfill is surrounded by Forest Park “Bemowo” and Nature Reserves: floristic Kalinowa Łąka and peat and wet lands Łosiowe Błota. From the north site, landfill is adjacent to the composting plant located in Warsaw-Bielany District.
On the west side, in the vicinity of the landfill slope, there is a railway siding located and the industrial and service buildings. Approximately 200 m from the toe of the landfill slope, the paved storage yard is located and, in the northwestern direction, the base of fuel storage. In the north of the landfill, at a distance of about 350 m from the composting (400 m from the landfill), there is a watercourse Zaborowski Canal (connected to Lipkowska Woda stream). The area of the Kampinos National Park is situated approximately 3 km to the northwest of the Radiowo landfill. From early 1962 to 1991, Radiowo landfill was used as a place where the municipal waste from Warsaw was disposed. Since 1992, only ballast waste from the composting plant has been deposited on the landfill, and, since 2012, only waste from the installation of mechanical and biological treatment has been stored there. Actually, it covers ca. 16 ha area, and its elevation is about 60 m. It must be emphasized that initially no protection system against environmental contamination was introduced on the landfill site. Since 1994, the remedial works concerning stability reinforcement solution, engineering and planting of slopes, clay mineral capping, installation of the drainage, recirculation system and bentonite cut-off wall have been constructed on the landfill.
The cut-off wall barrier has been designed to minimize the spread of contaminants into the surrounding soil–water environment, as well as to provide favorable hydraulic conditions by forcing a lowered groundwater level inside the peripheral cut-off wall in relation to the natural water level around the landfill site [
21,
41]. The location of the landfill on the protected areas background, as well as its monitoring system is presented on the
Figure 1 and
Figure 2.
2.2. Hydrogeological Conditions of the Study Area
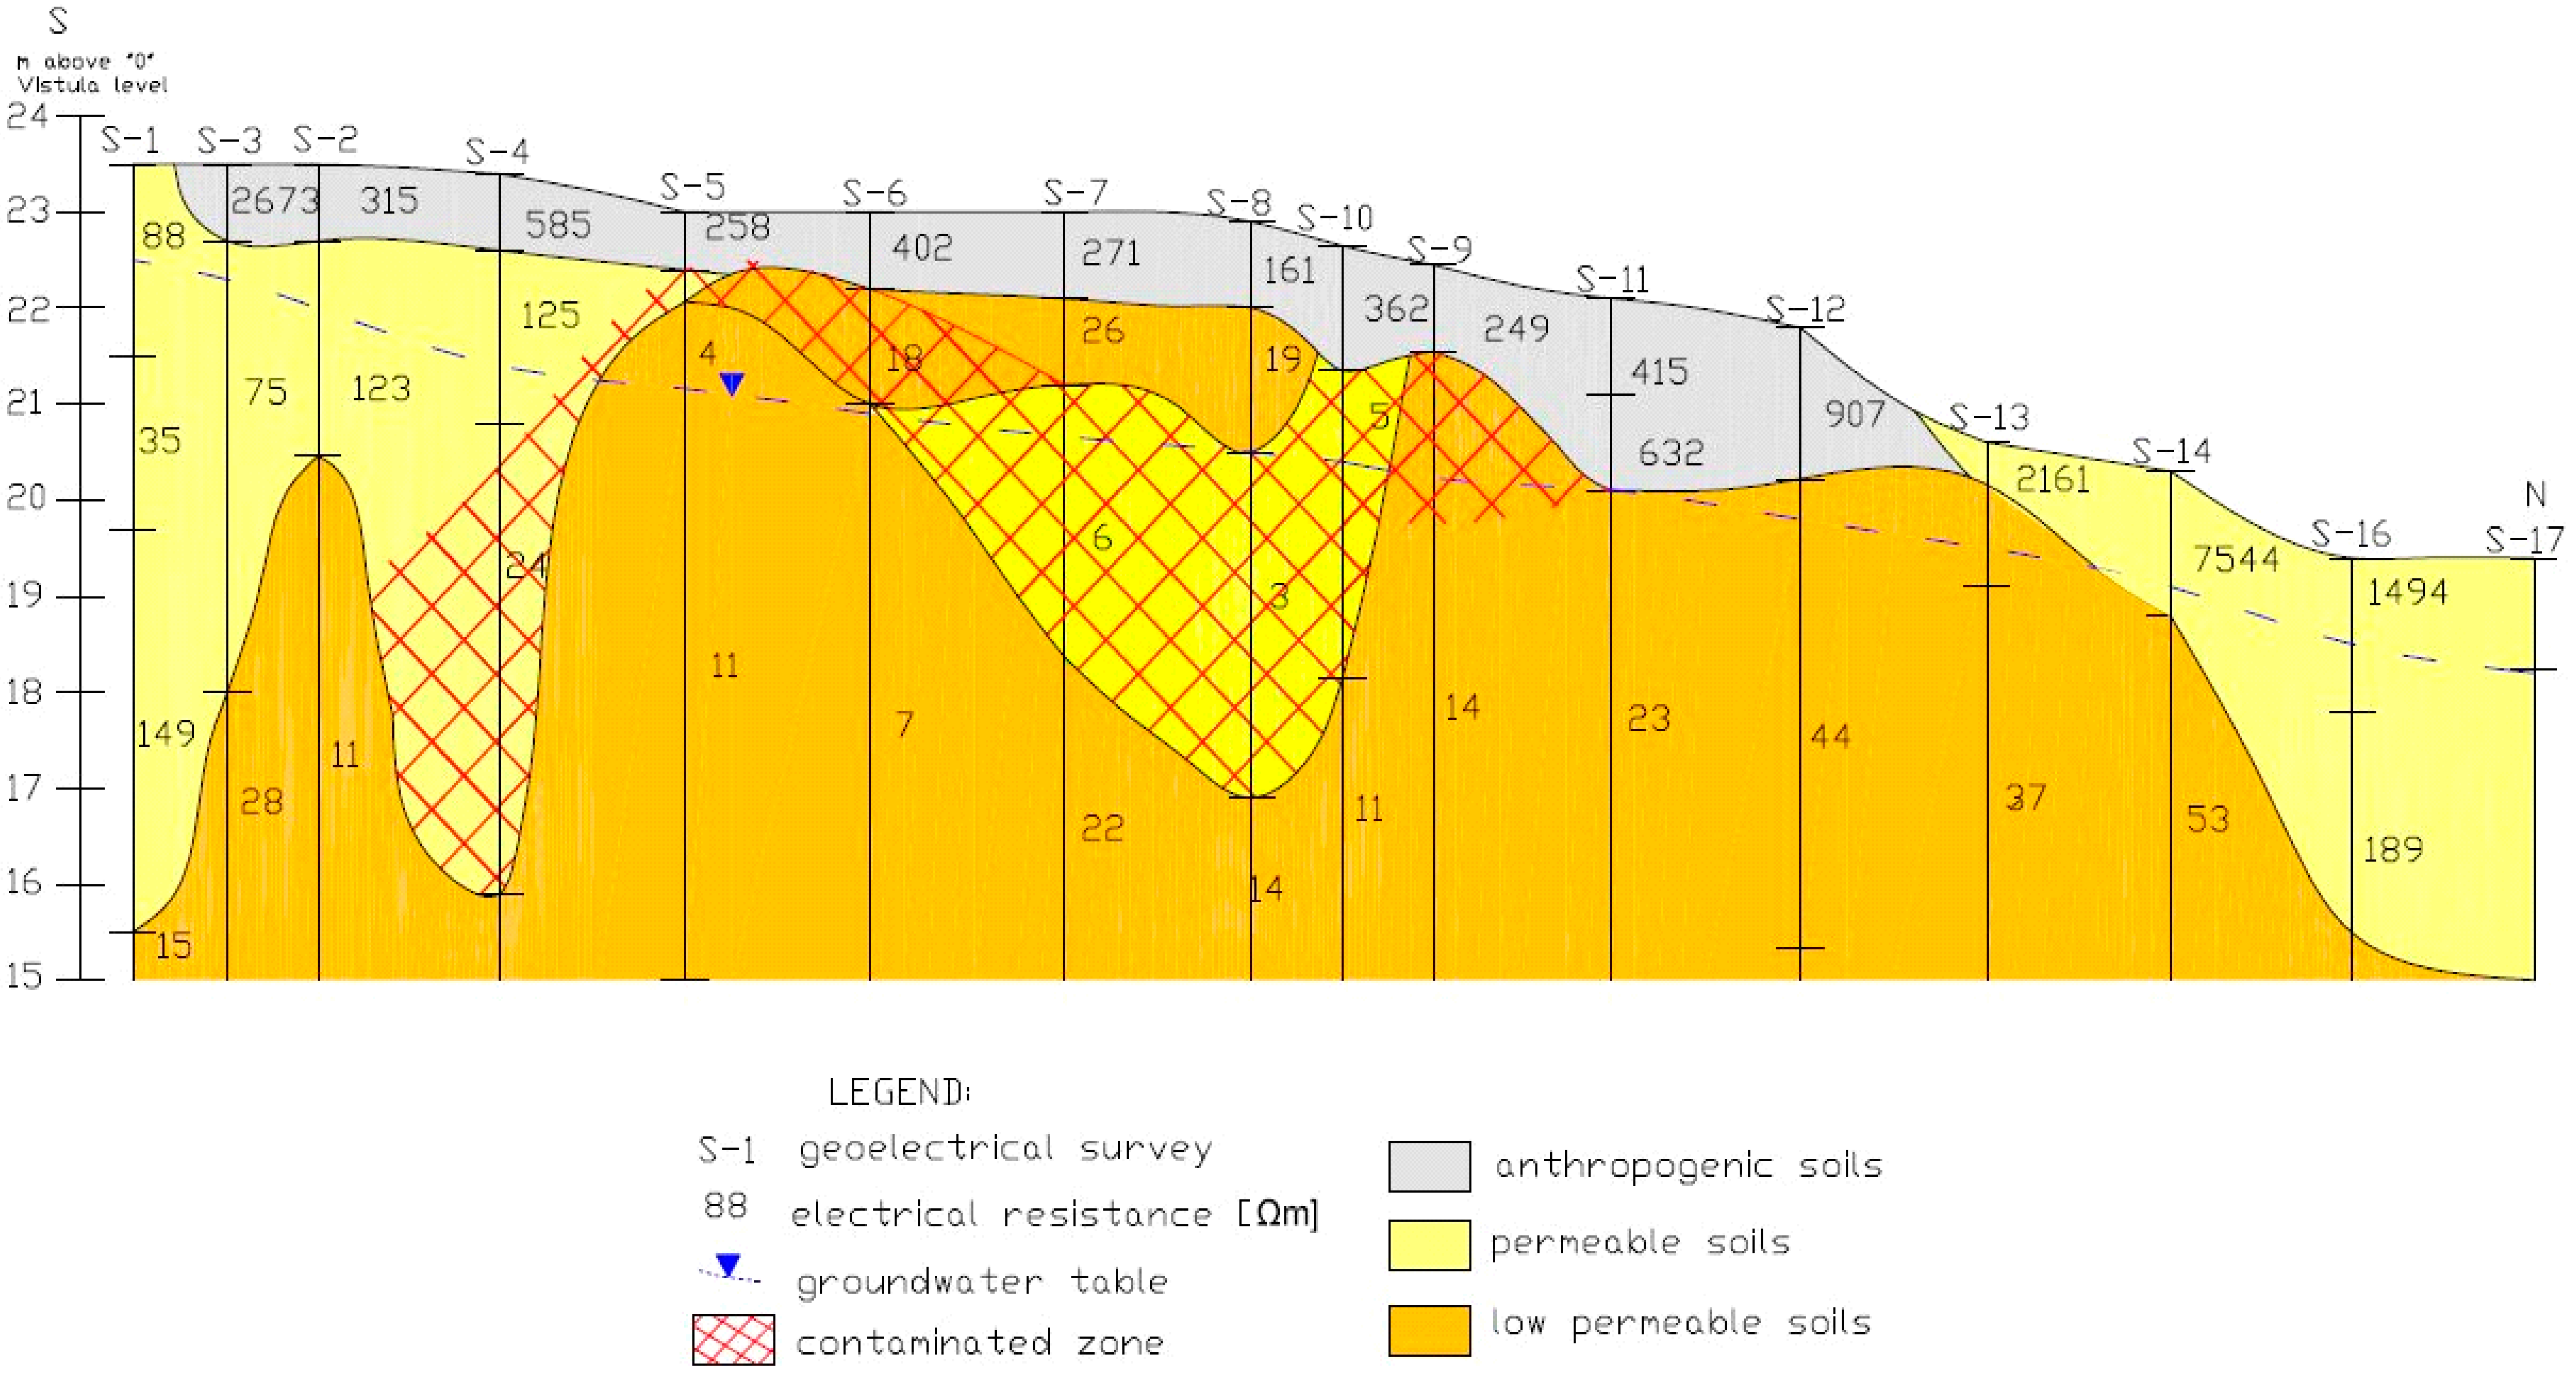
To investigate the geological and hydrogeological conditions on the landfill area, a set of complex site investigations were commenced in the past. The network of piezometers and groundwater monitoring systems were installed in the study area. To complete the picture of the contamination level of the subsoil, complementary geoelectrical tests were proposed to be performed at the site. The location of monitoring network and one of geophysical cross sections is presented on
Figure 2. Based on the site investigation results, the landfill subsoil consists of sandy soils, 2–5 m thick, and depth up to 20 m. In the upper part, they are represented by dense sands and, in the deeper part, by well-graded sands. This layer forms the first groundwater level with the table at the depth up to 2 m below ground surface.
From the geoelectrical test (electrical resistivity method), it was also determined that this particular layer is heavily polluted by the leachate from the landfill (
Figure 3). The layer is mainly charged by infiltration of precipitation and water inflow from the forest area located in the SE. Dewatering trenches from the northeast and west parts, as well as the stream (from the north), compose a local drainage system for the first groundwater layer. Deeper part of the subsoil consists of low permeable boulder and varved clays (thickness from 25 to 40 m, the average permeability coefficient of 10
−6 m/s). The set of protecting clay layers consist of the main quaternary aquifer. The vertical bentonite barrier of the landfill was constructed within 1999–2000. The 0.6 m wide cut-off wall was installed at the depth of 2 m below the top of clayey soils, i.e., 3.5–22.0 m below the surface level. This aquitard layer consists of boulder and Tertiary clays. The permeability coefficient for the barrier wall is below 10
−9 m/s (from the BAT in situ and laboratory tests [
42]). The initial hydraulic gradient for the bentonite applied is i
0 = 50, while existing gradient in the field is i = 1–2. The constructed cut-off wall made the subsoil environment practically impermeable. The geological structure of the subsoil and contaminated zones are presented in
Figure 3. The additional protection against the pollution migration is assured by introduced changes in flow direction from the vicinity area to the leachate drainage.
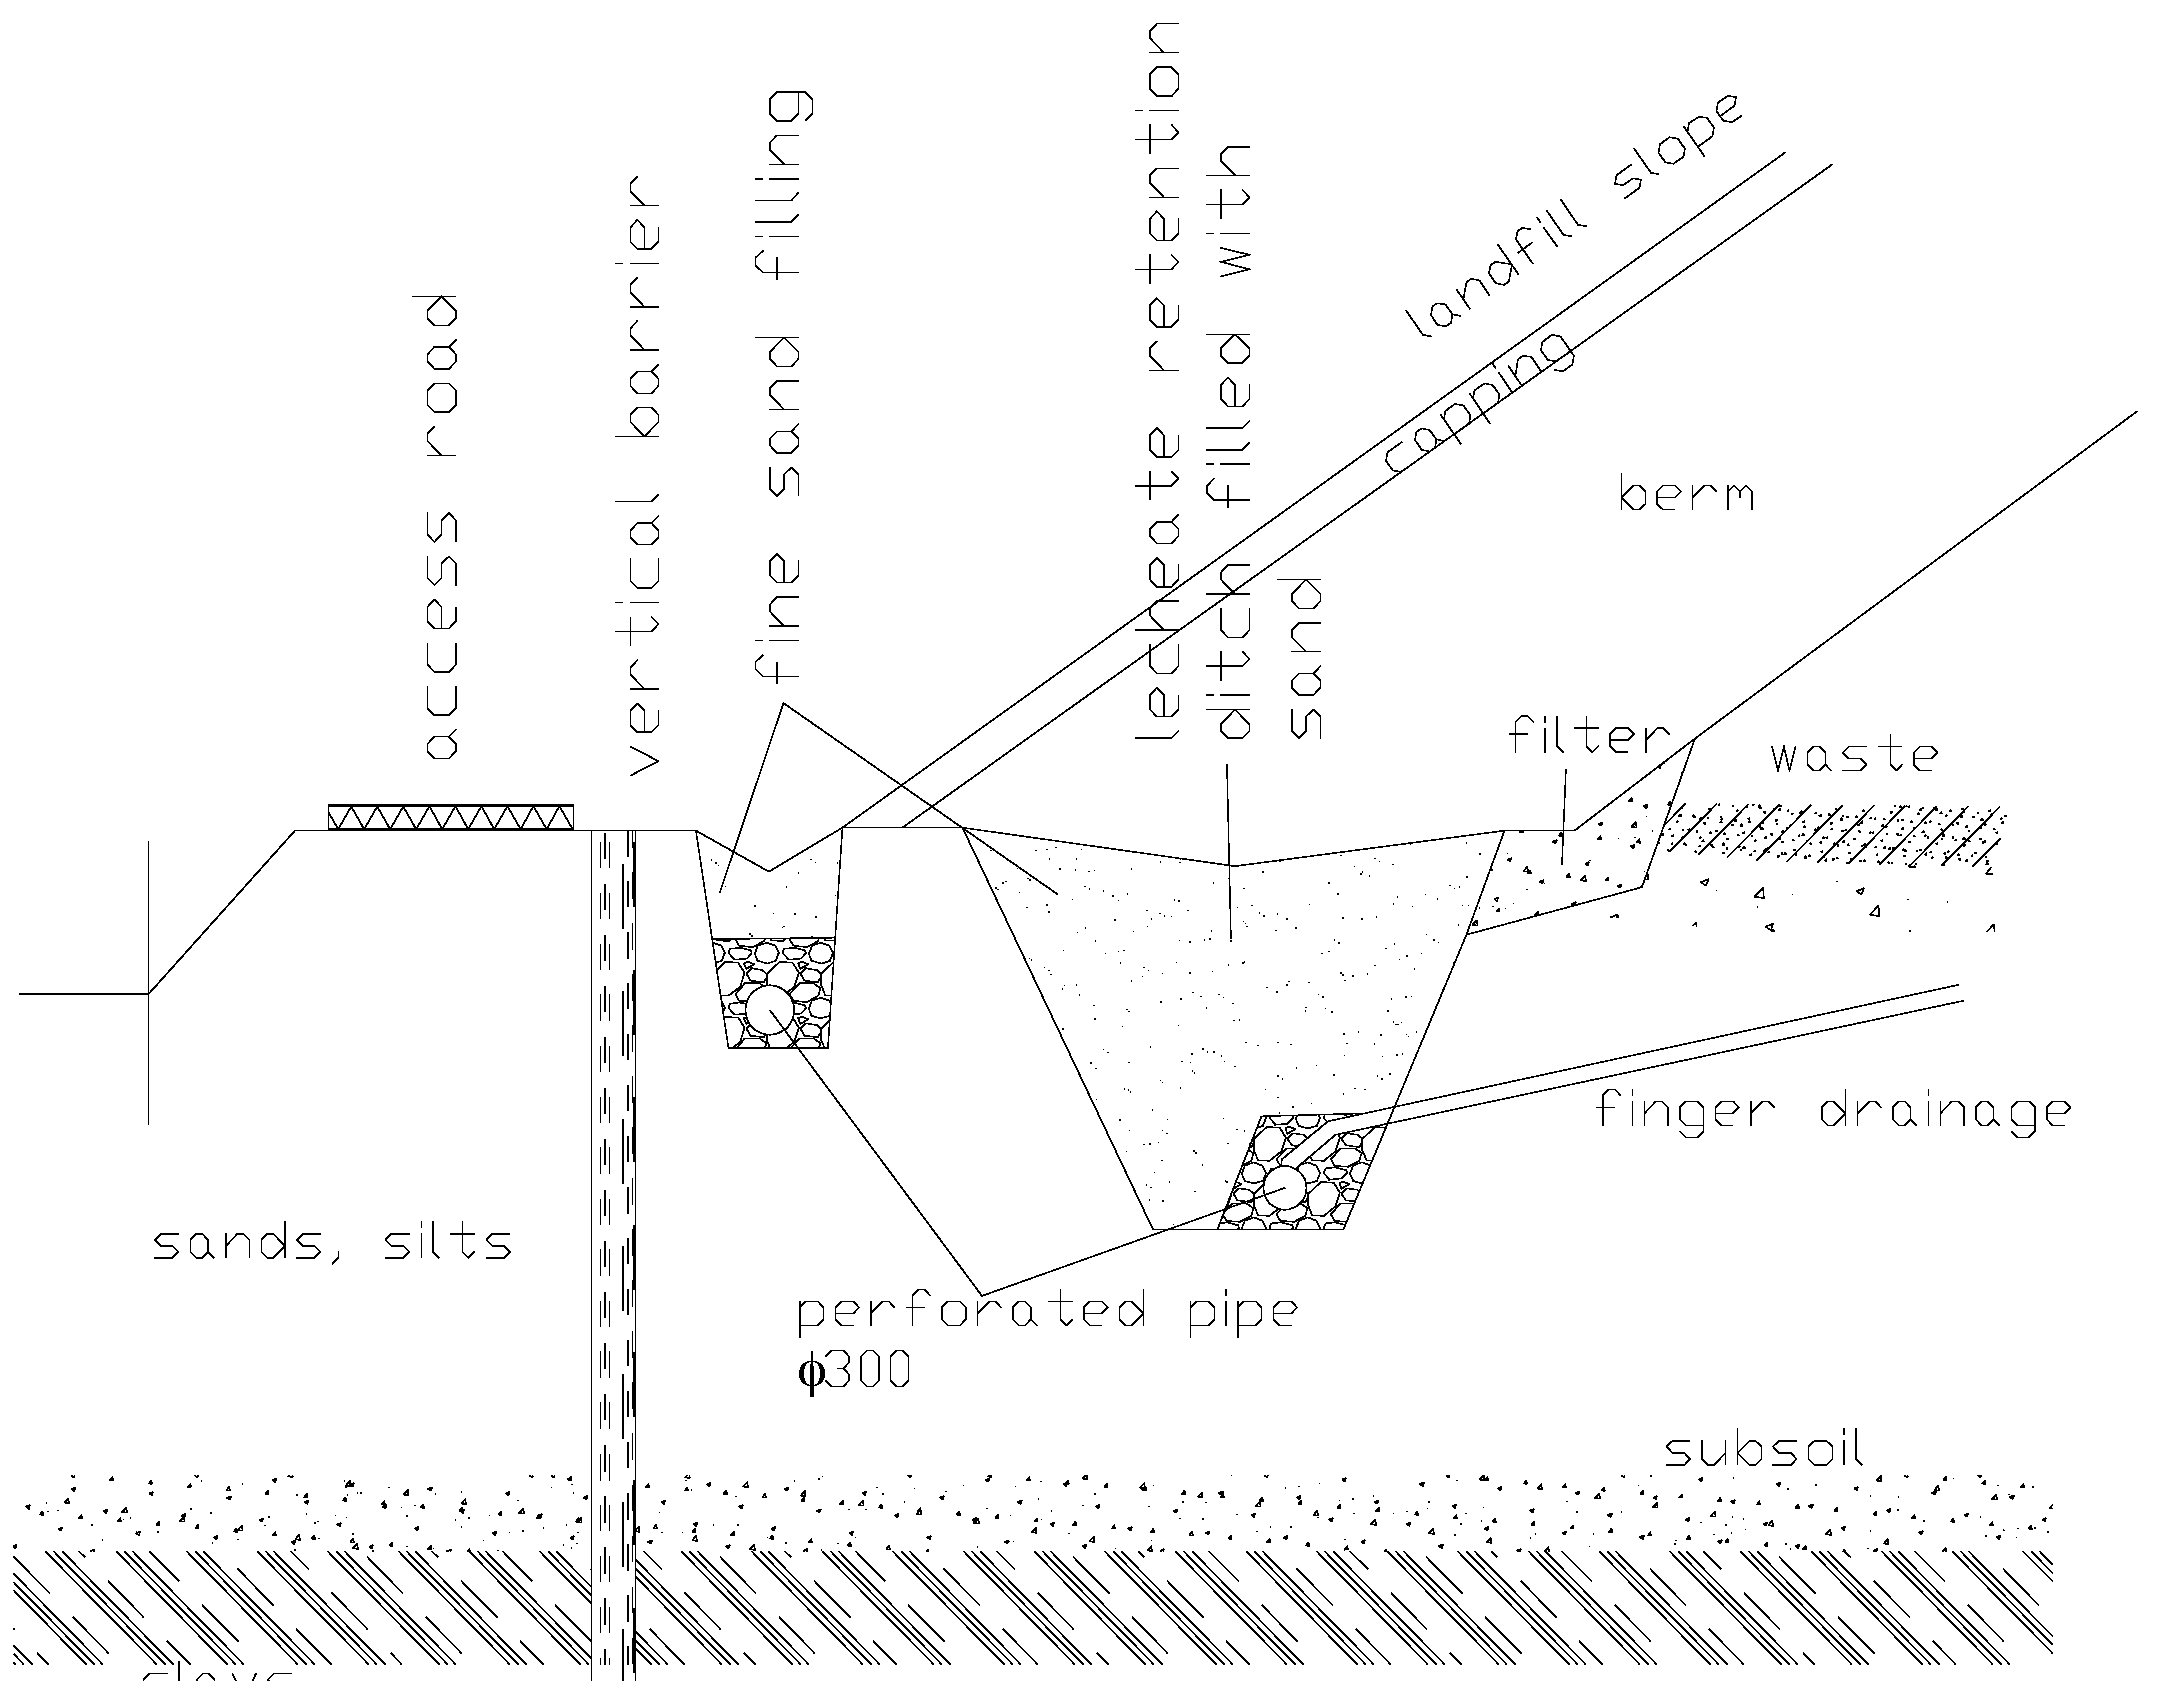
It will also protect the bentonite material against the degradation caused by the leachate. In the remediation design framework, the peripheral drainage around the landfill was constructed. Moreover, in the bottom of berms, the drainage “finger” pipes were also installed to forward the leachate into the peripheral drainage. The entire reclamation system is presented on
Figure 4.
3. Results and Discussion
3.1. Experimental Analysis
The measurement of ammonium was commenced straight after the water samples were collected, using absorption spectrophotometry method [
43]. The assessment was based on comparison of ammonium contamination levels measured for collected samples with concentrations required in water quality standards [
44,
45,
46]. The results are presented in
Table 1 (exceeded values are highlighted).
3.2. Analysis of Ammonium Concentration Changes in Groundwater
There are many factors influencing the ammonium concentration in piezometers located in the monitoring area (for the precise locations of piezometers please refer to
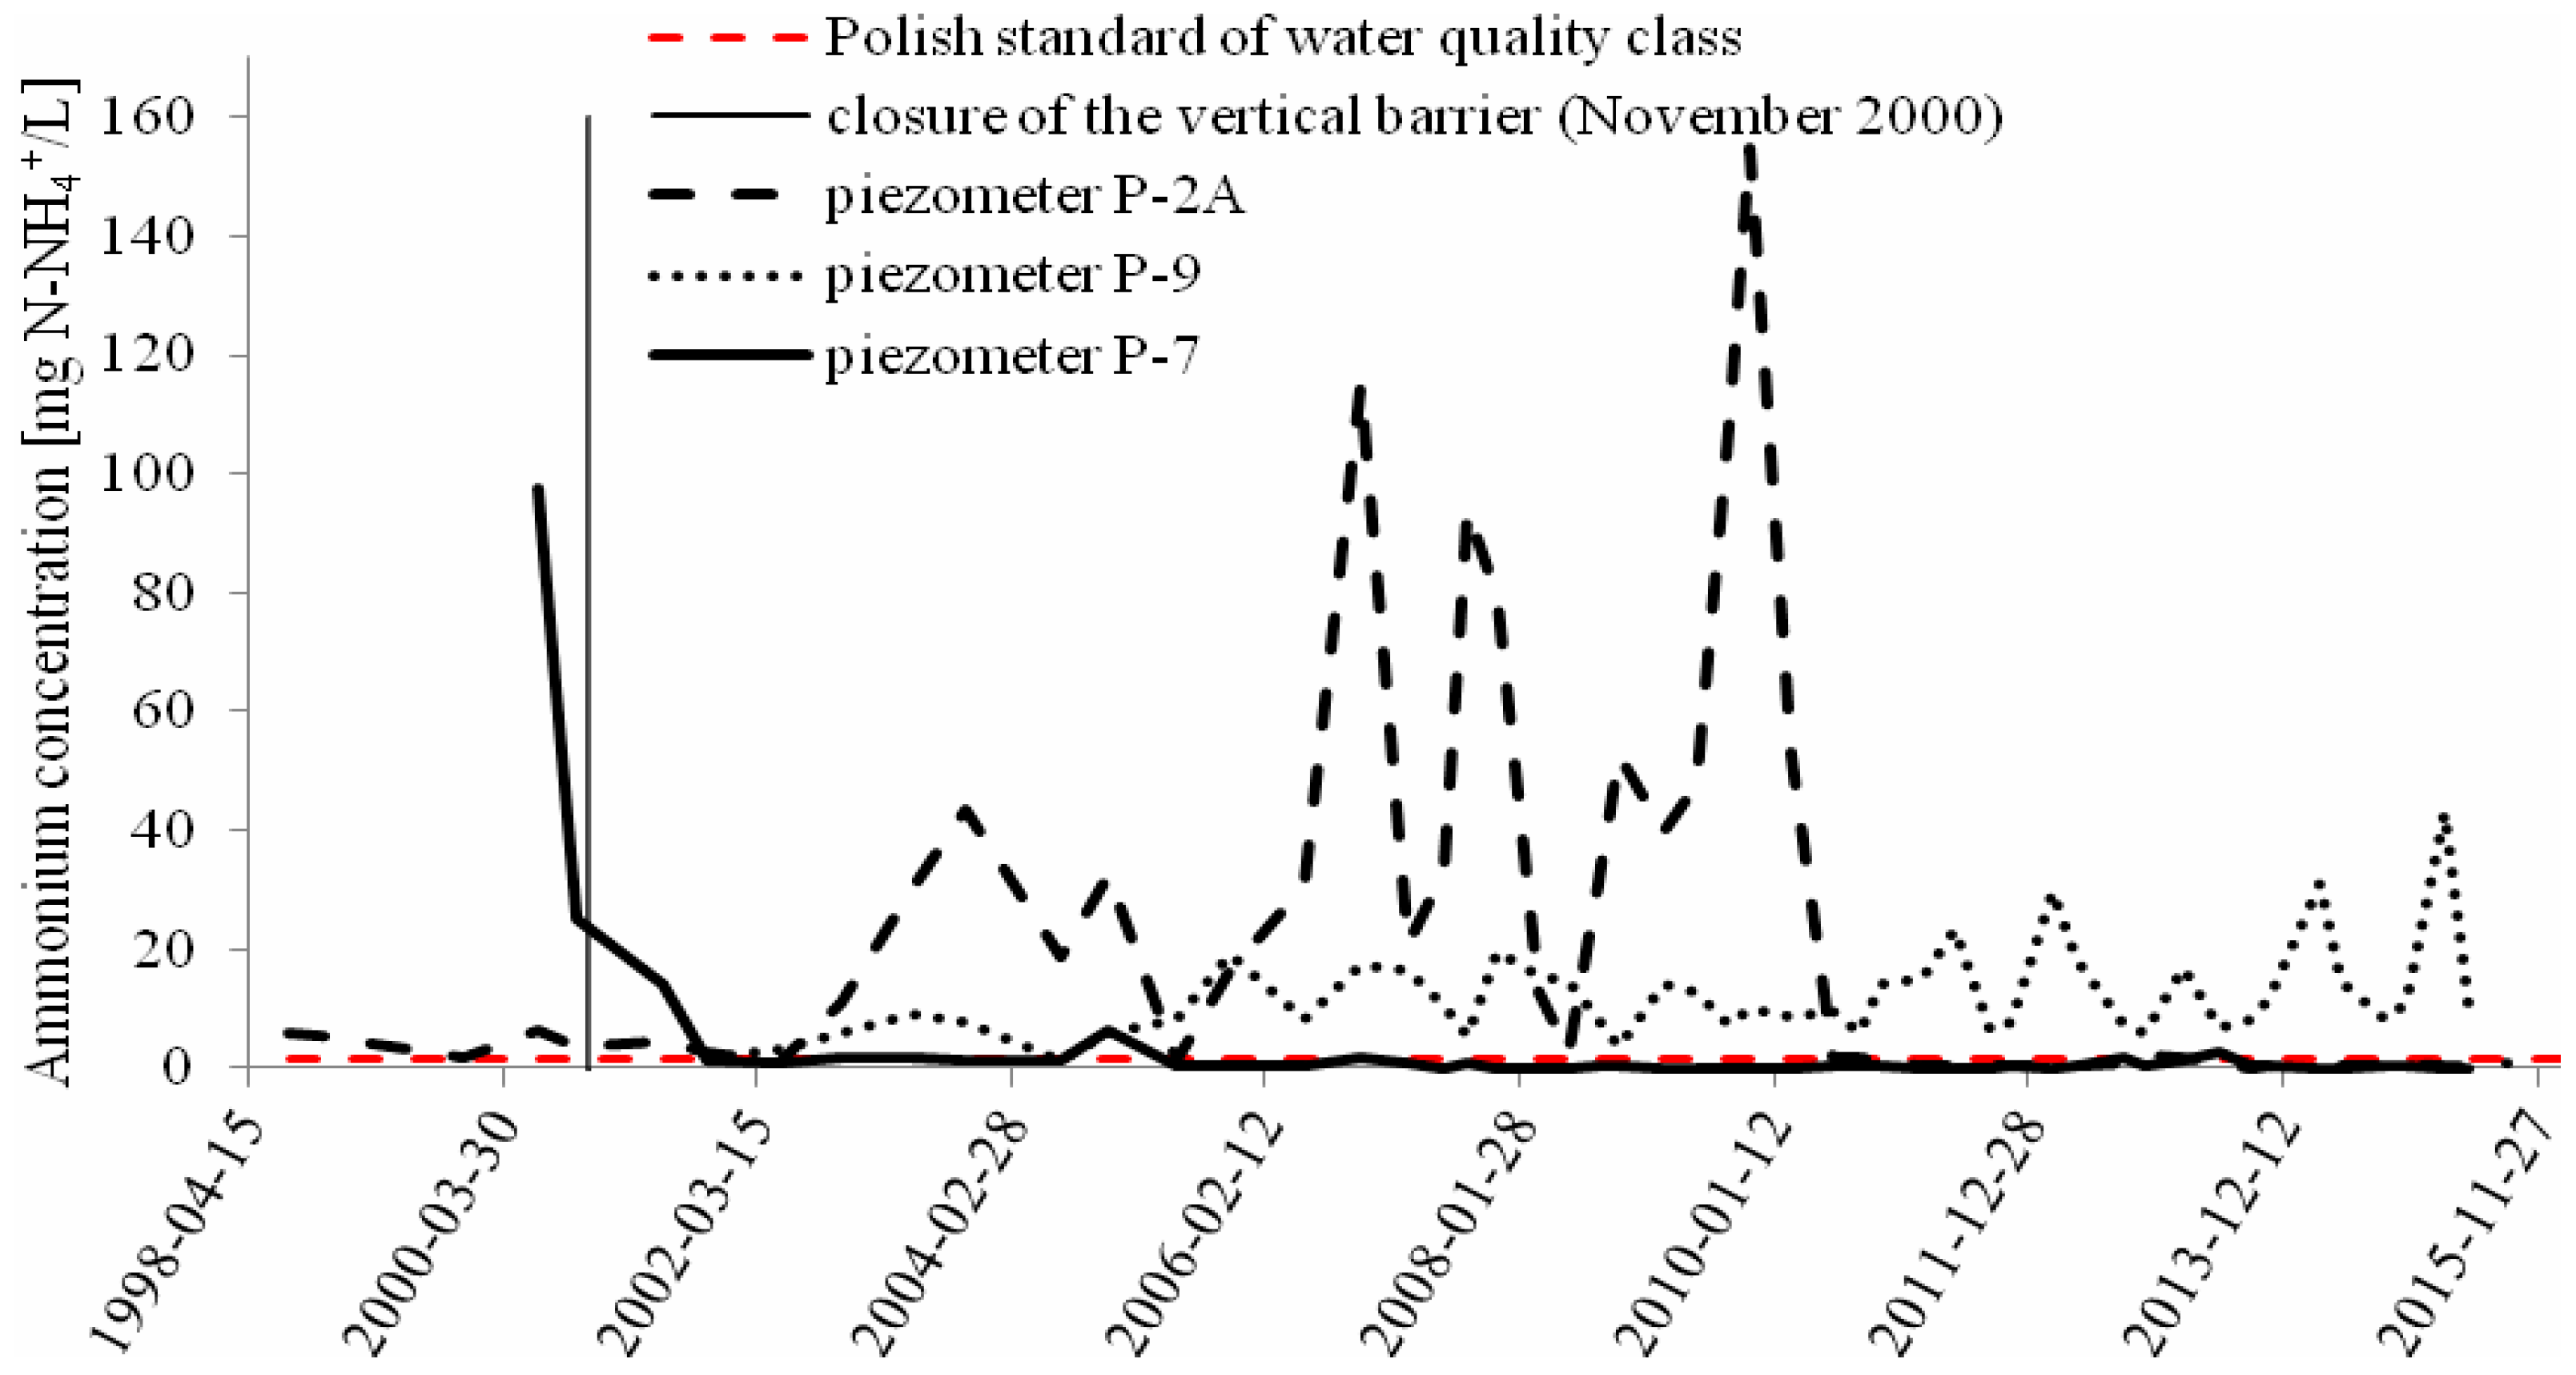
Figure 2). The highest concentrations are the most visible in piezometers 2A, 9 and 7 (
Figure 5), which are located directly in the landfill area. In piezometer P-2A, located at the outflow on the eastern slope of the landfill, significant changes in concentration of ammonium were observed at the end of 2009 as a result of storing organic wastes from the Forest Park “Bemowo”. Significant decrease of ammonium concentration complying with the Polish standards (upper limit of allowed concentration equal to 1.5 mg NH
4+/L for the third class of water quality) was observed at the beginning of 2010, after cleaning and arranging the littered area. It is worth mentioning that according to WHO [
47], at concentration above 1.5 mg NH
4+/L, ammonia can cause odor problems in water.
In addition, the lowest water level noted in September 2014 undoubtedly could affect the increase in the concentration of pollutants in this particular piezometer. In piezometer P-9 (outflow from the west side), the most visible changes of ammonium concentration have been observed since November 2006.
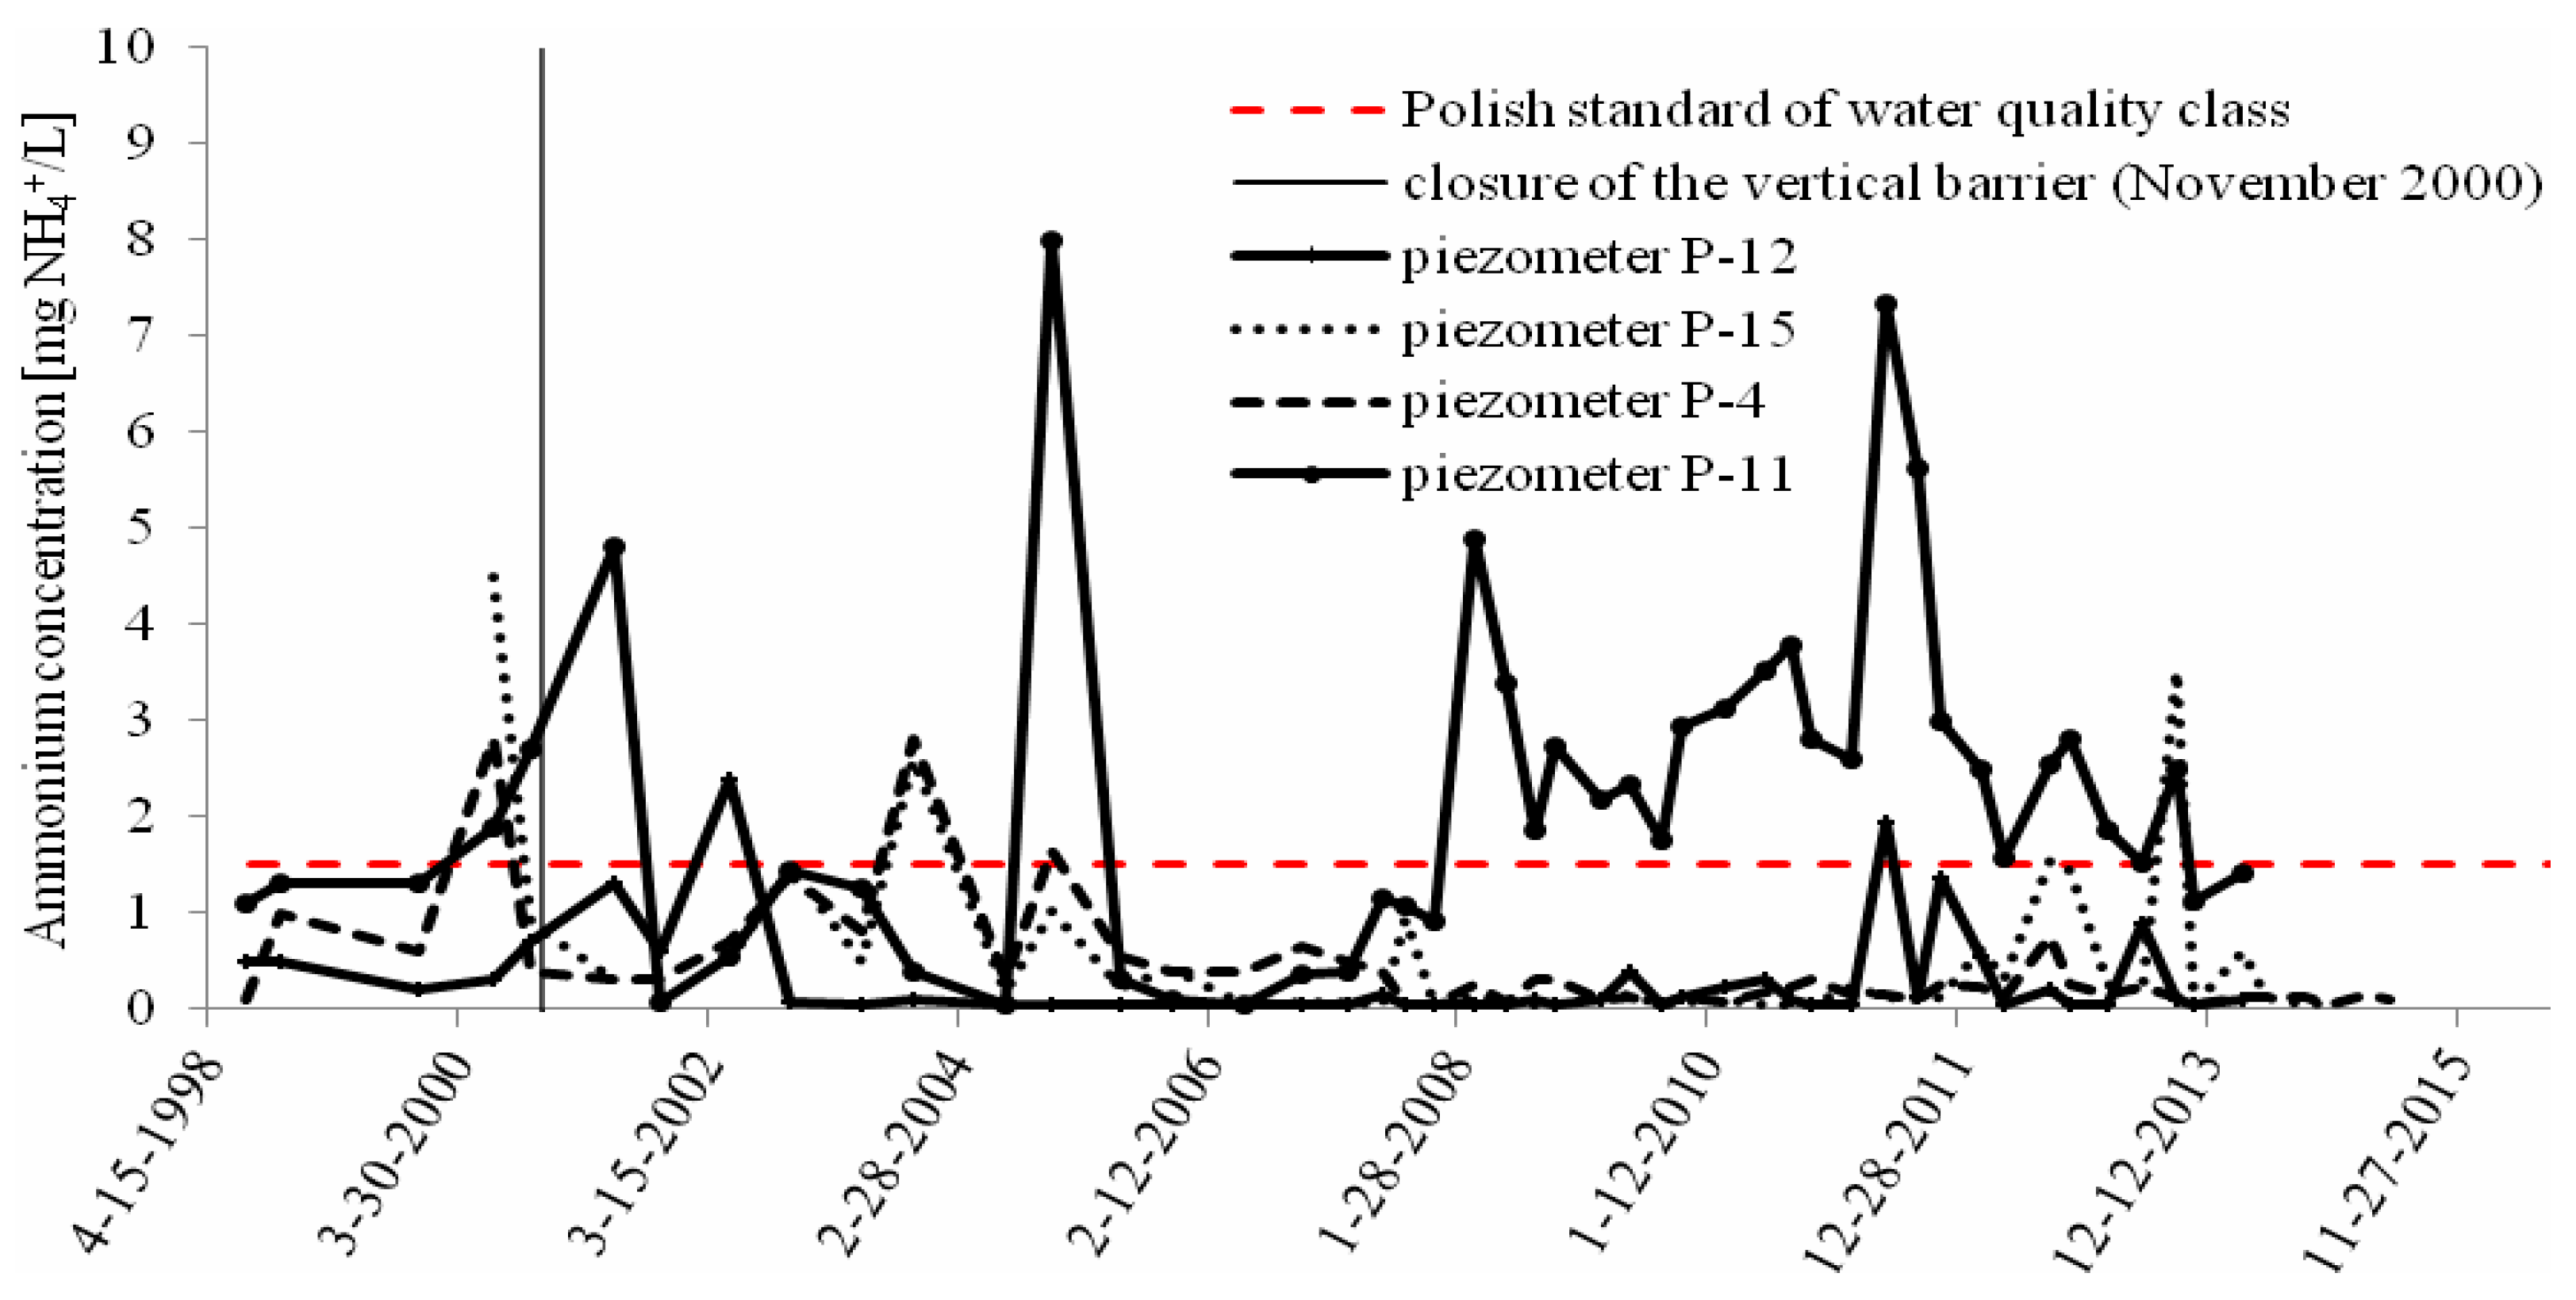
It is very much dependent on the putrefaction of vegetal remnants along the railway siding. The illegal discharge of stormwater from the industrial facilities located near the piezometer is an additional source of contamination for groundwater. The location of the piezometer P-7A (outflow from the west side) is strictly associated with the longest leachate flow and clearly indicates the impact of vertical barrier on the improvement of groundwater quality. The values of ammonium concentration obtained from the period after vertical barrier closure (since November 2000) are lower than the values recommended by Polish standards assigned for the third class of groundwater quality. Results of ammonium concentration in the piezometer P-4 located on the local small hill in the forest (inflow from the southeastern side) are treated as the background of a contamination in analyzed area. Apart from the changes in ammonium concentration before 2005, during almost 10 years of observations, the monitoring data show stabilization and comply with Polish standards. The impact of composting plant on groundwater quality is clearly noticeable in piezometers P-11, P-12 and P-15 (
Figure 6).
Higher concentrations of ammonium in piezometer P-11 result from the local depression where the piezometer is located. Because of its location, water from the railway siding and the composting area, particularly run down to that point. Additionally, an impact on ammonium concentration could have the pipeline discharging the stormwater from the composting square to the local sewage treatment plant located in this area. Piezometer P-12, located at the outflow in the vicinity of the composting square, has been showing significant changes in ammonium concentration since 2011. The concentrations of ammonium in piezometer P-15 located in the neighborhood of composting plant show only insignificant seasonal fluctuations.
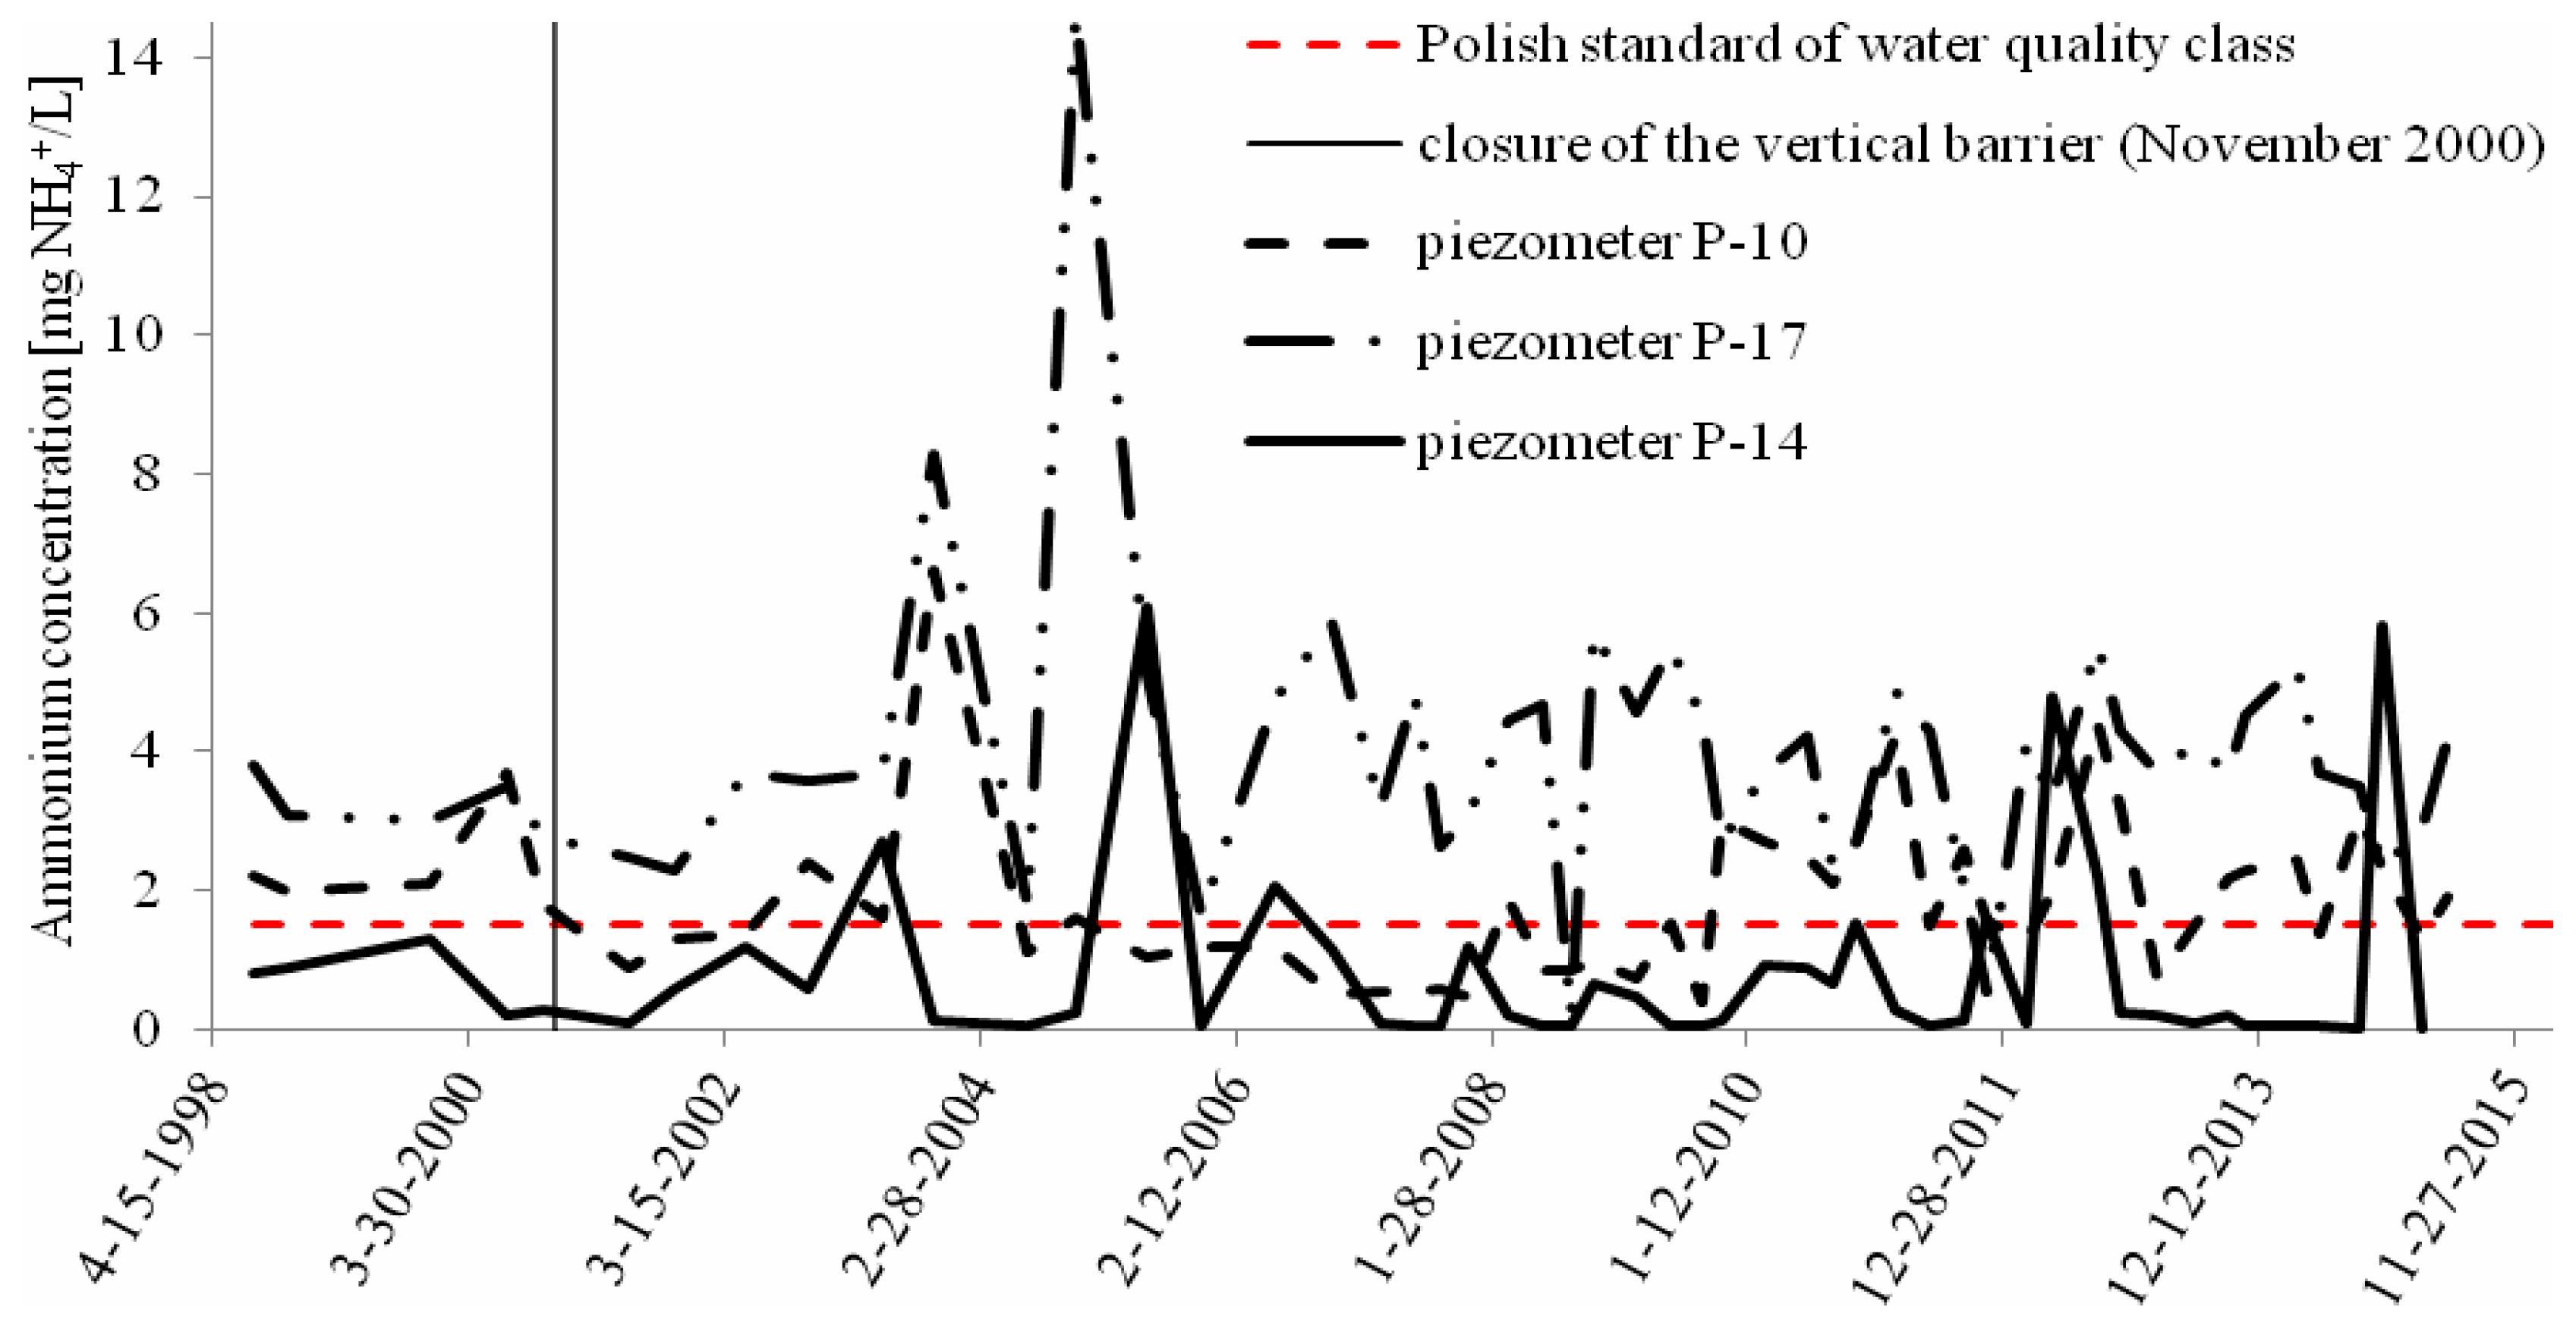
Substantial effect on ammonium concentration in monitored area is shown on the
Figure 7. A development of an adjacent area, including new services and production facilities, should be considered as a main cause of ammonium changes in groundwater in piezometers P-10 and P-17. Exceeded concentrations of ammonium in piezometer P-17 are primarily determined by the runoff from the adjacent street and contaminant inflow from production and service area. Changes in concentrations of ammonium in piezometer P-14 located far from the landfill and the composting plant (on the north side) are considered to be insignificant.
3.3. Statistical Analyses of the Results Collected from Monitoring Network
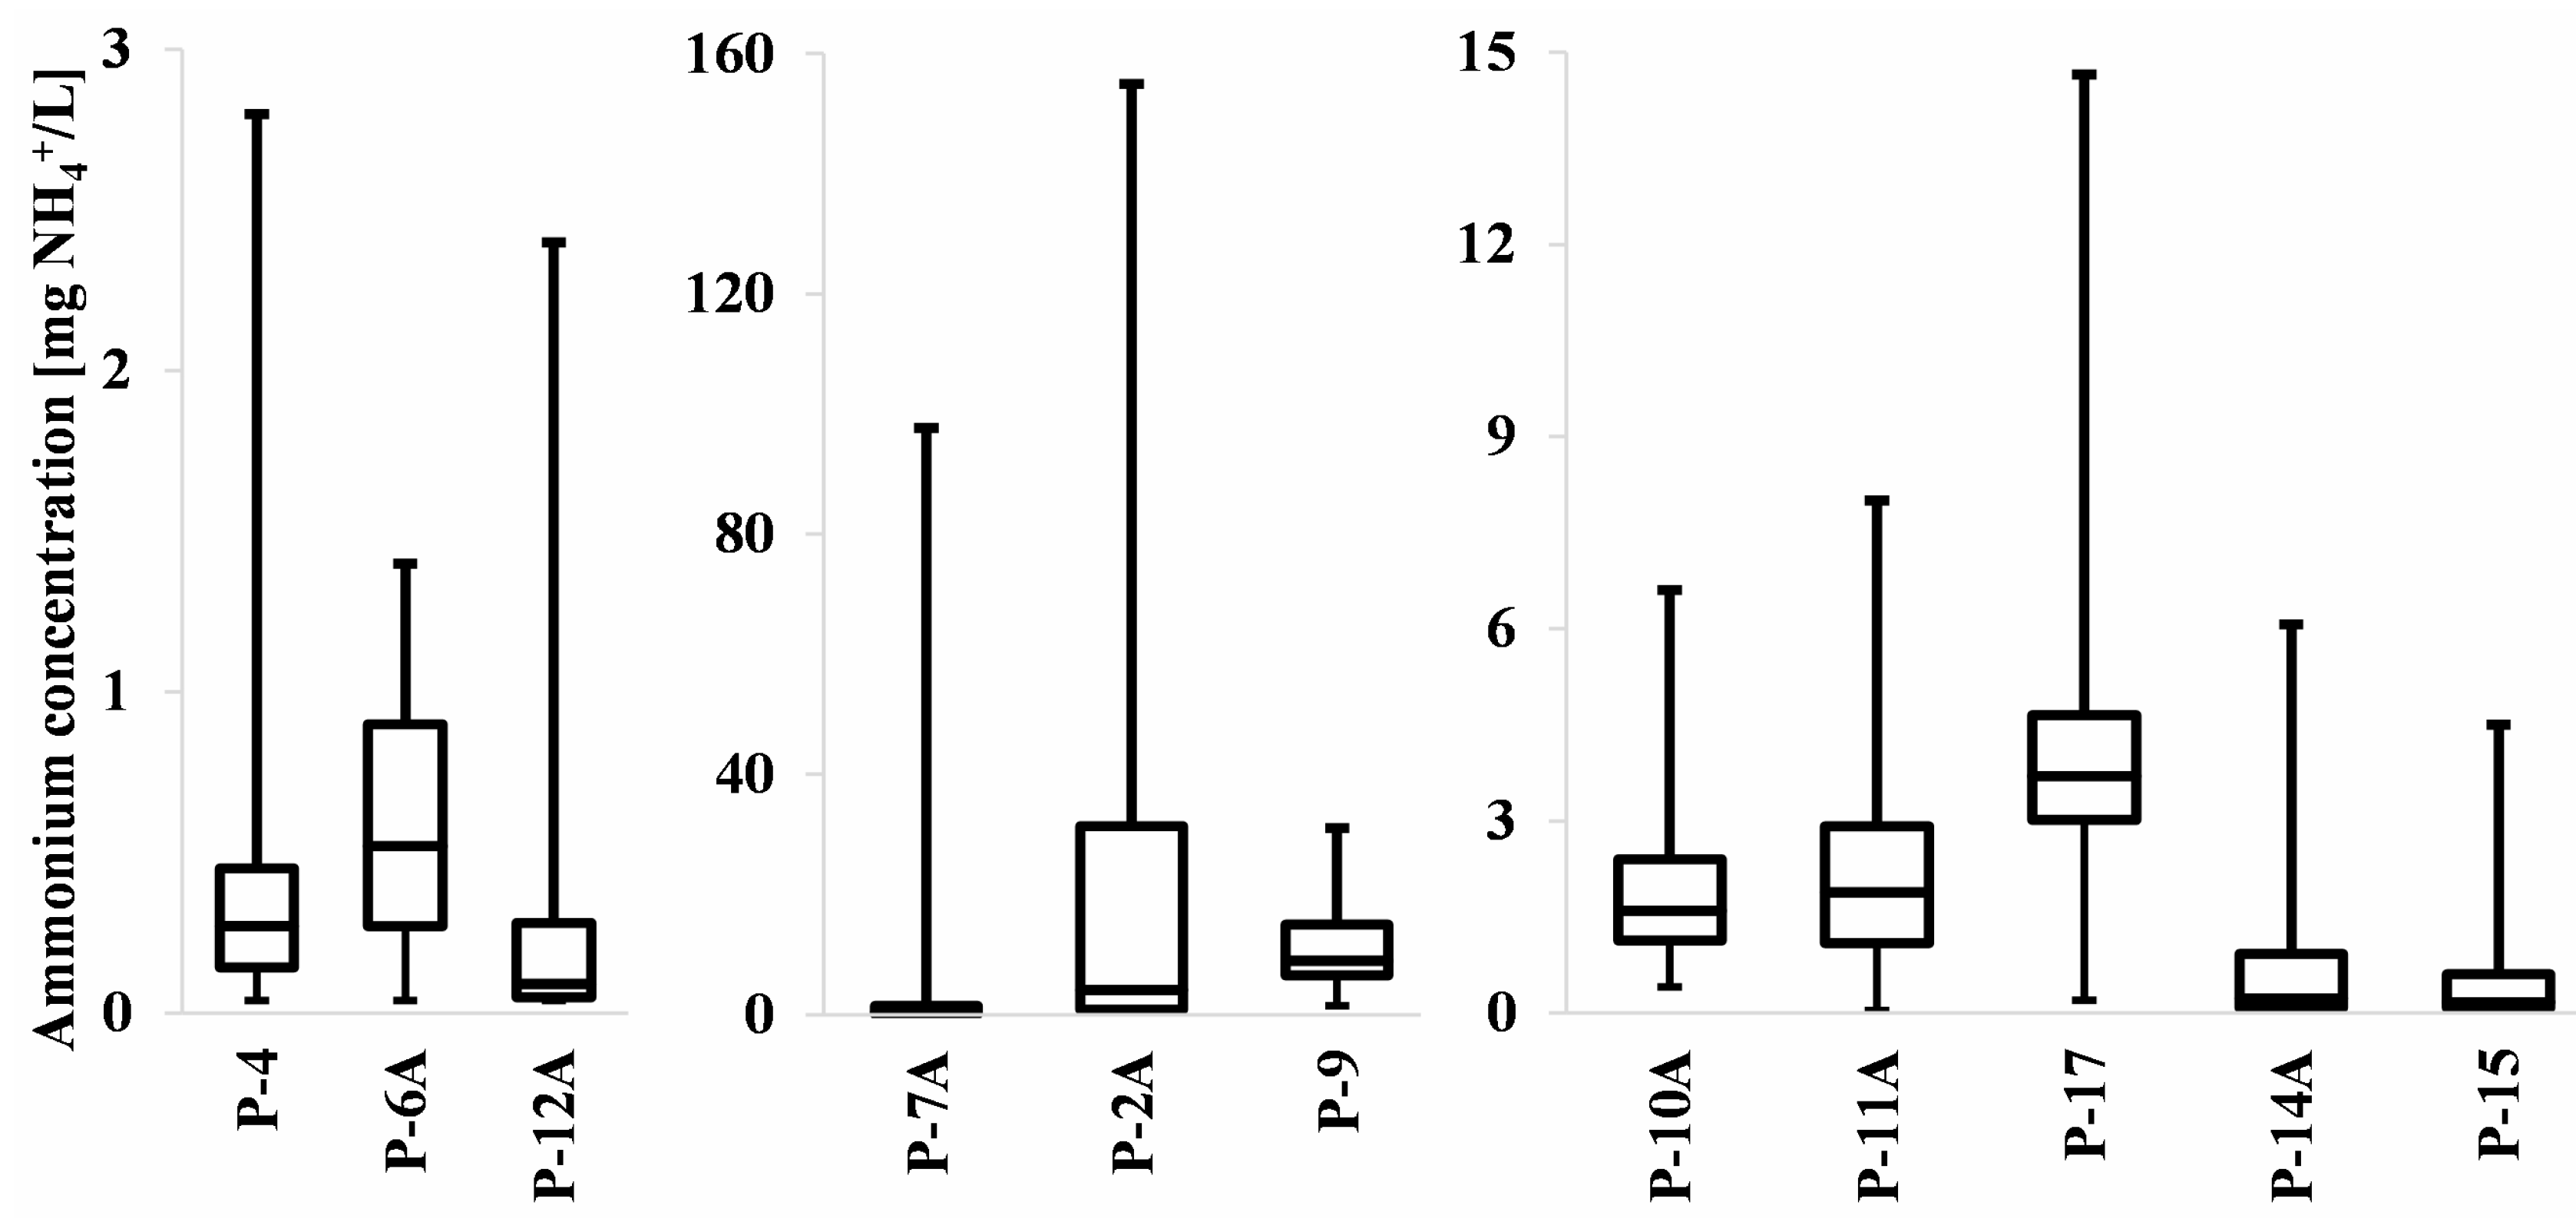
In order to display the entire statistical distribution of a dataset, box-and-whisker plots were used [
48]. The plots displayed in the
Figure 8 show minimum, central and maximum tendency and extreme results of monitoring data. The statistical interpretation of monitoring data is presented in
Table 2.
The results of monitoring data show that minimum concentrations of ammonium are in the range from 0.04 mg NH4+/L for piezometers P-4, P-6A, P-12A, P-7A, P-11A, P-14A, and P-15 to 1.49 mg NH4+/L for piezometer P-9. During the monitoring period 1998–2015, the maximum concentrations are observed in piezometers P-2A, P-7A and P-9 (155 mg NH4+/L, 98 mg NH4+/L and 31 mg NH4+/L, respectively), which is strictly determined by the location of these piezometers, directly in the landfill area. Positive values for the skewness indicate that the monitoring data are skewed right as well as non-normally distributed.
3.4. Ammonium Contamination Distribution and Migration
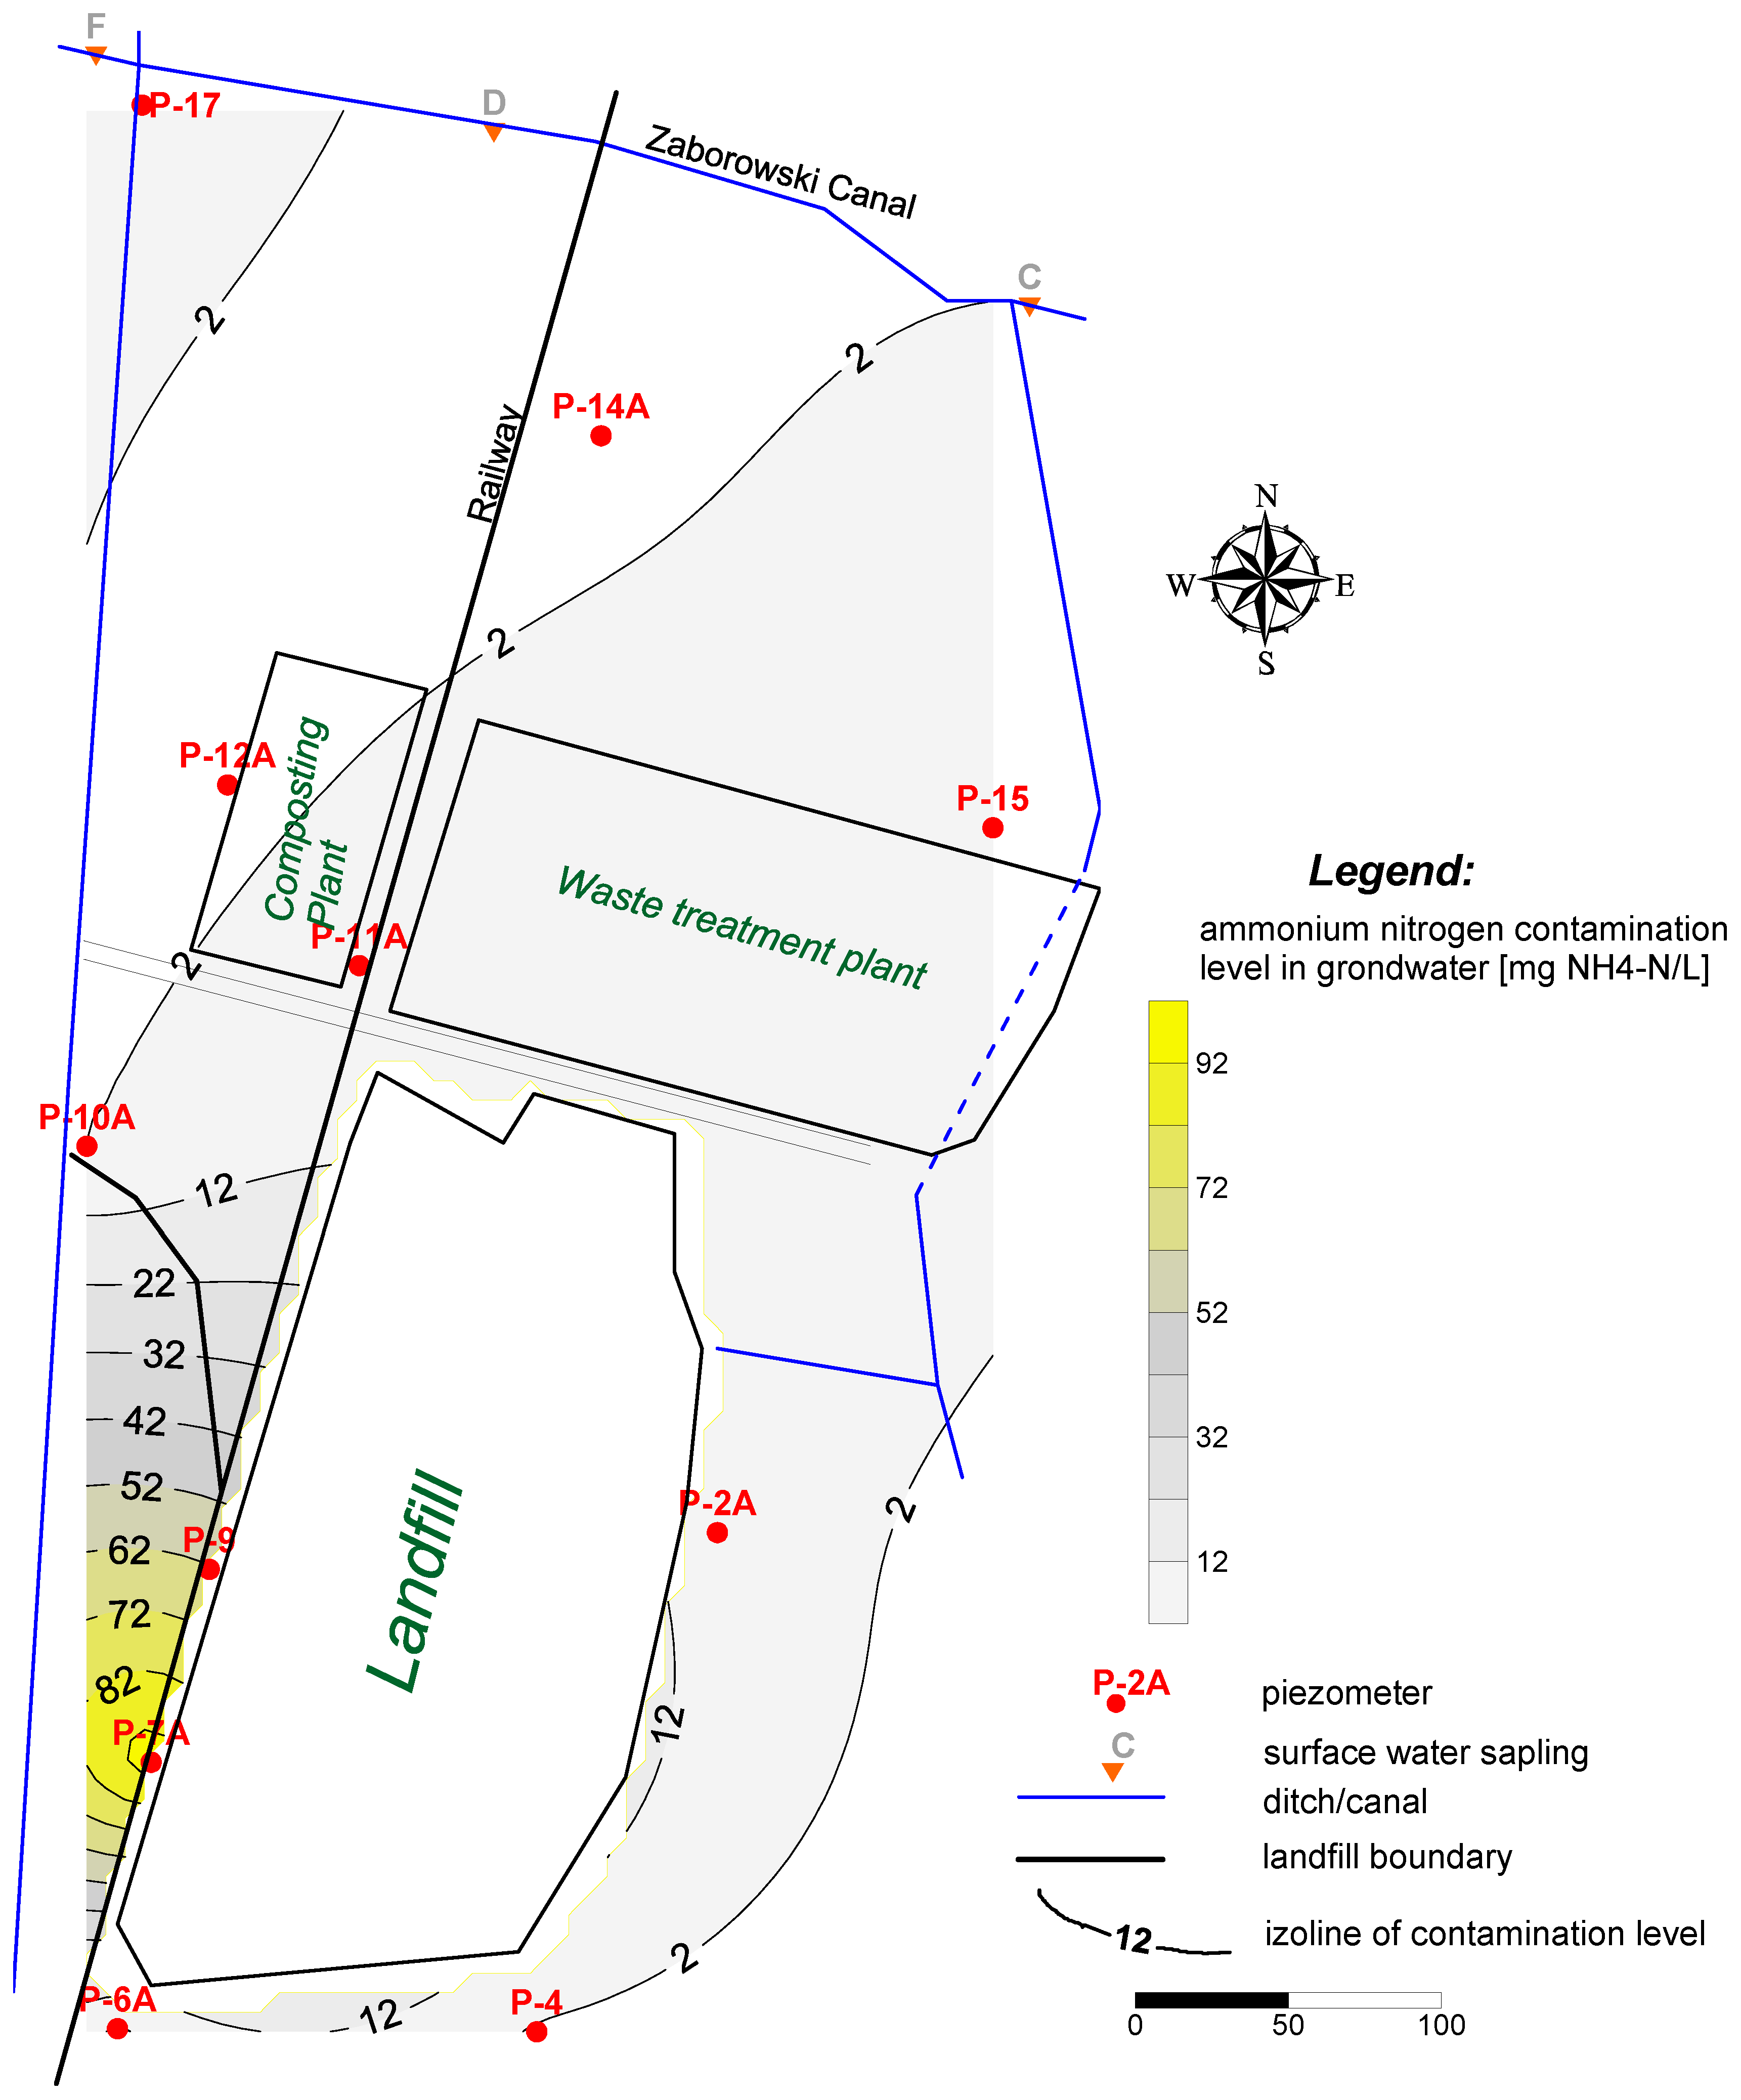
Based on the groundwater monitoring results, several maps of groundwater contamination levels were created. Moreover, mapping of ammonium distribution and migration paths within Radiowo landfill surroundings was also provided. The monitoring data show improvement of water quality in almost every piezometer since the groundwater protection system was installed at the site, which indicates that reduction of ammonium within the vicinity of the landfill is continuously progressing in time. In
Figure 9, the contamination levels are presented for the period before the cut-off wall was constructed. It clearly shows that the concentration reaches the highest levels near piezometer 7A and 9, which was also confirmed by geoelectrical tests.
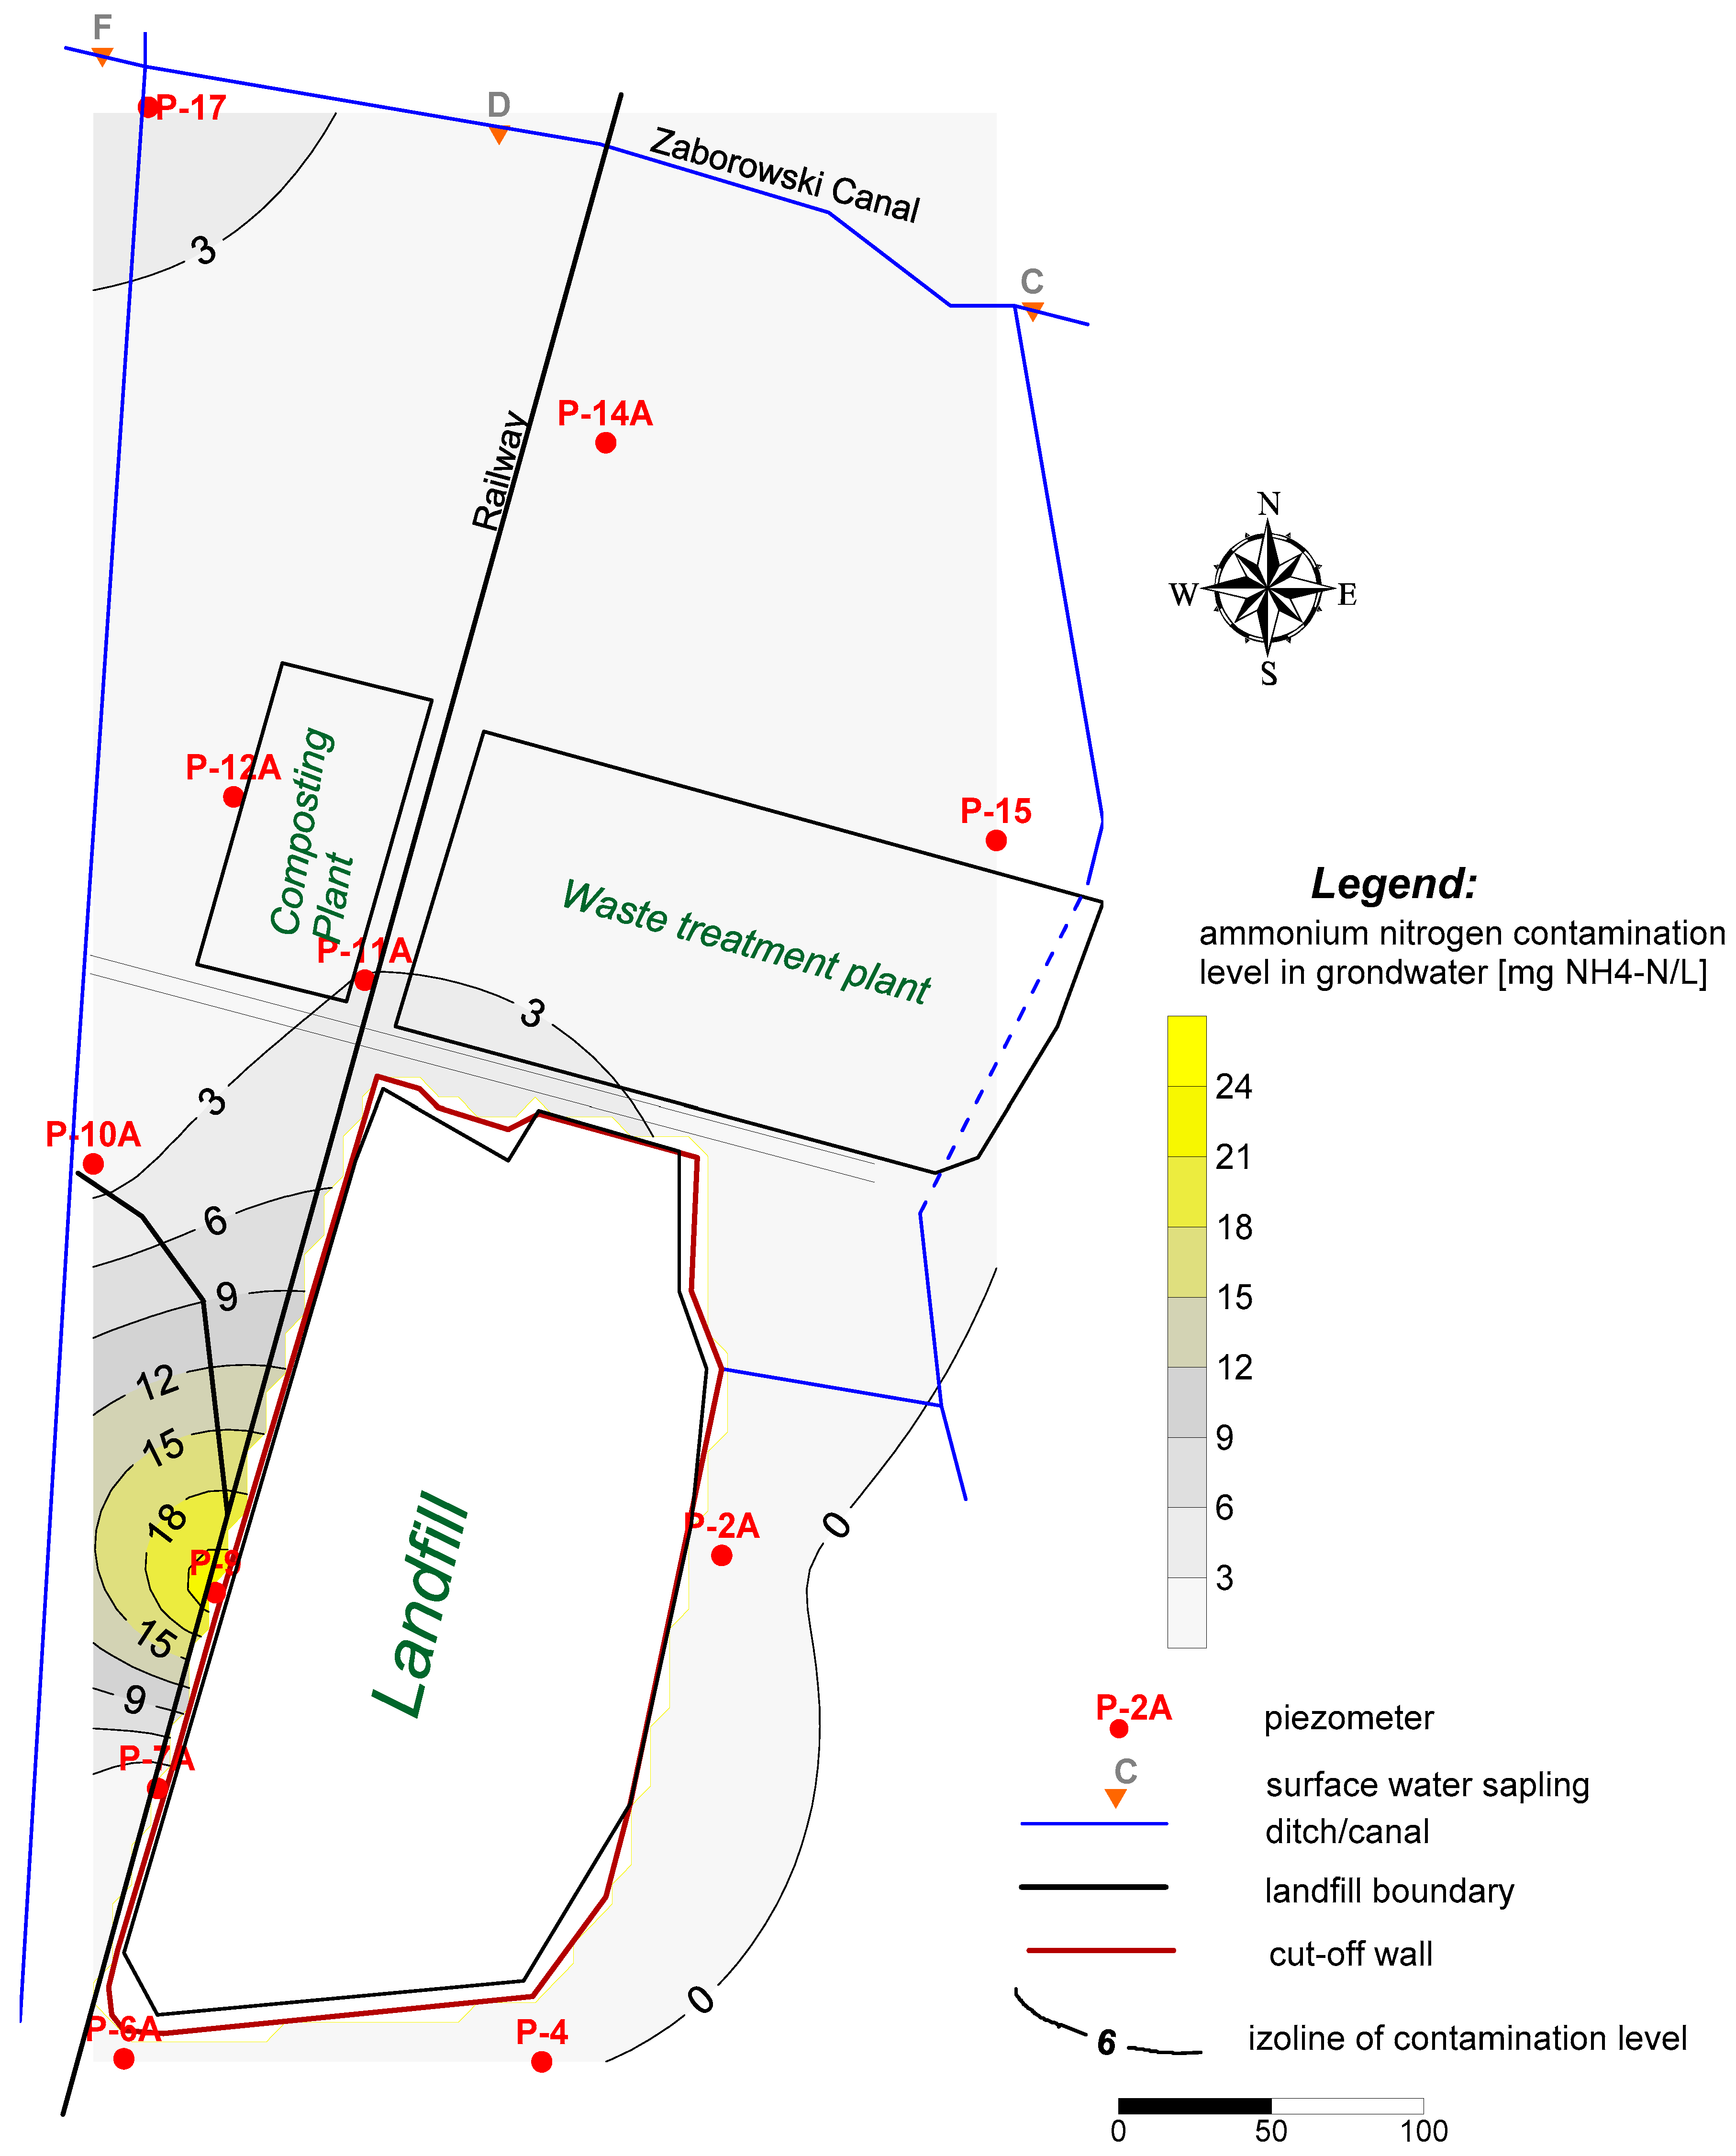
After the reclamation works took place, including the drainage system and the cut-off wall construction, the concentration has continuously dropped. Only seasonal changes due to heavy precipitation and industrial facilities development nearby have caused local increases of contamination level in some piezometers (
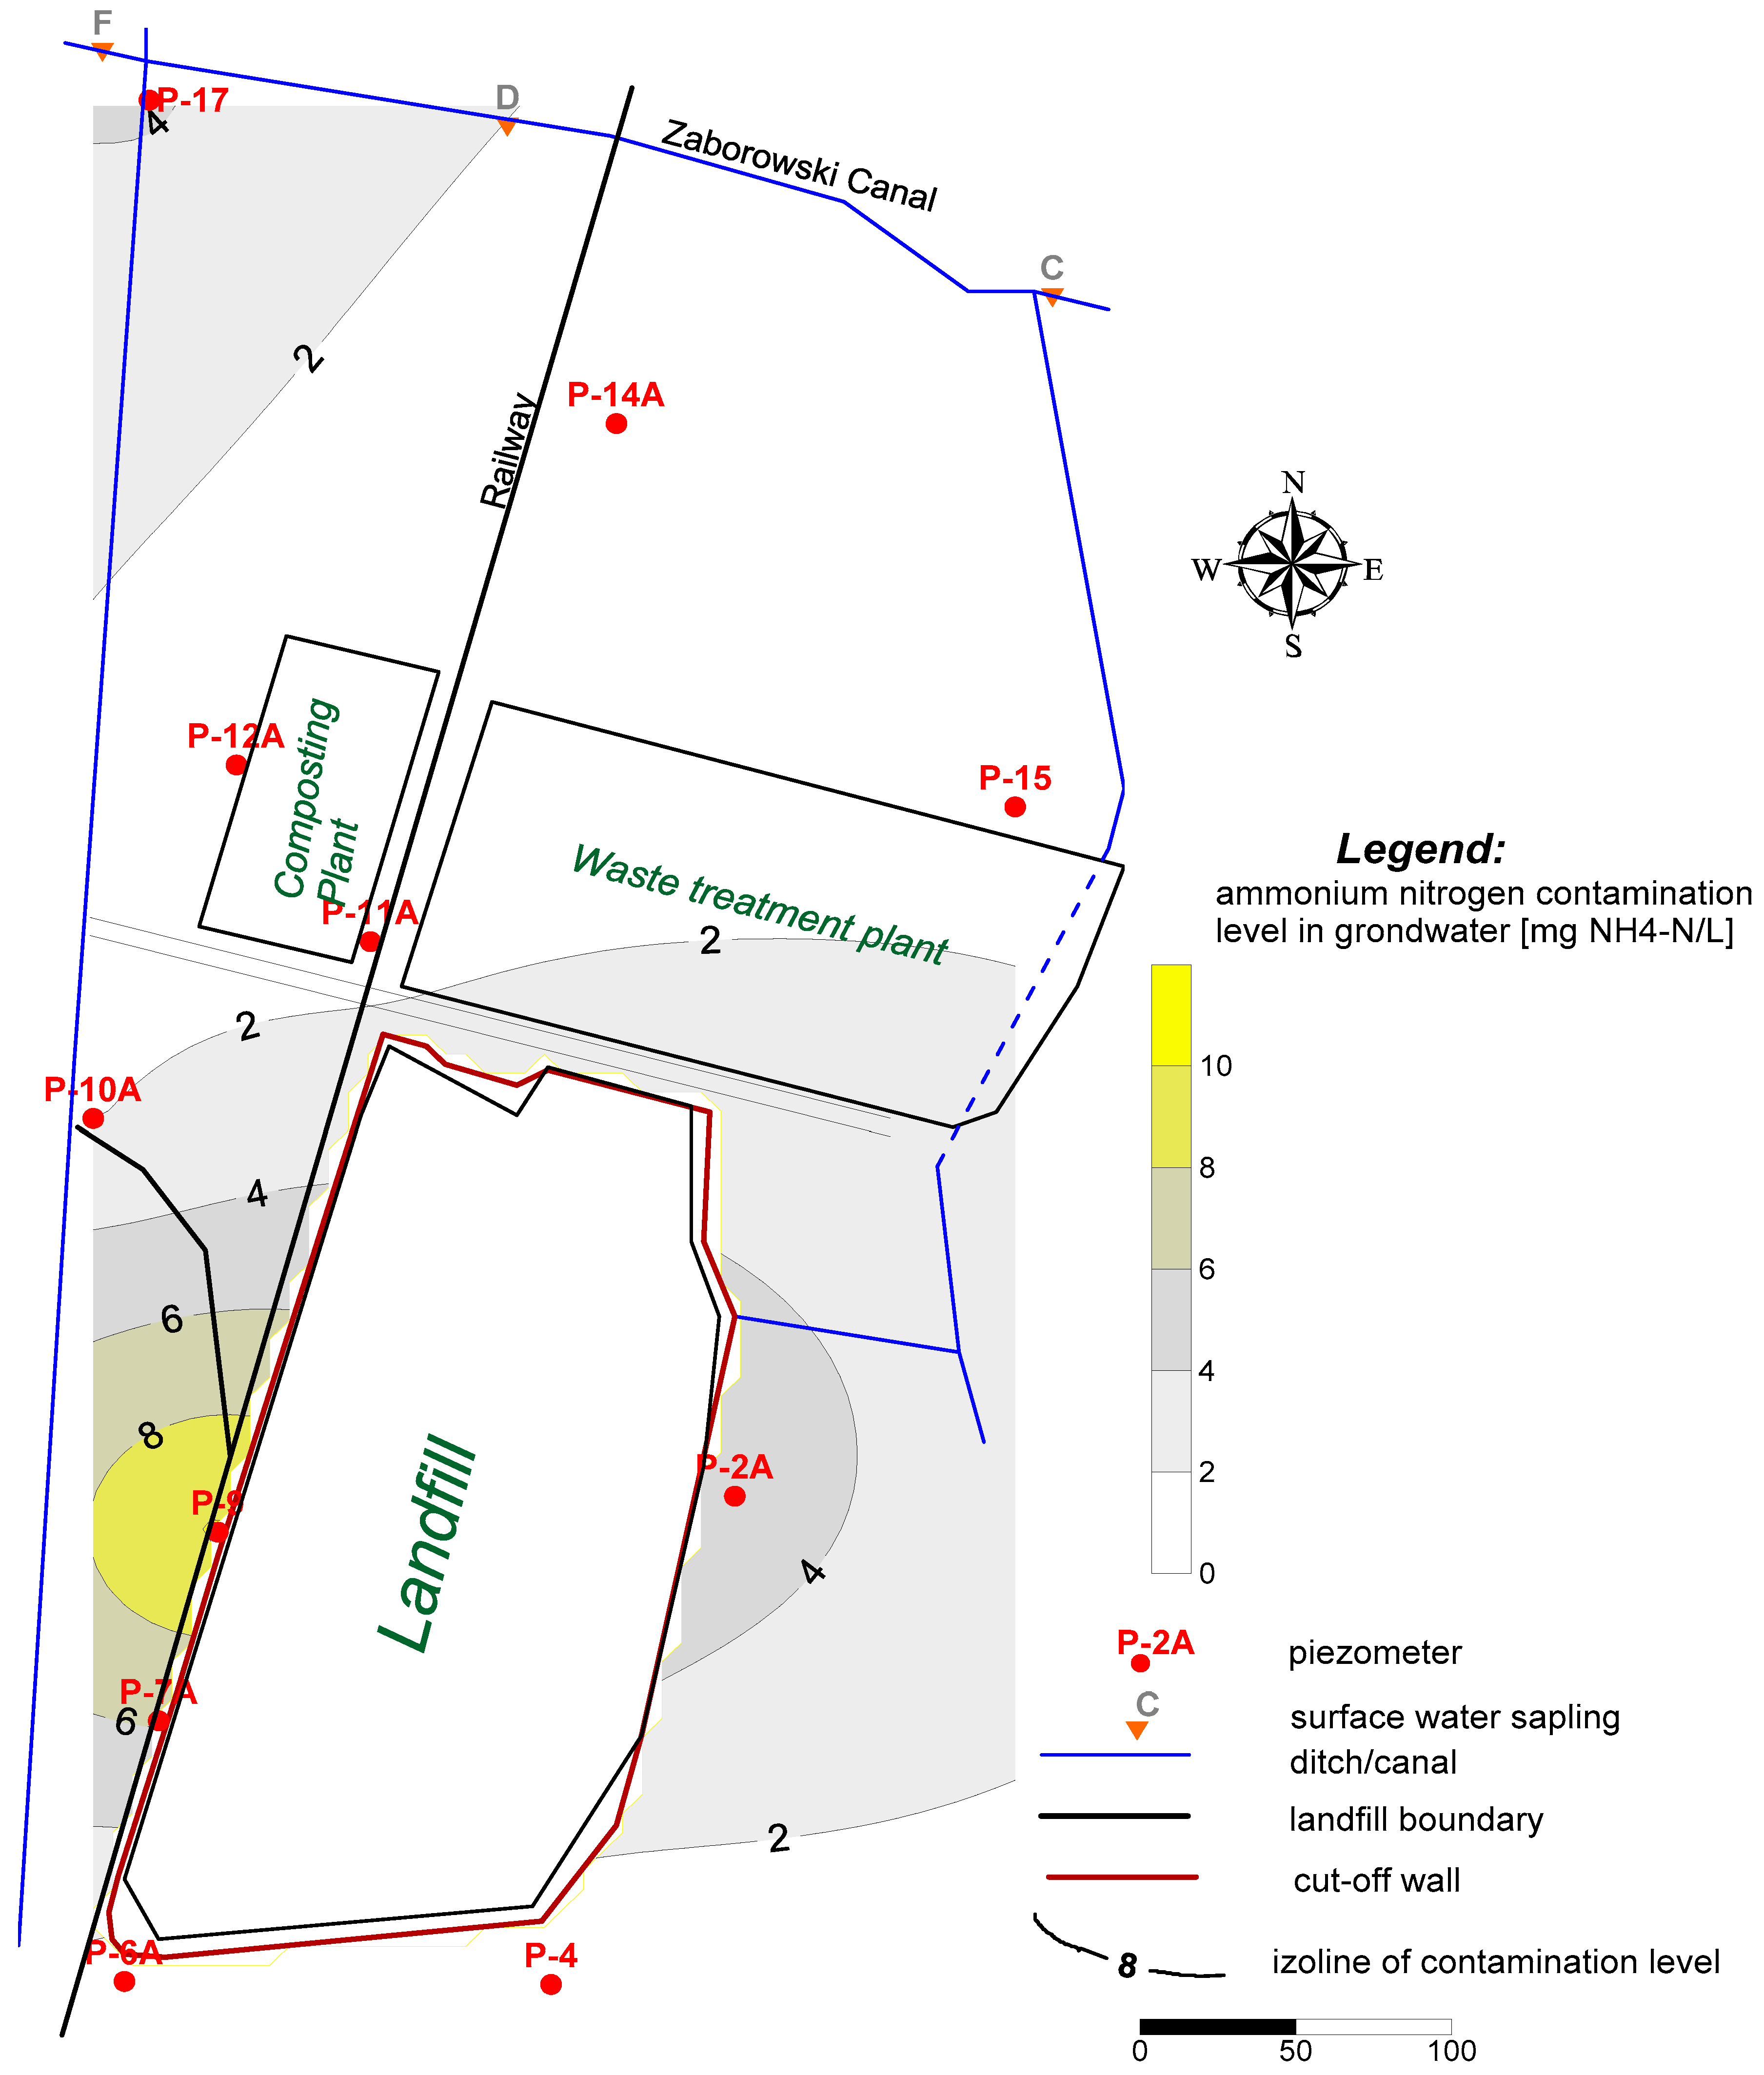
Table 1). To provide a clear picture on how the contamination level and the direction of pollutant migration has changed over time, two more maps were created (
Figure 10 and
Figure 11).
From these maps, it is quite clear that the quality of the groundwater has improved significantly. The plume is moving away from the landfill (towards the groundwater flow) with no further increase in pollution level. The acceptable values, according to standards, are still exceeded but the purification can be noticed. Because of the crucial location of some piezometers, seasonal peaks can be observed, but it is mainly due to the industrial services operating next to the landfill area, as presented in
Figure 1 and
Figure 2. In the past, there were accidents when the sewage from the industrial and urban facilities, located near the landfill, was disposed of illegally. It was also discovered that the sewage paperwork, connected to a building that does not belong to the landfill site, was extensively leaking. All of these reasons show how important it is to wisely position the piezometers to investigate potential sources of pollutions other than the landfill itself.
Figure 11 shows that the latest recorded contamination distribution is still dropping. It was achieved by managing the pollution control difficulties deriving from adjacent services.
The electrical resistivity distribution analyses confirmed a slow migration of contaminants, which were accumulating within the first aquifer in the past, outside the bentonite barrier. Within the saturation zone, insignificant pollutant flow was noticed towards the north and northwest directions. The geoelectrical cross-section (
Figure 3) shows the zone of pollutant stagnation within clay eroded gullies, filled with sandy material. The stagnation zones were formed when the landfill had not yet been isolated, and also the limited groundwater discharge made the self-purification process inefficient. This is confirmed by monitoring the water quality and seasonal changes of groundwater levels (lower the groundwater level, higher the concentration of pollutants). Raised values of ammonium concentration in piezometers P-9 and P-11A are also affected by its specific location, which is on the way of groundwater discharge, and there is also a contamination plume that continuously moves towards the north site.
4. Conclusions
The reclamation works at the site including the construction of vertical bentonite barrier introduced in 2000 and the drainage system helped to obtain significant improvement in the quality of groundwater and surface water in the vicinity of the landfill. The presented case study concerned the groundwater contamination from the landfill located in environmentally valuable area, which was one of the reasons why the remediation process was so important. The concentration of ammonium in samples collected from piezometers has been changing over the monitoring time. The maximum concentrations were recorded in piezometer P-11A in 2001 (readings were affected by pollution discharged from composting plant), then in 2007 in piezometer P-2A (readings mostly affected by woodland waste), and in 2014 the maximum was recorded for piezometer P-9 (readings affected by putrefaction of vegetal remnants along the railway siding, and illegal discharge of stormwater from the industrial facility located near the piezometer). The assumption is that, in these particular locations (where the water in piezometers is still polluted), there could be additional external sources of contamination identified, not necessarily caused by the landfill itself. If the source is located outside the vertical barrier, it will be flushed out in time by the groundwater flowing through the first aquifer.
After a long time monitoring the study site, a significant decrease of pollutant concentration could be observed after the construction of the vertical barrier. Progressive improvement of water quality was observed in almost every piezometer after only a few years since the groundwater protection system was installed. The analysis of water quality results reveals that the vertical barrier has changed positively the basic parameters of the first groundwater layer. Moreover, it is worth noting that this reduction is also supported by natural processes such as self-purification of soil–water environment. It must be emphasized that discharge of leachate containing large concentrations of ammonium and organic substances results in several environmental problems, for example eutrophication and serious pollution to groundwater and surface water as well. The monitoring data results presented in this paper clearly indicate efficiency of vertical barrier application and its crucial role in protecting the soil–water environment from contaminants migration and the risks associated with landfills. It was also proven that wise location of monitoring network allow determination of potential external sources of contamination other than landfills. This could be a hint on how to develop industrial areas in sustainable way, with a minimum environmental nuisance caused.
Author Contributions
Eugeniusz Koda conceived the subject of the paper, performed the literature review and provided the expertise on the research, designed the experimental, and laboratory work and fieldwork. Anna Sieczka was responsible for experimental data analyses, literature review and writing the conclusions of the research, contributed to statistical analyses part and prepared the data set of the research. Piotr Osiński prepared the manuscript, and contributed to writing, figure preparation and data analysis.
Conflicts of Interest
The authors declare no conflict of interest.
References
- Fatta, D.; Papadopoulos, A.; Loizidou, M. A study on the landfill leachate and its impact on the groundwater quality of the greater area. Environ. Geochem. Health 1999, 21, 175–190. [Google Scholar] [CrossRef]
- Slack, R.J.; Gronow, J.R.; Voulvoulis, N. Household hazardous waste in municipal landfills: Contaminants in leachate. Sci. Total Environ. 2005, 337, 119–137. [Google Scholar] [CrossRef] [PubMed]
- Han, D.; Ton, X.; Currell, M.J.; Cao, G.; Jin, M.; Tong, C. Evaluation of the impact of an uncontrolled landfill on surrounding groundwater quality, Zhoukou, China. J. Geochem. Explor. 2014, 136, 24–39. [Google Scholar] [CrossRef]
- Talalaj, I.A. Assessment of groundwater quality near the landfill site using the modified water quality index. Environ. Monitor. Assess. 2014, 186, 3673–3683. [Google Scholar] [CrossRef] [PubMed]
- Abd El-Salam, M.M.A.; Abu-Zuid, G.I. Impact of landfill leachate on the groundwater quality: A case study in Egypt. J. Adv. Res. 2015, 6, 579–586. [Google Scholar] [CrossRef] [PubMed]
- Christensen, T.H.; Cossu, R.; Stegmann, R. Landfilling of Waste: Leachate; Taylor & Francis: Abingdon, UK, 1992. [Google Scholar]
- Christensen, T.H.; Kjeldsen, P.; Bjerg, P.L.; Jensen, D.L.; Christensen, J.B.; Baun, A. Biogeochemistry of landfill leachate plumes. Appl. Geochem. 2001, 16, 659–718. [Google Scholar] [CrossRef]
- Komilis, D.P.; Ham, R.K.; Stegmann, R. The effect of landfill design and operation practices on waste degradation behavior: A review. Waste Manag. Res. 1999, 17, 20–26. [Google Scholar] [CrossRef]
- Iaconi, C.D.; Ramadori, R.; Lopez, A. Combined biological and chemical degradation for treating a mature municipal landfill leachate. Biochem. Eng. J. 2006, 31, 118–124. [Google Scholar] [CrossRef]
- Bhalla, B.; Saini, M.S.; Jha, M.K. Characterization of Leachate from Municipal Solid Waste (MSW) Landfilling Sites of Ludhiana, India: A Comparative Study. Int. J. Eng. Res. Appl. 2012, 2, 732–745. [Google Scholar]
- Nagarajan, R.; Thirumalaisamy, S.; Lakshumanan, E. Impact of leachate on groundwater pollution due to non-engineered municipal solid waste landfill sites of erode city, Tamil Nadu, India. Iran. J. Environ. Health Sci. Eng. 2012, 9, 35. [Google Scholar] [CrossRef] [PubMed]
- Wagh, M.P.; Bhandari, P.K.; Kurhade, S. Ground Water Contamination by Leachate. Int. J. Innov. Res. Sci. Eng. Technol. 2014, 3, 148–152. [Google Scholar]
- Mor, S.; Ravindra, K.; Dahiyaand, R.P.; Chandra, A. Leachate Characterization and Assessment of Groundwater Pollution Near Municipal Solid Waste Landfill Site. Environ. Monit. Assess. 2006, 118, 435–456. [Google Scholar] [CrossRef] [PubMed]
- Kulikowska, D.; Klimiuk, E. The effect of landfill age on municipal leachate composition. Bioresour. Technol. 2008, 99, 5981–5985. [Google Scholar] [CrossRef] [PubMed]
- Akinbile, C.O.; Yusoff, M.S. Environmental Impact of Leachate Pollution on Groundwater Supplies in Akure, Nigeria. Int. J. Environ. Sci. Dev. 2010, 2, 81–89. [Google Scholar] [CrossRef]
- Klinck, B.; Stuart, M. Human Health Risk in Relation to Landfill Leachate Quality; Technical Report WC/99/17; BGS International: Nottingham, UK, 1999. [Google Scholar]
- Singh, U.K.; Kumar, M.; Chauhan, R.; Jha, P.K.; Ramanathan, A.L.; Subramanian, V. Assessment of the impact of landfill on groundwater quality: A case study of the Pirana site in western India. Environ. Monit. Assess. 2008, 141, 309–321. [Google Scholar] [CrossRef] [PubMed]
- Gworek, B.; Dmuchowski, W.; Gozdowski, D.; Koda, E.; Osiecka, R.; Borzyszkowski, J. Influence of a Municipal Waste Landfill on the Spatial Distribution of Mercury in the Environment. PLoS ONE 2015, 10, e0133130. [Google Scholar] [CrossRef] [PubMed]
- Sharifah Norkhadijah, S.I.; Latifah, A.M. The challenge of future landfill: A case study of Malaysia. J. Toxicol. Environ. Health Sci. 2013, 5, 86–96. [Google Scholar]
- Patel, I.A.; Desai, H.H. Ammonium Removal from Landfill Leachate by Chemical Precipitation. Int. J. Innov. Res. Dev. 2014, 3, 116–126. [Google Scholar]
- Koda, E. Local water quality monitoring on surroundings of the sanitary landfill. Ann. Warsaw Agric. Univ. SGGW-AR Land Reclam. 2004, 35, 131–144. [Google Scholar]
- Koda, E.; Osiński, P.; Sieczka, A.; Wychowaniak, D. Areal Distribution of Ammonium Contamination of Soil-Water Environment in the Vicinity of Old Municipal Landfill Site with Vertical Barrier. Water 2015, 7, 2656–2672. [Google Scholar] [CrossRef]
- Ikem, A.; Osibanjo, O.; Sridhar, M.K.C.; Sobande, A. Evaluation of groundwater quality characteristics near two waste sites in Ibadan and Lagos, Nigeria. Water Air Soil Pollut. 2002, 140, 307–333. [Google Scholar] [CrossRef]
- Constable, M.; Charlton, M.; Jensen, F.; McDonald, K.; Craig, G.; Taylor, K.W. An Ecological Risk Assessment of Ammonia in the Aquatic Environment. Hum. Ecol. Risk Assess. 2003, 9, 527–548. [Google Scholar] [CrossRef]
- Lee, M.S.; Lee, K.K.; Hyun, Y.; Clement, T.B.; Hamilton, D. Nitrogen transformation and transport modeling in groundwater aquifers. Ecol. Model. 2006, 192, 143–159. [Google Scholar] [CrossRef]
- Pivato, A.; Raga, R. Tests for the evaluation of ammonium attenuation in MSW landfill leachate by adsorption into bentonite in a landfill liner. Waste Manag. 2006, 26, 123–132. [Google Scholar] [CrossRef] [PubMed]
- Fogg, G.E. Spatial variation in nitrogen isotope values beneath nitrate contamination sources. Ground Water 1998, 36, 418–426. [Google Scholar] [CrossRef]
- Aderemi, A.O.; Oriaku, A.V.; Adewumi, G.A.; Otitoloju, A.A. Assessment of groundwater contamination by leachate near a municipal solid waste landfill. Afr. J. Environ. Sci. Technol. 2011, 5, 933–940. [Google Scholar]
- Cossu, R. Groundwater contamination from landfill leachate: When appearances are deceiving! Waste Manag. 2013, 33, 1793–1794. [Google Scholar] [CrossRef] [PubMed]
- Hossain, M.L.; Das, S.R.; Hossain, M.K. Impact of Landfill Leachate on Surface and Ground Water Quality. J. Environ. Sci. Technol. 2014, 7, 337–346. [Google Scholar] [CrossRef]
- Sieczka, A.; Koda, E. Identifi cation of Nitrogen Compounds Sorption Parameters in the Soil-Water Environment of a Column Experiment. Ochrona Srodowiska 2016, 38, 29–34. [Google Scholar]
- Devlin, J.F.; Parker, B.L. Optimum Hydraulic Conductivity to Limit Contaminant Flux through Cutoff Walls. Ground Water 1996, 34, 719–726. [Google Scholar] [CrossRef]
- Takai, A.; Inui, T.; Katsumi, T. Evaluating the hydraulic barrier performance of soil-bentonite cutoff walls using the piezocone penetration test. Soils Found. 2016, 56, 277–290. [Google Scholar] [CrossRef]
- Rowe, R.K.; Quigley, R.M.; Broker, J.R. Clayey Barrier Systems for Waste Disposal Facilities; Chapman & Hall: London, UK, 1995. [Google Scholar]
- Koch, D. Bentonites as a basic material for technical base liners and site encapsulation cut-off walls. Appl. Clay Sci. 2002, 21, 1–11. [Google Scholar] [CrossRef]
- Lipiński, M.J.; Koda, E.; Wdowska, M.K. Laboratory assessment of permeability of a groundwater protective barrier. Ann. Warsaw Agric. Univ. SGGW-AR Land Reclam. 2007, 38, 69–79. [Google Scholar] [CrossRef]
- Sobik-Szołtysek, J.; Bień, J.B.; Milczarek, M. Analysis of Filtration Coefficient in the Aspect of Possibilities for Application of Alternative Materials in Building Separation Screens in Landfills. Annu. Set Environ. Prot. 2013, 15, 1393–1410. (In Polish) [Google Scholar]
- Anderson, E.I.; Mesa, E. The effects of vertical barrier walls on the hydraulic control of contaminated groundwater. Adv. Water Resour. 2006, 29, 89–98. [Google Scholar] [CrossRef]
- Koda, E.; Osiński, P.; Kołanka, T. Flow and Transport Numerical Modeling as a Method of Efficiency Assessment of Vertical Barriers on Landfill. In Coupled Phenomena in Environmental Geotechnics; Manassero, M., Dominijanni, A., Foti, S., Musso, G., Eds.; CRC Press/Balkema: London, UK, 2013; pp. 693–698. [Google Scholar]
- Zhao, Q.S.; Feng, J.; Guo, X.; Xu, Y.; Zhang, J.W. Cutoff Wall Construction Effect of Groundwater Dynamic in the Lower Area of Dagu River. Adv. Mater. Res. 2013, 663, 789–794. [Google Scholar] [CrossRef]
- Koda, E. Influence of vertical barrier surrounding old sanitary landfill on eliminating transport of pollutants on the basis of numerical modelling and monitoring results. Pol. J. Environ. Stud. 2012, 21, 929–935. [Google Scholar]
- Koda, E.; Skutnik, Z. Quality control tests of vertical bentonite barriers for old sanitary landfill containment. In Proceedings of the 13th European Conference on Soil Mechanics and Geotechnical Engineering, Praha, Czech Republic, 25–28 August 2003; Volume 1, pp. 409–414.
- EN ISO 11732:2005. Water Quality—Determination of Ammonium Nitrogen—Method by Flow Analysis (CFA and FIA) and Spectrometric Detection. Available online: http://www.iso.org/iso/catalogue_detail.htm?csnumber=38924 (accessed on 20 June 2016).
- Regulation of the Minister of Environment Dated 21 December 2015 on the Criteria and Method of Evaluating the Underground Water Condition, Item 85. Available online: http://isap.sejm.gov.pl/DetailsServlet?id=WDU20160000085 (accessed on 22 June 2016).
- Directive 2000/60/EC of the European Parliament and of the Council of 23 October 2000 Establishing a Framework for Community Action in the Field of Water Policy. Available online: http://ec.europa.eu/health/endocrine_disruptors/docs/wfd_200060ec_directive_en.pdf (accessed on 15 June 2016).
- Directive 2006/118/EC of the European Parliament and of the Council of 12 December 2006 on the Protection of Groundwater against Pollution and Deterioration. Available online: http://eur-lex.europa.eu/LexUriServ/LexUriServ.do?uri=OJ:L:2006:372:0019:0031:EN:PDF (accessed on 20 May 2016).
- World Health Organization (WHO). Ammonia in Drinking-Water. In Background Document for Preparation of WHO Guidelines for Drinking-Water Quality; WHO/SDE/WSH/03.04/1; World Health Organization: Geneva, Switzerland, 2003. [Google Scholar]
- Rong, Y. Practical Environmental Statistics and Data Analysis, 1st ed.; ILM Publications: St. Albans, UK, 2011. [Google Scholar]
© 2016 by the authors; licensee MDPI, Basel, Switzerland. This article is an open access article distributed under the terms and conditions of the Creative Commons Attribution (CC-BY) license (http://creativecommons.org/licenses/by/4.0/).


