1. Introduction
The worldwide economic and population growth continue to be the most important drivers of increases in carbon dioxide (CO
2) emissions, fossil fuel combustion, and industrial processes contributing to approximately 78% to the total emission increase [
1]. Effective solutions for reducing the concentration of CO
2 in the atmosphere are: energy-efficiency enhancement, including building design [
2] and urban planning [
3,
4], reduction of CO
2 emissions exploiting renewable energy resources [
5], and carbon capture and sequestration [
6,
7]. The CO
2 removal with adsorption-based techniques can be easily pursued for several applications thanks to their low operational requirements, ease of control, and high efficiency [
8].
Selective physical adsorption of gas mixture species can be obtained with pressure swing adsorption (PSA) coupled with vacuum swing adsorption (VSA) [
9,
10]. Common applications are the removal of carbon dioxide from CO
2/CH
4 mixtures to produce purified natural gas and biomethane [
11,
12,
13] and carbon capture and sequestration [
14].
The use of an appropriate adsorbent is necessary to successfully design an adsorption-based apparatus. Desirable characteristics of an optimal adsorbent are a high adsorption capacity, a low regeneration heat, and a low purchase cost [
15]. Several adsorbents have been proposed for carbon dioxide adsorption, including activated carbon [
16], T-type zeolite [
17], 13X and 5A zeolites [
18], metal organic frameworks [
19], and clays [
20].
Tuff is a highly-porous volcanic rock commonly utilized by vernacular architecture, and particularly widespread in Italy as it is abundant at the surface and easy to manufacture [
21,
22]. It is a mix of natural zeolites and its composition makes it a very interesting alternative to synthetic zeolites for CO
2 adsorption via PSA techniques. It is also available in small particles, at almost no cost except for shipping, as a byproduct of the building industry. The aim of this work is to quantitatively characterize the adsorption capacity of tuff and provide the basic information for its exploitation in PSA applications. Several experimental activities were performed: mercury intrusion porosimetry [
23] was used to determine the tuff superficial pore size, pore distribution, and other relevant physical properties. A custom apparatus was set up in order to reproduce the adsorption process under controlled working conditions and measure the saturation level of tuff and the amount of adsorbable CO
2 before the breakthrough point is reached. Data obtained from the experimental campaign were used to model the CO
2 adsorption using a computational fluid dynamic (CFD) approach, with the goal of developing a useful tool for real PSA applications design. A second custom apparatus was designed to measure the maximum adsorption capacity of natural and synthetic zeolites under equilibrium conditions via a volumetric method [
24,
25]. A range of equilibrium pressures at different operative temperatures was investigated and a comparison between the adsorption performance of tuff and synthetic zeolite 13X is presented.
Section 2 introduces the used material, pretreatment techniques, and the laboratory characterization of particle properties. A detailed description of the custom experimental apparatus is given in
Section 3, and results for data analysis and modeling are presented along with the used methodology.
Section 4 contains a discussion of the results. Conclusions are summarized in
Section 5.
2. Tuff Physical Properties
2.1. Tuff Samples
In this work, tuff samples provided by the “
Piandirena” quarry located in Sorano (GR), Italy, were used. The chemical composition, according to a previous analysis [
26], includes chabazite (65 ± 5)%, phillipsite (3 ± 2)%, K-feldspate (10 ± 3)%, augite (2 ± 1)%, mica (5 ± 2)%, and volcanic glass (15 ± 4)%.
For comparison purposes, three different samples were initially separated from the same stock. Before each experimental activity, samples were pre-treated and weighted. Pre-treatment is a crucial part of the process, and it was found that the optimal procedure consists in removing tuff dust off of the tuff particles surface using compressed air or running water and a subsequent thermal regeneration. The regeneration and activation step is needed to ensure an optimal performance of zeolites, paying attention to avoid irreversible changes in their structure [
27]. No differences, in terms of CO
2 adsorption capacity, were observed between air and water cleaning. Thermal regeneration, on the other hand, was found to be a relevant parameter.
As described in the following sections, two different thermal regeneration temperatures were considered: 220 °C and 350 °C. In both cases regeneration took place overnight for a period of approximately 12 h. The first regeneration temperature was used to reproduce the same conditions of previous literature works [
27]. Thermogravimetric analysis of exhausted tuff particles, however, shows a measurable mass loss up to approximately 350 °C. This second regeneration temperature was also considered during the adsorption isotherm experiments to test the maximum adsorption capacity of the material.
During adsorption experiments, carbon dioxide and nitrogen, with a purity of 99.7% and 99.999%, respectively, were used. Here we have made the assumption that nitrogen is negligibly adsorbed by tuff particles. This assumption is supported from preliminary results showing no detectable adsorption using an experimental layout similar to that in
Section 3.1. During the experimental campaign, nitrogen was used either as purge gas or in place of methane to reproduce the required inlet gas mixture. Future analyses will be conducted in a safe environment using a real CH
4/CO
2 mixture.
2.2. Mercury Intrusion Porosimetry
The performance of a porous solid used as an adsorbent is highly influenced by its internal pore structure [
26,
28,
29] and, hence, it is necessary to have a detailed knowledge of the geometry and topology of the internal pore network. To this aim, several techniques are available [
30,
31,
32,
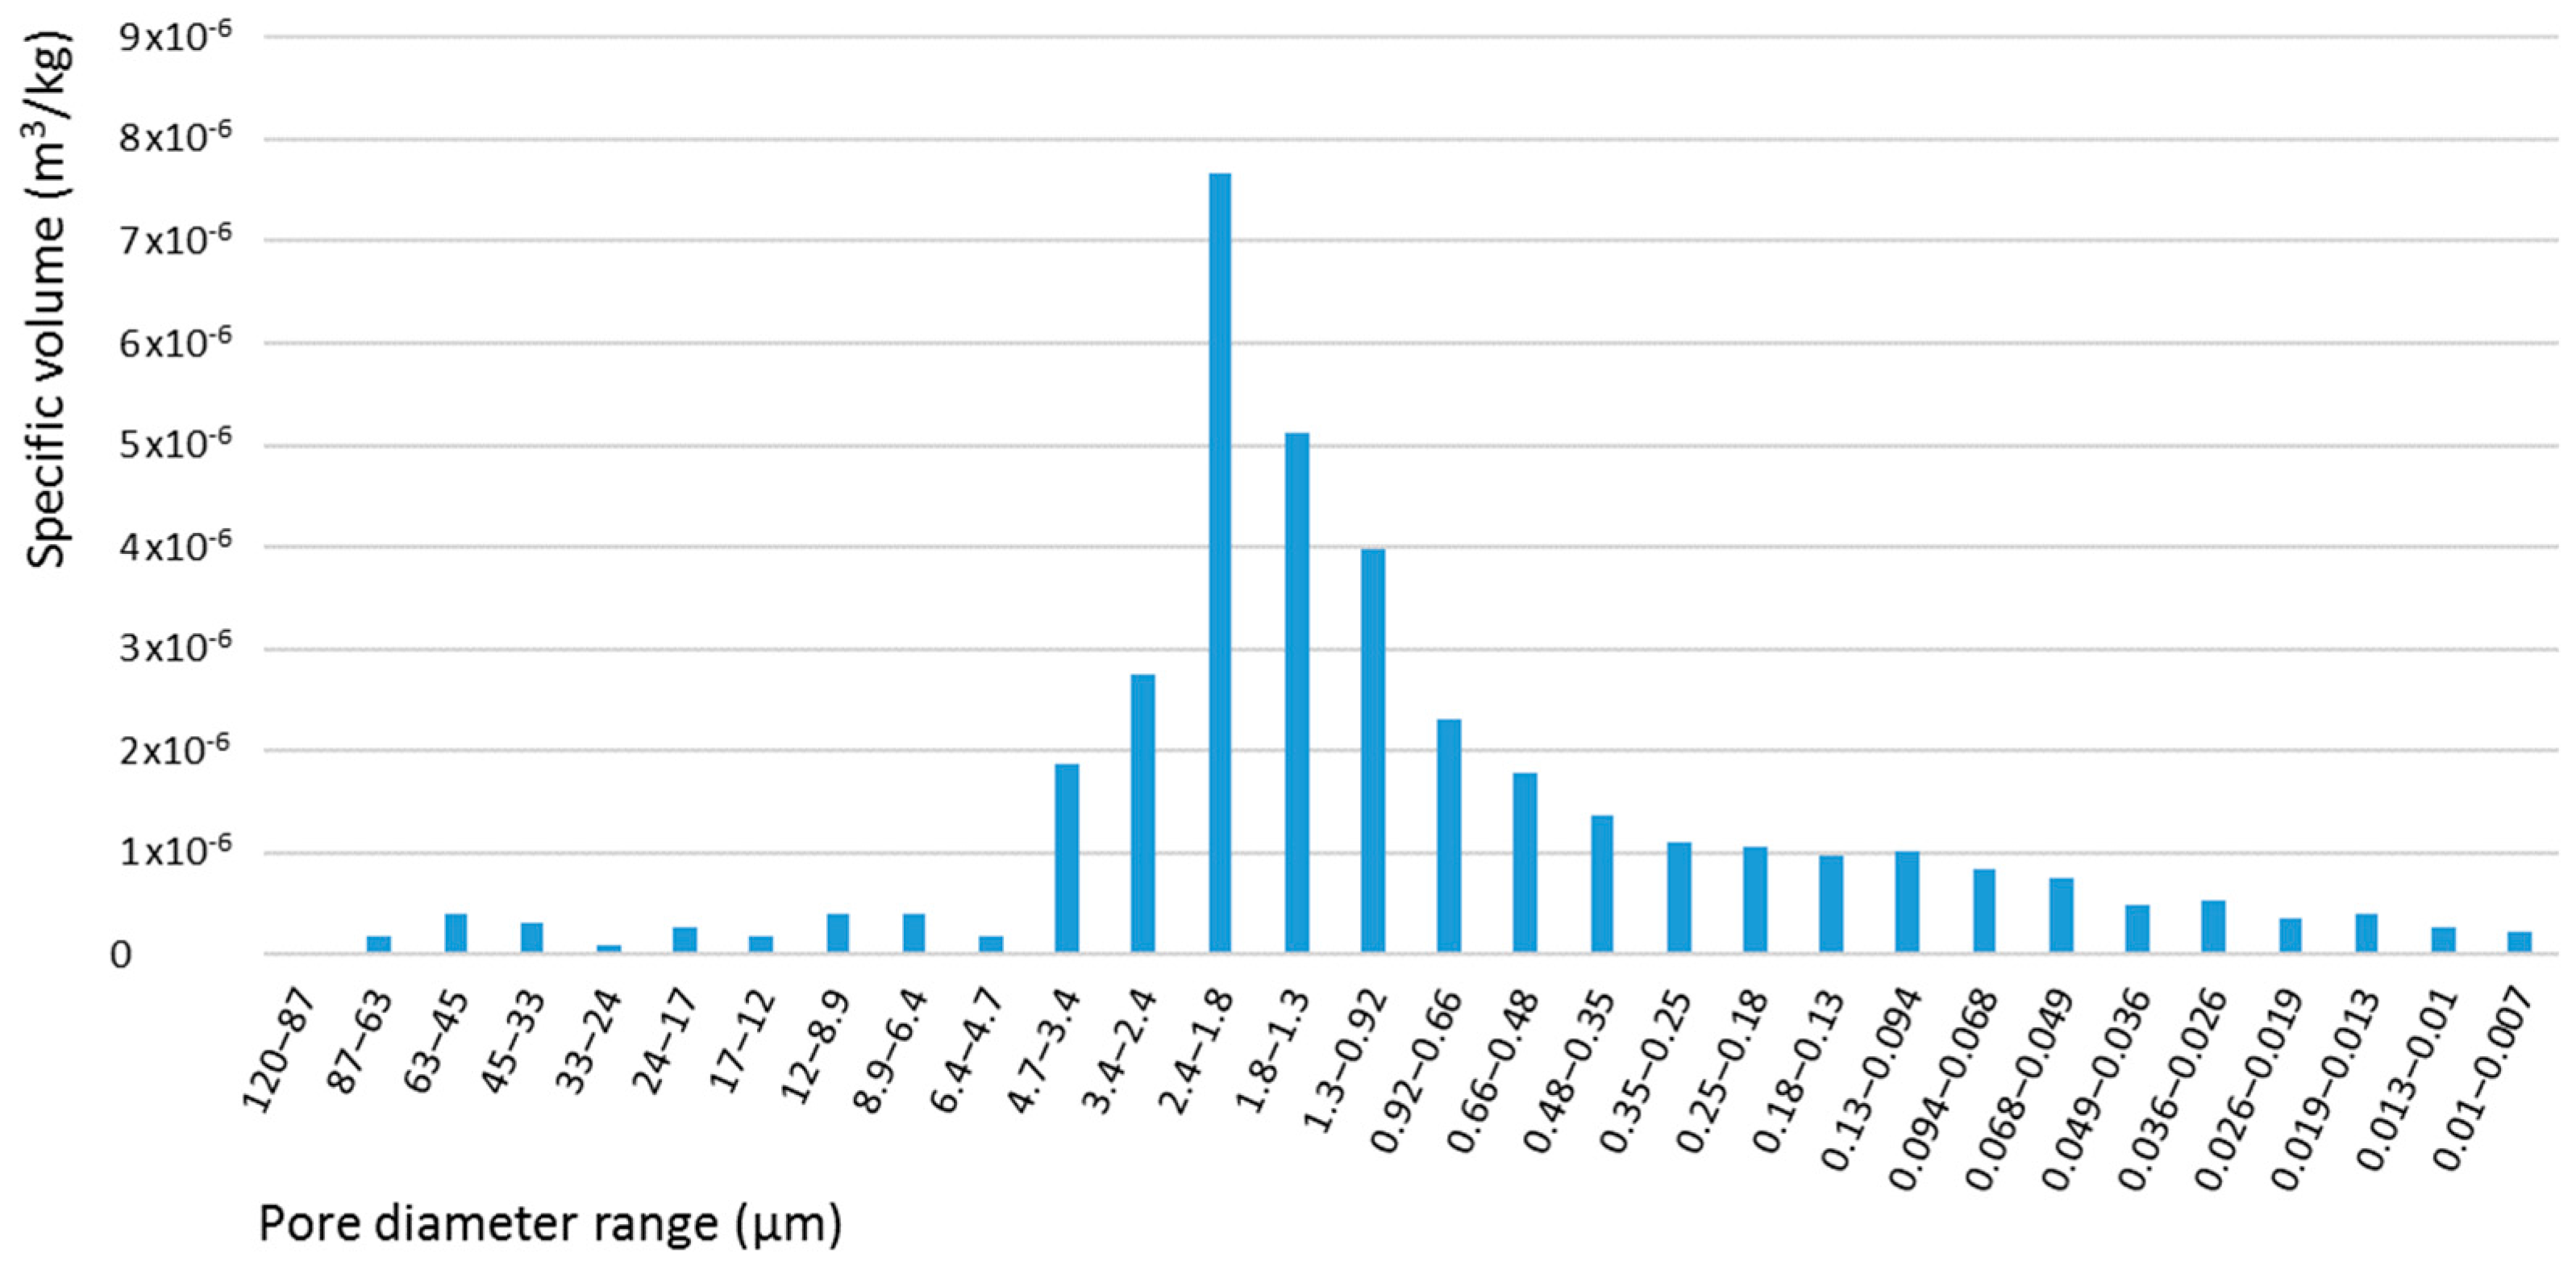
33]. Mercury intrusion porosimetry was used in this work to determine the pore spatial distribution of tuff and other properties, such as porosity and bulk (i.e., particle) density. With this technique, however, it is only possible to explore pore sizes down to mesopore scales: a complete characterization of pore distribution should explore smaller sizes, down to the micropore scale, which are more relevant for adsorption processes of natural zeolites, and it would require different experimental techniques.
Tuff samples were analyzed in sequence using two porosimeters (mod. Pascal 140 and mod. Pascal 240 ThermoscientificTM, Waltham, MA, USA), each one characterized by two different maximum working pressures. The low-pressure porosimeter can operate to a maximum pressure of 400 kPa, measuring pores with diameters between 4 μm and 120 μm. The high-pressure porosimeter can operate to a maximum pressure of 200 MPa, measuring pores with diameters between 0.0074 μm and 15 μm.
Measured data (
Table 1) show a wide range of variability. This is most likely related to the high heterogeneity of physical and chemical properties of tuff [
26], and to the low capacity of porosimeters, which can characterize only small samples (few grams, i.e., a few particles) at a time. The measured pore size distribution is shown in
Figure 1. According to results, the tuff surface is mainly characterized by macropores with a diameter between 2 μm and 4 μm, with a specific volume of 1.31 × 10
−4 m
3/kg.
The skeletal density
(i.e., density of tuff solid matter only) was calculated using the following equation:
where
and
P are the measured particle density and porosity, respectively.
3. Adsorption Analyses
The characterization of the adsorption properties of tuff was performed following two different approaches and running independent experiments. The selective adsorption of CO
2 from a gaseous mixture in the transient regime was investigated monitoring the inlet and outlet composition flowing through a cartridge containing tuff (
Section 3.1). The maximum adsorption capacity at equilibrium was evaluated using a temperature- and pressure-controlled apparatus (
Section 3.2). CFD simulations of the adsorption process in transient regime is also presented in the subsection of
Section 3.1.
A preliminary analysis of N
2 adsorption in tuff particles was carried out under ambient conditions using a simplified layout similar to that in
Figure 2. A sample of 533.09 g was flown with pure N
2 until equilibrium is reached. The sample weight increase is 0.23 g, resulting in less than 0.0005 kg
N2/kg
Tuff. The same procedure was also performed using pure CO
2: the mass increase is 40.36 g, corresponding to an approximate adsorption capacity of 0.076 kg
CO2/kg
Tuff, which is consistent to that shown in more accurate results from adsorption isotherms (see
Section 3.2).
3.1. Saturation Curves
When a mix of inert (e.g., N
2) and adsorbable (e.g., CO
2) gases is flown through an adsorbent (e.g., tuff), the outlet composition varies as the amount of adsorbed gas increases and the adsorbent becomes saturated, losing its ability of capturing further gas molecules. Common applications, like biogas upgrading, require the outlet mixture not to exceed some reference level of CO
2 (i.e., the breakthrough point). Transient-regime analyses of the adsorption process that monitor the gas composition at outlet as a function of the cumulative adsorbed CO
2 are often carried out using breakthrough (or saturation) curves [
34]. In particular, they are necessary to characterize the saturation level for a defined quantity of adsorbent under a specific set of operative conditions. After each measurement, the adsorbent cartridge has to be refilled with freshly pre-treated adsorbent. The exhausted adsorbent can be regenerated for reuse. The regeneration temperature used during this analysis is 220 °C.
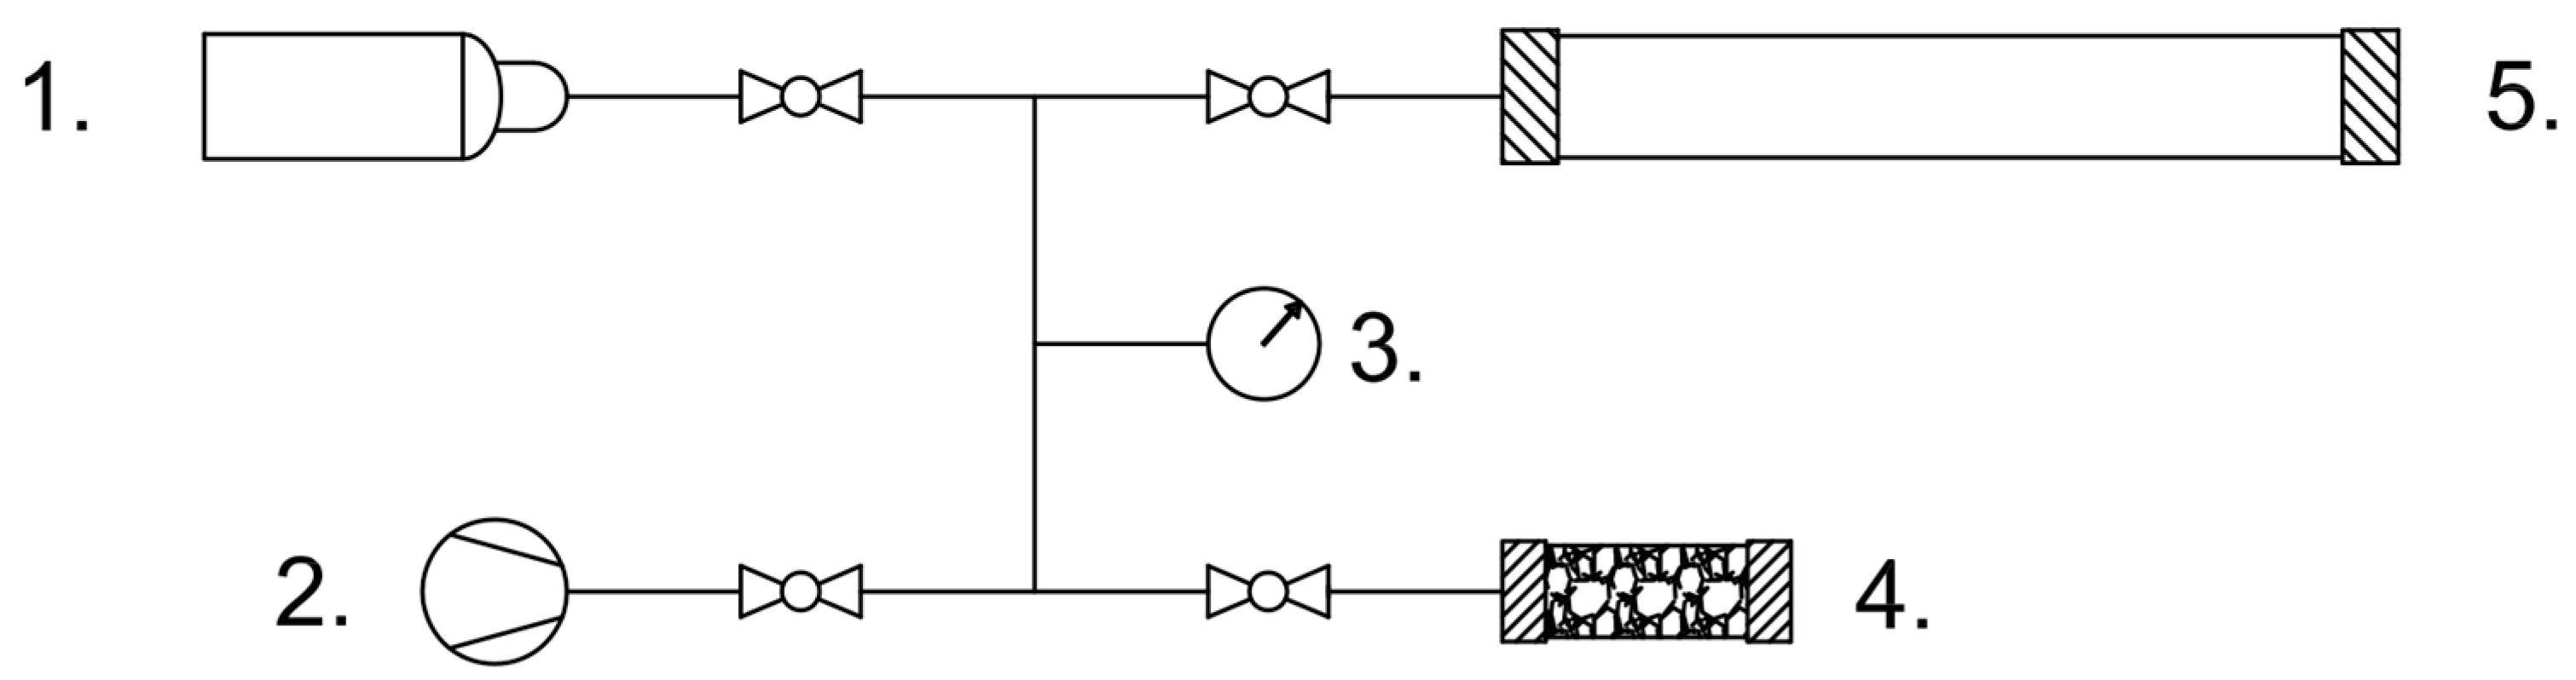
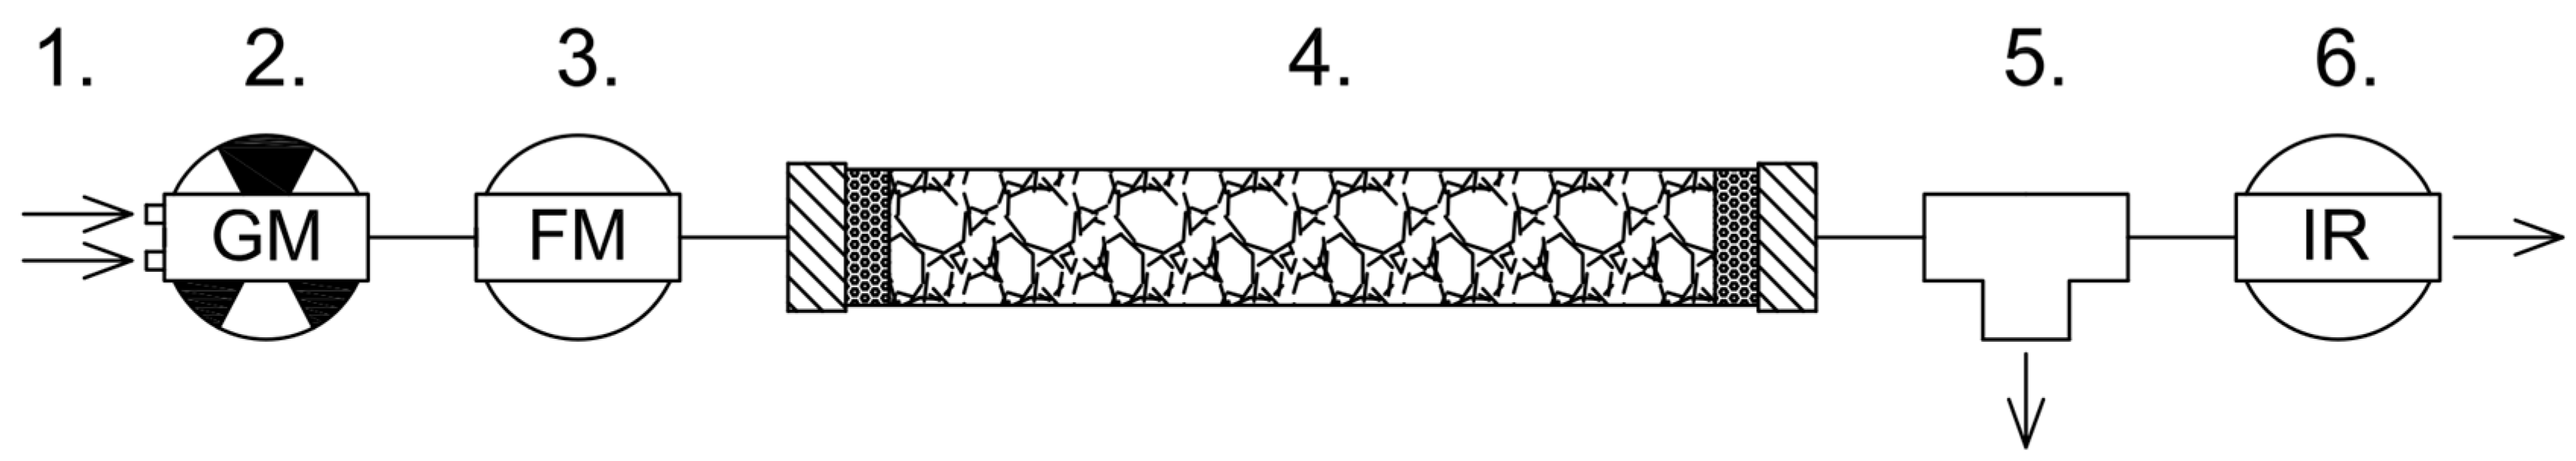
The laboratory setup used to measure tuff saturation curves is shown in
Figure 2. It includes a gas mixer (mod. MM-Flex WITT-Gasetechnik™, Witten, Germany), a flow rate meter (mod. SK-25 Kimmon™, Tokyo, Japan), an adsorption column cartridge (a PVC cylinder of 60 mm diameter and 600 mm length), a vent, and an infrared gas analyzer (mod. ABE 1500 AB Energy
TM, Biella, Italy). Two open-cell polyurethane foam discs (approximately 30 mm length) were placed at the internal ends of the cartridge to contain the tuff particles. The resulting bed volume is approximately 1.5 L. Before the data acquisition was started, the column was purged with a pure nitrogen flow, until a null concentration of CO
2 was measured at the outlet. The experiment was performed flowing a synthetic gas mixture of CO
2 and N
2 through a cartridge loaded with tuff samples of approximately 0.6 kg. The outlet CO
2 concentration vs. time was measured for each sample until full saturation was reached (i.e., when the outlet CO
2 concentration equals the inlet CO
2 concentration). Data were recorded every 5 s.
Six saturation curves were measured using two sub-samples from each of three different tuff samples A, B, and C. Before each measurement, the samples were pretreated according to the procedure reported in
Section 3.1.
Figure 3 shows the CO
2 concentration, measured at the cartridge outlet, as a function of time. The different performance of samples are mainly due to different operating conditions (i.e., inlet CO
2 concentration, inlet flow rate, sample weight), as reported in
Table 2.
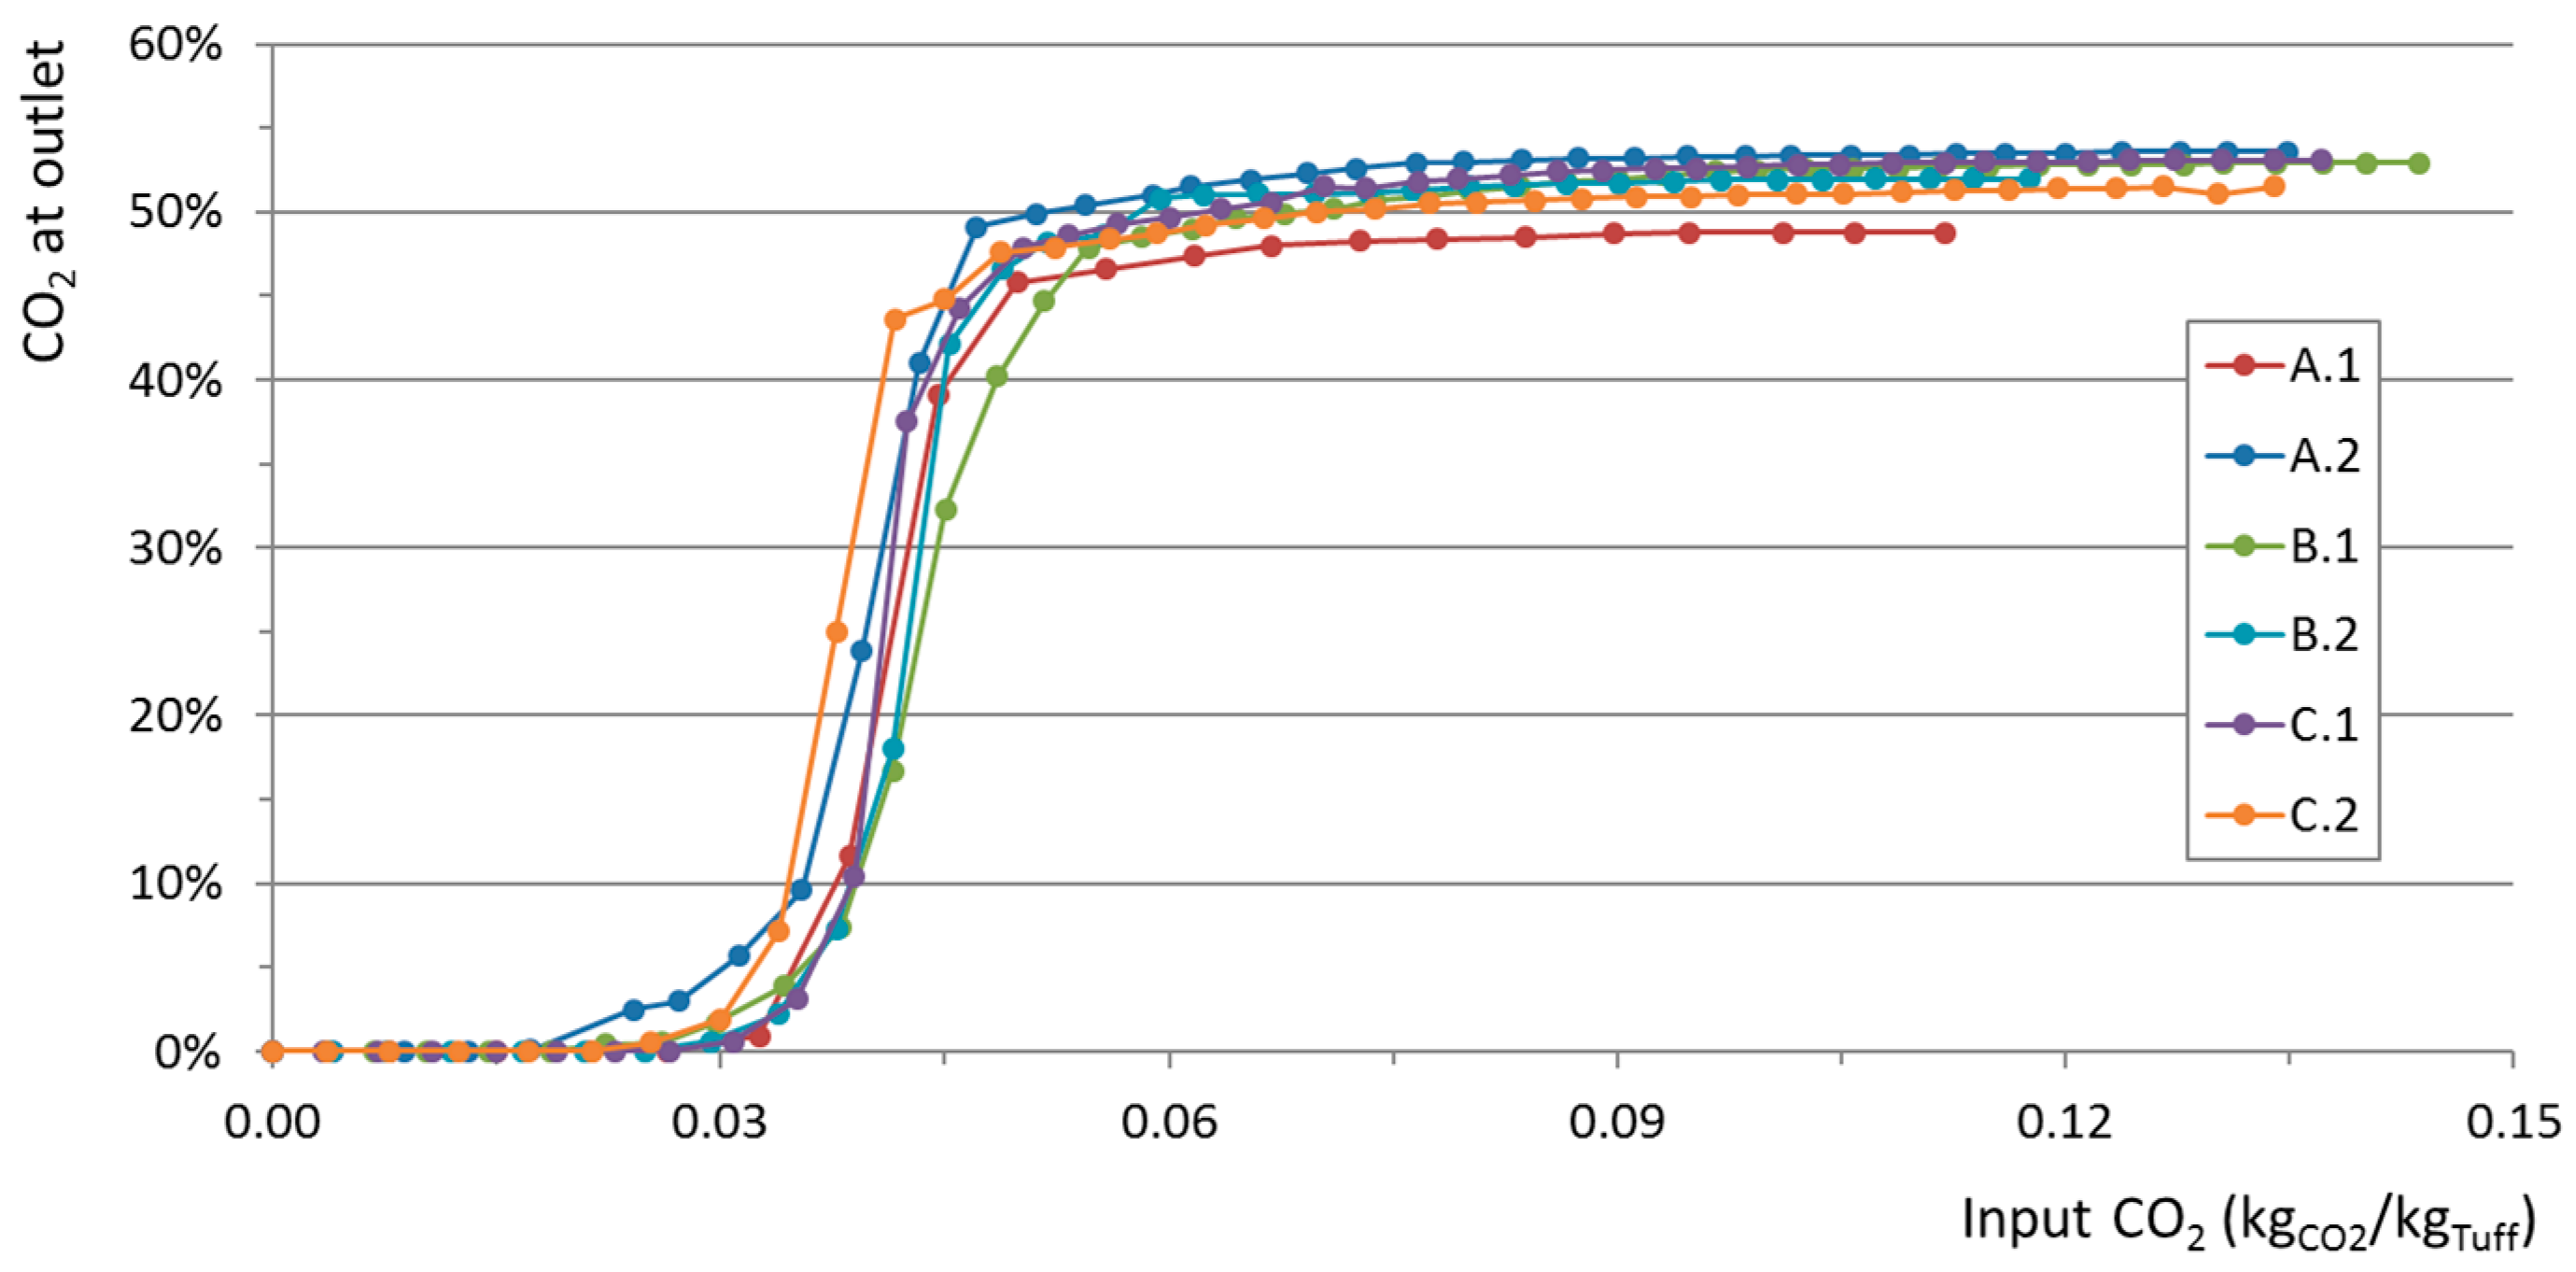
A more precise estimate of general tuff adsorption properties can be obtained with a deconvolution of observed quantities from the particular operative condition. Since the saturation level of tuff particles, and not time, directly regulates the adsorption process, another way of presenting saturation curves is proposed in
Figure 4. Here the outlet CO
2 concentration is shown as a function of the cumulative amount of CO
2 flown through the cartridge per unit mass of tuff (kg
CO2/kg
Tuff). The inlet flow rate was measured at each time step, and the resulting inlet amounts of CO
2 and N
2 are computed considering the known gas composition, which is constant during each experiment. It can be observed that the spread among all the samples is reduced with respect to the behavior shown in
Figure 3.
The breakthrough point was estimated considering the biomethane quality requirements reported in national technical regulations [
35], which recommend an outlet CO
2 concentration not exceeding 3% in volume. According to the results shown in
Figure 4, the maximum amount of CO
2 that can flow through a tuff adsorption cartridge, before the breakthrough point is reached, is between 0.029 and 0.036 kg
CO2/kg
Tuff. This result was obtained with an inlet gas pressure equal to the atmospheric pressure (the vent in
Figure 2 does not allow the cartridge to pressurize, having a CO
2 partial pressure of approximately 0.05 MPa) and an outflow gas temperature in the range 18–19 °C.
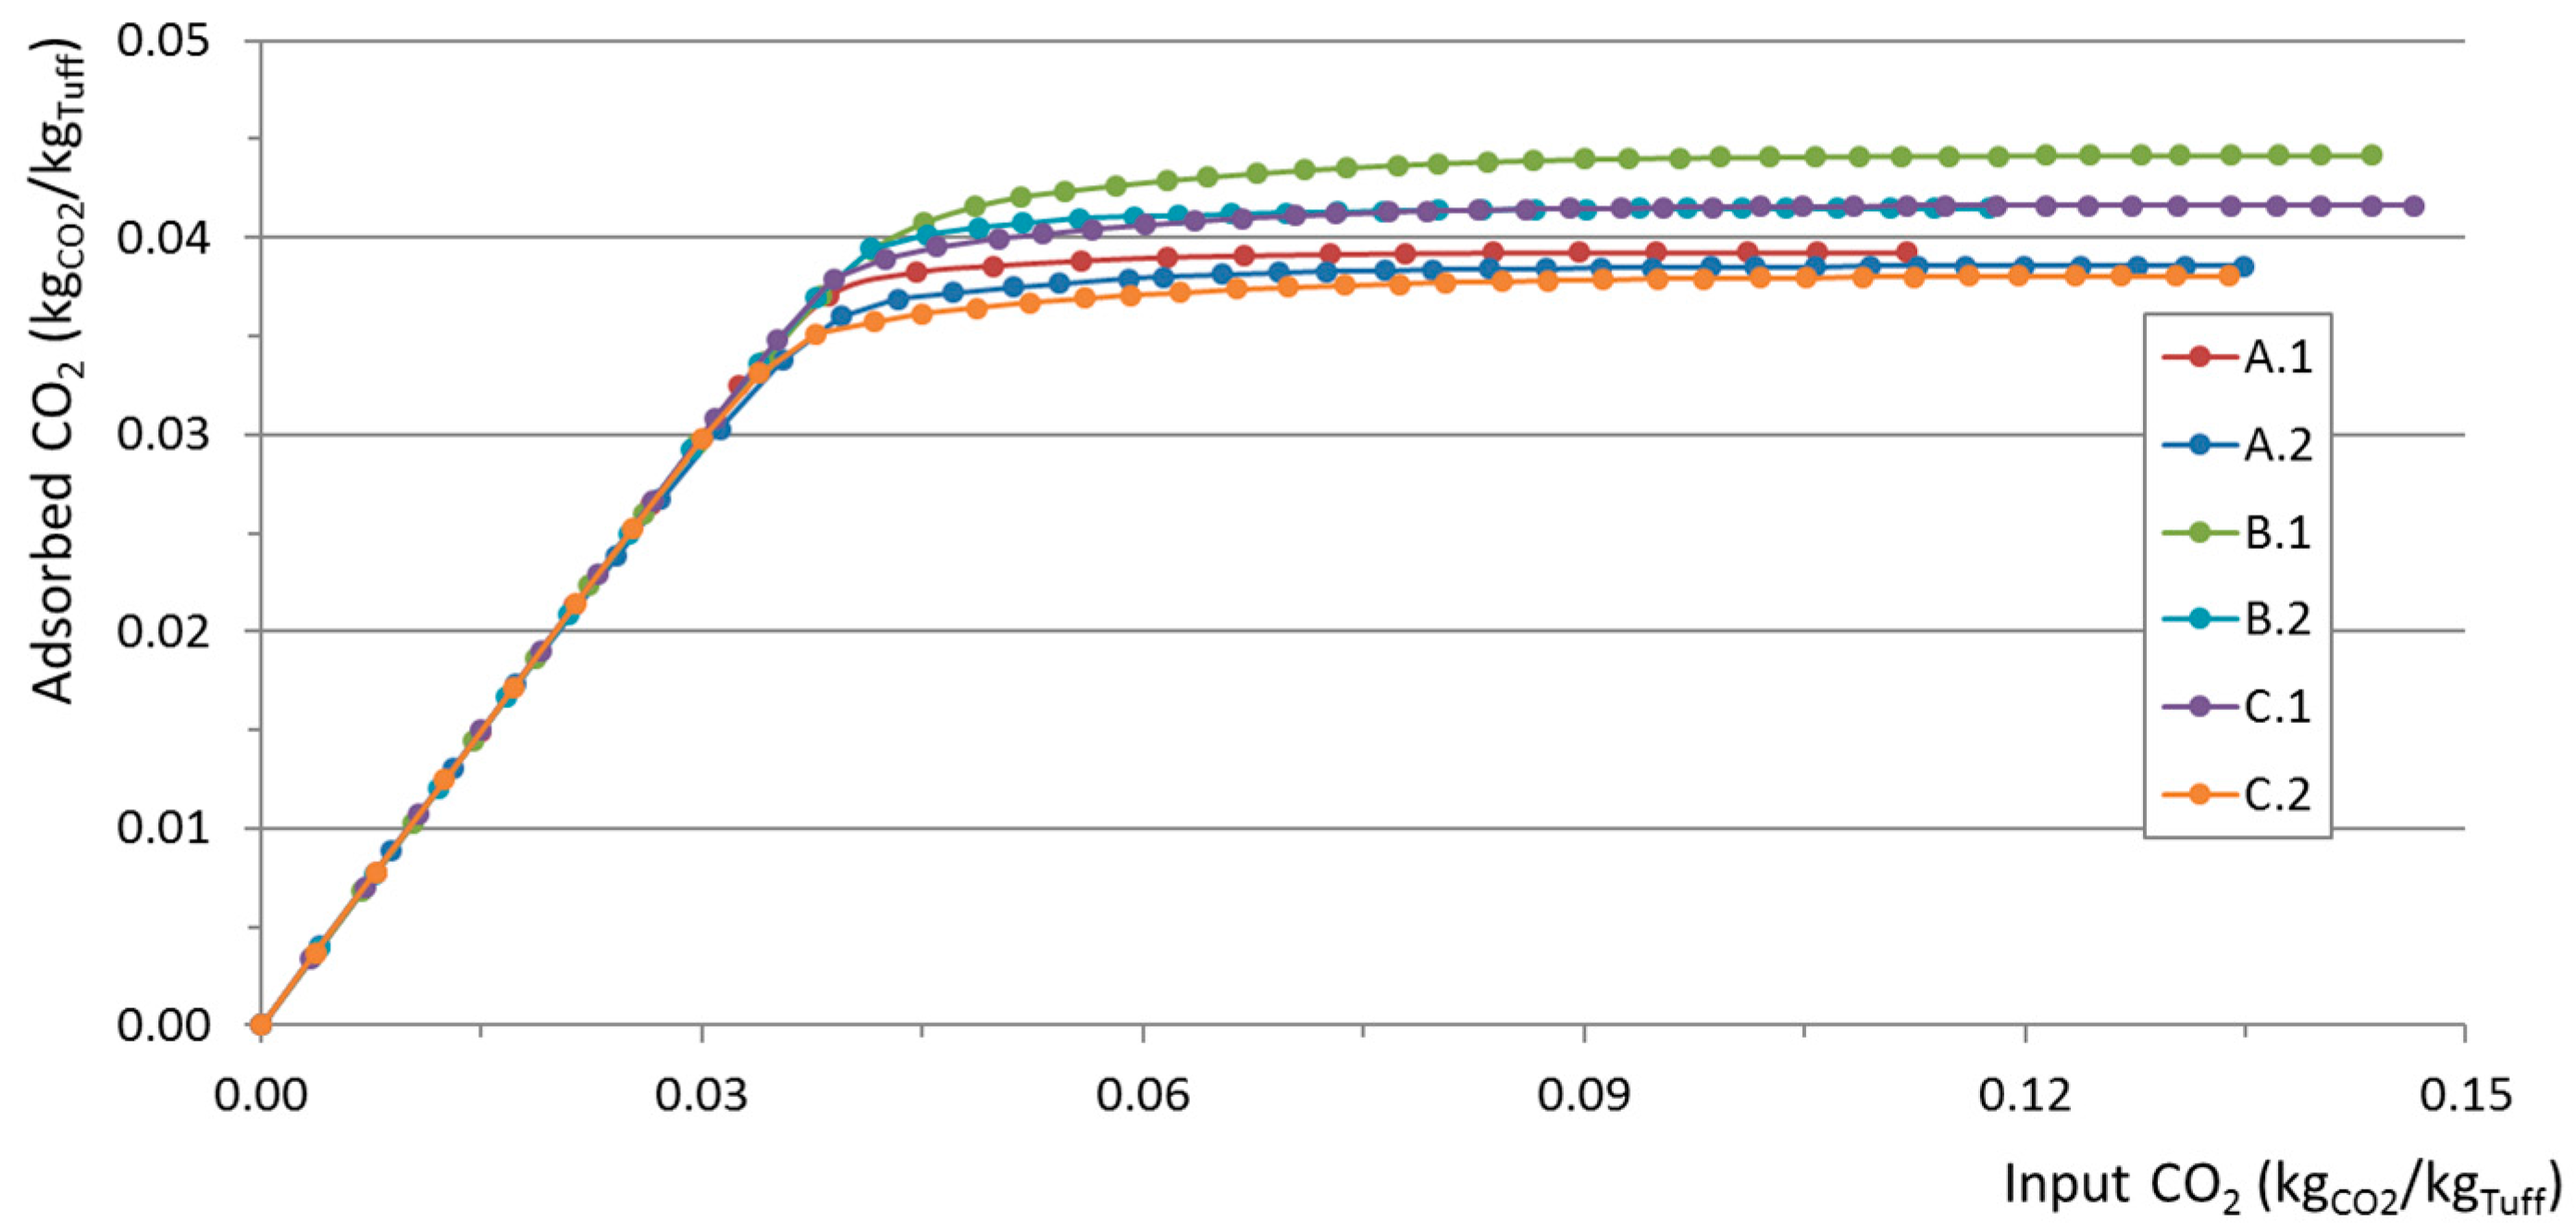
Finally,
Figure 5 shows the cumulative adsorbed CO
2 as a function of input CO
2, per unit mass of tuff. Before the breakthrough point, all samples show the same behavior (all of the input CO
2 is effectively adsorbed and the slope of the curves is 1). Different samples deviate from linearity at different values of input CO
2 according to what shown in
Figure 4.
CFD Simulations
Computational fluid dynamics simulations were developed using Ansys Fluent 16.2 [
36] in order to study the CO
2 adsorption with tuff in transient regime. The adsorption process was modeled considering a fluid mixture of chemical species (CO
2 and N
2), flowing through a cylindrical adsorption column packed with a porous material (tuff). As a first step, the geometrical domain was developed using the same dimensions of the saturation curve apparatus. The 3D model features a total bed volume of 0.0015 m
3 (approximately 0.06 m diameter and 0.54 m length). The total bed porosity, defined as the ratio between the total vacuum volume (inter- and intra-particle vacuum) and the total volume occupied by the bed, is 0.76–0.79. For all of the simulations, the energy equation, the standard k-ε turbulence model, and the mixed species transport model were used in order to consider the binary species mixture and transport processes in a turbulent regime. A non-reacting two-species mixture is considered, resulting in separate sets of mass, momentum, and energy conservation equations [
37]. The mixture density is obtained using the compressible ideal gas model. The diffusivity of the mixture is computed with the multi-component law [
38]. The porous media is assumed to be isotropic and the related pressure losses are quantified with the Ergun equation [
38]. All of the cases are simulated in the transient regime with a 1 s time step (a first step after 0.1s was also computed).
To simulate the CO
2 adsorption process, a source term (
Sm), specific for each cell of the domain, is included in the mass balance equation:
User-defined functions were implemented to model the source term as a selective mass sink (only CO
2 is adsorbed) characterized by a decreasing adsorption rate as a function of the saturation level. The cell saturation level (
x, Equation (3)) is defined as the ratio of the cumulative adsorbed CO
2 (
) and the maximum adsorbable amount (
). At the beginning of the process
x equals 0 (fresh tuff), and it becomes 1 for fully-saturated cells (exhausted tuff). The cell adsorption rate (
) depends on the saturation level, and it is maximum for
x = 0 and zero for
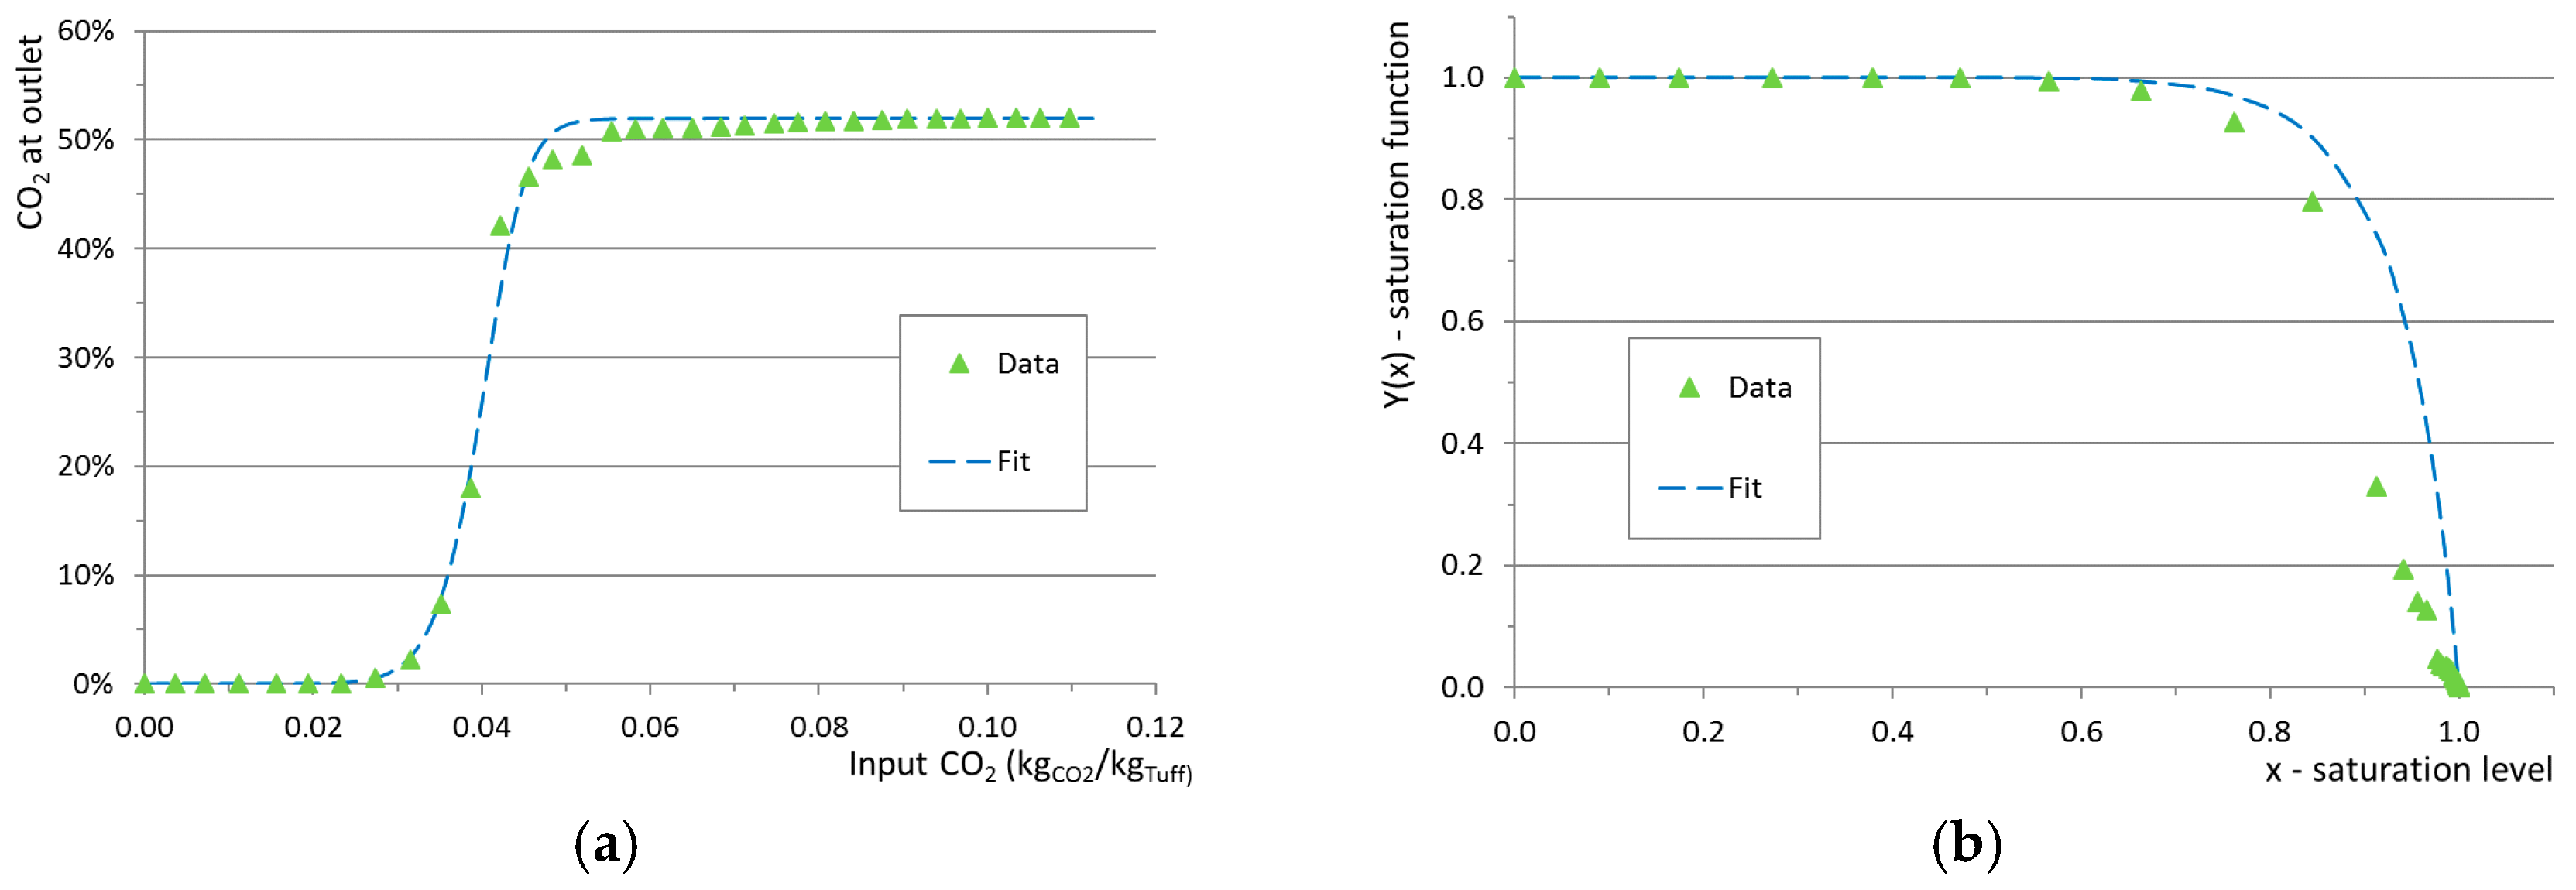
x = 1. The adsorption rate as a function of the saturation level was modeled according to Equation (4). The saturation function
Y (Equation (5)) represents a tentative and original parameterization that relates the adsorption rate to the saturation level via a phenomenological parameter (
a). The saturation parameter
a used in the simulations was obtained from a fit to observed data as shown in
Figure 6. The total adsorbed CO
2 of the model (blue) equals the observed value (green) and the behavior around the breakthrough point is well reproduced.
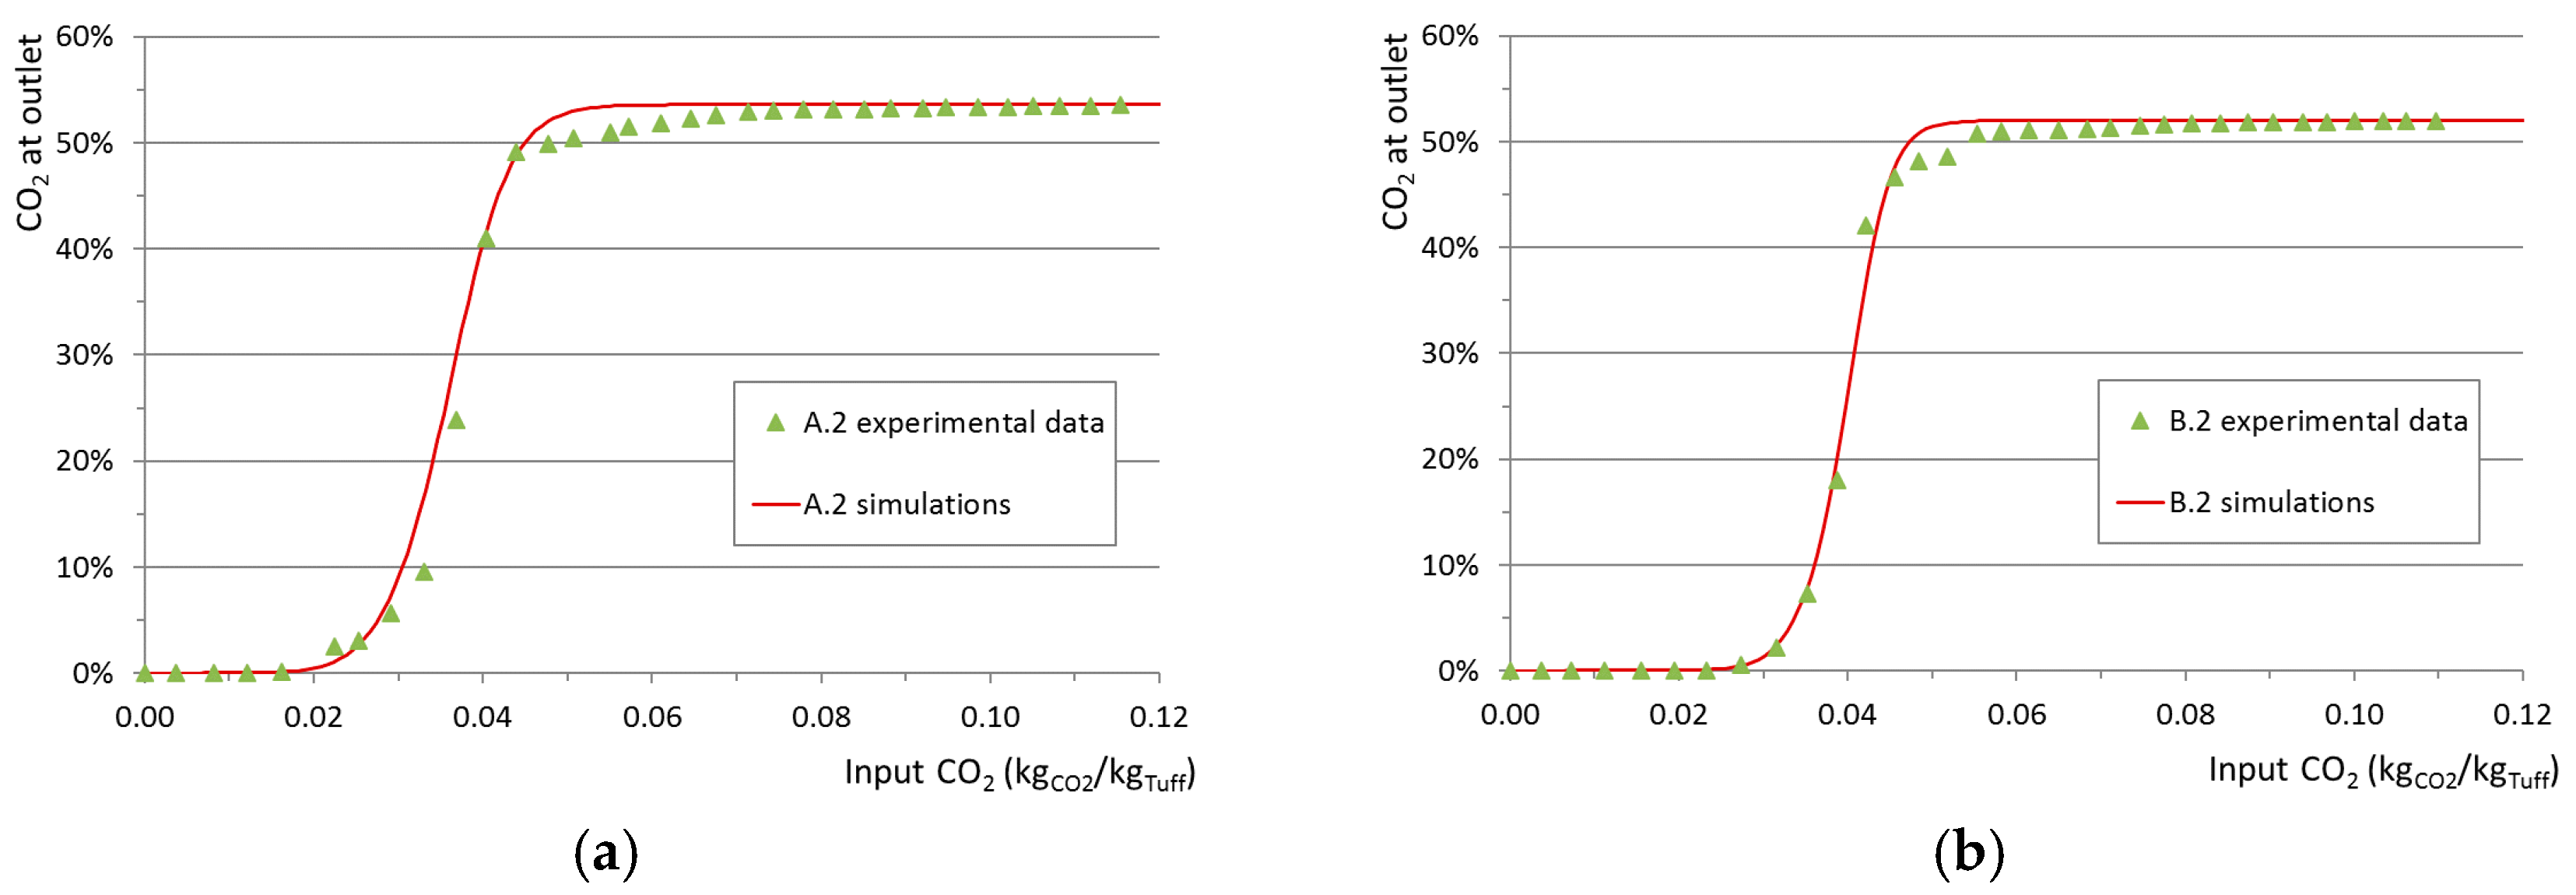
A model validation was performed based on the comparison between simulations and experimental data. The boundary conditions used for each run and the related simulation case are shown in
Table 3. Constant average values were used for inlet flow rates. Examples of the validation results are shown in
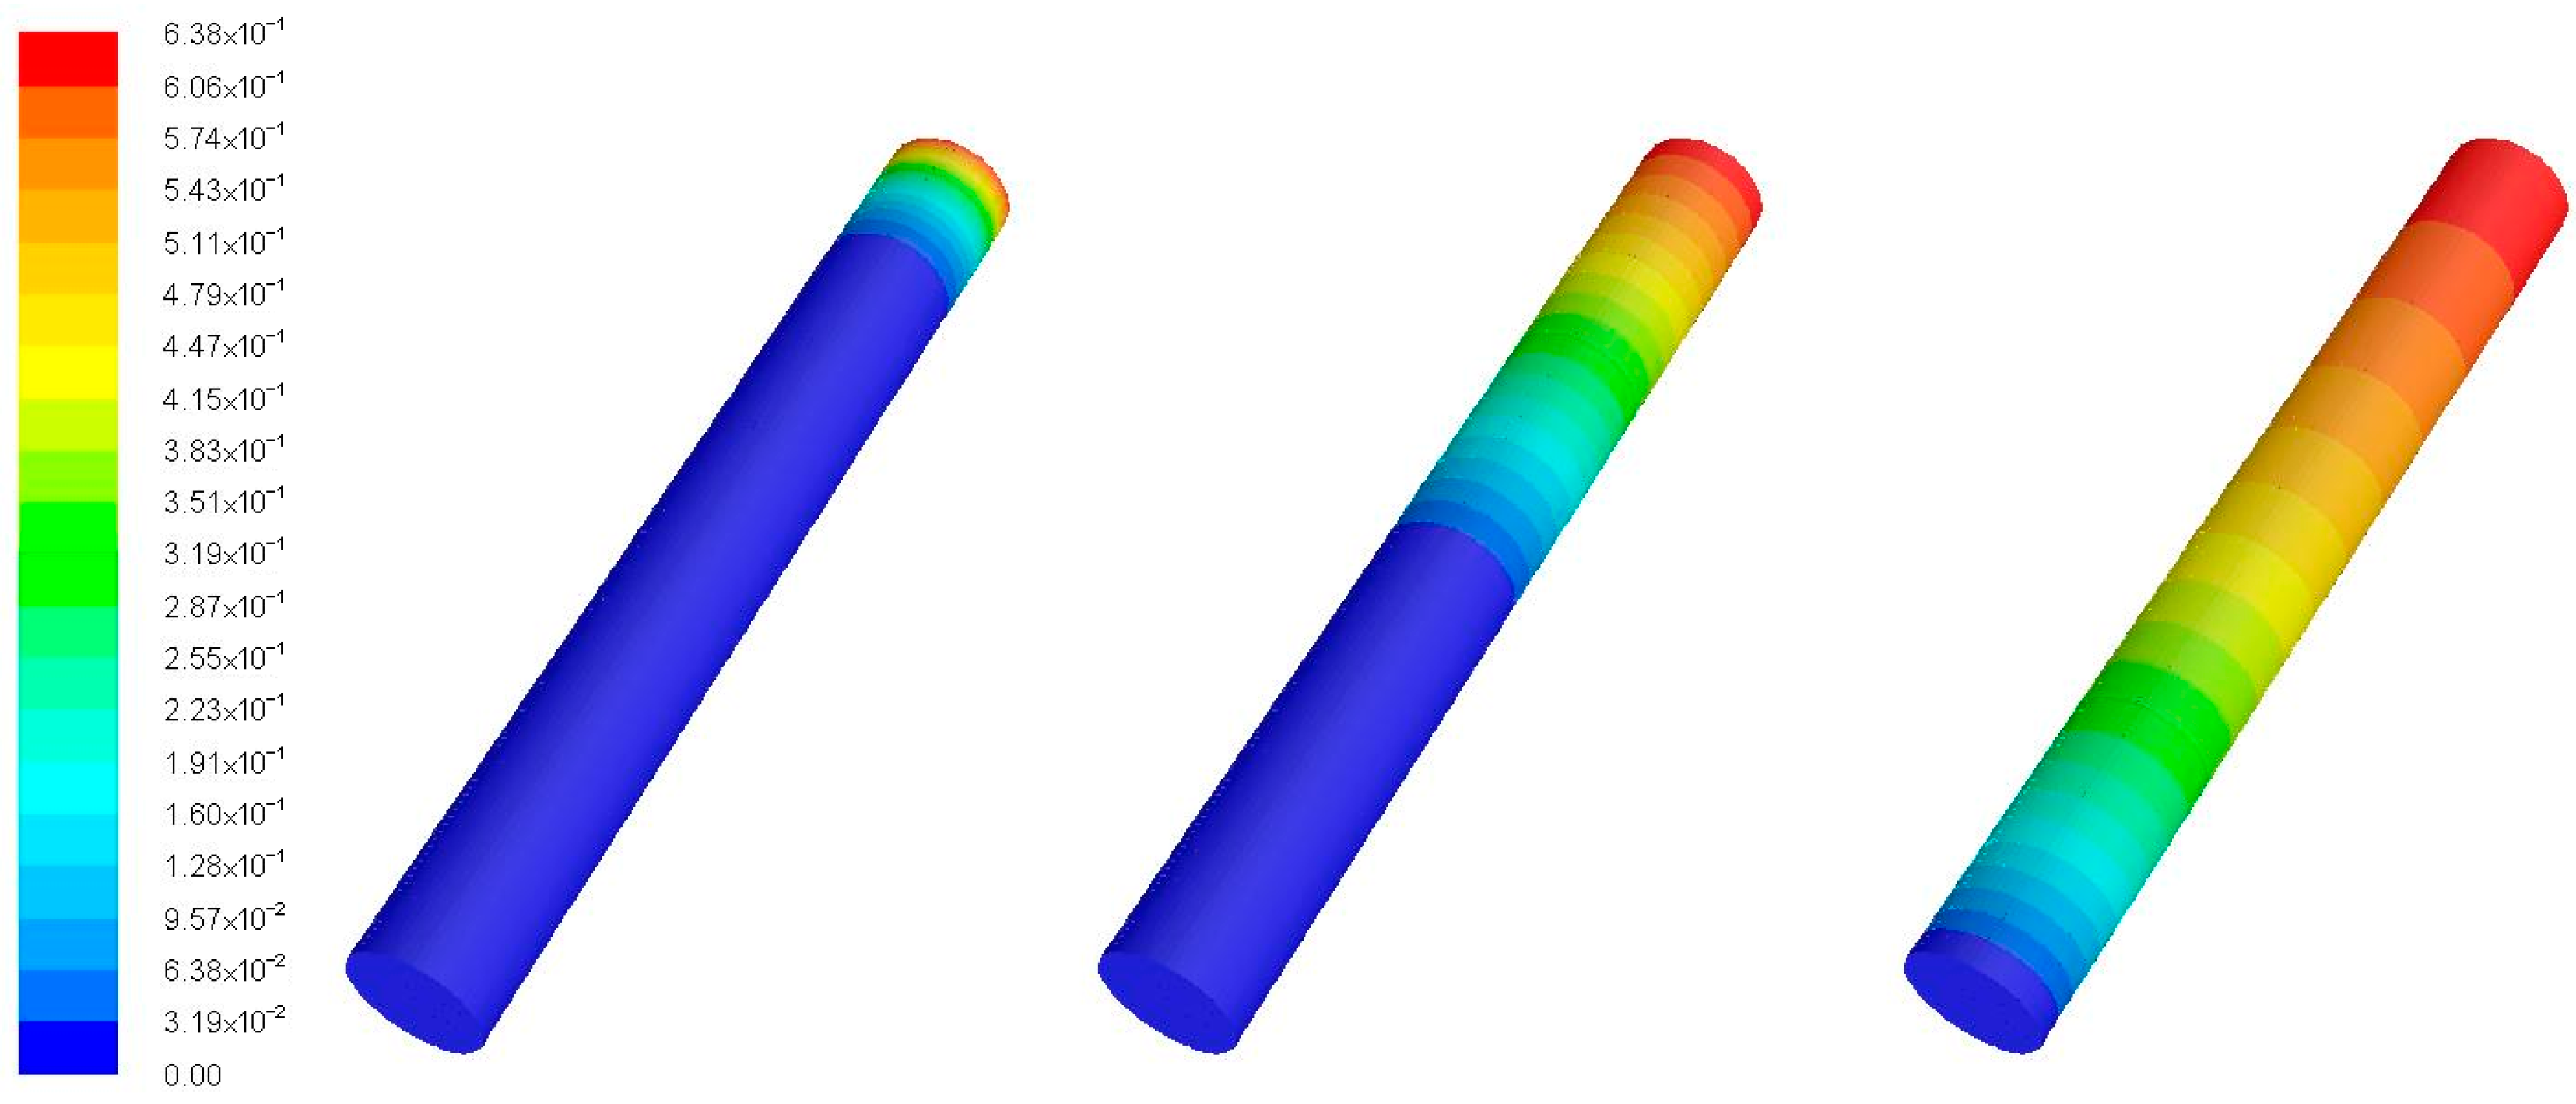
Figure 7. Examples of the simulation outputs are shown in
Figure 8.
3.2. Adsorption Isotherms
The adsorption equilibrium happens when, under specific (and fixed) boundary conditions, the adsorbent is fully saturated and it is no longer able to adsorb more. Adsorption equilibrium can be measured with different methods classified as volumetric, gravimetric, and chromatographic [
25]. In the presented work, the volumetric method, successfully used in other similar works [
24], was applied. This approach consists in letting a known amount of adsorbable gas expand inside a known volume containing the adsorbent. Measuring the equilibrium pressure it is possible to estimate the adsorbed amount. It was also found that reliable results can be obtained using the ideal gas approximation.
A custom experimental apparatus was setup with the aim of measuring adsorption isotherms, i.e., the maximum adsorbable CO
2 of tuff for a given temperature as a function of CO
2 equilibrium pressure. The apparatus is shown in
Figure 9. It is an airtight system that consists of two known volumes (
Vs and
Vr) connected, with a switchable manifold, to gas feed line, a vacuum pump (mod. V-700 Büchi
TM) and a digital manometer (mod. LEO1 Keller
TM). The system is immersed in a thermostatic bath in order to maintain a constant set temperature (
Tb).
Vs hosts the tuff sample,
Vr is a reference volume used to measure the amount of CO
2 in the system before the adsorption process. The measurement is a three-step procedure. As a first step, a known amount of tuff is placed inside
Vs and the system is evacuated down to mid-vacuum conditions (approximately 15 mbar). During the second step,
Vs is isolated and the
Vr volume is filled with the desired amount of CO
2. In order to guarantee that no residual air remains inside
Vr, the system is purged with CO
2 right after
Vs is isolated. Once the system reaches the thermal equilibrium with the bath, the amount of CO
2 can be estimated measuring the pressure and using the ideal gas approximation (the total volume is given by
Vr and the piping volume). In the final step, the CO
2 is allowed to expand inside
Vs and the equilibrium pressure is measured after the adsorption process ends. The amount of unadsorbed CO
2 is measured considering the final volume
Veq, which includes
Vs,
Vr, and the piping volume. As a result, the amount of adsorbed CO
2 as a function of the equilibrium pressure can be estimated as the difference between initial and unadsorbed CO
2. All system volumes are summarized in
Table 4.
For each point of the saturation curve, pressures were measured only at thermal equilibrium. In the second step, the thermal equilibrium is reached typically after 1–2 min, and the pre-expansion pressure (
P0) is used to compute the initial amount of CO
2 (
n0) (Equation (6)). In the last step, after the CO
2 is adsorbed and the thermal equilibrium is reached (typically in 8–10 min), the equilibrium pressure (P
eq) is used to compute the unadsorbed CO
2 amount (
nf) (Equation (7)). Thanks to CO
2 purge, the only residual air inside the system is given by the vacuum pressure inside
Vs, and it can be neglected after CO
2 expansion. The amount of adsorbed CO
2 (
nads) is computed according to Equation (8).
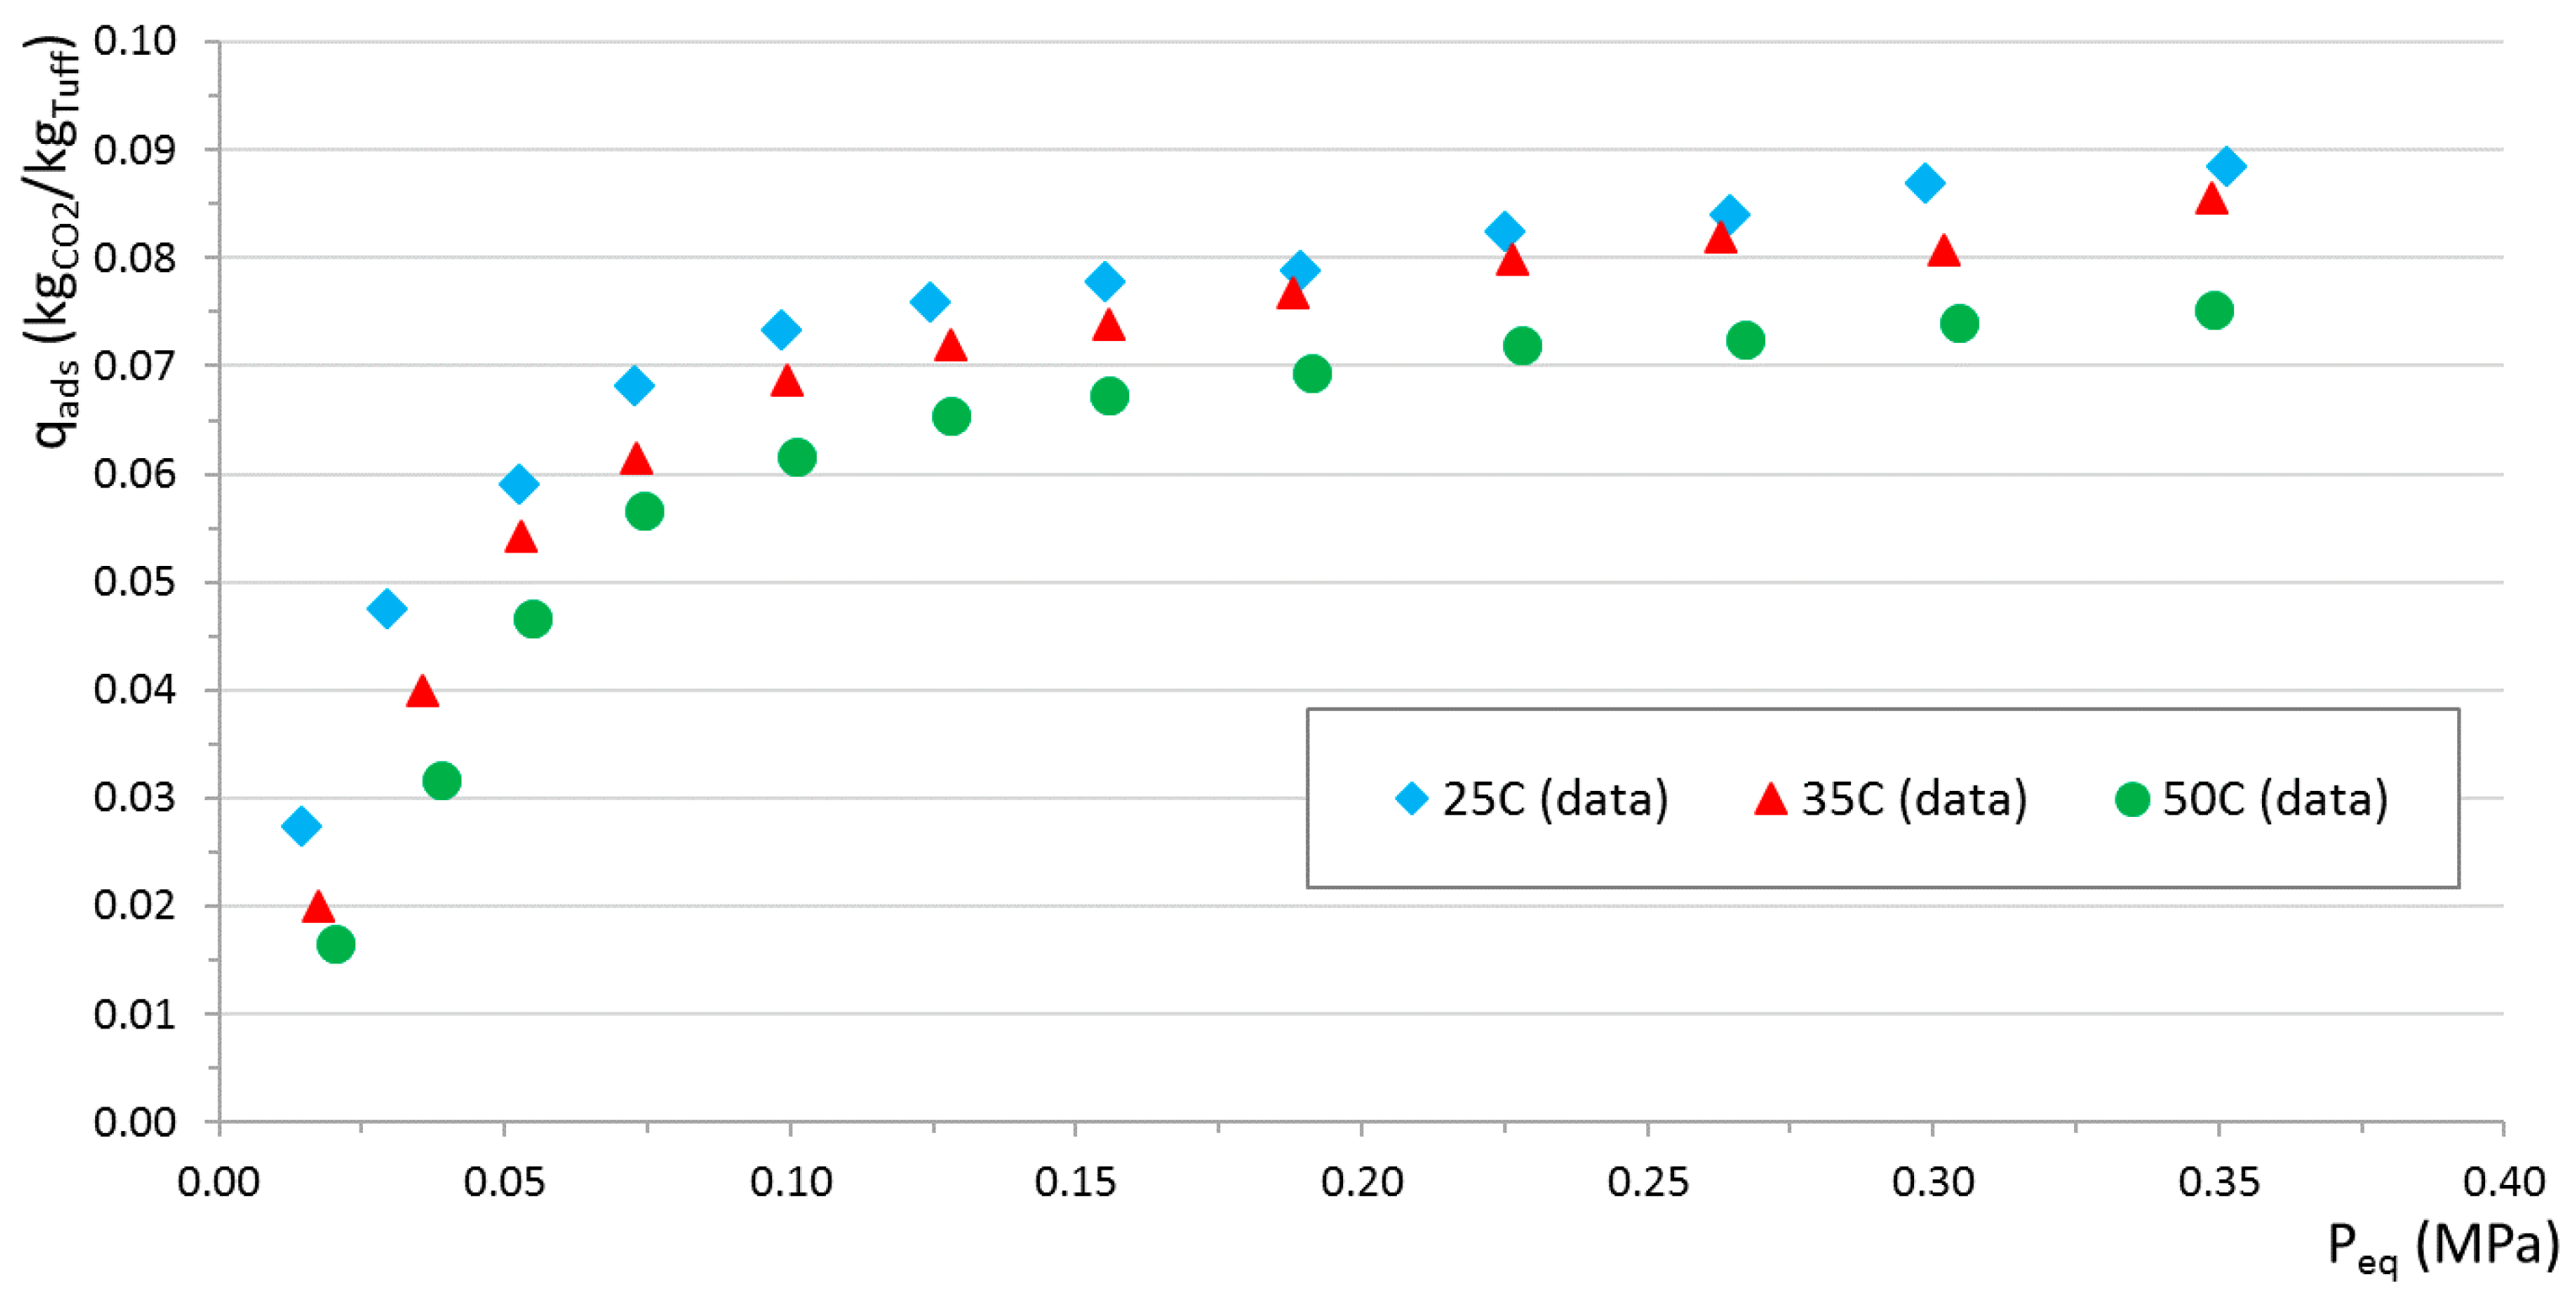
Tuff adsorption isotherms were measured considering a reference regeneration temperature of 220 °C and three different equilibrium temperatures: 25 °C, 35 °C, and 50 °C. Results are shown in
Figure 10. As expected, a consistent trend can be observed from lower (more efficient adsorption behavior) to higher (less efficient adsorption behavior) equilibrium temperatures.
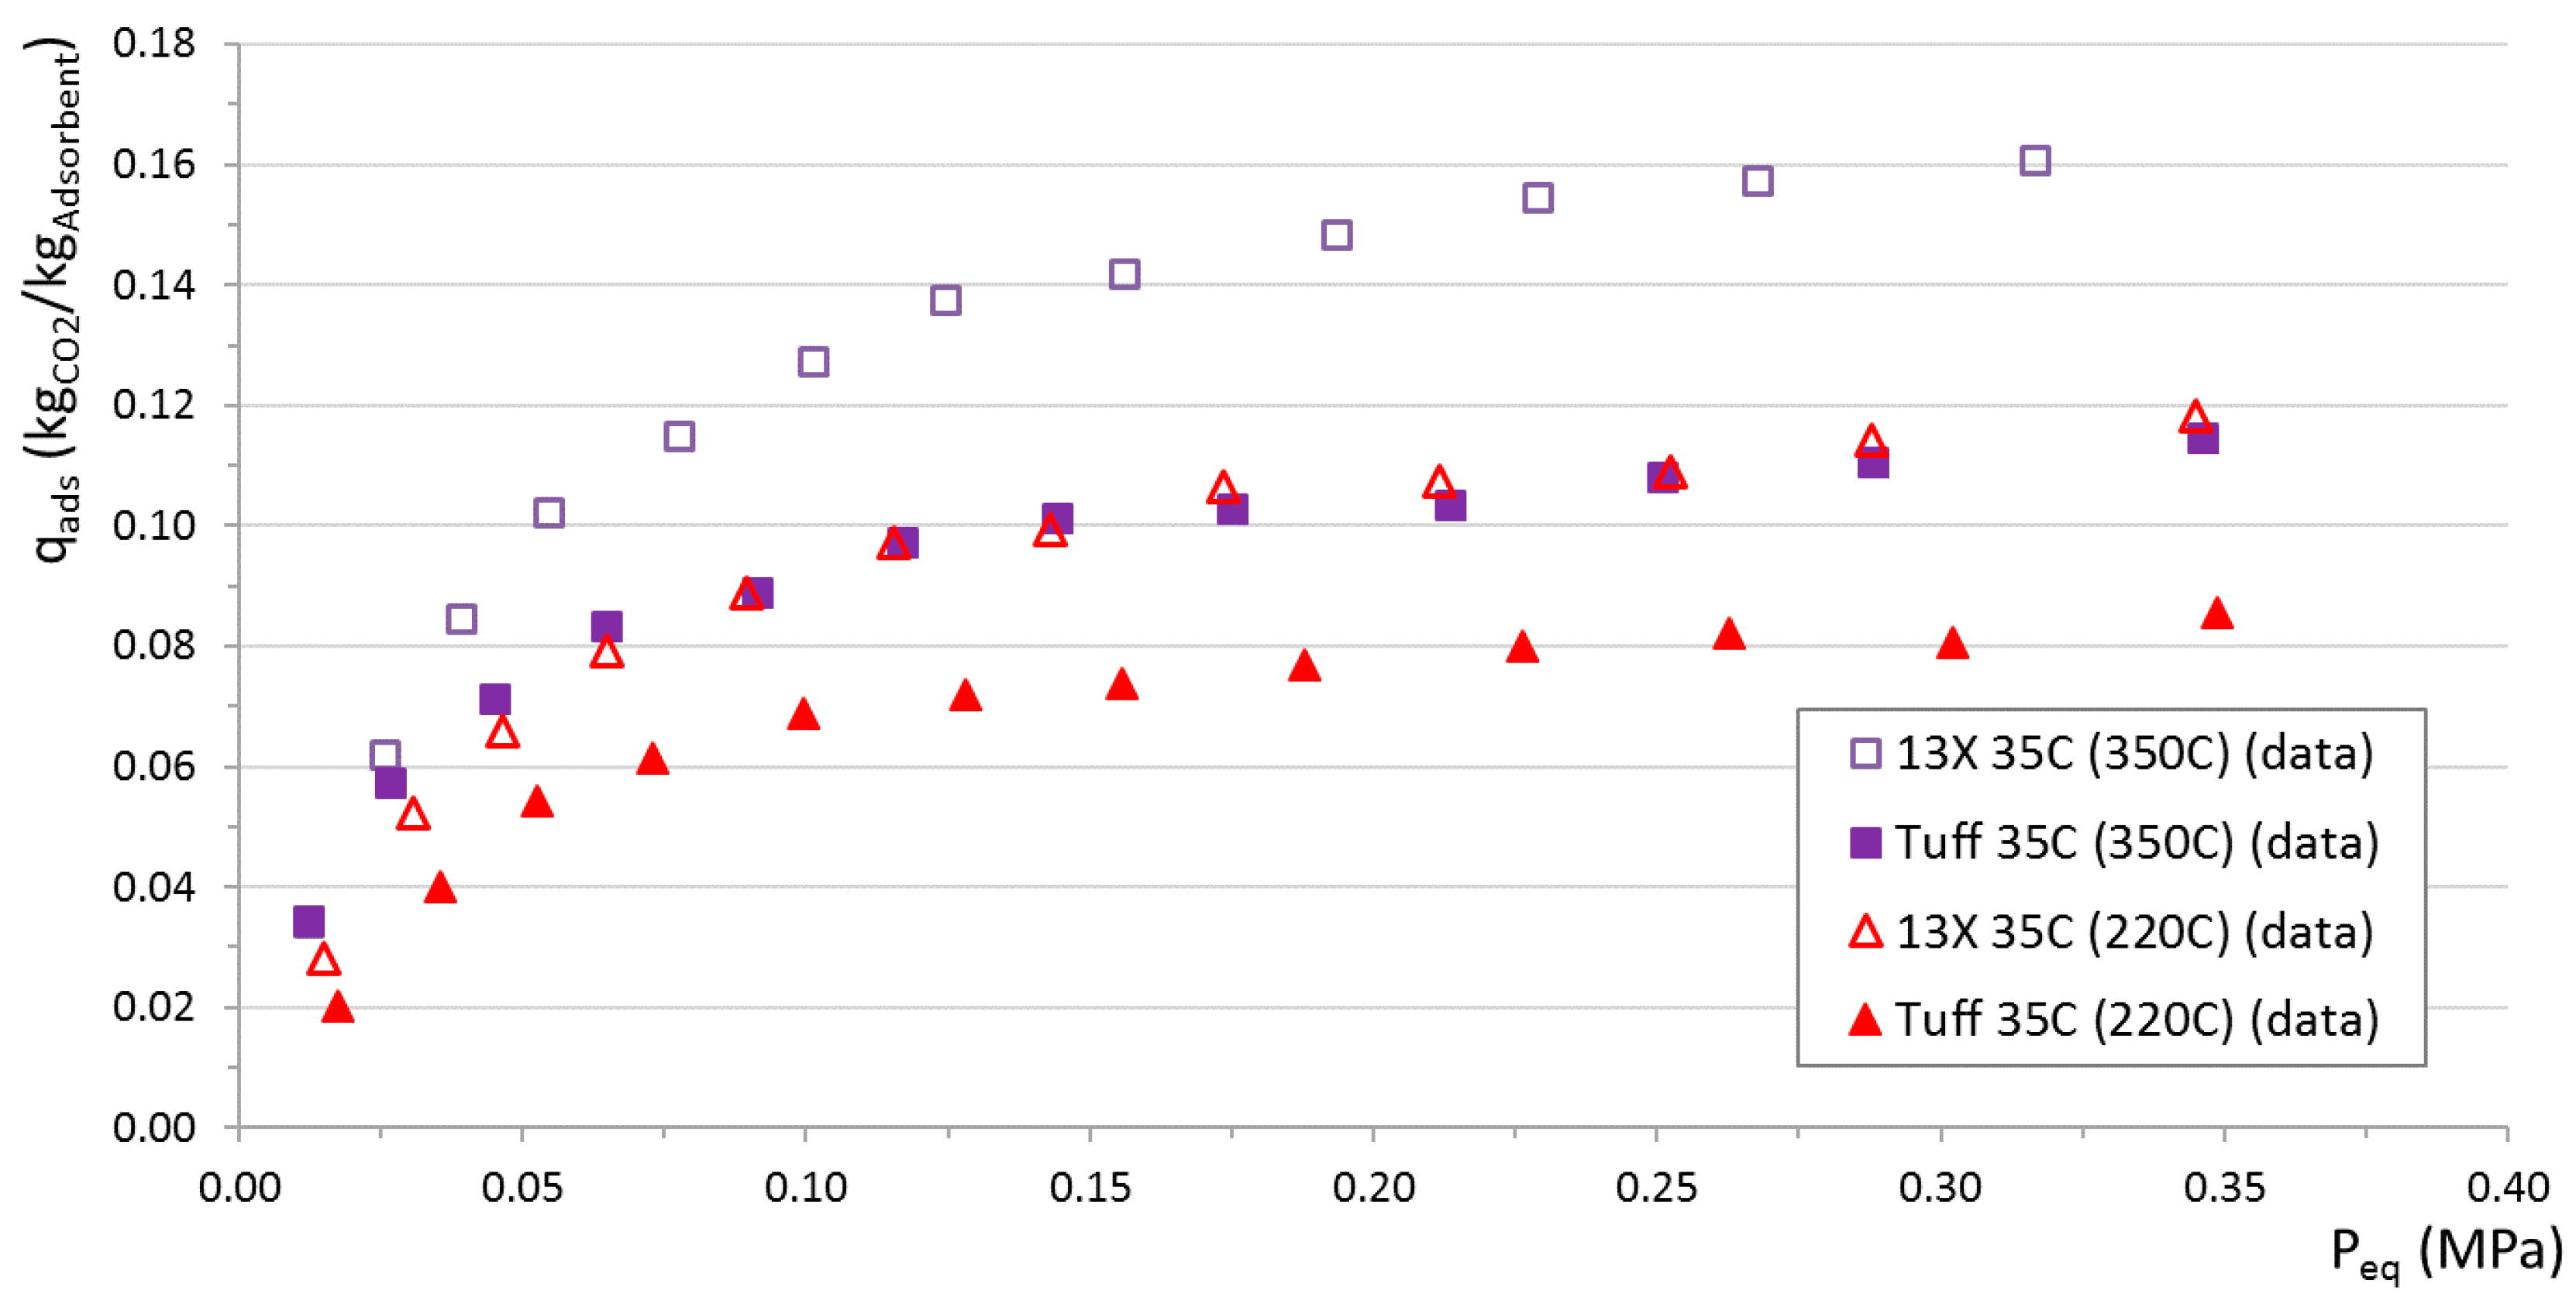
For comparative purposes, adsorption isotherms of tuff and commercial 13X zeolites at 35 °C were also measured using regeneration temperatures of 220 °C and 350 °C (
Figure 11). In this case, higher regeneration temperatures translate into an enhanced adsorption capacity. It can also be observed that tuff adsorption properties are lower than 13X, however close enough to make tuff an interesting alternative to synthetic zeolites. It is found, by chance, that 350 °C-regenerated tuff has similar properties of 220 °C-regenerated 13X.
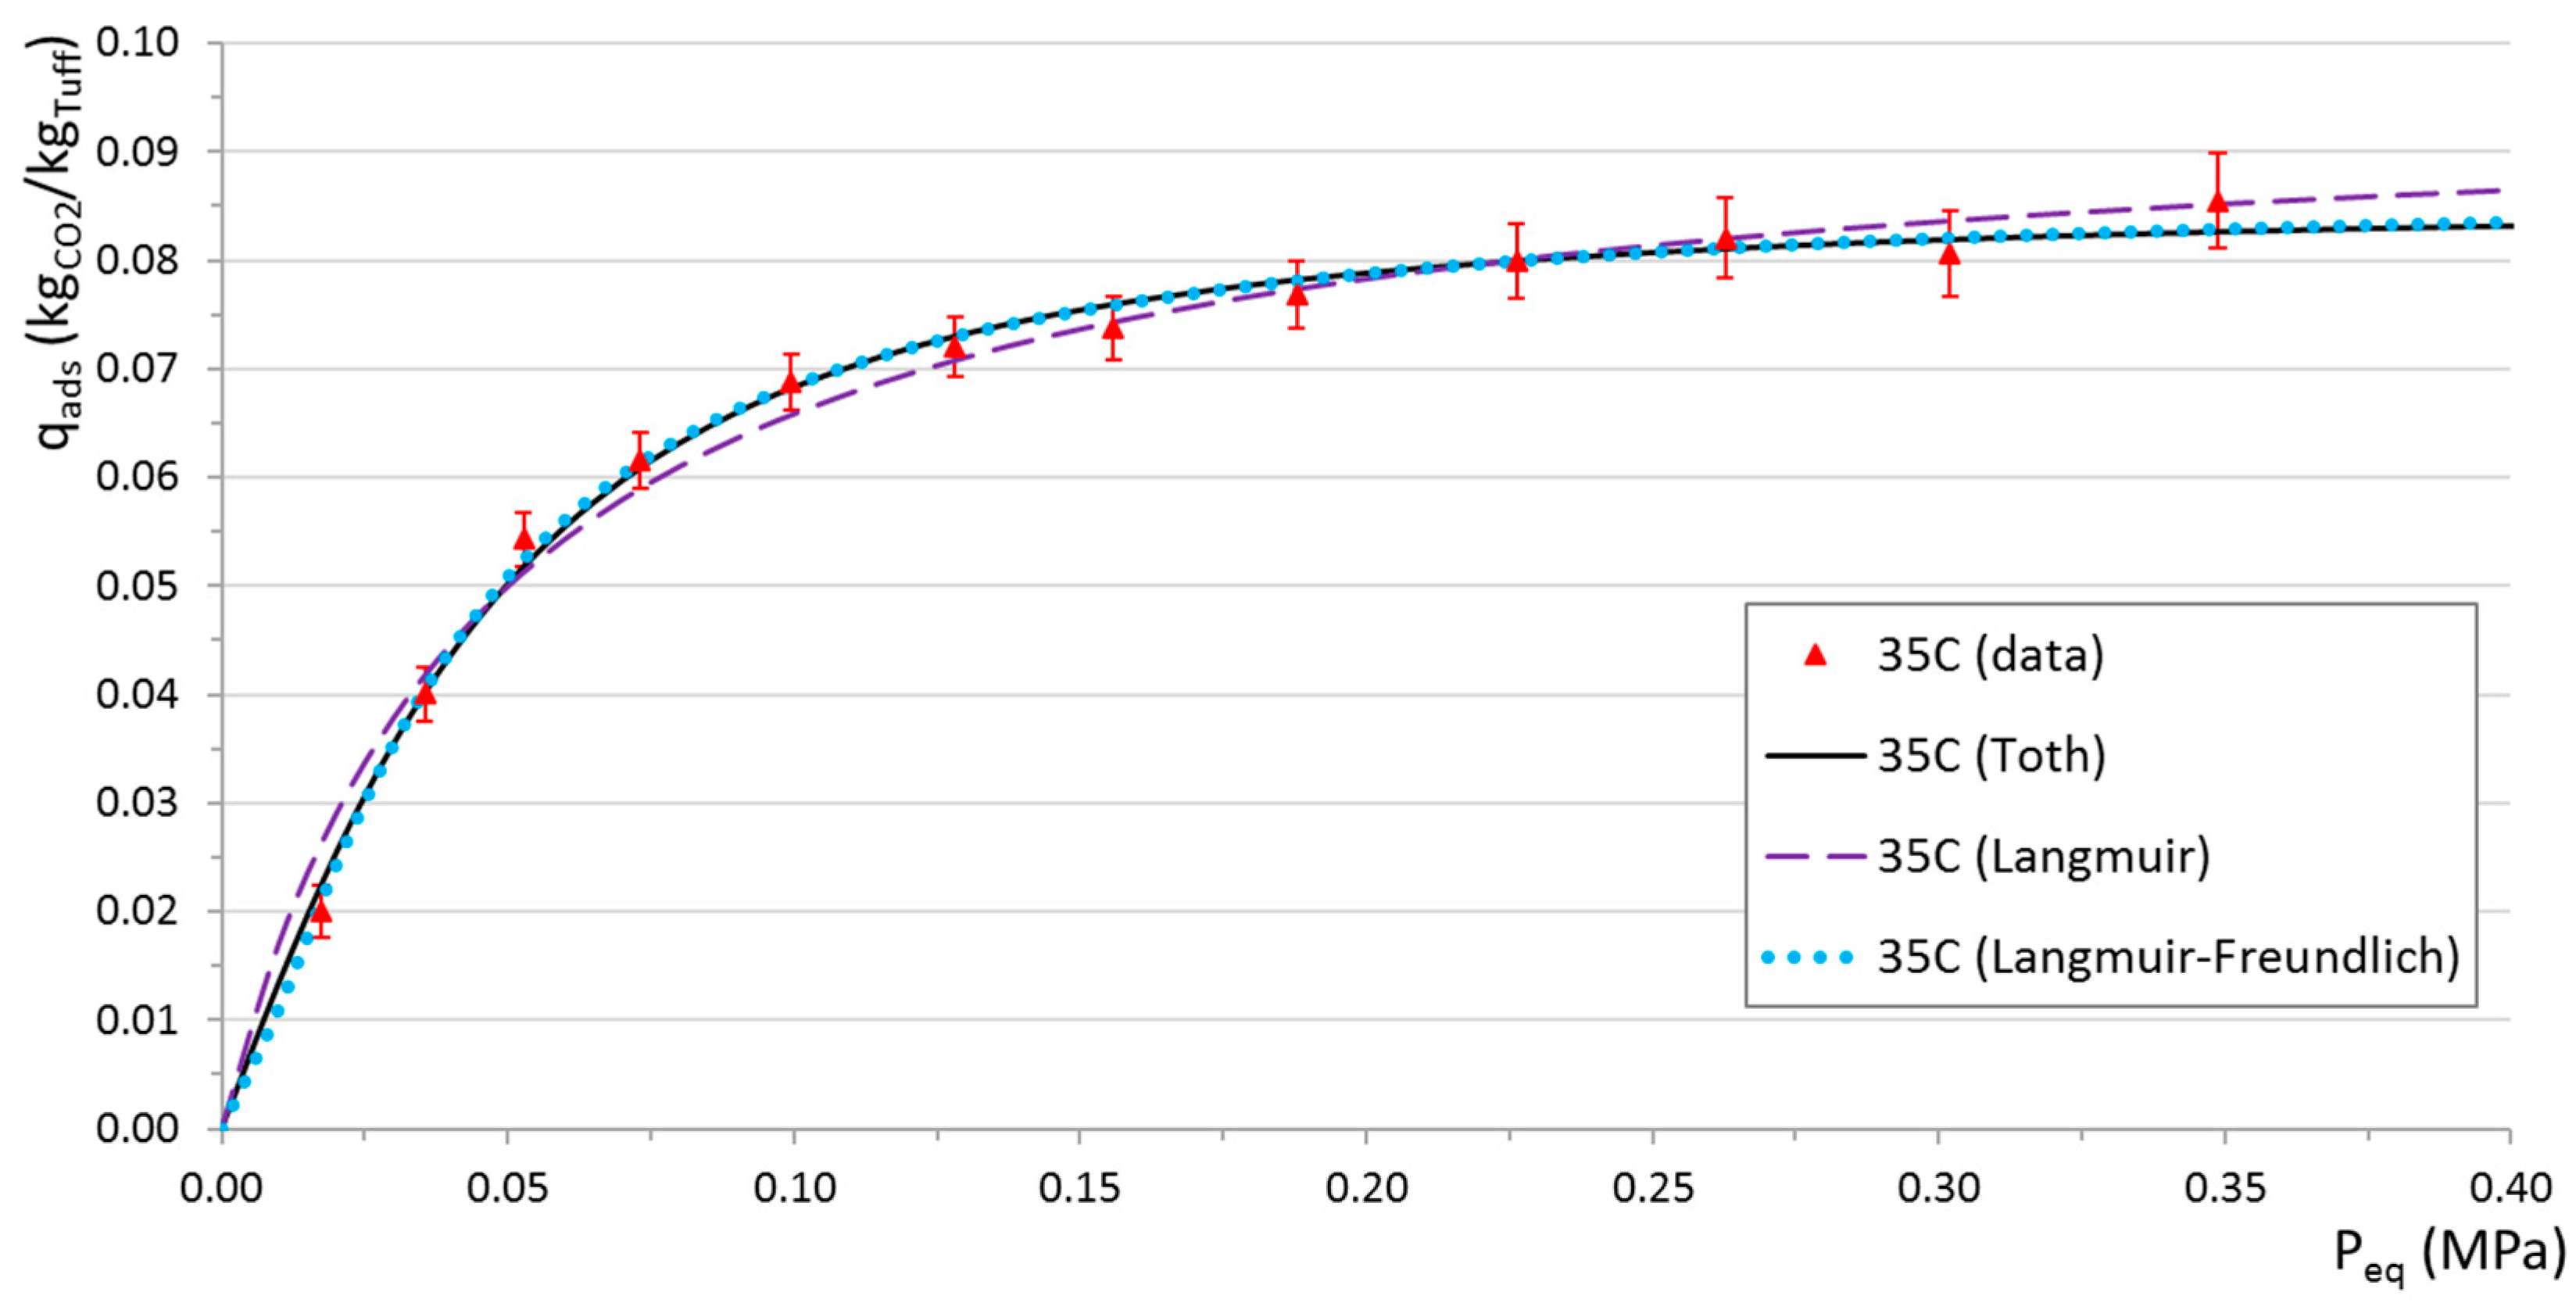
An estimate of tuff and 13X adsorption properties was finally produced fitting three common analytic parameterizations to observed data: Langmuir (Equation (9)), Langmuir-Freundlich (Equation (10)), and Toth (Equation (11)) models:
Langmuir-Freundlich isotherm [
28]:
Fit results for tuff at 35 °C (220 °C regeneration) are shown in
Figure 12. Best-fit values and probabilities for the three models are given in
Table 5,
Table 6 and
Table 7.
4. Discussion
The experimental campaign to characterize the adsorption properties of tuff clearly shows its suitability for CO2 removal applications thanks to its interesting overall performance. It is found that, as is common for natural materials, and especially for byproducts, tuff is characterized by a broad range of particle sizes, resulting in an appreciable variability of porosity, skeletal and particle density, and pore diameter.
The fragility of this material is also responsible of a rapid wear of particles if not treated with the required care (i.e., minimizing friction during manipulation of the samples). No reduction of the particle average dimension (i.e., fractures) is observed, however, unlike 13X synthetic zeolites, dust is easily produced and it degrades the adsorption capacity if not properly removed during regeneration, which can be easily performed either with air or water. The mass loss during handling (loading, unloading, and treatment) is found to be less than 1% in weight after each cycle.
Thermal regeneration is found to play a major role in both tuff and 13X performance. A similar increase in the adsorption capacity of the two materials is found when the regeneration temperature is increased. Switching from 220 °C to 350 °C, the maximum adsorbable amount at 35 °C increases from approximately 0.085 to 0.125 kgCO2/kgAdsorbent for tuff (+47%) and from approximately 0.125 to 0.175 kgCO2/kgAdsorbent for 13X (+40%). Tuff clearly performs worse than 13X, however, it is close enough to represent a viable alternative, considering its negligible environmental impact and costs. In this work just two regeneration temperatures were considered. It would be certainly interesting to find out the relation between the regeneration temperature and adsorption capacity, including an estimation of the excess thermal energy required for tuff regeneration to reach the same adsorption performance of 13X.
Saturation curves represent a key step of this analysis. Requiring CO2 contamination in the outlet gas not exceeding 3%, it is found that approximately 0.03 kgCO2/kgTuff can be flown into the adsorber before the limit is crossed, in the most conservative case. Since before the breakthrough point the adsorption process is very efficient, this same value is also a good estimate of the maximum amount of CO2 that tuff can adsorb before the outlet gas becomes CO2-contaminated. The maximum adsorption capacity (i.e., full saturation) obtained from adsorption isotherms for a CO2 partial pressure of approximately 0.05 MPa is between 0.045 kgCO2/kgTuff (50 °C) and 0.06 kgCO2/kgTuff (25 °C). As expected, this value is higher than that found with the saturation curves experiments. The adsorptive material, in fact, has to be replaced when the adsorption rate deteriorates: tuff particles are partly saturated and they are not able to contain the outlet CO2 below 3%. This occurs after approximately 0.03 kgCO2/kgTuff are adsorbed, well before full saturation is reached.
It is found that tuff heterogeneity, once again, contributes to a certain spread of the adsorption effect in the transient regime. Nevertheless, a precise enough estimation of the breakthrough point is possible to produce also with a simple experimental apparatus as the one set up for this study. A very regular behavior of measured quantities is observed even with single-point measurements. The property characterization would benefit greatly from a more intensive campaign and from the analysis of more samples in order to produce a quantitative estimate of the heterogeneity effect on parameter estimation.
A dedicated section was included to show the results of a preliminary attempt to model the adsorption capacity of adsorbent particles in transient regime. An original phenomenological function is proposed to parameterize the adsorption rate as a function of the saturation level. It is clear how the proposed function describes, with good approximation, the behavior of the material around the breakthrough point and in terms of total adsorption capacity. It still lacks precision in the flattening region near the saturation. Future works will be dedicated to quantify the acceptance level of the hypothesis with an appropriate statistical analysis. Preliminary results, however, show that the proposed CFD model for selective gas adsorption can be reliably used to predict the system behavior at the breakthrough point over different boundary conditions.
Adsorption isotherms for tuff and 13X were produced using a second custom experimental apparatus. As for the saturation curves, because of the non-automated nature of the procedure, it was impossible to perform multiple measurements of single points, resulting in large uncertainties in best-fit parameter estimates. From the results using three different models, it is found that more complex three-parameter models (i.e., Toth and Langmuir-Freundlich) fit data with a remarkable quality (on average higher than 95% considering a chi-squared probability), while the simpler two-parameter model (Langmuir) sometimes fails in reproducing the observed data. The failure is more evident for those cases for which the exponential index n, computed with the other two models, is far from unity.
Preliminary results show a high heterogeneity of tuff physical properties. The characterization of the CO2 adsorption performance clearly reflects the material variability. Design and sizing of an adsorption column for industrial applications will have to take into account this behavior. In a future development of this work, it would be interesting to increase the amount of collected data and to analyze a larger number of samples to quantitatively estimate the variability effect.
5. Conclusions
Tuff, a natural alternative to synthetic zeolites, was characterized with an intensive experimental campaign to prove its performance as a CO2 adsorbent for biogas upgrading applications, carbon capture and sequestration, or other processes requiring a selective removal of carbon dioxide from a gaseous mixture.
The results of this work clearly shows that tuff can be effectively used for CO2 adsorption. In order to measure tuff adsorption properties, several experimental activities were performed. Mercury porosimetry was used to determine the tuff physical properties according to common adsorbent classification parameters. Two different experimental apparatuses were used to perform an experimental characterization of tuff performance, both in transient and steady conditions.
Mercury intrusion porosimetry shows a particle porosity between 20.1% and 36.3%, a variable particle density between 977 and 1215 kg/m3, and an average pore diameter between 1.42 and 4.64 μm.
A saturation analysis in the transient regime was performed to relate the maximum amount of adsorbed CO2 to a given maximum concentration of CO2 in the purified (outlet) gas. Saturation curves were measured using a custom apparatus. A total of six tuff samples were analyzed, the inlet CO2 concentration being approximately 50%. At atmospheric pressure and ambient temperatures, the breakthrough point (outlet CO2 concentration of 3%) ranges from 0.029–0.036 kgCO2/kgTuff. The adsorption process was also simulated using a CFD approach and proposing a phenomenological parameterization of the particle adsorption rate as a function of the saturation level. The simplified model was validated against observations.
An adsorption equilibrium analysis was performed to study the relationship between the maximum amount of adsorbed CO2 and the main thermodynamic properties involved in the adsorption process. A second custom apparatus was set up allowing a precise measure up to approximately 0.4 MPa. The maximum amount of CO2 adsorbed is highly influenced by the sample pretreatment (temperature during thermal regeneration) and operative conditions (equilibrium pressure and temperature) of the adsorption process. In this study, experimental isotherms as a function of the equilibrium pressure were measured for tuff at 25 °C, 35 °C, and 50 °C and two regeneration temperatures (220 °C and 350 °C). Three analytic models were fitted to observed data. Fit probabilities, on average higher than 95%, are found for three-parameter models, while the two-parameter model fails in some cases. It is found that tuff regenerated at 350 °C has the same adsorption capacity of 13X regenerated at 220 °C (0.125 kgCO2/kgAdsorbent), while it is approximately 70% that of 13X using the same regeneration temperature.
Future analyses should investigate a larger parameter space, in order to reproduce typical working conditions for PSA applications. In this context, CFD simulations of a fixed-bed adsorption for CO2 removal, first proposed in this work, could represent a useful tool to test the performance of different design approaches and define the best configuration for industrial prototypes.


