
Application of Social Vulnerability Indicators to Climate Change for the Southwest Coastal Areas of Taiwan


 and
and
Abstract
:1. Introduction
2. Climate Change in Taiwan
2.1. Typhoon Surge Inundation
2.2. Flood Simulation
3. Methodology
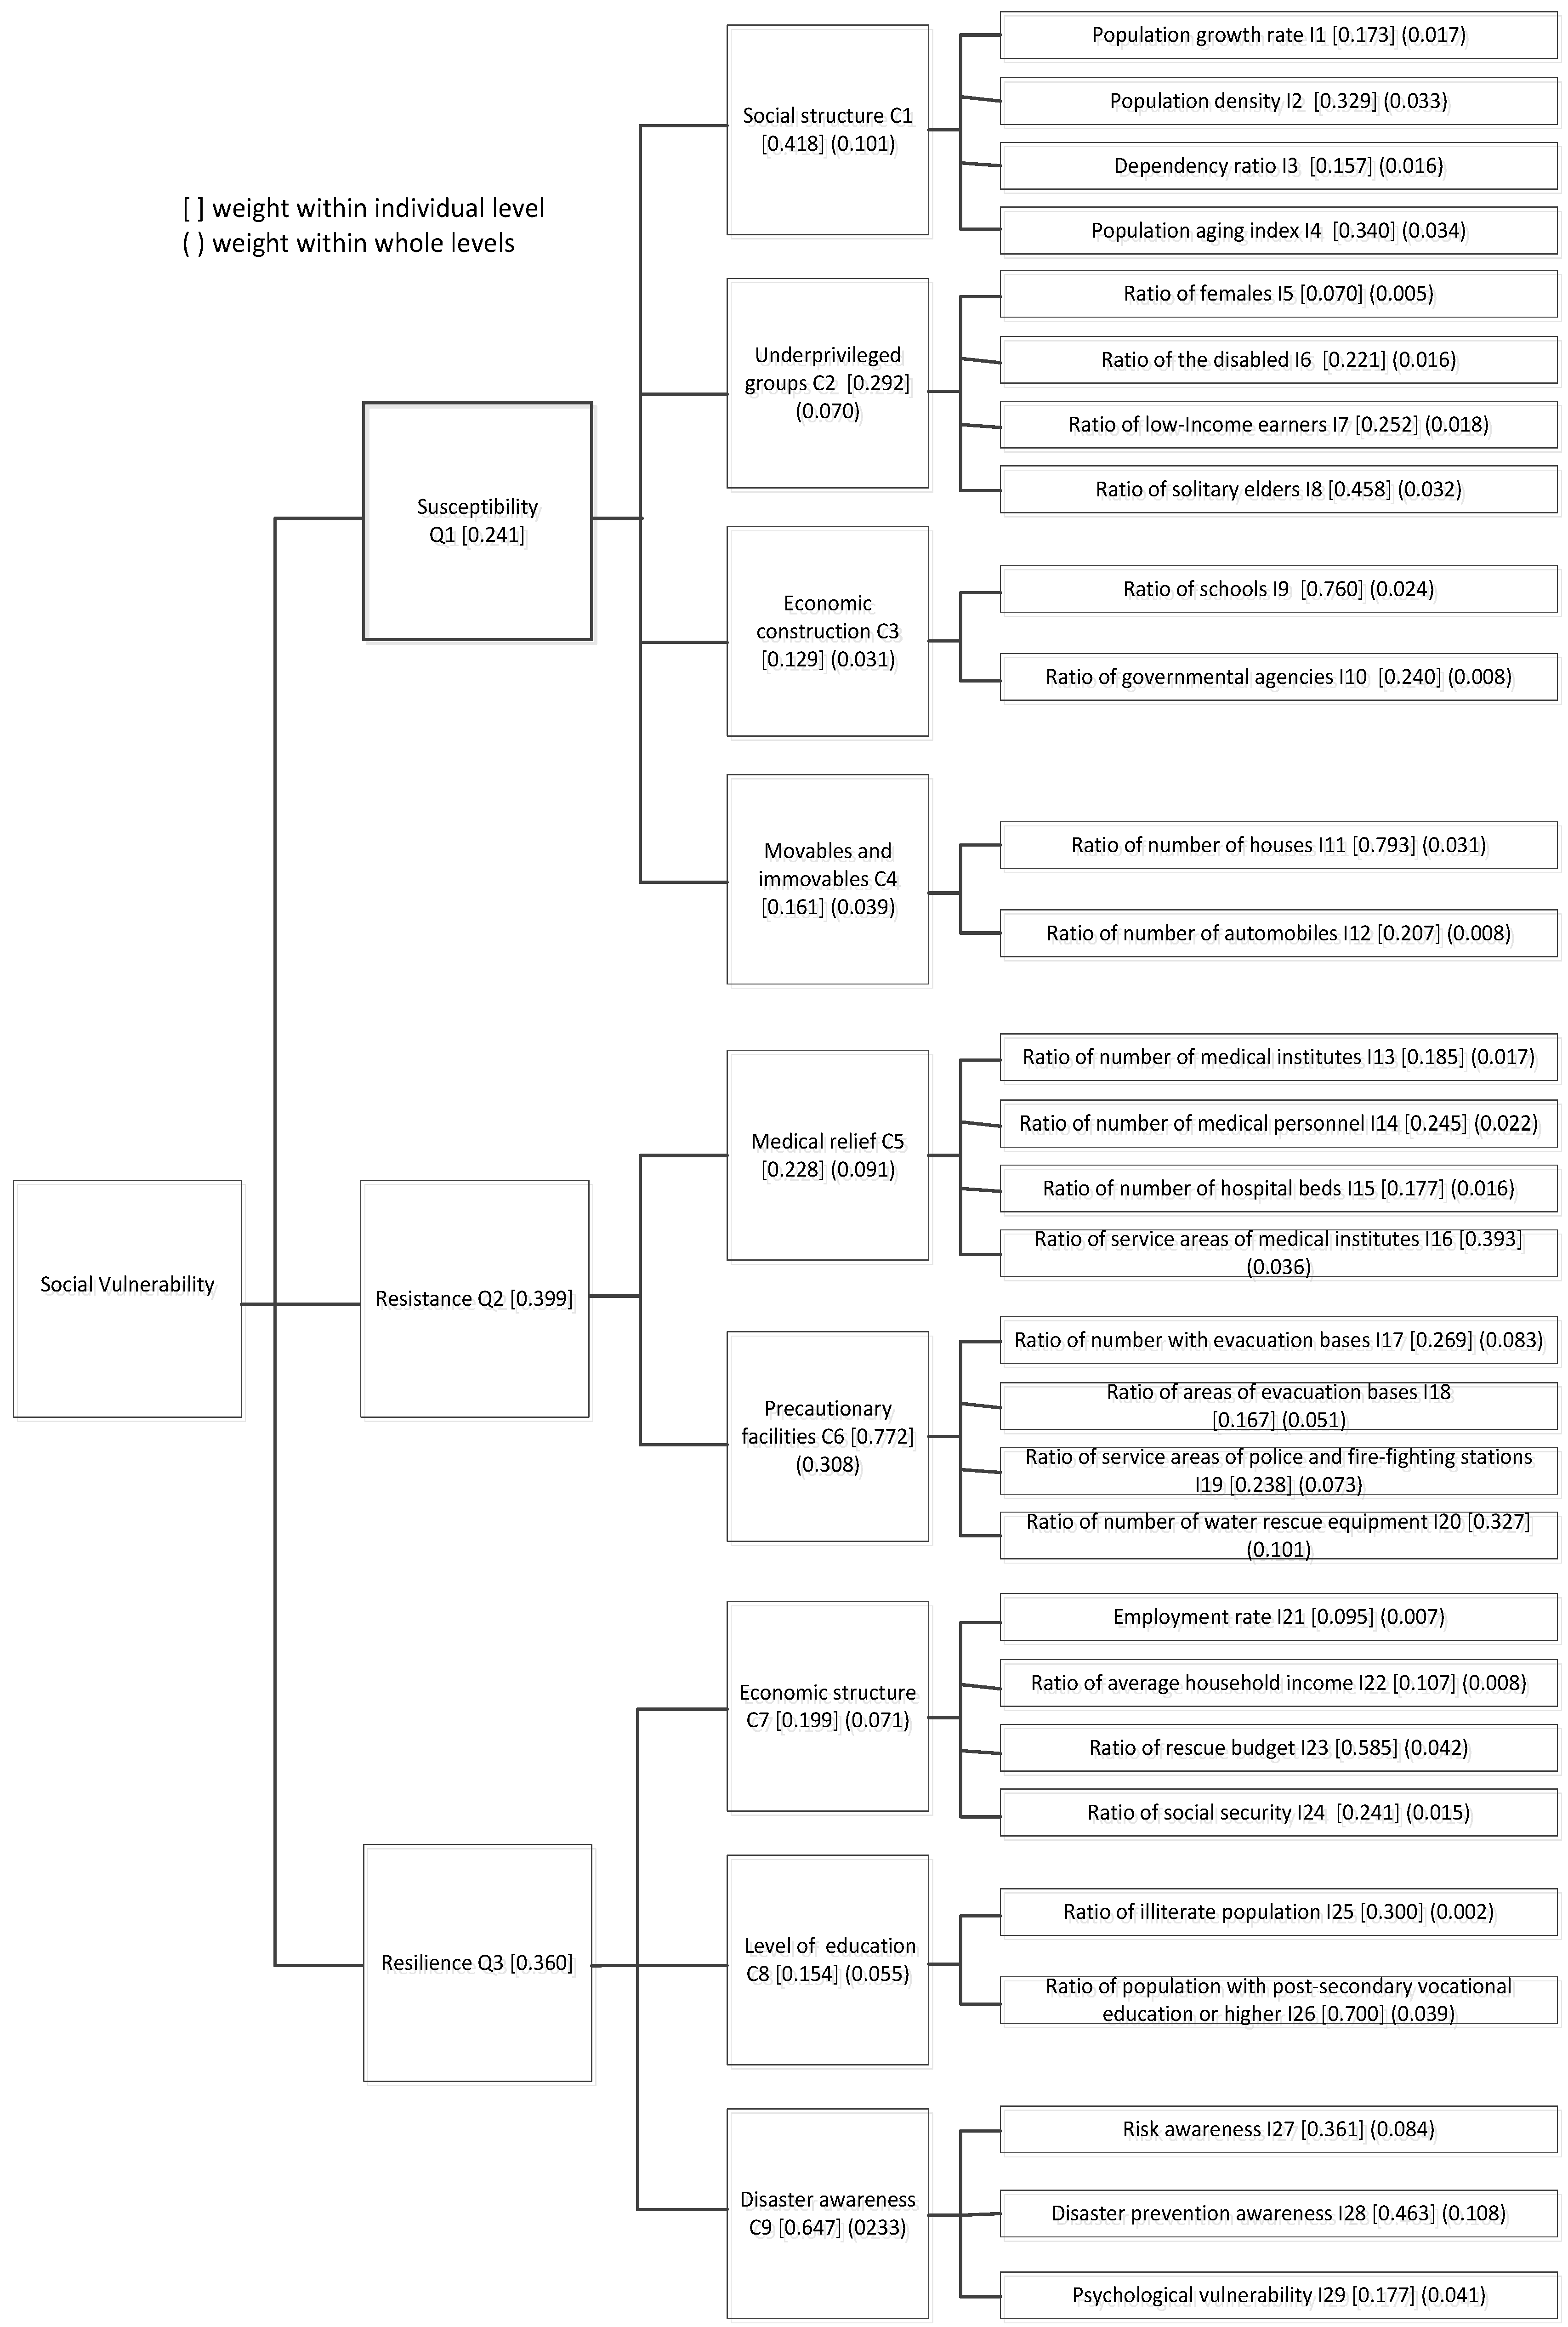
3.1. Selection of Indicators
3.2. Uniform Transformation of Indicator Variables
3.3. Allocation of Weight
3.4. Aggregation and Visualization
4. Results
4.1. Significant Criteria and Indicators
4.2. Susceptibility
4.3. Resistance
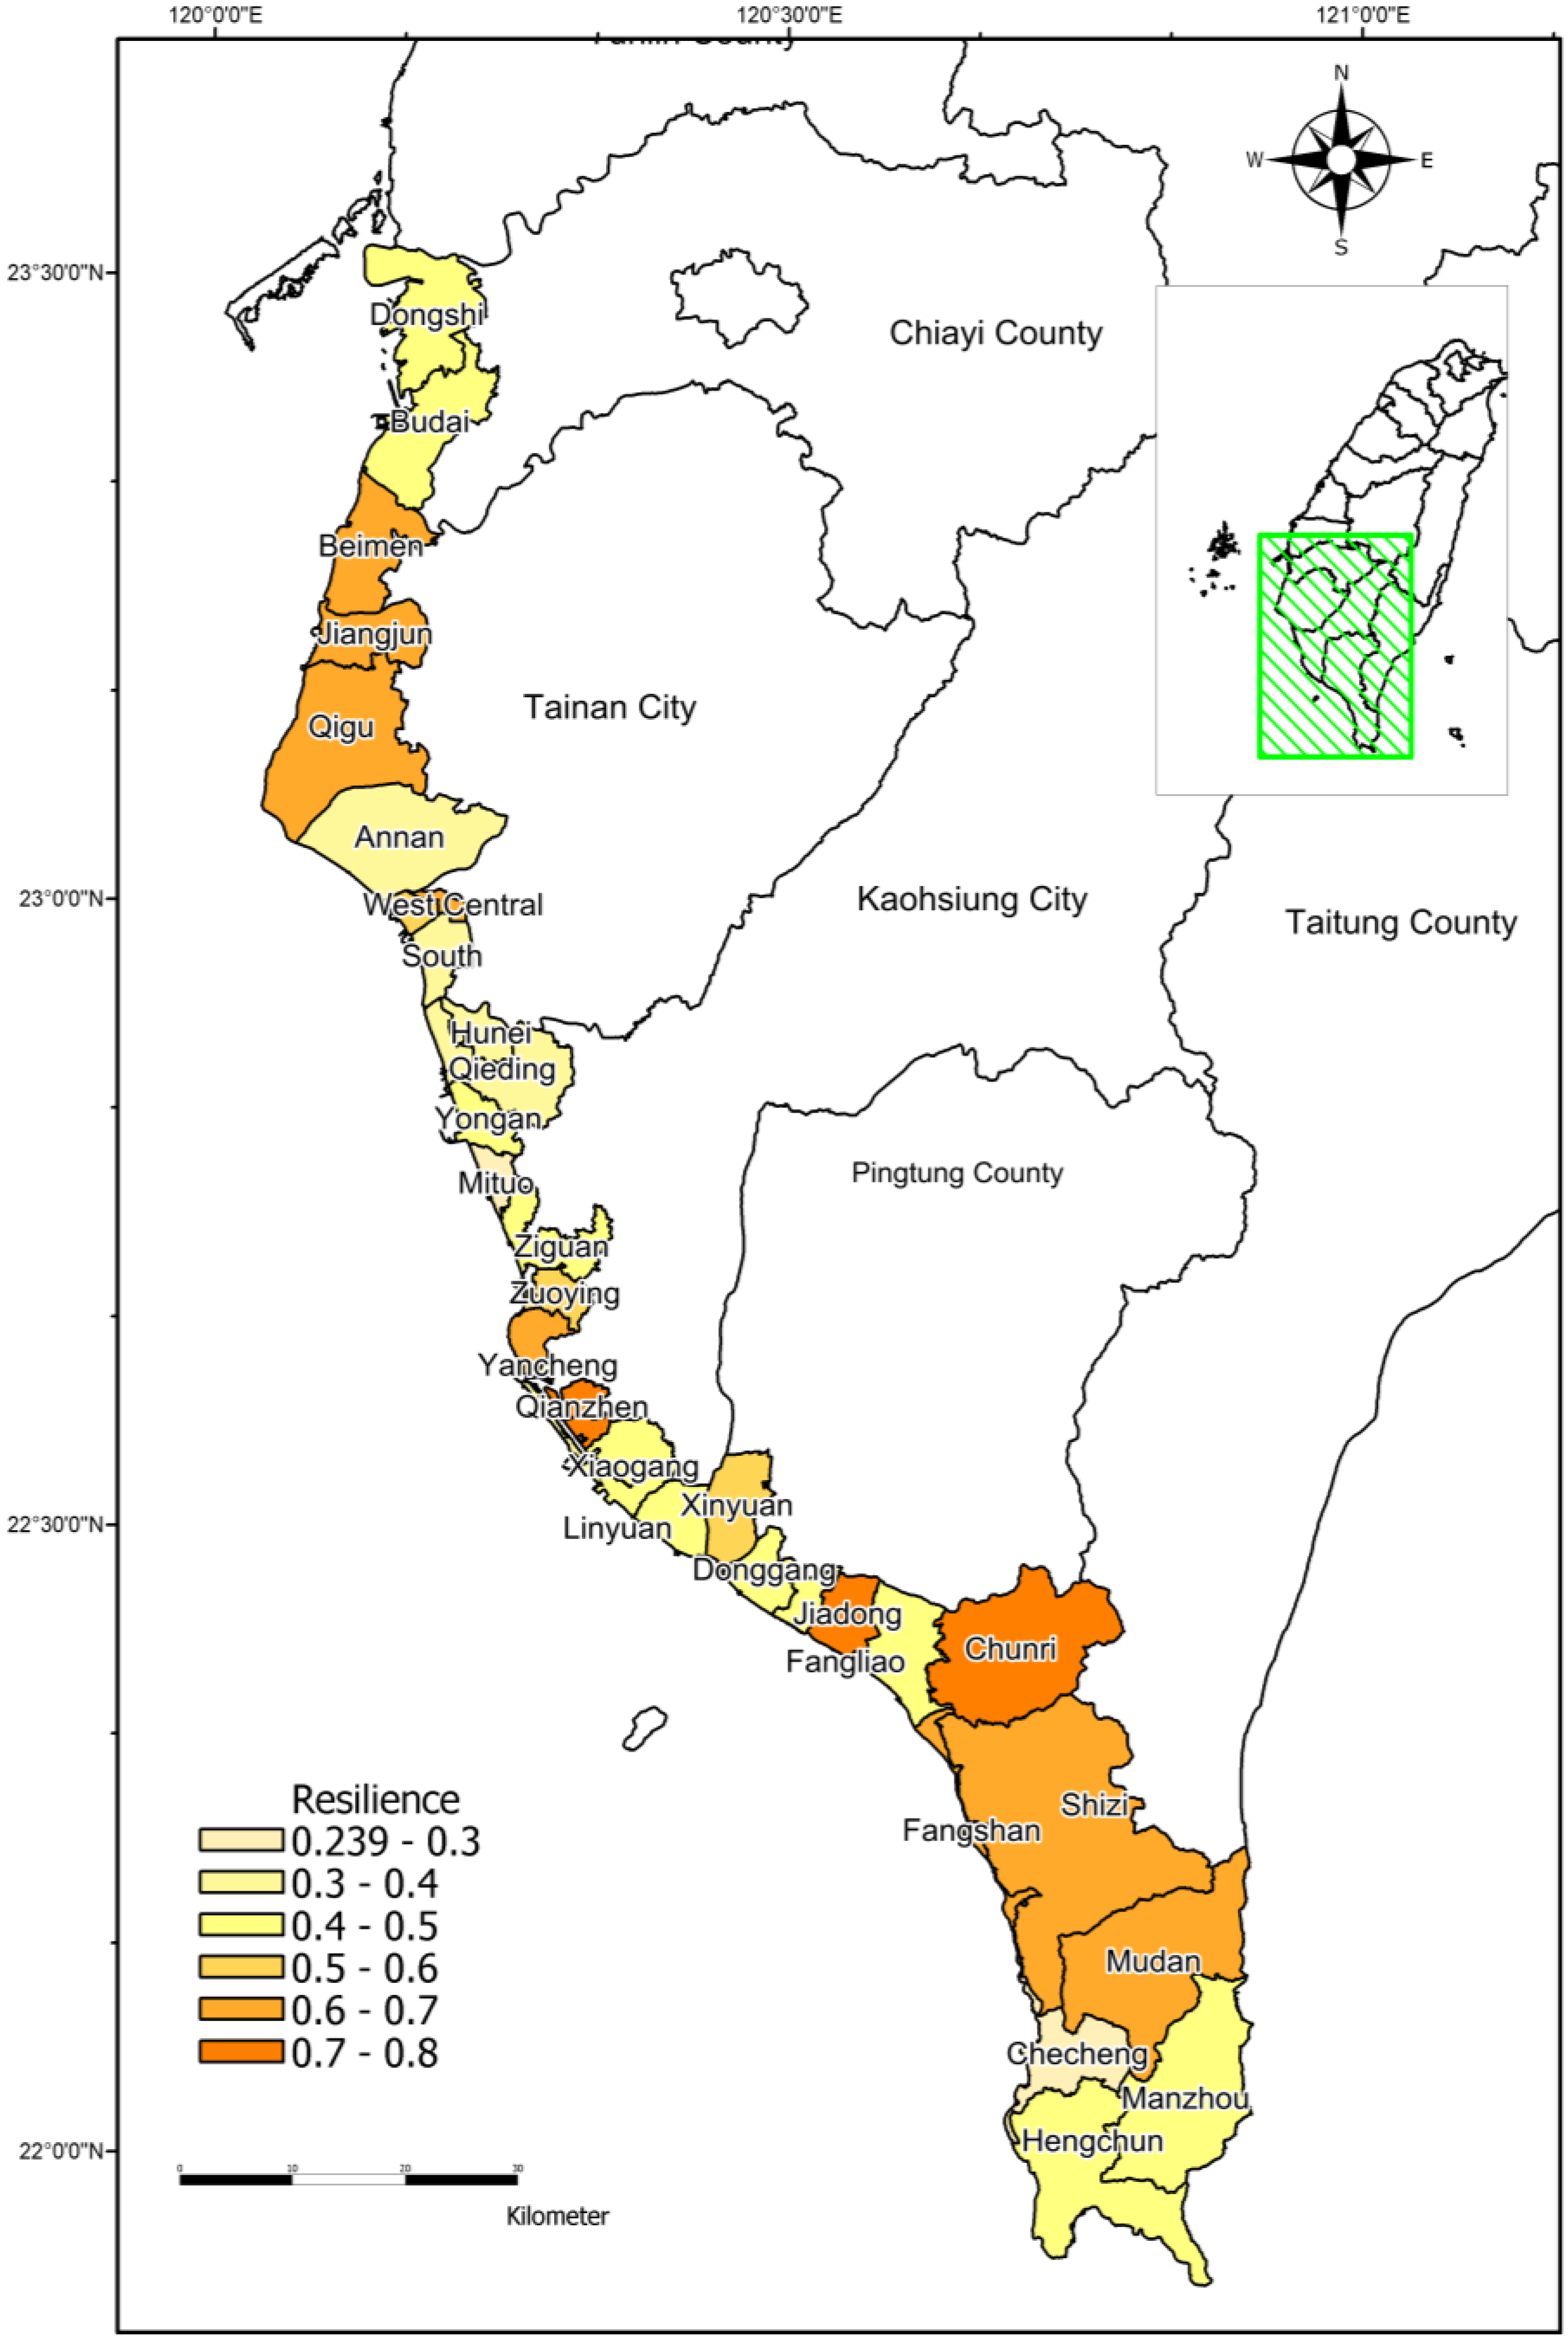
4.4. Resilience
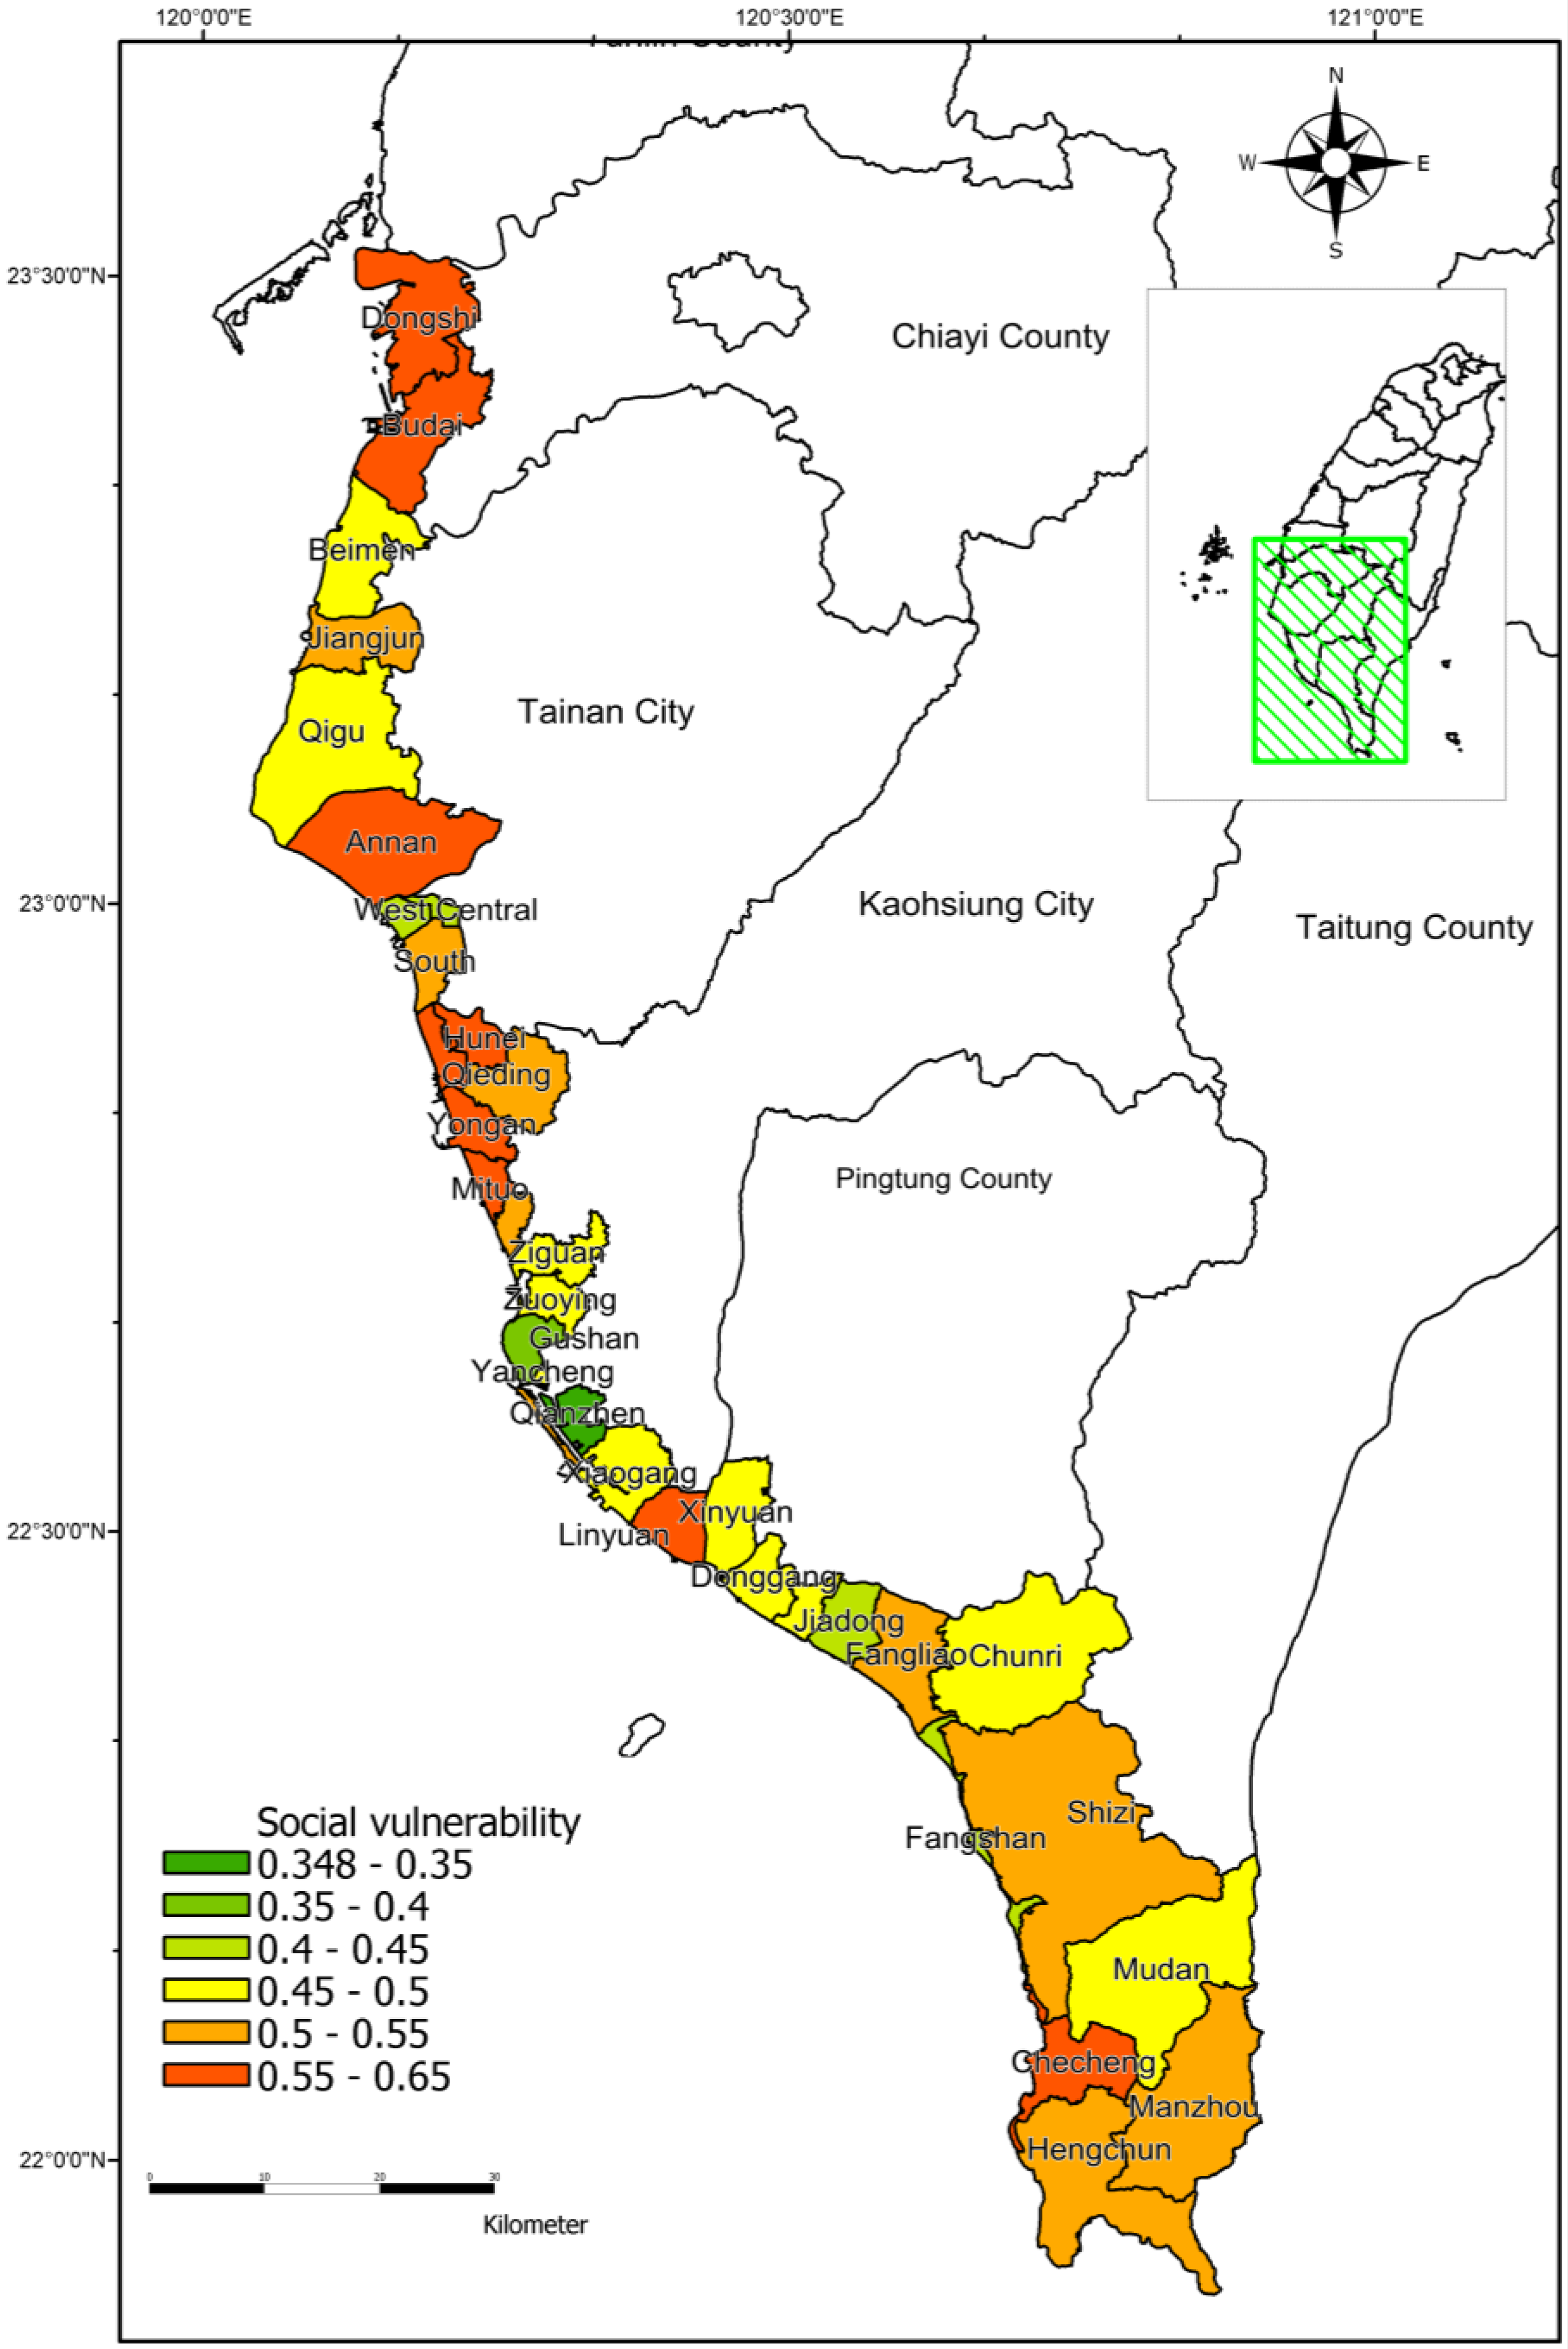
4.5. Social Vulnerability
5. Discussion
6. Conclusions
Acknowledgments
Author Contributions
Conflicts of Interest
Appendix A

| Dimension | Criteria | Indicator | Average Value | References | Data Availability |
|---|---|---|---|---|---|
| Susceptibility (Q1) | Social structure (C1) | Population growth rate (I1) | 4.60 | [19,52,53,54,55] | B |
| Population density (I2) | 4.70 | [53,56,57] | B | ||
| Dependency ratio (I3) | 4.10 | [55,58] | B | ||
| Population aging index (I4) | 4.75 | [55] | B | ||
| Underprivileged groups (C2) | Ratio of females (I5) | 4.00 | [53,59,60,61,62] | B | |
| Ratio of the disabled (I6) | 4.40 | [58,60,61] | L | ||
| Ratio of low-income earners (I7) | 4.30 | [56,58] | L | ||
| Ratio of solitary elders (I8) | 4.60 | [56,58,62] | L | ||
| Ratio of new residents | 4.10 | [56,58] | * | ||
| Economic construction (C3) | Ratio of schools (I9) | 4.00 | [56,58,62] | C | |
| Ratio of governmental agencies (I10) | 4.25 | [55,56] | C | ||
| Movables and immovables (C4) | Ratio of number of houses (I11) | 4.25 | [53,56,58,63] | F | |
| Ratio of number of automobiles (I12) | 4.00 | [56,59,63] | E | ||
| Resistance (Q2) | Medical relief (C5) | Ratio of number of medical institutes (I13) | 4.10 | [55,58] | L |
| Ratio of number of medical personnel (I14) | 4.10 | [55,58] | L | ||
| Ratio of number of hospital beds (I15) | 4.38 | [57,58] | L | ||
| Ratio of number of qualified first aid personnel | 4.00 | [55] | * | ||
| Ratio of service areas of medical institutes (I16) | 4.10 | [58] | J | ||
| Precautionary facilities (C6) | Ratio of number of policemen and firemen | 4.20 | [55,57] | * | |
| Ratio of areas with evacuation bases (I17) | 4.11 | [57] | I | ||
| Ratio of number of evacuation bases (I18) | 4.22 | [57] | C | ||
| Ratio of service areas of police and fire-fighting stations (I19) | 4.22 | [55] | K | ||
| Ratio of number of water rescue equipment (I20) | 4.30 | [64] | C, L | ||
| Resilience (Q3) | Environmental cleanliness | Ratio of number of waste cleaning vehicles | 4.22 | [55] | * |
| Ratio of number of waste transfer stations | 4.00 | [55] | * | ||
| Ratio of number of waste cleaning personnel | 4.22 | [55] | * | ||
| Economic structure (C7) | Employment rate (I21) | 4.30 | [56] | A | |
| Ratio of average household income (I22) | 4.22 | [21,60,65] | H | ||
| Ratio of industrial structures | 4.10 | [55,57] | * | ||
| Ratio of rescue budget (I23) | 4.50 | [54,66] | C | ||
| Ratio of social security (I24) | 4.38 | [53,56,67] | G | ||
| Ratio of fluctuation in produce prices | 4.25 | [56] | * | ||
| Level of education (C8) | Ratio of illiterate population (I25) | 4.13 | [58,63] | B | |
| Ratio of population with post-secondary vocational education or higher (I26) | 4.13 | [56,58] | B | ||
| Disaster awareness (C9) | Risk awareness (I27) | 4.63 | [54,57,66,68,69] | G | |
| Disaster prevention awareness (I28) | 4.22 | [49,53,70] | G | ||
| Psychological vulnerability (I29) | 4.00 | [68,71] | G | ||
| Ratio of number of emergency plans | 4.25 | [53,55,71,72,73,74] | * |
References
- Poortinga, W.; Spencec, A.; Whitmarshb, L.; Capstickb, S.; Pidgeonb, N.F. Uncertain climate: An investigation into public skepticism about anthropogenic climate change. Glob. Environ. Chang. 2011, 21, 1015–1024. [Google Scholar] [CrossRef]
- Urwin, K.; Jordan, A. Does public policy support or undermine climate change adaptation? Exploring policy interplay across different scales of governance. Glob. Environ. Chang. 2008, 18, 180–191. [Google Scholar] [CrossRef]
- Tribbia, J.; Moser, S.C. More than information: What coastal managers need to plan for climate change. Environ. Sci. Policy 2008, 11, 315–328. [Google Scholar] [CrossRef]
- Monirul, M.; Mirza, Q. Climate change and extreme weather events: Can developing countries adapt? Clim. Policy 2003, 3, 233–248. [Google Scholar]
- Byrne, J.; Inniss, V. Island sustainability and sustainable development in the context of climate change. In Sustainable Development for Island Societies: Taiwan and the World; Asia-Pacific Research Program, Academia Sinica and SARCS Secretariat; Hsiao, H.H.M., Liu, C.H., Tsai, H.M., Eds.; National Central University Press: Taipei, Taiwan, 2002; pp. 3–29. [Google Scholar]
- Intergovernmental Panel on Climate Change (IPCC). Managing the risks of extreme events and disasters to advance climate change adaptation. In A Special Report of Working Groups I and II of the Intergovernmental Panel on Climate Change; Field, C.B., Barros, V., Stocker, T.F., Qin, D., Dokken, D.J., Ebi, K.L., Mastrandrea, M.D., Mach, K.J., Plattner, G.K., Allen, S.K., Eds.; Cambridge University: Cambridge, UK; New York, NY, USA, 2012. [Google Scholar]
- Cai, F.; Su, X.; Liu, J.; Li, B.; Lei, G. Coastal erosion in China under the condition of global climate change and measures for its prevention. Prog. Nat. Sci. 2009, 19, 415–426. [Google Scholar] [CrossRef]
- Dow, K.; Downing, T.E. The Atlas of Climate Change; Earthscan: London, UK, 2007. [Google Scholar]
- McGranahan, G.; Balk, D.; Anderson, B. The rising tide: Assessing the risks of climate change and human settlements in low-elevation coastal zones. In Adapting Cities to Climate Change; Bicknell, J., Dodman, D., Satterthwaite, D., Eds.; Earthscan: London, UK, 2009. [Google Scholar]
- Cutter, S.L.; Boruff, B.J.; Shirley, W.L. Social vulnerability to environmental hazards. Soc. Sci. Q. 2003, 84, 242–261. [Google Scholar] [CrossRef]
- Intergovernmental Panel on Climate Change (IPCC). Climate Change 2007: Impacts, Adaptation and Vulnerability; Contribution of Working Group II to the Fourth Assessment Report of the Intergovernmental Panel on Climate Change; Cambridge University Press: Cambridge, UK, 2007. [Google Scholar]
- Smit, B.; Pilifosova, O. Adaptation to climate change on the context of sustainable development and equity. In Climate Change 2001: Impacts, Adaptation, and Vulnerability; McCarthy, J.J., Canziani, O.F., Leary, N.A., Dokken, D.J., White, K.S., Eds.; Cambridge University Press: Cambridge, UK, 2001; pp. 879–912. [Google Scholar]
- Wilbanks, T.; Lankao, P.R. Industry, settlement and society. In Climate Change 2007: Impacts, Adaptation and Vulnerability; Parry, M., Canziani, O., Palutikof, J., van der Linden, P., Hanson, C., Eds.; Cambridge University Press: Cambridge, UK, 2007; pp. 358–390. [Google Scholar]
- Timmerman, P. Vulnerability, Resilience and the Collapse of Society: A Review of Models and Possible Climatic Applications; University of Toronto: Toronto, ON, Canada, 1981. [Google Scholar]
- Adger, W.N.; Kelly, P.M. Social vulnerability to climate change and the architecture of entitlements. Mitig. Adapt. Strateg. Glob. Chang. 1999, 4, 253–266. [Google Scholar] [CrossRef]
- Cutter, S.L.; Mitchell, J.T.; Scott, M.S. Revealing the vulnerability of people and places: A case study of Georgetown County, South Carolina. Ann. Assoc. Am. Geogr. 2000, 90, 713–737. [Google Scholar] [CrossRef]
- Hinkel, J.; Klein, R.J.T. Integrating knowledge to assess coastal vulnerability to sea-level rise: The development of the DIVA tool. Glob. Environ. Chang. 2009, 19, 384–395. [Google Scholar] [CrossRef]
- Wisner, B.; Blaikie, P.; Cannon, T.; Davis, I. At Risk: Natural Hazards, People’s Vulnerability and Disasters, 2nd ed.; Routledge: New York, NY, USA, 2004. [Google Scholar]
- Cutter, S.L. The vulnerability of science and the science of vulnerability. Ann. Assoc. Am. Geogr. 2003, 93, 1–12. [Google Scholar] [CrossRef]
- White, G.F. Human Adjustment to Floods; Paper No. 29; Department of Geography Research, The University of Chicago: Chicago, IL, USA, 1945. [Google Scholar]
- White, G.F.; Haas, J. Assessment of Research on Natural Hazards; MIT Press: Cambridge, MA, USA, 1975. [Google Scholar]
- Adger, W.N. Vulnerability. Glob. Environ. Chang. 2006, 16, 268–281. [Google Scholar] [CrossRef]
- Nicholls, R.J.; Wong, P.P. Coastal system and low-lying areas. In Climate Change 2007: Impacts, Adaptation and Vulnerability; Parry, M., Canziani, O., Palutikof, J., van der Linden, P., Hanson, C., Eds.; Cambridge University Press: Cambridge, UK, 2007; pp. 316–357. [Google Scholar]
- Yasuhara, K.; Komine, H.; Murakami, S.; Chen, G.; Mitani, Y.; Duc, D.M. Effects of climate change on geo-disasters in coastal zones and their adaptation. Geotext. Geomembr. 2012, 30, 24–34. [Google Scholar] [CrossRef]
- Klein, R.J.T.; Nicholls, R.J.; Thomalla, F. Resilience to natural hazards: How useful is this concept? Environ. Hazards 2003, 5, 35–45. [Google Scholar] [CrossRef]
- Cutter, S.L.; Emrich, C.T.; Webb, J.J.; Morath, D. Social Vulnerability to Climate Variability Hazards: A Review of the Literature; Hazards and Vulnerability Research Institute, Department of Geography University of South Carolina Columbia Press: Columbia, SC, USA, 2009. [Google Scholar]
- Tapsell, S.; McCarthy, S.; Faulkner, H.; Alexander, M. Social Vulnerability to Natural Hazards; Flood Hazard Research Centre, Middlesex University: London, UK, 2010. [Google Scholar]
- Hsu, T.W.; Yu, P.S.; Hwuang, C.J.; Lan, Y.J.; Lin, J.Y.; Chen, S.T.; Yang, T.C.; Lu, G.Y.; Chang, K.S.; Chen, C.C.; et al. Strengthening Sustainable Water Resources Utilization and Adaptive Capacity to Climate Change; Water Resources Agency, Ministry of Economic Affairs: Taipei, Taiwan, 2011. (In Chinese)
- Singh, A.; Pathirana, S.; Shi, H. Assessing Coastal Vulnerability: Developing a Global Index for Measuring Risk. UNEP, 2005. Available online: http://www.unep.org/publications/search/pub_details_s.asp?ID=3752 (accessed on 2 January 2016).
- Water Resources Agency of the Ministry of Economic Affairs. White Paper on Water Resources; Water Resources Agency of the Ministry of Economic Affairs: Taipei, Taiwan, 2006. (In Chinese)
- Li, W.S.; Yeh, K.C.; Lin, C.C.; Shieh, C.L.; Wen, J.C.; Yeh, Y.L.; Hsieh, L.S.; Chen, L.K.; Li, H.C.; Wang, Y.W. Disaster Survey and Analysis of Morakot Typhoon; National Science and Technology Center for Disaster Reduction: Taipei, Taiwan, 2009. (In Chinese)
- Adger, W.N.; Brooks, N.; Bentham, G.; Agnew, M.; Eriksen, S. New Indicators of Vulnerability Adaptive Capacity; Tyndall Centre for Climate Change Research Technical Report 7; Tyndall Centre for Climate Change Research: Manchester, UK, 2004. [Google Scholar]
- Vincent, K. Creating an Index of Social Vulnerability to Climate Change in Africa; Tyndall Centre for Climate Research Working Paper No. 56; University of East Anglia: Norwich, UK, 2004. [Google Scholar]
- Murry, J.W.; Hammons, J.O. Delphi: A versatile methodology for conducting qualitative research. Rev. High. Educ. 1995, 18, 423–436. [Google Scholar]
- Dixon, E.C.; Maddern, G.; Sutherland, F.; Hemming, A.; Wei, A.; Sherman, M.; Moore, M.; Mckay, A.; Urbach, D.; Labrie, M.; et al. Development of quality indicators of care for patients undergoing hepatic resection for metastatic colorectal cancer using a Delphi process. J. Surg. Res. 2009, 156, 32–38. [Google Scholar] [CrossRef] [PubMed]
- Füssel, H.M. How inequitable is the global distribution of responsibility, capability, and vulnerability to climate change: A comprehensive indicator-based assessment. Globe Environ. Chang. 2010, 20, 597–611. [Google Scholar] [CrossRef]
- Birkmann, J. Measuring Vulnerability to Natural Hazards: Towards Disaster Resilient Societies; TERI Press: New Delhi, India, 2006. [Google Scholar]
- Moss, R.H.; Brenkert, A.L.; Malone, E.L. Vulnerability to Climate Change: A Quantitative Approach; US Department of Energy, Battelle Institute: Washington, DC, USA, 2001.
- Li, Y.J. Social vulnerability indicator as a sustainable planning tool. Environ. Impact Assess. Rev. 2014, 44, 31–42. [Google Scholar]
- Saaty, T.L. That is not the analytic hierarchy process: What the AHP is and what it is not. J. Multi-Criteria Decis. Anal. 1997, 6, 324–335. [Google Scholar] [CrossRef]
- Nydick, R.; Hill, R. Using the Analytical Hierarchy Process to Structure the Supplier Selection Procedure. Int. J. Purch. Mater. Manag. 1992, 28, 31–36. [Google Scholar]
- Teng, C.Y. Project Evaluation: Methods and Applications, 2nd ed.; The Research Centre of Logistics Planning and Management Press: Taipei, Taiwan, 2005. [Google Scholar]
- Chiu, S.Y. A Study on Establishment and Application of Coastal Vulnerability Indicators in Taiwan. Master’s Thesis, National Taiwan Ocean University, Keelung, Taiwan, 2010. [Google Scholar]
- Chang, S.W. The Analysis of Coastal Vulnerability in Taiwan Area under Climate Change. Master’s Thesis, National Taiwan Ocean University, Keelung, Taiwan, 2011. [Google Scholar]
- Polsky, C.R.; Neff, R.; Yarnal, B. Building comparable global change vulnerability assessments: The vulnerability scoping diagram. Glob. Environ. Chang. 2007, 17, 472–485. [Google Scholar] [CrossRef]
- Ahsan, M.N.; Warner, J. The socioeconomic vulnerability index: A pragmatic approach for assessing climate change led risks—A case study in the south-western coastal Bangladesh. Int. J. Dis. Risk Reduct. 2014, 8, 32–49. [Google Scholar] [CrossRef]
- Hinkel, J. Indicators of vulnerability and adaptive capacity: Towards a clarification of the science-policy interface. Globe Environ. Chang. 2011, 21, 198–208. [Google Scholar] [CrossRef]
- Li, H.C.; Yang, H.H.; Liao, K.M.; Shaw, D.G. Establishment of Social Vulnerability Indicators for Flooding. J. Archit. Plan. 2009, 10, 163–182. (In Chinese) [Google Scholar]
- King, D.; MacGregor, C. Using social indicators to measure community vulnerability to natural hazards. Aust. J. Emerg. Manag. 2000, 15, 52–57. [Google Scholar]
- Rygel, L.; O’Sullivan, D.; Yarnal, B. A method for constructing a social vulnerability index: An application to hurricane storm surges in a developed country. Mitig. Adapt. Strategies Glob. Chang. 2006, 11, 741–764. [Google Scholar] [CrossRef]
- Zahran, S.; Brody, S.D.; Vedlitz, A.; Grover, H.; Miller, C. Vulnerability and capacity: Explaining local commitment to climate change policy. Environ. Plan. C Govern. Policy 2008, 26, 544–562. [Google Scholar] [CrossRef]
- Bollin, C.; Hidajat, R. Community-Based Disaster Risk Index: Pilot Implementation in Indonesia. In Measuring Vulnerability to Natural Hazards—Towards Disaster Resilient Societies; Birkmann, J., Ed.; UNU-Press: Tokyo, Japan; New York, NY, USA; Paris, France, 1998; pp. 271–289. [Google Scholar]
- Kuo, Y.L.; Xiao, D.J.; Lin, Y.L.; Hsieh, H.W.; Chang, M.C. Review of Vulnerability of Natural Disasters and Factors of Social Vulnerability; National Science and Technology Center for Disaster Reduction: New Taipei, Taiwan, 2009. (In Chinese)
- Chen, L.Y. The Assessment of Typhoon and Flood Vulnerabilities in Ta-Chia River Basin: The Application of Analytic Network Process; Department of Real Estate & Built Environment, College of Public Affairs, National Taipei University: New Taipei, Taiwan, 2009. (In Chinese) [Google Scholar]
- Chen, Y.C.; Li, C.H.; Su, W.R.; Tsai, Y.F. Using AHP to map flood vulnerability of the Ping-Tung coastal area. J. Taiwan Water Conserv. 2011, 59, 30–46. (In Chinese) [Google Scholar]
- Dwyer, A.; Zoppou, C.; Mielsen, O.; Day, S.; Roberts, S. Quantifying Social Vulnerability: A Methodology for Identifying Those at Risk to natural Hazards; Geoscience Australia Record; Australia Government: Canberra, Australia, 2004.
- Chen, L.C. A Study on the Vulnerability and Resilience Assessment of Spatial Planning and Management in Community-Level Area; National Science Council: Taipei, Taiwan, 2009. (In Chinese) [Google Scholar]
- Fekete, A.; Damm, M.; Birkmann, J. Scales as a challenge for vulnerability assessment. Nat. Hazards 2009, 55, 729–747. [Google Scholar] [CrossRef]
- Granger, K.; Jones, T.; Leiba, M.; Scott, G. Community Risk in Cairns: A Multi-Hazard Risk Assessment; Commonwealth of Australia: Canberra, Australia, 1999. [Google Scholar]
- Schmidt-Thomé, P. The Spatial Effects and Management of Natural and Technological Hazards in Europe. Available online: https://www.espon.eu/export/sites/default/Documents/Projects/ESPON2006Projects/ThematicProjects/NaturalHazards/fr-1.3.1_revised-full.pdf (accessed on 6 December 2016).
- Hsiao, H.C. Establishing a Flood Hazard Vulnerability Assessment Model—A Case of Shijhih City. Master’s Thesis, Chinese Cultural University, Taipei, Taiwan, 2008. [Google Scholar]
- Yap, K.H. Assessment of Social Vulnerability of Environmental Disasters in Taiwan; Taiwanese Sociological Association: Taipei, Taiwan, 2010. (In Chinese) [Google Scholar]
- Deduce, C. Indicators Guideline: To Adopt and Indicator-Based Approach to Evaluate Coastal Sustainable Development; Department of the Environment and Housing, Government of Catalonia: Barcelona, Spain, 2007.
- Wu, J.Y.; Huang, Y.S. The Establishment of Vulnerability Evaluation Indexes: The Case Study on Shuili Township, Nantou. City Plan. 2011, 38, 195–218. (In Chinese) [Google Scholar]
- Bolin, R.; Stanford, L. Shelter, housing and recovery: A comparison of U.S. disasters. Disasters 1991, 15, 24–34. [Google Scholar] [CrossRef] [PubMed]
- Heijmans, A. Vulnerability: A Matter of Perception; Benfield Greig Hazard Research Centre: London, UK, 2001. [Google Scholar]
- Wilhelmi, O.V.; Wilhite, D.A. Assessing vulnerability to agricultural drought: A Nebraska case study. Nat. Hazards 2002, 25, 37–58. [Google Scholar] [CrossRef]
- Fischhoff, B.; Slovic, P.; Lichtenstein, S.; Read, S.; Combs, B. How safe is safe enough? A psychometric study of attitudes toward technological risks and benefits. Policy Sci. 1978, 9, 127–152. [Google Scholar] [CrossRef]
- Slovic, P. Perception of Risk; Earthscan: London, UK, 2000. [Google Scholar]
- Anderson, M.B. Vulnerability to Disaster and Sustainable Development: A General Framework for Assessing Vulnerability. In Storms; Pielke, R., Pielke, R., Eds.; Routledge: London, UK, 2000; Volume 1, pp. 41–51. [Google Scholar]
- Schmidt-Thomé, P.; Kallio, H.; Jarva, J.; Tarvainen, T.; Greiving, S.; Fleischhauer, M.; Peltonen, L.; Kumpulainen, S.; Olfert, A.; Bärring, L.; et al. The Spatial Effects and Management of Natural and Technological Hazards in Europe; The ESPON Monitoring Committee: Luxembourg, 2005; pp. 1–197. [Google Scholar]
- Birkmann, C.; Dumitru, R.C.; Prokosch, H.U. Evaluation of health-related Internet use in Germany. Methods Inf. Med. 2006, 45, 367–376. [Google Scholar] [PubMed]
- Schneiderbauer, S.; Ehrlich, D. Social Levels and Hazard (in) Dependence in Determining Vulnerability. In Measuring Vulnerability to Natural Hazards: Towards Disaster Resilient Societies; Birkmann, J., Ed.; United Nations University Press: New York, NY, USA, 2006. [Google Scholar]
- Peng, K.H.; Lin, S.M. A Study on the Assessment Criteria and Weight Distribution of Seismic Hazards in the Urbanized Areas of Taiwan. J. Archit. 2011, 53, 57–77. (In Chinese) [Google Scholar]


| Municipality | Township/District | Social Vulnerability | Susceptibility | Resistance | Resilience | Social Structure | Underprivileged Groups | Economic Construction | Movables and Immovables | Medical Relief | Precautionary Facilities | Economic Structure | Educational Levels | Disaster Awareness |
|---|---|---|---|---|---|---|---|---|---|---|---|---|---|---|
| Chiayi | Dongshi | 0.641 | 0.610 | 0.283 | 0.421 | 0.644 | 0.843 | 0.400 | 0.266 | 0.306 | 0.276 | 0.397 | 0.108 | 0.503 |
| Tainan | Annan | 0.624 | 0.552 | 0.376 | 0.329 | 0.415 | 0.586 | 0.543 | 0.856 | 0.536 | 0.329 | 0.287 | 0.781 | 0.234 |
| Chiayi | Budai | 0.620 | 0.507 | 0.274 | 0.423 | 0.610 | 0.536 | 0.396 | 0.275 | 0.316 | 0.261 | 0.405 | 0.238 | 0.473 |
| Pingtung | Checheng | 0.613 | 0.474 | 0.436 | 0.239 | 0.579 | 0.581 | 0.222 | 0.212 | 0.306 | 0.474 | 0.435 | 0.225 | 0.182 |
| Kaohsiung | Mituo | 0.608 | 0.360 | 0.352 | 0.270 | 0.480 | 0.174 | 0.352 | 0.395 | 0.319 | 0.362 | 0.546 | 0.079 | 0.230 |
| Kaohsiung | Qieding | 0.580 | 0.383 | 0.361 | 0.355 | 0.453 | 0.264 | 0.360 | 0.439 | 0.364 | 0.360 | 0.628 | 0.238 | 0.299 |
| Kaohsiung | Hunei | 0.569 | 0.390 | 0.360 | 0.389 | 0.492 | 0.228 | 0.366 | 0.436 | 0.339 | 0.366 | 0.561 | 0.546 | 0.299 |
| Kaohsiung | Yong’an | 0.561 | 0.306 | 0.299 | 0.424 | 0.377 | 0.174 | 0.274 | 0.385 | 0.309 | 0.296 | 0.715 | 0.203 | 0.387 |
| Kaohsiung | Linyuan | 0.552 | 0.433 | 0.416 | 0.404 | 0.360 | 0.361 | 0.572 | 0.640 | 0.431 | 0.412 | 0.806 | 0.458 | 0.268 |
| Pingtung | Hengchun | 0.546 | 0.520 | 0.467 | 0.423 | 0.482 | 0.712 | 0.481 | 0.301 | 0.378 | 0.493 | 0.603 | 0.415 | 0.369 |
| Kaohsiung | Luzhu | 0.542 | 0.425 | 0.449 | 0.388 | 0.414 | 0.276 | 0.679 | 0.520 | 0.414 | 0.459 | 0.698 | 0.506 | 0.265 |
| Tainan | South District | 0.541 | 0.627 | 0.564 | 0.400 | 0.558 | 0.733 | 0.414 | 0.782 | 0.670 | 0.533 | 0.305 | 0.851 | 0.322 |
| Pingtung | Manzhou | 0.537 | 0.449 | 0.440 | 0.429 | 0.579 | 0.489 | 0.238 | 0.207 | 0.301 | 0.481 | 0.542 | 0.333 | 0.417 |
| Pingtung | Fangliao | 0.531 | 0.473 | 0.473 | 0.424 | 0.480 | 0.666 | 0.268 | 0.270 | 0.384 | 0.500 | 0.550 | 0.273 | 0.422 |
| Kaohsiung | Zihguan | 0.531 | 0.356 | 0.417 | 0.411 | 0.339 | 0.305 | 0.394 | 0.465 | 0.385 | 0.427 | 0.966 | 0.162 | 0.299 |
| Kaohsiung | Qijin | 0.520 | 0.430 | 0.583 | 0.305 | 0.558 | 0.299 | 0.287 | 0.448 | 0.526 | 0.600 | 0.465 | 0.418 | 0.229 |
| Tainan | Jiangjun | 0.510 | 0.523 | 0.352 | 0.651 | 0.598 | 0.629 | 0.282 | 0.332 | 0.311 | 0.364 | 0.877 | 0.383 | 0.646 |
| Pingtung | Shizi | 0.503 | 0.255 | 0.239 | 0.616 | 0.259 | 0.285 | 0.256 | 0.191 | 0.300 | 0.221 | 0.592 | 0.380 | 0.680 |
| Kaohsiung | Nanzi | 0.497 | 0.626 | 0.646 | 0.431 | 0.556 | 0.401 | 0.961 | 0.950 | 0.704 | 0.629 | 0.850 | 0.841 | 0.204 |
| Tainan | Beimen | 0.496 | 0.428 | 0.296 | 0.689 | 0.497 | 0.456 | 0.302 | 0.297 | 0.331 | 0.286 | 0.311 | 0.579 | 0.831 |
| Kaohsiung | Yancheng | 0.489 | 0.489 | 0.539 | 0.481 | 0.730 | 0.222 | 0.362 | 0.449 | 0.629 | 0.512 | 0.764 | 0.816 | 0.314 |
| Pingtung | Mudan | 0.487 | 0.267 | 0.236 | 0.673 | 0.291 | 0.276 | 0.263 | 0.195 | 0.301 | 0.216 | 0.501 | 0.456 | 0.778 |
| Pingtung | Linbian | 0.485 | 0.387 | 0.491 | 0.477 | 0.541 | 0.278 | 0.306 | 0.252 | 0.342 | 0.535 | 0.398 | 0.463 | 0.504 |
| Tainan | Qigu | 0.484 | 0.469 | 0.356 | 0.682 | 0.552 | 0.444 | 0.414 | 0.339 | 0.307 | 0.370 | 0.631 | 0.324 | 0.783 |
| Kaohsiung | Xiaogang | 0.476 | 0.569 | 0.688 | 0.402 | 0.400 | 0.432 | 0.950 | 0.946 | 0.592 | 0.717 | 0.748 | 0.722 | 0.220 |
| Pingtung | Chunri | 0.476 | 0.308 | 0.233 | 0.734 | 0.352 | 0.345 | 0.227 | 0.189 | 0.314 | 0.209 | 0.236 | 0.305 | 0.989 |
| Pingtung | Donggang | 0.473 | 0.370 | 0.527 | 0.459 | 0.312 | 0.422 | 0.444 | 0.368 | 0.615 | 0.501 | 0.549 | 0.468 | 0.429 |
| Pingtung | Xinyuan | 0.467 | 0.365 | 0.412 | 0.598 | 0.436 | 0.327 | 0.294 | 0.309 | 0.320 | 0.439 | 0.607 | 0.275 | 0.673 |
| Kaohsiung | Zuoying | 0.453 | 0.748 | 0.700 | 0.574 | 0.667 | 0.632 | 0.998 | 0.965 | 0.892 | 0.643 | 0.817 | 0.937 | 0.414 |
| Pingtung | Jiadong | 0.438 | 0.466 | 0.414 | 0.746 | 0.630 | 0.415 | 0.318 | 0.252 | 0.310 | 0.445 | 0.600 | 0.454 | 0.861 |
| Tainan | Anping | 0.416 | 0.457 | 0.669 | 0.518 | 0.489 | 0.380 | 0.404 | 0.554 | 0.523 | 0.712 | 0.229 | 0.969 | 0.499 |
| Pingtung | Fangshan | 0.415 | 0.355 | 0.476 | 0.666 | 0.507 | 0.269 | 0.251 | 0.197 | 0.304 | 0.527 | 0.238 | 0.189 | 0.911 |
| Tainan | Central West District | 0.405 | 0.673 | 0.739 | 0.616 | 0.786 | 0.589 | 0.538 | 0.641 | 0.805 | 0.719 | 0.506 | 0.934 | 0.574 |
| Kaohsiung | Gushan | 0.390 | 0.626 | 0.727 | 0.637 | 0.622 | 0.352 | 0.892 | 0.918 | 0.788 | 0.710 | 0.671 | 0.861 | 0.574 |
| Kaohsiung | Qianzhen | 0.348 | 0.681 | 0.784 | 0.728 | 0.599 | 0.505 | 0.994 | 0.967 | 0.789 | 0.783 | 0.587 | 0.877 | 0.737 |
| Average | 0.509 | 0.467 | 0.459 | 0.498 | 0.504 | 0.425 | 0.449 | 0.463 | 0.450 | 0.462 | 0.561 | 0.488 | 0.480 | |
© 2016 by the authors; licensee MDPI, Basel, Switzerland. This article is an open access article distributed under the terms and conditions of the Creative Commons Attribution (CC-BY) license (http://creativecommons.org/licenses/by/4.0/).
Share and Cite
Wu, C.-C.; Jhan, H.-T.; Ting, K.-H.; Tsai, H.-C.; Lee, M.-T.; Hsu, T.-W.; Liu, W.-H. Application of Social Vulnerability Indicators to Climate Change for the Southwest Coastal Areas of Taiwan. Sustainability 2016, 8, 1270. https://doi.org/10.3390/su8121270
Wu C-C, Jhan H-T, Ting K-H, Tsai H-C, Lee M-T, Hsu T-W, Liu W-H. Application of Social Vulnerability Indicators to Climate Change for the Southwest Coastal Areas of Taiwan. Sustainability. 2016; 8(12):1270. https://doi.org/10.3390/su8121270
Chicago/Turabian StyleWu, Chin-Cheng, Hao-Tang Jhan, Kuo-Huan Ting, Heng-Chieh Tsai, Meng-Tsung Lee, Tai-Wen Hsu, and Wen-Hong Liu. 2016. "Application of Social Vulnerability Indicators to Climate Change for the Southwest Coastal Areas of Taiwan" Sustainability 8, no. 12: 1270. https://doi.org/10.3390/su8121270