Article

Eco-Efficiency Analysis of Industrial Systems in the Songhua River Basin: A Decomposition Model Approach

1
Northeast Institute of Geography and Agroecology, University of Chinese Academy of Sciences, Changchun 130102, China
2
College of Geography and Tourism, Qufu Normal University, Rizhao 276826, China
3
College of Geographical Science, Northeast Normal University, Changchun 130102, China
4
Department of Geography, Hong Kong Baptist University, Kowloon Tong 999077, Hong Kong, China
*
Author to whom correspondence should be addressed.
Sustainability 2016, 8(12), 1271; https://doi.org/10.3390/su8121271
Submission received: 11 October 2016 / Revised: 1 December 2016 / Accepted: 2 December 2016 / Published: 6 December 2016

Abstract

:
Eco-efficiency is an important sustainable development and circular economy construct that conceptualizes the relationship between industrial output, resource utilization, and environmental impacts. This paper conducts an eco-efficiency analysis for basin industrial systems using the decomposition model approach. Using data on 10 cities in China’s Songhua River basin, we illustrate the evolutionary characteristics and influencing factors of industrial systems’ eco-efficiency. The results indicate that cities in upstream and midstream areas focus on improving resource efficiency, whereas cities in downstream areas focus on improving terminal control efficiency. The results also show that the government plays an increasingly important role in promoting eco-efficiency and that significant differences in the influencing factors exist among the upstream area, midstream area, and downstream area. Our results offer deeper insights into the eco-efficiency of industrial systems and give further hints on how policy-making can help achieve sustainable development, balancing between economic activities and environmental protection.

1. Introduction

Eco-efficiency is an instrument for sustainability analysis, and indicates an empirical relationship between environmental cost or value and environmental impact in economic activities [1]. So, eco-efficiency plays an important role in expressing how efficient economic activity is with regards to nature’s goods and services. The concept can be traced back to the 1950s, when the notions of resource utilization coefficients and technical efficiency were first proposed [2], and to the 1970s, when the concept of environmental efficiency was introduced [3]. In the 1990s, the notion of eco-efficiency was developed to incorporate both resource efficiency and environmental efficiency, and was defined as the ratio of value added to environmental impact [4]. Because eco-efficiency plays an increasingly important role in ensuring efficient industrial activities with regard to the use of natural resources, that the concept has received significant attention in the literature is not surprising [5,6,7,8,9,10,11,12,13]. Koskela [5] argued that eco-efficiency can be seen either as an indicator of environmental performance, or as a business strategy for sustainable development. The World Business Council for Sustainable Development (WBCSD) [6] described eco-efficiency as “being concerned with creating more value with less impact.” Huppes [7] held that clarifying the why and what of eco-efficiency was a first step toward providing support in decision-making on sustainability. Brattebø [9] put forward a framework for eco-efficiency analysis. Ehrenfeld [10] insisted that eco-efficiency can be a useful tool for strategists and policy makers. Oggioni [11] provided an eco-efficiency measure for 21 prototypes of cement industries operating in many countries by applying a data envelopment analysis. Ekins [12] analyzed the objective, drivers, and economic implications of eco-efficiency, while Kuosmanen [13] discussed some general issues and challenges in the quantification of eco-efficiency.
The industrial system, which is the core of the economic system, has been suggested in recent years by a number of studies on industrial systems’ eco-efficiency as having a mutual relationship with the ecological system [1,14,15,16,17]. Zhang [1] calculated the eco-efficiency of regional industrial systems in China, which was found to be in line with the spatial distribution of economic development in the country. Gumus [14] used an integrated input–output life cycle assessment and multi-criteria decision-making approach to evaluate the eco-efficiency of 276 manufacturing sectors in the USA. Caneghem [16] found that, despite the improved eco-efficiency, the industry sector remains one of the main polluters in Flanders. Camarero [17] analyzed the convergence in the eco-efficiency of a group of 22 OECD (The Organization for Economic Cooperation and Development) countries during 1980–2008. Most existing studies focused on industries [18,19] or firms [20,21,22,23]. Charmondusit [20] maintained that eco-efficiency was a tool for the analysis of the sustainability of industries. Lahouel [21] showed that company size, expressed in terms of turnover and number of employees, was inversely related to eco-efficiency scores. Kamande [22] suggested that there was a potential gain in the profitability of the firm by improving eco-efficiency in resource use. Thant [23] presented an eco-efficiency assessment of the pulp and paper industry in Myanmar by using some key indicators. Through an EU-funded research project, EcoWater has developed a conceptual framework and methodology for assessing eco-efficiency on the meso level [24], and the proposed methodological framework has been applied to eight alternative water use systems, revealing their environmental weaknesses and identifying potential opportunities for eco-efficiency improvement [25]. However, it seems that studies focused on the basin environment still need to be strengthened. The river basin is uniquely composed of closely connected upstream and downstream regions, which gives rises to conflict between industrial and environmental systems.
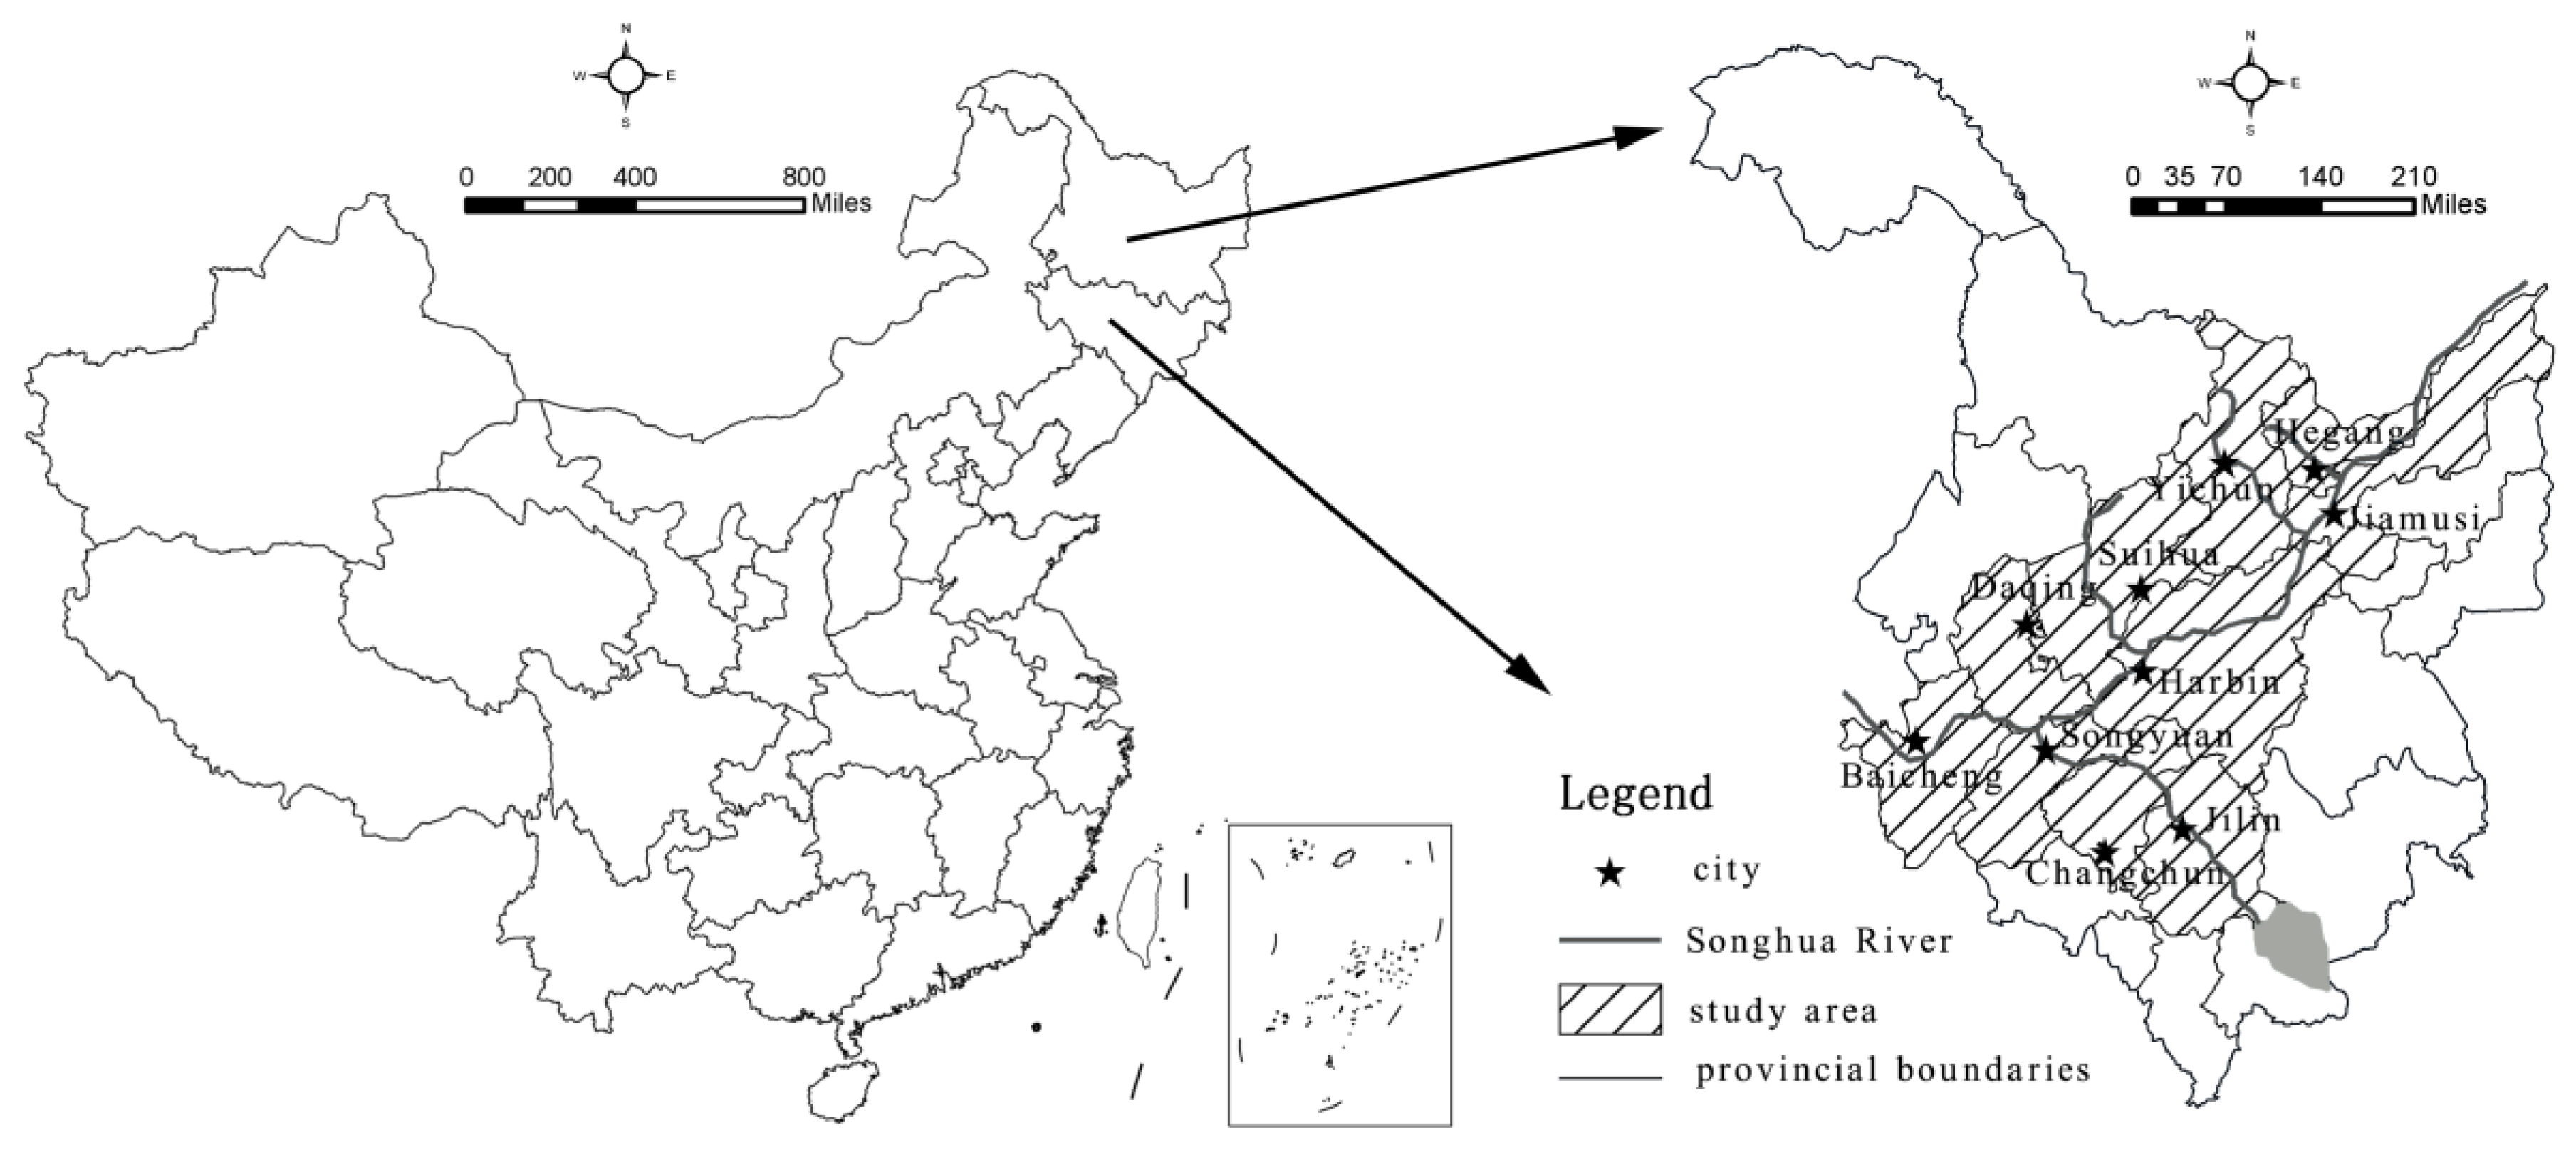
The Songhua River basin is used to carry out an empirical study in order to provide a scientific basis for the sustainable development of both the industrial and environmental systems in the basin and provide reference to other similar basins. As one of the most important rivers in China, the Songhua River is the foundation and lifeblood for the survival and development of Northeast China. However, environmental pollution from rapid urbanization and industrialization [26], population agglomeration, and excess production is worsening. The current environmental situation has captured the attention of many international communities after the occurrence of a major water pollution incident in 2005.
Another innovative feature of this study is its method of analysis. Most eco-efficiency studies use data envelopment analysis (DEA)-based models as instruments for aggregating different sources of environmental pressure to encompass eco-efficiency indicators. Applying a DEA model for eco-efficiency analysis highlights different combinations in the modes used to treat undesirable outputs and model choices. However, DEA measurement requires a large number of relatively accurate and reliable data points, and putting forward specific proposals from conclusions based on DEA-based models is arduous. In addition, DEA identifies weights that maximize the efficiency score of the evaluated unit or activity in comparison with a group of similar units or activities. An analysis of the decomposition model approach can solve this problem. The approach can be used to decompose eco-efficiency into the efficiency of different production processes. Moreover, eco-efficiency can be combined with concrete production processes.
In the Western context, numerous theories concerning economic development and environmental change have been developed. Among them, the Environmental Kuznets Curve (EKC) theory has far-reaching influence. The EKC theory can be traced back to the 1940s and hypothesizes a relationship between the relative levels of environmental damage and the values of Gross Domestic Products (GDP) per capita in a country. According to this theory, the environmental impact is an inverse U-shaped curve, in which the environment deteriorates before it improves with economic growth [27,28]. However, some researchers noted that the inverted U-shaped relationship did not always exist, and it might be inverted U-shaped [29] or N-shaped [30]. Given the differences between China and the West, many of these theories or findings may not be suitable for Chinese contexts. In view of the importance of industrial systems’ eco-efficiency and the insufficient number of studies examining this topic, this paper discusses the topic of industrial systems’ eco-efficiency within the Chinese context. This study aims to measure the eco-efficiency of the Songhua River basin using the decomposition model. It analyzes evolutionary characteristics and impact factors of eco-efficiency. Eco-efficiency can be decomposed into resource efficiency, cleaner production efficiency, and terminal control efficiency to construct a measurement model of eco-efficiency. Using this measurement method, this article answers the following questions: What are the evolutionary pathways of eco-efficiency that cities in the Songhua River basin might follow? Which factors account for the change in eco-efficiency?
Given a policy focused towards reforming and opening up, China’s economy has been developing rapidly and has entered the middle stage of industrialization. However, scale-driven economic development relies heavily on the massive consumption of energy and resources. Furthermore, traditional industries with a high volume of energy consumption and pollution emissions still occupy a dominant position in the economy. Undoubtedly, achieving fundamental change in a short period is difficult. Therefore, the pressure in maintaining a balance between resource utilization and environmental protection will continue to increase. A key problem that needs to be solved is maintaining rapid economic development and reducing its environmental impact, while moving towards sustainable development. As an instrument for sustainability analysis, eco-efficiency establishes an empirical relationship between environmental cost or value and environmental impact in economic activities, and can highlight the pathway towards sustainable development.

2. Research Area and Methods

2.1. Study Area and Data

The Songhua River passes through Heilongjiang and Jilin provinces. The river is 1897 kilometers (km) long, and the area of the river basin is approximately 560,000 km2. Based on three factors (natural environment, administrative area, and economic relationship), this study divides the Songhua River into three parts: the upstream including Jilin, Changchun, Songyuan, and Baicheng municipalities; the midstream including Daqing, Suihua, and Harbin municipalities; and the downstream including Hegang, Yichun, and Jiamusi municipalities (Figure 1). Czakó et al. [31] divided the Danube River into three parts according to the location of the river’s partition: the upper part of the river (e.g., South German States, Austrian regions); the middle part of the river (e.g., Slovakian, Hungarian regions); and the lower part of the river (e.g., Romania, Bulgaria). Qin and Li [32] argued that three factors—natural environment, administrative area, and economic relationship—should be considered in watershed segmentation. The industries of the study area are diverse and include automobile, coal, petrochemical metallurgy, pharmaceutical machinery, building materials, textile and garment, coal chemical, new materials and energy, food processing, and brewing. Although the industrial structure of the Songhua River basin has been optimized and upgraded in recent years, industries with high energy consumption and pollution emissions still dominate, leading to serious environmental pollution and ecological damage and increases in the structure vulnerability of the industrial ecosystem.
In terms of products or service value, Seppala et al. [33] developed three economic indicators to represent the economic value in eco-efficiency analysis: gross domestic product (GDP), value added of industries, and output at basic prices. However, because our research only focuses on the basin industrial system and as industrial development is still the main driving force of economic development, the value added by industries is selected to represent economic value.
Regarding environmental impact, according to the World Economic Cooperation and Development Organization (OECD) and the World Business Council for Sustainable Development (WBCSD), environmental impact could be represented as water pollutants, waste gas pollutants, solid waste, and other indicators. Using China’s statistics system and data availability, we chose three main categories of environmental pressure indicators: industrial sulfur dioxide, soot, and wastewater. Moreover, the economy of the Songhua River basin is in the middle stage of industrialization. This scale-driven economic development relies heavily on the massive consumption of energy and resources. Consequently, energy consumption is selected to represent the resource pressure of an industrial system.
All the data were collected from the Jilin [34,35,36,37,38,39,40,41,42,43,44,45] and Heilongjiang Statistical Yearbook [46,47,48,49,50,51,52,53,54,55,56,57] during 2003–2014 and the Environmental Quality Report of Jilin Province [58,59,60,61,62,63,64,65,66,67,68,69] and Heilongjiang Province [70,71,72,73,74,75,76,77,78,79,80,81] during 2002–2013. The value added by industries comes from ‘Gross Domestic Product by City and County’ in the Statistical Yearbook ([34,35,36,37,38,39,40,41,42,43,44,45,46,47,48,49,50,51,52,53,54,55,56,57]) each year. Industrial sulfur dioxide and soot come from ‘Discharge and Treatment of Industrial Waste Gas by Region’ in the Statistical Yearbook ([34,35,36,37,38,39,40,41,42,43,44,45,46,47,48,49,50,51,52,53,54,55,56,57]) each year. Wastewater comes from ‘Discharge and Treatment of Industrial Waste Water by Region’ in the Environmental Quality Report ([58,59,60,61,62,63,64,65,66,67,68,69,70,71,72,73,74,75,76,77,78,79,80,81]) each year. Energy consumption comes from ‘Basic Statistics on Urban Social and Economic Indicators’ in the Statistical Yearbook ([34,35,36,37,38,39,40,41,42,43,44,45,46,47,48,49,50,51,52,53,54,55,56,57]) each year.

2.2. Methods

Eco-efficiency concerns the capability to produce goods and services in a manner that causes minimal environmental degradation. Therefore, eco-efficiency plays an increasingly important role in expressing the efficiency of economic activity with regard to nature’s goods and services. Several tools can be used to assess eco-efficiency. An example is the mathematical DEA methodology developed by Charnes, Cooper, and Rhodes. The methodology aggregates different environmental pressures to encompass eco-efficiency indicators and has been applied to many case studies in different fields. However, the method is strict with index selection, and the indexes can only be input–output indicators. In addition, the number of input–output indicators should be limited, and the number of input indicators is higher than the number of output indicators. Although the DEA methodology can also generate weight, the sum of the weights does not equal 1, making it difficult to judge the importance of the indicators. The decomposition analysis, on the other hand, allows for the relative contribution of different factors to an overall outcome to be calculated [82]. The analysis has most commonly been applied to eco-efficiency issues to analyze the role of different industrial sectors [83]. According to the OECD and the WBCSD (2000), eco-efficiency is measured as the ratio between the (added) value of what has been produced (total population, products and services, GDP, and others) and the (added) ecological impacts of the products and services. The ecological impacts include resource and environmental impacts, which reflect resource utilization efficiency and pollutant emissions, respectively. Thus, eco-efficiency can be decomposed into:
E I = λ i S i / ( μ r R r + ν p E p ) ,
where EI is eco-efficiency, Si represents the value of the ith product or service, Rr is the rth resource input, Ep is the pth pollutant emissions, and λ, μ, and ν represent indicator weight coefficients calculated using the entropy method.
In addition, resource efficiency (RE) and environmental efficiency (EE) can be expressed by the product or service value of the unit resource input and pollutant emissions, respectively. Resource efficiency (RE) represents the eco-efficiency of the industrial system from the production source; however, environmental efficiency (EE) represents the eco-efficiency of the industrial system from the perspective of pollutant treatment. Consequently, eco-efficiency (EI) can be specifically decomposed into resource efficiency (RE) and environmental efficiency (EE). The formula is as follows:
R E = λ i S i / μ r R r ,
E E = λ i S i / ν p E p .
Environment efficiency can be further decomposed into:
E E = λ i S i / ν p E p = λ i S i / μ r R r × μ r R r / γ p E p × γ p E p / ν p E p ,
where E’p represents the pth pollutant production and γ is the weight coefficient of the pollutant production calculated using the entropy method. The other indicators have the same meanings as previously noted. The formula implies that environment efficiency can be further decomposed into resource efficiency, cleaner production efficiency, and terminal control efficiency, as represented by α, β, and ε, respectively. Therefore, eco-efficiency (EI) can be ultimately represented as:
E I = α × β × ε / ( 1 + β × ε ) .
This formula asserts that eco-efficiency (EI) is a function of resource efficiency (α), cleaner production efficiency (β), and terminal control efficiency (ε). Using partial correlation analysis, we obtain ∂EI/∂α = β × ε/(1 + β × ε) > 0, and correspondingly obtain ∂EI/∂β > 0 and ∂EI/∂ε > 0. The results imply that each link in the production processes can improve eco-efficiency by reducing the environmental impact but also cannot fully achieve the expected ecological objectives. A mutual relationship exists among resource efficiency, cleaner production efficiency, and terminal control efficiency. Only if the three efficiencies coordinate development can they compose a complete industrial ecosystem chain and significantly promote eco-efficiency [84]. Additionally, to show the equivalent environmental impact, the downstream of the production chain should invest more than the upstream to enable the three efficiencies to be assigned a certain priority in production processes as resource efficiency > cleaner production efficiency > terminal control efficiency.
Contribution rate is a crucial index to analyze economic benefit. The contribution rate analysis method refers to the contribution index of a certain influence factor to the total contribution of factors. So, the contribution rate analysis method can be used to measure the effect of resource efficiency, cleaner production efficiency and terminal control efficiency on the eco-efficiency. The formula is as follows:
Contribution rate = contribution index / total contribution index × 100 % .
Principal component analysis (PCA) is a multivariate technique that analyzes a data table in which observations are described by several inter-correlated quantitative dependent variables [85]. The central idea of principal component analysis (PCA) is to reduce the dimensionality of a dataset consisting of a large number of interrelated variables, while retaining as much as possible the variation present in the dataset. This is achieved by shifting the principal components (PCs), which are uncorrelated, to a new set of variables that are ordered so that the first few retain most of the variation present in all of the original variables. We could use principal component analysis (PCA) to quantitatively analyze the influence factors of eco-efficiency.
The entropy method is an objective weighting method that could eliminate the subjective favor of the valuator. It is used in the social sciences on a wide scale to measure the uncertainty in the system. In general, the value of information entropy is lower, the system is more unbalanced, the difference is greater, and the change is sooner; so the weight of the index is higher. Conversely, the weight of the index is lower. The main calculation steps of the entropy method are as follows:
(1) Data standardization: when the index value is greater, the system is more advantageous. The positive calculation method was used:
X ij = ( X ij minX j ) / ( maxX j minX j ) .
Conversely, the negative calculation method was used:
X ij = ( maxX j X ij ) / ( maxX j minX j ) .
(2) Calculating the proportion of index j in city i:
Y ij = X ij / i = 1 m X ij .
(3) Calculating the information entropy of index:
e j = k i = 1 m Y ij × ln Y ij , k = 1 / lnm   0 e j 1 .
(4) Calculating the redundancy of information entropy:
d j = 1 e j .
(5) Calculating the weighting of index:
w j = d j / j = 1 n d j .
(6) Calculating the value of single index evaluation:
S ij = w j × X ij .
(7) Calculating the value of comprehensive evaluation in city i:
S i = j = 1 n S ij
where Xij represents the value of index j in city i. minXj and maxXj express, respectively, the minimum and the maximum of index j. In addition, m is the number of the city, and n is the number of the index.

3. Results and Discussion

In this section, we describe how we used our approach to evaluate the eco-efficiency of the industrial systems in 10 cities in the Songhua River basin.

3.1. Environmental Efficiency

Environmental efficiency in the study area increases by an annual average of 28.14% and shows great differences in different segments of the river (Table 1). The highest annual average is 31.85% in the midstream area and the lowest is 22.57% in the downstream area. Therefore, the development of cities along the midstream areas is better than that of cities along the downstream areas. The cities with high environmental efficiency are Changchun, Jilin, Daqing, and Harbin, whereas Yichun is the main city with low environmental efficiency. In addition, cities with high environmental efficiency growth are Suihua, Songyuan, and Baicheng. Their annual average is almost 47.47%. This phenomenon indicates that environmental efficiency differences will increase.
For the upstream and midstream areas, the enhancement of resource efficiency, cleaner production efficiency, and terminal control efficiency is stable overall (Figure 2). The resource efficiency, which progresses faster than the other two efficiencies, is shown to be more advanced, while the cleaner production efficiency continues to lag and increases at the lowest rate. For the downstream area, the resource efficiency, cleaner production efficiency, and terminal control efficiency all show significant volatility. That is, resource efficiency improves more than cleaner production efficiency; however, terminal control efficiency still dominates in the downstream area. Therefore, the cities in the upstream and midstream areas focus on improving their resource efficiency to achieve lighter industry activity, and the cities in the downstream area focus on improving terminal control efficiency to achieve cleaner industry activity. By comparing the results for the three indicators, it can be concluded that the economic development of the Songhua River basin is still in a phase of low resource input and utilization and generates a low level of pollution emissions.

3.2. Resource Efficiency

As shown in Table 2, the cities with high resource efficiency are mainly distributed in the upstream and midstream areas, such as Changchun, Jilin, Daqing, and Harbin, and represent significant spatial differences from cities in the downstream area. The highest annual average resource efficiency is 38.09% in the midstream area and the lowest is 23.58% in the upstream area. The midstream area is the Ha-Da-Qi industrial corridor, and its industries show a pattern of cluster development. The cities in the upstream area are Changchun, Jilin, Songyuan, and Baicheng. In resource-based cities like Jilin and Songyuan, the industrial structure of to some extent shows a heavy-model industrial structure and the tertiary industries are lagging behind. The remarkable improvement in resource efficiency in the downstream area suggests that the downstream area has begun to concentrate on improving the utilization of material resources. This improvement in resource efficiency plays an important role in alleviating resource shortages in Northeast China. Thus, different types of cities are continuously improving their resource use efficiency. The average annual growth rate of resource-based cities is 22.08%, whereas that of comprehensive cities is 24.78%. This analysis shows that both resource-based cities and comprehensive cities are concentrating on improving their resource efficiency to achieve the aim of optimizing eco-efficiency.

3.3. Cleaner Production Efficiency

Similar to resource efficiency, the cities with high cleaner production efficiency are mainly distributed in the upstream area, such as Changchun, Jilin, and Baicheng (Table 3). In addition, both the annual average rate and the average annual growth rate of cleaner production efficiency show significant differences. The highest annual average rate of cleaner production efficiency is 0.5916 in the upstream area and the lowest is 0.219 in the midstream area. This result suggests that through optimizing and upgrading industry, and by taking energy conservation into consideration, the tertiary industry, especially the modern service industry, in the upstream area has developed rapidly. In terms of the average annual growth rate, the upstream area with the highest growth rate of 7.01% still appears to be more advanced; the midstream area is growing at a rate of 1.36%, whereas the downstream area is decreasing, with a rate of −0.76%. Another interesting phenomenon is that the cleaner production efficiency in Daqing, Harbin, and Jiamusi continued to decline at an average annual rate of 5.25%. Moreover, cleaner production efficiency has on the whole remained at a low level. Undeniably, current industrial development is unsustainable.

3.4. Terminal Control Efficiency

Compared with resource efficiency and cleaner production efficiency, terminal control efficiency shows a declining trend but also manifests its own characteristics. As shown in Table 4, the cities with high terminal control efficiency are mainly distributed in the downstream area, such as Hegang, Jiamusi, and Yichun. The highest annual average rate of terminal control efficiency is 1.3482 in the downstream area and the lowest is 0.9399 in the midstream area, showing significant differences within the basin. As the downstream area borders Russia in the north, the regulation of pollutant emissions is relatively strict. However, terminal control efficiency shows a fluctuating and decreasing trend. The highest annual average decline rate is 5.24% in the midstream area, and the lowest is 1.95 in the upstream area. This phenomenon occurs mainly because heavy industry has increased its rate of development since the implementation of the strategy to revitalize Northeast China in 2003. The average annual growth rate of heavy industry output value to the GDP of Heilongjiang province and Jilin province is 0.88% and 3.96% in 2003–2013. We find that local governments focus on resource utilization efficiency, with less attention given to pollutant emissions. Economic development still depends on material resource consumption, and the pressure related to environmental protection is still strong.

3.5. Eco-Efficiency

From the time series analysis, the evolution of eco-efficiency has phase characteristics. In 2002–2008, the eco-efficiency of the midstream area is highest and that of the downstream area is the lowest, whereas in 2009–2013 that of the upstream area is the highest and that of the downstream area is the lowest. In addition, the upstream area has the highest average eco-efficiency rate of 1.4529. However, the average eco-efficiency rate of the downstream area is only 0.3986, which indicates a significant difference (Table 5). The rapid development of the upstream area is mainly the result of the remarkable improvement in the eco-efficiency of Songyuan and Baicheng, with an average annual rate of 33.9%. In terms of the average annual growth rate, that of the upstream area is 28.3%, that of the midstream area is 34.36%, and that of the downstream area is 24.13%. These results imply that the eco-efficiency gap is increasing between the downstream and the upstream areas because of the low level of development of the downstream area and the influence of the upstream area on the downstream area.
From contribution rate analysis, resource efficiency plays a positive role in optimizing eco-efficiency because the contribution rate is as high as 585.27% in 2002–2013, whereas terminal control efficiency exerts a negative effect given a contribution rate of −37.83% in 2002–2013. Moreover, the function of cleaner production efficiency is not significant. We find that resource utilization and pollutant disposal are decisive factors in improving eco-efficiency.

4. Factors Determining Industrial Systems’ Eco-Efficiency

The findings above indicate that the eco-efficiency shows a significant difference. The main question, therefore, is what factors lead to the spatial difference. Addressing this question will be crucial to the promotion of industrial ecosystems and the improvement of eco-efficiency.

4.1. Economic Development

The rapid development of the economy contributes to enterprises’ spatial agglomeration and the creation of the scale effect. In addition, economic development can accumulate more funds to improve production processes and construct pollutant disposal facilities. Undoubtedly, economic development is also conducive to the remarkable improvement in people’s living standards. Individuals’ rapid growth of their material and cultural needs will also expand the industrial scale, upgrade industrial technology, and improve environmental quality. The EKC theory assumes that an “inverted U” relationship exists between environmental pollution and per capita income. Consequently, the ratio of pollution-intensive enterprises will first increase and then decrease, thus first leading to environmental pollution increases and then decreases. As the industrial base, the economics of Northeast China’s growth have been hampered because of the gradual depletion of mineral resources. Since the revitalization of Northeast China in 2003, economic development has improved. The GDP growth rates of Heilongjiang province and Jilin province were above 10% in 2002–2013, which was much higher than the national average.

4.2. Government Guidance

Northeast China is abundant in natural resources, which formed the foundation of its development. Moreover, the development of Northeast China has largely been driven by the government. Since the founding of the People’s Republic of China, a large number of state-owned enterprises have emerged to exploit natural resources. Since the reform and opening-up process began, the low efficiency and lack of competition for state-owned enterprises has become more and more apparent in the new market economy. To a certain extent, state-owned enterprises hinder the development of private enterprises. Additionally, social and environmental problems caused by the exploitation of mineral resources under the lead of state-owned enterprises have been highlighted. However, the number of private enterprises gradually declines from the South to the North, whereas the number of state-owned enterprises increases [86].

4.3. Regional Industrial Structure

The regional industrial structure has a direct impact on industrial pollution. In the middle stage of industrialization, especially during a period in which the heavy chemical industry is highly active, significantly high energy consumption and pollution emission levels are present and cause serious disturbances to the environment. Upgrading the industrial structure, especially the onset of the post-industrialization stage, decreased the proportion of high-polluting industries and caused technology-intensive industries to become dominant—changes that could reduce industrial pollution emissions. The industries dominant in Northeast China are automobiles, energy coal, petrochemical metallurgy, biopharmaceutical machinery, building materials, textiles, and garments. The current heavy industrial structure is deeply rooted, and the average annual growth rate of gross industrial output value in the Jilin province is 21.81%, whereas that of Heilongjiang province is 14.49%. Moreover, Northeast China is in the middle stage of industrialization, which has stimulated the development of heavy industry and increased the vulnerability of the industrial ecosystem.

4.4. Foreign Capital

The pollution haven hypothesis holds that pollution-intensive foreign enterprises tend to establish factories in countries or regions with relatively low environmental standards. Since the reform and opening-up of China, a large number of foreign investments have been concentrated in Northeast China. The average annual growth rate during 2002–2013 of foreign investments in Heilongjiang and Jilin provinces was as high as 15.50% and 19.99%, respectively, much higher than the national average of 7.56%. Another important cause of this phenomenon, in addition to the broad market and preferential policies, is the relatively lax environmental controls. Therefore, total regional pollution emissions will increase due to an increase in foreign investments. However, the introduction of foreign capital also undoubtedly results in technology spillover, which is beneficial to improving regional production processes and reducing the intensity of pollution emissions.

4.5. Human Resources

Technology is indispensable to environmental protection, and improving technology can ameliorate production processes and promote the efficiency of resource utilization. Northeast China’s human resources are high in quantity and rich in quality. However, the development of human resources in this area does not occur in step with the economy. Human resources face problems such as structural limitations and imbalances among different areas. The average annual growth rate for 2002–2013 of R&D expenditures in Heilongjiang and Jilin province was 15.43% and 12.08%, respectively, which lags significantly behind the national average of 22.35%. Other human resources in Northeast China are concentrated in Shenyang, Harbin, and Changchun, and indicate significant differences from other areas.

4.6. Empirical Analysis

To this point, we have theoretically analyzed the impact factors of industrial systems’ eco-efficiency. We now turn to the quantitative analysis. Seven factors were selected: (1) per capita GDP, which represents the economic development level (ED); (2) the ratio of the number of on-the-job workers at state-owned enterprises and at collective enterprises to the total number of on-the-job workers, which represents ownership structure (OS); (3) the ratio of the secondary industry to the tertiary industry, which represents industrial structure (IS); (4) the attainment rate of industrial waste water, which represents environmental management (EM); (5) the ratio of foreign direct investment to GDP, which represents foreign investment (FI); (6) the ratio of financial expenditures to GDP, which represents government regulations (GR); and, (7) the ratio of persons engaged in science and technology activities to the total number of on-the-job workers, which represents science technology (ST). Gai et al. [87] proposed that industrial structure and economic development have positive effects on eco-efficiency. Guan and Xu [88] stated that energy resources and population should also be included. Tong et al. [89] argued that production scale, foreign investments, and environmental management did not play an increasingly important role in the environmental efficiency of the coastal economic belt in Liaoning province. Through principal component analysis (PCA) we have synthesized numerous indexes, eliminated overlapping sample information, and conducted regression analysis.
As shown in Table 6, ownership structure, government regulations, economic development, and science and technology are key to optimizing the eco-efficiency of the upstream area, as well as the factors of government regulation, economic development, and foreign investments in the midstream and downstream areas. The results show that, on the one hand, the improvement in industrial systems’ eco-efficiency depends on large-scale investments of material capital. On the other hand, the internal driving forces of a “soft factor,” such as science and technology, are obvious and the driving forces become increasingly diversified. Compared with the upstream area, the driving forces in the midstream and downstream areas depend heavily on external investment.
Ownership structure has an inhibitive effect on eco-efficiency (Table 6), mainly because state-owned enterprises still occupy a dominant position in the economy, and their restructuring and upgrading of the industrial structure have unclear effects. Economic development, environmental management, and government regulations have a positive effect on eco-efficiency. Moreover, economic development and government regulation show a geographical gradient effect, indicating that the eco-efficiency of an industrial system in the upstream area can maintain its advanced status for a certain period.

5. Conclusions

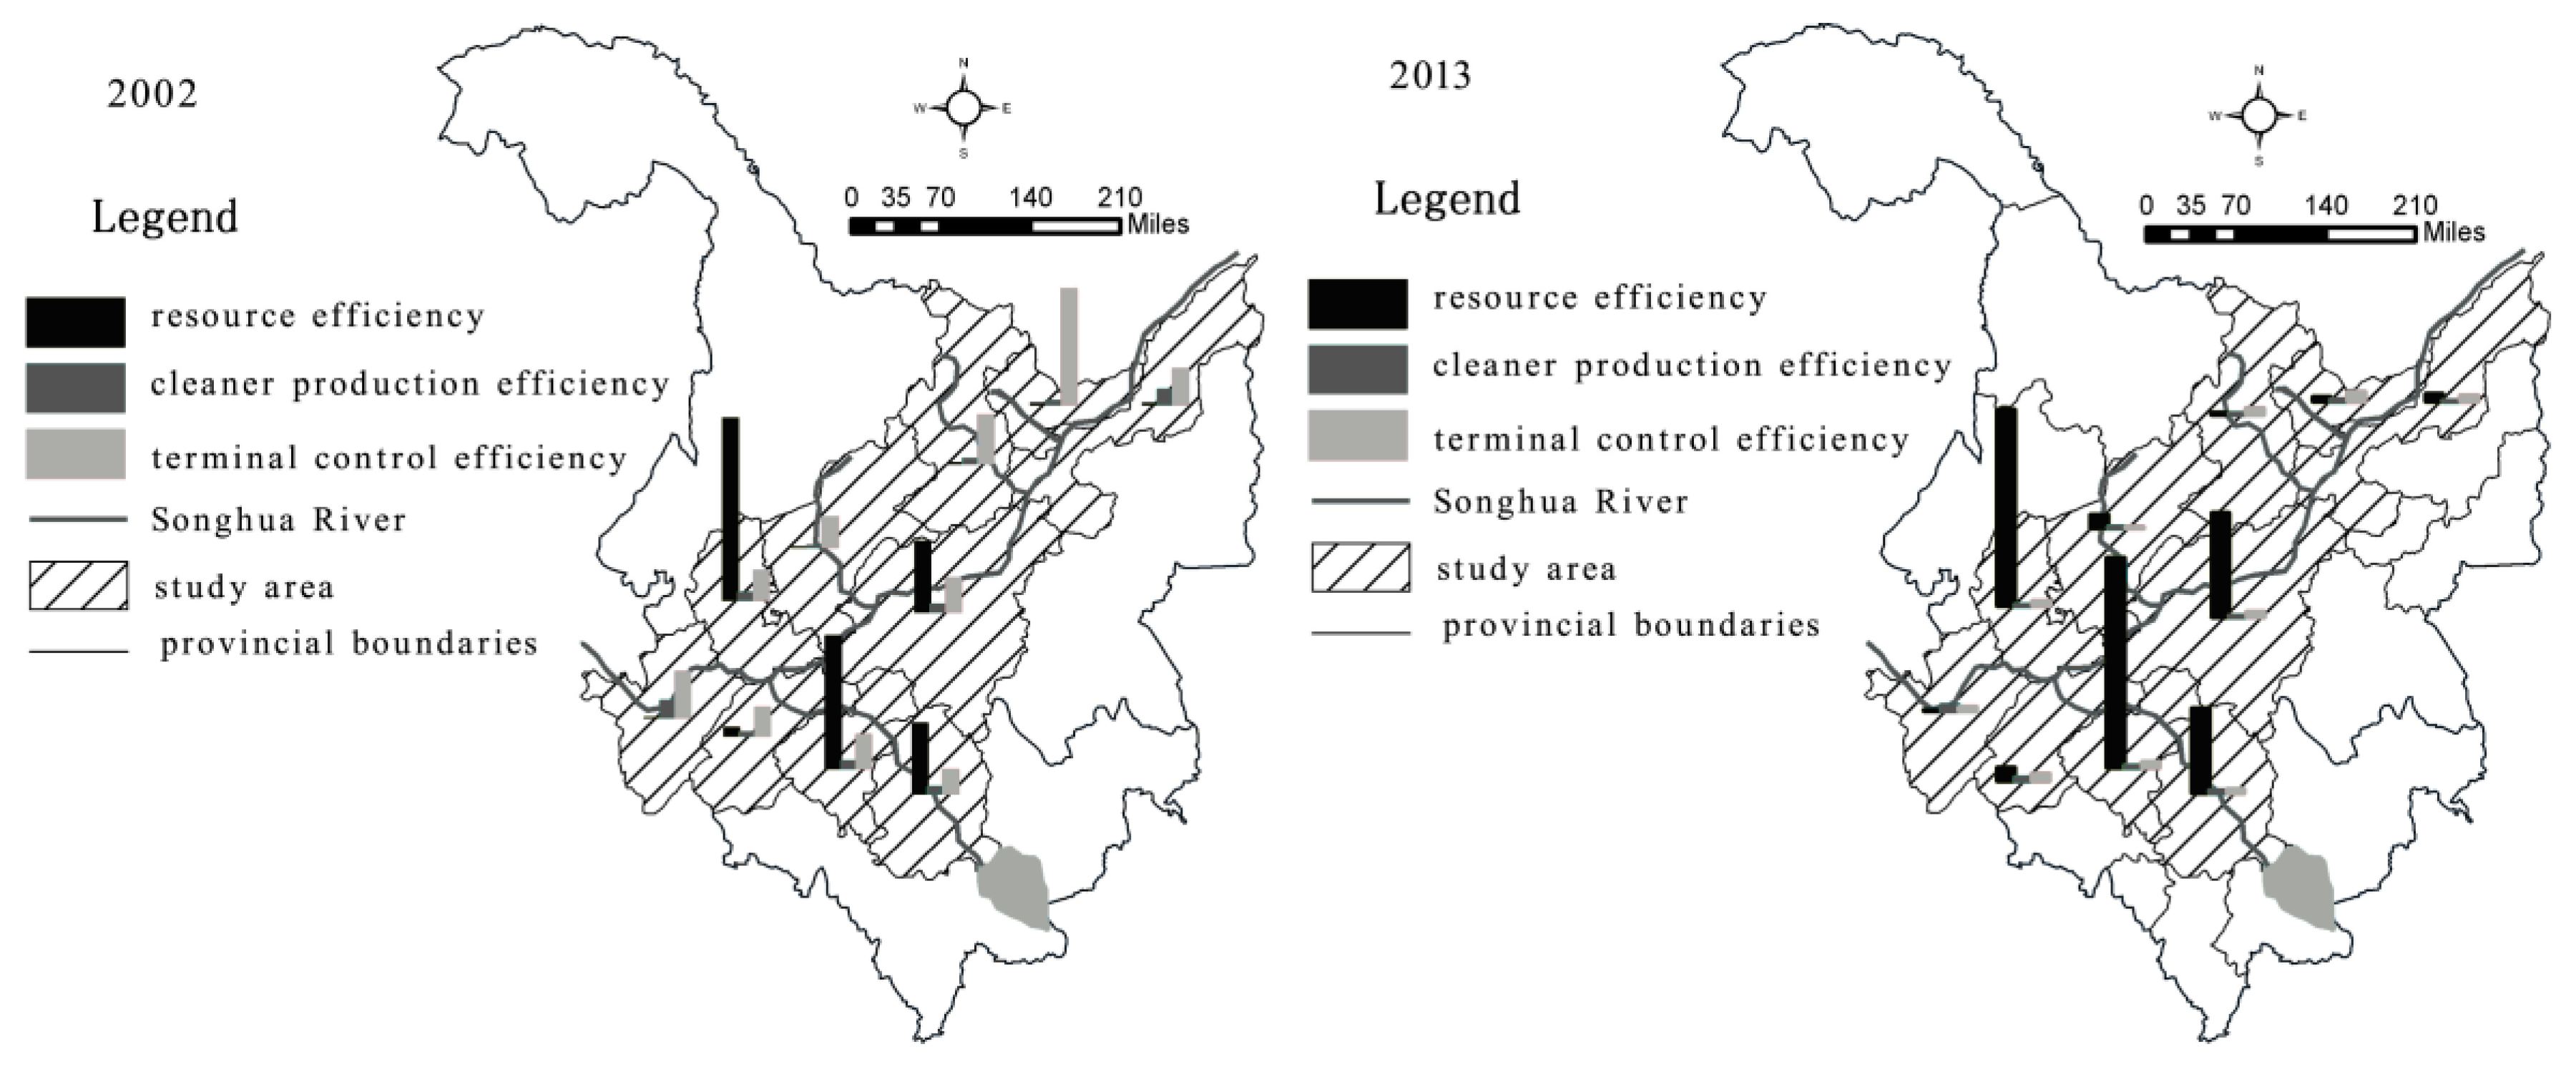
We used the decomposition approach to measure the eco-efficiency that can distinguish the effects of different production processes. In contrast to other methods, the decomposition approach takes into account the pollutant weight calculated using an objective weighting method, such as the entropy method, which could eliminate the subjective element of the valuator. Moreover, the decomposition model can be used to decompose eco-efficiency into different production process efficiencies, including resource efficiency, cleaner production efficiency, and terminal control efficiency, and can determine which specific type of efficiency has the strongest impact on eco-efficiency. The results suggest that the differences in eco-efficiency are notable in the Songhua River basin from 2002 to 2013. We also found that different production efficiencies exhibit different characteristics. Cities in the upstream and the midstream area focus on improving resource efficiency, whereas cities in the downstream area focus on improving terminal control efficiency. Overall, the economic development of the Songhua River basin is represented by low resource input and utilization, and low-pollution emissions. In terms of resource efficiency, the findings indicate that the cities with high resource efficiency are mainly distributed in the upstream and midstream areas, representing significant spatial differences from cities in the downstream area. However, both resource-based cities and comprehensive cities appear to concentrate on improving resource efficiency to achieve the aim of optimizing eco-efficiency. The spatial distribution characteristics of cleaner production efficiency are similar to resource efficiency; however, cleaner production efficiency has on the whole remained at a low level, which indicates that current industrial development is unsustainable and the ecological industrial activities are not yet evident. Unlike resource efficiency and cleaner production efficiency, terminal control efficiency shows a fluctuating and decreasing trend, implying that economic development still depends on material resource consumption, and the pressure of environmental protection is still significant.
Similar to EKC theory, economic development plays a significant role in changes in eco-efficiency, leading to different evolutionary characteristics at different stages of economic development. However, other factors also affect eco-efficiency in a national context, such as ownership structure, industrial structure, environmental management, foreign investment, government regulations, and technological advances. According to an analysis of the factors, the government plays an increasing role in eco-efficiency, and significant differences exist in the relative importance of factors among the upstream, midstream, and downstream areas. For the upstream area, the internal driving forces of a “soft factor,” such as technology, are significant and are becoming increasingly diversified. In contrast, those of the midstream and downstream areas heavily depend on external investments, indicating that the eco-efficiency of an industrial system in the upstream area has been able to maintain its advantages for the studied period.
At present, the shares of sectors with high energy consumption and pollution emissions, such as transportation equipment manufacturing, petrochemicals, pharmaceuticals, building materials, and energy production, still occupy a dominant position in the economy. As the leading sectors in the Songhua River basin, their shares are unlikely to be significantly reduced in a short period. However, the change in the industrial structure has a beneficial effect on eco-efficiency. Hence, coordinated development of an optimized strategy for an industrial and an ecological system should be promoted. To enhance eco-efficiency, it is necessary to increase the proportion of the tertiary industry and reduce that of sectors with high energy consumption and emissions.
In addition, resource utilization and contaminant disposal are the decisive factors regarding industrial systems’ eco-efficiency in the Songhua River basin. It can be concluded that improving resource use efficiency and enhancing the level of pollutant treatment are key problems to be urgently solved. Governments should take steps to guide enterprises to produce more environmentally friendly and high-value-added products. At the same time, it is necessary to develop new industries and enhance industrial concentration through a combination of administrative, legal, and economic means. Upgrading the industrial structure, together with improving eco-efficiency, can contribute to realizing the goal of sustainable economic development.
Research on eco-efficiency has been carried out for many years and a significant amount of relevant literature already exists. However, this study sheds new light on industrial systems’ eco-efficiency. Because of data acquisition limitations, this paper does not examine the eco-efficiency of specific industries and only chooses four representative pollutants to analyze. At the same time, the impact factors of industrial systems’ eco-efficiency are attributed to economic development, ownership structure, industrial structure, environmental management efforts, foreign investment, government regulations, and science technology. However, additional factors directly or indirectly influence the eco-efficiency of the industrial system, such as industry clustering, public awareness, and entrepreneurs’ social responsibility. In the future, we will collect more data and search for new indicators and methods to continue an in-depth study.

Acknowledgments

This work was supported by the National Natural Science Foundation of China (Grant Nos. 41071086 and No.41471110).

Author Contributions

Fuyou Guo conceived and designed the research. Kevin Lo wrote the paper. Lianjun Tong contributed to data collection and analysis.

Conflicts of Interest

The authors declare no conflict of interest.

References

  1. Zhang, B.; Bi, J.; Fan, Z.Y. Eco-efficiency analysis of industrial system in China: A data envelopment analysis approach. Ecol. Econ. 2008, 68, 306–316. [Google Scholar] [CrossRef]
  2. Debreu, G. The coefficient of resource utilization. Econometrica 1951, 19, 273–292. [Google Scholar] [CrossRef]
  3. McIntyre, R.J.; Thornton, J.R. On the environmental efficiency of economic systems. Sov. Stud. 1978, 30, 173–192. [Google Scholar] [CrossRef]
  4. Schaltegger, S.; Sturm, A. Ökologische rationalität. Die Unternehm. 1990, 4, 273–290. (In German) [Google Scholar]
  5. Koskela, M.; Vehmas, J. Defining eco-efficiency: A case study on the Finnish forest industry. Bus. Strateg. Environ. 2012, 21, 546–566. [Google Scholar] [CrossRef]
  6. World Business Council for Sustainable Development (WBCSD). Eco-Efficiency: Creating More Value with Less Impact; World Business Council for Sustainable Development: Geneva, Switzerland, 2000; pp. 5–36. [Google Scholar]
  7. Huppes, G.; Ishikawa, M. A framework for quantified eco-efficiency analysis. J. Ind. Ecol. 2005, 9, 25–41. [Google Scholar] [CrossRef]
  8. United Nations Conference on Trade and Development (UNCTD). Integrating Environmental and Financial Performance at the Enterprise Level: A Methodology for Standardizing Eco-Efficiency Indicators; United Nations Publication: New York, NY, USA, 2003; pp. 29–30. [Google Scholar]
  9. Brattebo, H. Toward a methods framework for eco-efficiency analysis? J. Ind. Ecol. 2005, 9, 9–11. [Google Scholar] [CrossRef]
  10. Ehrenfeld, J.R. Eco-efficiency: Philosophy, theory, and tools. J. Ind. Ecol. 2005, 9, 6–8. [Google Scholar] [CrossRef]
  11. Oggioni, G.; Riccardi, R.; Toninelli, R. Eco-efficiency of the world cements industry: A data envelopment analysis. Energy Policy 2011, 39, 2842–2854. [Google Scholar] [CrossRef] [Green Version]
  12. Ekins, P. Eco-efficiency: Motives, drivers, and economic implications. J. Ind. Ecol. 2005, 9, 12–14. [Google Scholar] [CrossRef]
  13. Kuosmanen, T. Measurement and analysis of eco-efficiency: An economist’s perspective. J. Ind. Ecol. 2005, 9, 12–14. [Google Scholar] [CrossRef]
  14. Gumus, S.; Egilmez, G.; Kucukvar, M. Integrating expert weighting and multi-criteria decision making into eco-efficiency analysis: The case of US manufacturing. J. Oper. Res. Soc. 2015, 37, 1–13. [Google Scholar] [CrossRef]
  15. Kuosmanen, T.; Kortelainen, M. Measuring eco-efficiency of production with data envelopment analysis. J. Ind. Ecol. 2005, 9, 59–72. [Google Scholar] [CrossRef]
  16. Caneghem, J.V.; Block, C.; Hooste, H.V. Eco-efficiency trends of the Flemish industry: Decoupling of environmental impact from economic growth. J. Clean. Prod. 2010, 18, 1349–1357. [Google Scholar] [CrossRef]
  17. Camarero, M.; Castillo, J.; Picazo-Tadeo, A.J. Eco-Efficiency and Convergence in OECD Countries. Environ. Resour. Econ. 2013, 55, 87–106. [Google Scholar] [CrossRef]
  18. Cramer, G.; Lochem, H.V. The practical use of the ‘eco-efficiency’ concept in industry: The case of Akzo Nobel. J. Sustain. Prod. Des. 2001, 1, 171–180. [Google Scholar] [CrossRef]
  19. Maxime, D.; Marcotte, M.; Arcand, Y. Development of eco-efficiency indicators for the Canadian food and beverage industry. J. Clean. Prod. 2006, 14, 636–648. [Google Scholar] [CrossRef]
  20. Charmondusit, K.; Phatarachaisakul, S.; Prasertpong, P. The quantitative eco-efficiency measurement for small and medium enterprise: A case study of wooden toy industry. Clean Technol. Environ. Policy 2014, 16, 935–945. [Google Scholar] [CrossRef]
  21. Lahouel, B.B. Eco-efficiency analysis of French firms: A data envelopment analysis approach. Environ. Econ. Policy Stud. 2015, 21, 112–127. [Google Scholar] [CrossRef]
  22. Kamande, M.W.; Lokina, R.B. Clean production and profitability: An eco-efficiency analysis of kenyan manufacturing firms. J. Environ. Dev. 2013, 22, 169–185. [Google Scholar] [CrossRef]
  23. Thant, M.M.; Charmondusit, K. Eco-efficiency assessment of pulp and paper industry in Myanmar. Clean Technol. Environ. Policy 2010, 12, 427–439. [Google Scholar] [CrossRef]
  24. Levidow, L.; Lindgaard-Jorgensen, P.; Nilsson, A.; Skenhall, S.A.; Assimacopoulos, D. Process eco-innovation: Assessing meso-level eco-efficiency in industrial water-service systems. J. Clean. Prod. 2016, 24, 54–65. [Google Scholar] [CrossRef]
  25. Angelis-Dimakis, A.; Arampatzis, G.; Assimacopoulos, D. Systemic eco-efficiency assessment of meso-level water use systems. J. Clean. Prod. 2016, 24, 195–207. [Google Scholar] [CrossRef]
  26. Huang, X.J.; Li, C.G.; Huang, X. Modeling analysis of interaction between urbanization and industrial structure upgrade in Northeast Area. Econ. Geogr. 2008, 28, 55–58. [Google Scholar]
  27. Grossman, G.M.; Krueger, A.B. Economic growth and the environment. Q. J. Econ. 1995, 112, 353–378. [Google Scholar] [CrossRef]
  28. Panayotou, T. Demystifying the Environment Kuznets Curve: Turning a black box into a policy tool. Environ. Dev. Econ. 1997, 2, 465–484. [Google Scholar] [CrossRef]
  29. Kaufmann, R.K.; Davidsdottir, B.; Garnham, S. The determinants of atmospheric SO2 concentrations: Reconsidering the Environmental Kuznets Curve. Ecol. Econ. 1998, 25, 209–220. [Google Scholar] [CrossRef]
  30. Fried, B.; Getzner, M. Determinants of CO2 emissions in a small open economy. Ecol. Econ. 2003, 45, 133–148. [Google Scholar] [CrossRef]
  31. Czako, K.; Fekete, D.; Poreisz, V. Economic differences of countries by the River Danube. Procedia Econ. Finac. 2014, 9, 163–175. [Google Scholar] [CrossRef]
  32. Qin, C.L.; Li, M.N. The mechanism of the spatial dissimilarity of regional economy: A theoretical model and its application in the Yellow River Valley. Geogr. Res. 2010, 29, 1780–1792. [Google Scholar]
  33. Seppala, J.; Melanen, M.; Maenpaa, I. How can the eco-efficiency of a region be measured and monitored? J. Ind. Ecol. 2005, 9, 117–130. [Google Scholar] [CrossRef]
  34. Jilin Statistical Bureau. Jilin Statistical Yearbook 2003; China Statistics Press: Beijing, China, 2003. (In Chinese)
  35. Jilin Statistical Bureau. Jilin Statistical Yearbook 2004; China Statistics Press: Beijing, China, 2004. (In Chinese)
  36. Jilin Statistical Bureau. Jilin Statistical Yearbook 2005; China Statistics Press: Beijing, China, 2005. (In Chinese)
  37. Jilin Statistical Bureau. Jilin Statistical Yearbook 2006; China Statistics Press: Beijing, China, 2006. (In Chinese)
  38. Jilin Statistical Bureau. Jilin Statistical Yearbook 2007; China Statistics Press: Beijing, China, 2007. (In Chinese)
  39. Jilin Statistical Bureau. Jilin Statistical Yearbook 2008; China Statistics Press: Beijing, China, 2008. (In Chinese)
  40. Jilin Statistical Bureau. Jilin Statistical Yearbook 2009; China Statistics Press: Beijing, China, 2009. (In Chinese)
  41. Jilin Statistical Bureau. Jilin Statistical Yearbook 2010; China Statistics Press: Beijing, China, 2010. (In Chinese)
  42. Jilin Statistical Bureau. Jilin Statistical Yearbook 2011; China Statistics Press: Beijing, China, 2011. (In Chinese)
  43. Jilin Statistical Bureau. Jilin Statistical Yearbook 2012; China Statistics Press: Beijing, China, 2012. (In Chinese)
  44. Jilin Statistical Bureau. Jilin Statistical Yearbook 2013; China Statistics Press: Beijing, China, 2013. (In Chinese)
  45. Jilin Statistical Bureau. Jilin Statistical Yearbook 2014; China Statistics Press: Beijing, China, 2014. (In Chinese)
  46. Heilongjiang Statistical Bureau. Heilongjiang Statistical Yearbook 2003; China Statistics Press: Beijing, China, 2003. (In Chinese)
  47. Heilongjiang Statistical Bureau. Heilongjiang Statistical Yearbook 2004; China Statistics Press: Beijing, China, 2004. (In Chinese)
  48. Heilongjiang Statistical Bureau. Heilongjiang Statistical Yearbook 2005; China Statistics Press: Beijing, China, 2005. (In Chinese)
  49. Heilongjiang Statistical Bureau. Heilongjiang Statistical Yearbook 2006; China Statistics Press: Beijing, China, 2006. (In Chinese)
  50. Heilongjiang Statistical Bureau. Heilongjiang Statistical Yearbook 2007; China Statistics Press: Beijing, China, 2007. (In Chinese)
  51. Heilongjiang Statistical Bureau. Heilongjiang Statistical Yearbook 2008; China Statistics Press: Beijing, China, 2008. (In Chinese)
  52. Heilongjiang Statistical Bureau. Heilongjiang Statistical Yearbook 2009; China Statistics Press: Beijing, China, 2009. (In Chinese)
  53. Heilongjiang Statistical Bureau. Heilongjiang Statistical Yearbook 2010; China Statistics Press: Beijing, China, 2010. (In Chinese)
  54. Heilongjiang Statistical Bureau. Heilongjiang Statistical Yearbook 2011; China Statistics Press: Beijing, China, 2011. (In Chinese)
  55. Heilongjiang Statistical Bureau. Heilongjiang Statistical Yearbook 2012; China Statistics Press: Beijing, China, 2012. (In Chinese)
  56. Heilongjiang Statistical Bureau. Heilongjiang Statistical Yearbook 2013; China Statistics Press: Beijing, China, 2013. (In Chinese)
  57. Heilongjiang Statistical Bureau. Heilongjiang Statistical Yearbook 2014; China Statistics Press: Beijing, China, 2014. (In Chinese)
  58. Jilin Environmental Protection Bureau. The Environmental Quality Report of Jilin Province 2002; China Environmental Science Press: Beijing, China, 2002. (In Chinese)
  59. Jilin Environmental Protection Bureau. The Environmental Quality Report of Jilin Province 2003; China Environmental Science Press: Beijing, China, 2003. (In Chinese)
  60. Jilin Environmental Protection Bureau. The Environmental Quality Report of Jilin Province 2004; China Environmental Science Press: Beijing, China, 2004. (In Chinese)
  61. Jilin Environmental Protection Bureau. The Environmental Quality Report of Jilin Province 2005; China Environmental Science Press: Beijing, China, 2005. (In Chinese)
  62. Jilin Environmental Protection Bureau. The Environmental Quality Report of Jilin Province 2006; China Environmental Science Press: Beijing, China, 2006. (In Chinese)
  63. Jilin Environmental Protection Bureau. The Environmental Quality Report of Jilin Province 2007; China Environmental Science Press: Beijing, China, 2007. (In Chinese)
  64. Jilin Environmental Protection Bureau. The Environmental Quality Report of Jilin Province 2008; China Environmental Science Press: Beijing, China, 2008. (In Chinese)
  65. Jilin Environmental Protection Bureau. The Environmental Quality Report of Jilin Province 2009; China Environmental Science Press: Beijing, China, 2009. (In Chinese)
  66. Jilin Environmental Protection Bureau. The Environmental Quality Report of Jilin Province 2010; China Environmental Science Press: Beijing, China, 2010. (In Chinese)
  67. Jilin Environmental Protection Bureau. The Environmental Quality Report of Jilin Province 2011; China Environmental Science Press: Beijing, China, 2011. (In Chinese)
  68. Jilin Environmental Protection Bureau. The Environmental Quality Report of Jilin Province 2012; China Environmental Science Press: Beijing, China, 2012. (In Chinese)
  69. Jilin Environmental Protection Bureau. The Environmental Quality Report of Jilin Province 2013; China Environmental Science Press: Beijing, China, 2013. (In Chinese)
  70. Heilongjiang Environmental Protection Bureau. The Environmental Quality Report of Heilongjiang Province 2002; China Environmental Science Press: Beijing, China, 2002. (In Chinese)
  71. Heilongjiang Environmental Protection Bureau. The Environmental Quality Report of Heilongjiang Province 2003; China Environmental Science Press: Beijing, China, 2003. (In Chinese)
  72. Heilongjiang Environmental Protection Bureau. The Environmental Quality Report of Heilongjiang Province 2004; China Environmental Science Press: Beijing, China, 2004. (In Chinese)
  73. Heilongjiang Environmental Protection Bureau. The Environmental Quality Report of Heilongjiang Province 2005; China Environmental Science Press: Beijing, China, 2005. (In Chinese)
  74. Heilongjiang Environmental Protection Bureau. The Environmental Quality Report of Heilongjiang Province 2006; China Environmental Science Press: Beijing, China, 2006. (In Chinese)
  75. Heilongjiang Environmental Protection Bureau. The Environmental Quality Report of Heilongjiang Province 2007; China Environmental Science Press: Beijing, China, 2007. (In Chinese)
  76. Heilongjiang Environmental Protection Bureau. The Environmental Quality Report of Heilongjiang Province 2008; China Environmental Science Press: Beijing, China, 2008. (In Chinese)
  77. Heilongjiang Environmental Protection Bureau. The Environmental Quality Report of Heilongjiang Province 2009; China Environmental Science Press: Beijing, China, 2009. (In Chinese)
  78. Heilongjiang Environmental Protection Bureau. The Environmental Quality Report of Heilongjiang Province 2010; China Environmental Science Press: Beijing, China, 2010. (In Chinese)
  79. Heilongjiang Environmental Protection Bureau. The Environmental Quality Report of Heilongjiang Province 2011; China Environmental Science Press: Beijing, China, 2011. (In Chinese)
  80. Heilongjiang Environmental Protection Bureau. The Environmental Quality Report of Heilongjiang Province 2012; China Environmental Science Press: Beijing, China, 2012. (In Chinese)
  81. Heilongjiang Environmental Protection Bureau. The Environmental Quality Report of Heilongjiang Province 2013; China Environmental Science Press: Beijing, China, 2013. (In Chinese)
  82. Wenzlik, M.; Eisenmenger, N.; Schaffartzik, A. What drives Austrian raw material consumption? A structural decomposition analysis for the years 1995 to 2007. J. Ind. Ecol. 2015, 19, 814–824. [Google Scholar] [CrossRef]
  83. Ang, B.W.; Zhang, F.Q. A survey of index decomposition analysis in energy and environmental studies. Energy 2000, 25, 1149–1176. [Google Scholar] [CrossRef]
  84. Gao, Y.C.; Han, R.L.; Tong, L.J. Evaluation of industrial eco-efficiency in Jilin Province. China Popul. Resour. Environ. 2011, 21, 106–111. [Google Scholar]
  85. Abdi, H.; Williams, L.J. Principal component analysis. Wil Inter Rev. Com Stat. 2010, 2, 433–459. [Google Scholar] [CrossRef]
  86. Gan, J.; Guo, F.Y.; Liu, J.S. The spatio-temporal evolution characteristics of urbanization spatial differentiation in Northeast China. Sci. Geogr. Sin. 2015, 35, 565–574. [Google Scholar]
  87. Gai, M.; Lian, D.; Tian, C.S. The research for Liaoning environmental efficiency and spatial-temporal differentiation. Geogr. Res. 2014, 33, 2345–2357. [Google Scholar]
  88. Guan, W.; Xu, S.T. Spatial energy efficiency patterns and the coupling relationship with industrial structure: A study on Liaoning Province, China. J. Geogr. Sci. 2015, 25, 355–368. [Google Scholar] [CrossRef]
  89. Tong, L.J.; Song, Y.N.; Han, R.L. Industrial environmental efficiency of costal economic belt in Liaoning Province. Sci. Geogr. Sin. 2012, 32, 294–300. [Google Scholar]
Figure 1. Study area.
Sustainability 08 01271 g001
Figure 2. Efficiency of different production processes in 2002 and 2013.
Sustainability 08 01271 g002
Table 1. Environmental efficiency scores during 2002–2013.
TimeChangchunJilinBaichengSongyuanDaqingSuihuaHarbinHegangJiamusiYichunUpstreamMidstreamDownstream
20021.1350.4270.0080.0331.3820.00030.6330.0150.0310.0060.4010.6720.017
20031.0700.5230.0090.0321.7780.0100.8030.0170.0670.0050.4090.8640.030
20041.1260.9060.0110.0522.4060.0081.4870.0240.0760.0070.5241.3000.036
20051.6431.6110.0220.1013.1070.0111.9260.0350.0900.0140.8441.6810.046
20062.0961.8370.0270.1503.6520.0161.9170.0450.0940.0231.0271.8620.054
20072.9232.3120.0350.2153.5280.0201.8800.0710.1030.0311.3711.8090.068
20084.4442.7710.0490.3054.1350.0332.2270.0900.1290.0351.8922.1320.085
20095.4872.9520.0760.3763.0180.0371.6270.0910.1290.0342.2231.5610.085
20108.0203.3450.0830.2674.0250.0192.5150.1170.1780.0402.9292.1860.112
201110.7636.2880.1300.8494.0910.0702.6470.1410.1280.0364.5082.2690.102
20129.1844.5680.1421.1264.3700.0922.9140.2290.1470.0633.7552.4590.146
201311.4904.4630.1731.2163.8490.1132.7550.2320.2110.0444.3352.2390.163
Table 2. Resource efficiency during 2002–2013.
TimeChangchunJilinBaichengSongyuanDaqingSuihuaHarbinHegangJiamusiYichunUpstreamMidstreamDownstream
20024.3012.2960.0100.2675.9490.0042.3180.0340.0530.0211.7192.7570.0359
20034.8792.6390.0110.3255.9940.0752.5160.0350.0710.0171.9642.8620.0409
20044.7694.0910.0120.4155.7370.0833.9620.0400.0710.0222.3223.2610.0442
20054.0162.2600.0120.6887.6740.1155.5830.0700.0960.0311.7444.4570.0657
20065.2403.3400.0100.9109.8500.1527.0470.0920.1250.0582.3755.6830.0916
20077.2255.0430.0141.17111.1050.2028.8400.1310.1780.0823.3636.7160.1301
200810.4316.5810.0232.12314.9460.29511.2250.2100.2640.1224.7898.8220.1985
200913.8616.8610.0331.19210.4930.3768.9690.2310.3250.1245.4876.6130.2264
201018.8868.8620.0581.42918.2410.67717.8100.3550.5620.2127.30912.2430.3761
201123.66112.8750.1531.91328.6700.97812.0770.4370.8030.1939.65013.9080.4775
201232.49013.2520.2052.21230.1621.57213.9760.4941.0590.21312.04015.2370.5886
201334.46713.9310.2622.17832.1302.13217.1020.6461.2750.22912.70917.1220.7166
Table 3. Cleaner production efficiency during 2002–2013.
TimeChangchunJilinBaichengSongyuanDaqingSuihuaHarbinHegangJiamusiYichunUpstreamMidstreamDownstream
20020.2410.2380.5540.1340.2430.0680.2490.1160.5030.1770.2910.1870.2653
20030.2210.2550.5170.1080.3130.0850.2970.3480.7900.1710.2750.233320.4361
20040.2480.2260.6060.1340.4290.0820.3570.4070.8840.2000.3030.2890.4969
20050.4030.6430.9770.1550.4010.0810.2850.3340.8170.3680.5440.2560.5061
20060.3840.6282.2810.1330.3870.0760.2870.3180.6710.2860.8560.2500.4250
20070.3850.6602.1950.1550.3800.0490.2440.3250.5050.2860.8490.2240.3719
20080.4060.6151.9040.1190.2610.2820.2050.2720.4150.2260.7610.2500.3045
20090.3880.6331.6800.2440.3520.1400.1890.2650.3980.2210.7360.2270.2945
20100.4060.7001.0870.1620.2860.0630.1620.2500.3670.1760.5890.1700.2645
20110.4850.5261.3900.4170.1820.0590.2480.2540.1620.1810.7050.1630.1989
20120.2560.5271.2130.4640.1930.1510.25030.2850.1460.2600.6150.1980.2304
20130.3580.4890.9710.4820.1550.2080.1870.2310.1740.1850.5750.1830.1968
Table 4. Terminal control efficiency during 2002–2013.
TimeChangchunJilinBaichengSongyuanDaqingSuihuaHarbinHegangJiamusiYichunUpstreamMidstreamDownstream
20021.0970.7831.4830.9210.9560.9961.0973.7491.1761.5761.0711.0162.167
20030.9930.7791.5440.9020.9471.5531.0751.3891.2101.6221.0551.1921.407
20040.9530.9831.5650.9370.9781.1251.0531.4981.2061.4991.1101.0521.401
20051.0151.1091.7970.9431.0081.1551.2111.5091.1501.2081.2161.1251.289
20061.0430.8761.1671.2430.9591.3520.9481.5471.1161.3921.0821.0861.352
20071.0520.6941.1201.1840.8371.9860.8731.6631.1411.3291.0131.2321.378
20081.0500.6841.1291.2011.0600.4020.9651.5821.1761.2741.0160.8091.344
20091.0210.6801.3561.2940.8180.7040.9611.4890.9971.2261.0880.8281.237
20101.0460.5401.3261.1560.7720.4360.8711.3180.8641.0701.0170.6931.084
20110.9380.9290.6131.0640.7841.2080.8831.2750.9791.0360.8860.9581.097
20121.1030.6540.5711.0960.7500.3880.8331.6270.9511.1390.8560.6571.239
20130.9330.6560.6821.1590.7720.2560.8641.5550.9501.0470.8570.6301.184
Table 5. Eco-efficiency during 2002–2013.
TimeChangchunJilinBaichengSongyuanDaqingSuihuaHarbinHegangJiamusiYichunUpstreamMidstreamDownstream
20020.8980.3600.0050.0291.1210.0000.4970.0100.0200.0050.3230.5400.012
20030.8780.4370.0050.0291.3710.0090.6090.0110.0340.0040.3370.6630.017
20040.9110.7420.0060.0461.6950.0071.0810.0150.0370.0050.4260.9280.019
20051.1660.9410.0080.0882.2110.0101.4320.0230.0460.0100.5511.2180.027
20061.4971.1850.0070.1292.6640.0141.5070.0300.0540.0170.7051.3950.034
20072.0811.5850.0100.1822.6770.0181.5510.0460.0650.0230.9651.4150.045
20083.1161.9500.0160.2663.2390.0301.8580.0630.0870.0271.3371.7090.059
20093.9312.0640.0230.2862.3440.0341.3780.0650.0920.0261.5761.2520.061
20105.6292.4280.0340.2253.2970.0182.2040.0880.1350.0342.0791.8400.086
20117.3984.2250.0700.5883.5800.0652.1710.1070.1100.0303.0701.9390.083
20127.1603.3970.0840.7463.8170.0872.4120.1570.1290.0492.8472.1050.111
20138.6173.3800.1040.7803.4370.1082.3730.1710.1810.0373.2201.9720.130
Table 6. Regression results of industrial systems’ eco-efficiency in the Songhua River basin.
AreaEDOSISEMFIGRSTR2FSig.t
Upstream0.232−0.2520.0570.109−0.0320.2510.1720.84454.252<0.001
Midstream0.165−0.105−0.1530.1490.1600.1690.1370.83249.368<0.001
Downstream0.156−0.1290.1550.1450.1530.156−0.1420.918112.162<0.001
Whole basin0.167−0.146-0.1270.1520.1580.1740.1490.911106.004<0.001
Note: Sig.t is the p-value, meaning significance. If Sig.t < 0.001, the difference is very significant.

