Article

Critical Factors Influencing Viability of Wave Energy Converters in Off-Grid Luxury Resorts and Small Utilities

by
Aksel Botne Sandberg
1,*,
Eirik Klementsen
1,*,
Gerrit Muller
1,*,
Adrian De Andres
2,* and
Jéromine Maillet
3,*
1
Norwegian Institute of Systems Engineering (NISE), Høyskolen i SørØst-Norge, Hasbergs vei 36, 3616 Kongsberg, Norway
2
Institute for Energy Systems, University of Edinburgh, West Mains Road, Edinburgh EH9 3JN, UK
3
CorPower Ocean AB, Brinellvägen 23, 114 28 Stockholm, Sweden
*
Authors to whom correspondence should be addressed.
Sustainability 2016, 8(12), 1274; https://doi.org/10.3390/su8121274
Submission received: 30 September 2016 / Revised: 28 November 2016 / Accepted: 29 November 2016 / Published: 7 December 2016
(This article belongs to the Special Issue Wave Energy Converters)

Abstract

:
This paper examines technical and non-technical factors that are critical to the viability of commercialization of wave energy converters in off-grid luxury resorts and small utilities. Critical factors are found by investigating Levelized Cost of Energy, and using the tools PESTEL and Porter’s five competitive forces. Identified factors are then applied on three business cases to investigate their impact on viability. The results show that one of the main challenges facing off-grid commercialization is the few wave energy converter units installed per location, negating the economy of scale that large wave energy farms count on to achieve competitive cost levels. In addition, factors like current cost of energy, available wave resources, distance from shore, infrastructure, supply chain logistics, and electricity demand are found to be deciding factors for viability. Despite these challenges, it is found that there are potentially viable off-grid business cases for commercialization of wave energy converters.

1. Introduction

1.1. Problem Description

The common long-term goal for wave energy industry is to supply power to large national grids with wave energy converter (WEC) farms. Opportunity in this market has been delayed due to the slow advance of wave energy technology towards economic competitiveness, and large power utility companies not significantly investing in marine technologies [1].
Wind energy and photovoltaic (PV) power have gone through an immense development over recent decades, and are now often commercially viable alternatives to fossil fuels. The wave energy industry is struggling to reach the same level of viability as wind and PV due to two major issues: Survivability and Levelized Cost of Energy (LCOE). Providing a solution that is cost efficient and reliable is a shared consensus in the WEC industry for the path towards commercialization.
In addition, WEC developers must overcome challenges like environmental impacts, regulatory obstacles, social acceptance, interference with commercial and recreational operations, power integration, etc. [1,2,3].
The wave energy industry is investigating alternative off-grid market opportunities to accelerate technology and reliability-validation, and to accomplish financial goals. Establishing WEC standards and proving the technology in these markets can accelerate the process of large grid operators adopting WEC solutions. In this paper, off-grid systems are defined as isolated power production systems below 10 MW of production capacity.

1.2. Status of the Industry

Total increase in demand for energy and political pressure to explore sustainable development increases the demand for effective methods to supply the world with renewable energy (RE). With an estimated worldwide annual resource of 32,000 TWh [4], where 2000–4000 TWh is considered exploitable [5], wave power seems intended to be a part of tomorrow’s world energy mix. Seen in relation to numbers published by IEA [6], this is between 9% and 17% of the world’s total electricity production.
The wave energy industry is diverse, with more than 45 different concepts per 2014 [7], and no clear market leader established [1].
As a case study for this paper, the WEC system is based on a design from CorPower Ocean AB (CPO). CPO is a Swedish based WEC developer working on a wave energy converter that oscillates in resonance with the incoming waves, strongly amplifying the energy capture. CPO’s WEC system consists of a single or multiple 250 kW WECs in a floating array (WEC farm). Each WEC is moored to the seabed and interconnected by a power umbilical cable. See Figure 1.

1.3. Purpose of Research

This research paper builds on research of off-grid market opportunities found by Nilsson [8] and Peterson [9]. They highlight small utilities and luxury resorts as the most promising markets for WEC commercialization. These markets are therefore the focus of this research. Peterson [9] and Nilsson [8] also identified opportunities using WECs to desalinate water, as add-ons to small utilities and resorts.
These markets have merely been assessed with regards to electricity demand (watt-hours), available wave resource (kW/m wave front) and current cost of energy (€/MWh). To investigate the most promising market match, this paper takes additional factors into account. This will give a more in-depth view of the viability of potential off-grid opportunities.
Using CPO’s system design as starting point, this paper aims to find the most critical factors influencing viability of commercializing the WEC system at small off-grid power utilities and luxury resorts. This paper also evaluates how well the chosen theoretical framework support viability analysis of WEC-commercialization in an off-grid market. This will provide an extensive view of viability factors based on well-known scientific tools and theories, and can serve as input to future viability analysis within the wave energy industry.
In the next section, the paper illustrates and explains the envelope of the WEC system. The theoretical framework of LCOE, PESTEL and Porter’s five forces is elaborated, and the paper proposes why and how they can be put into a framework to explain viability of off-grid commercialization.

2. Theoretical Framework and Research Methods

This section explains the WEC-system, the WEC lifecycle, and its connection to consumers of power. Afterwards, theories are explained and put into a theoretical framework, which can be used to explain viability of off-grid commercialization.

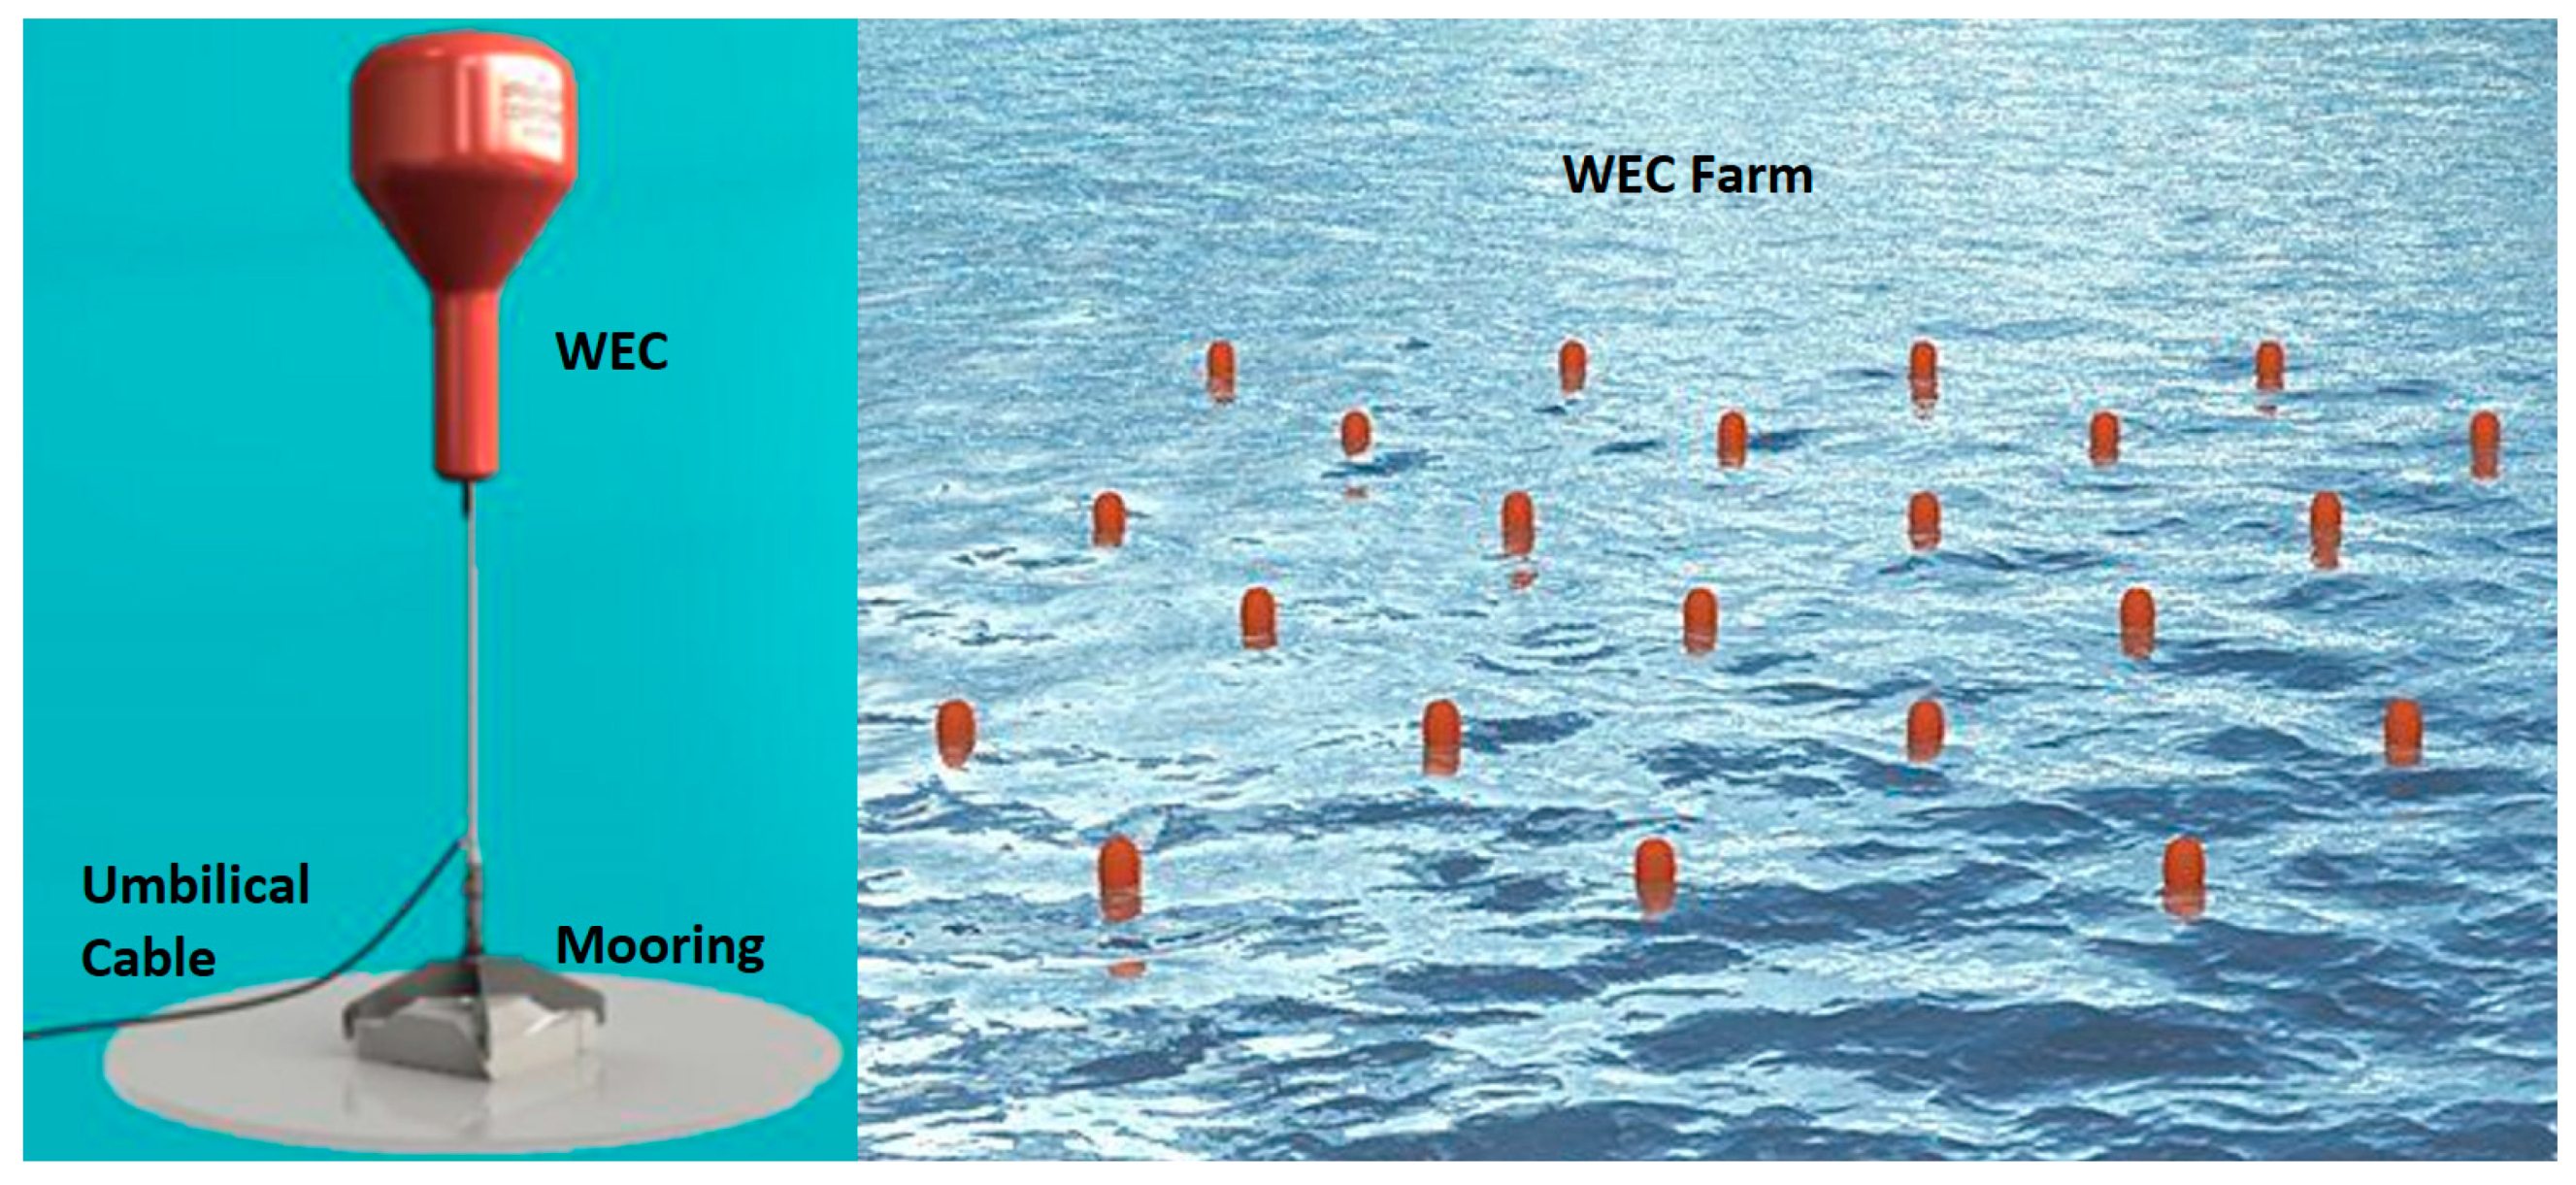
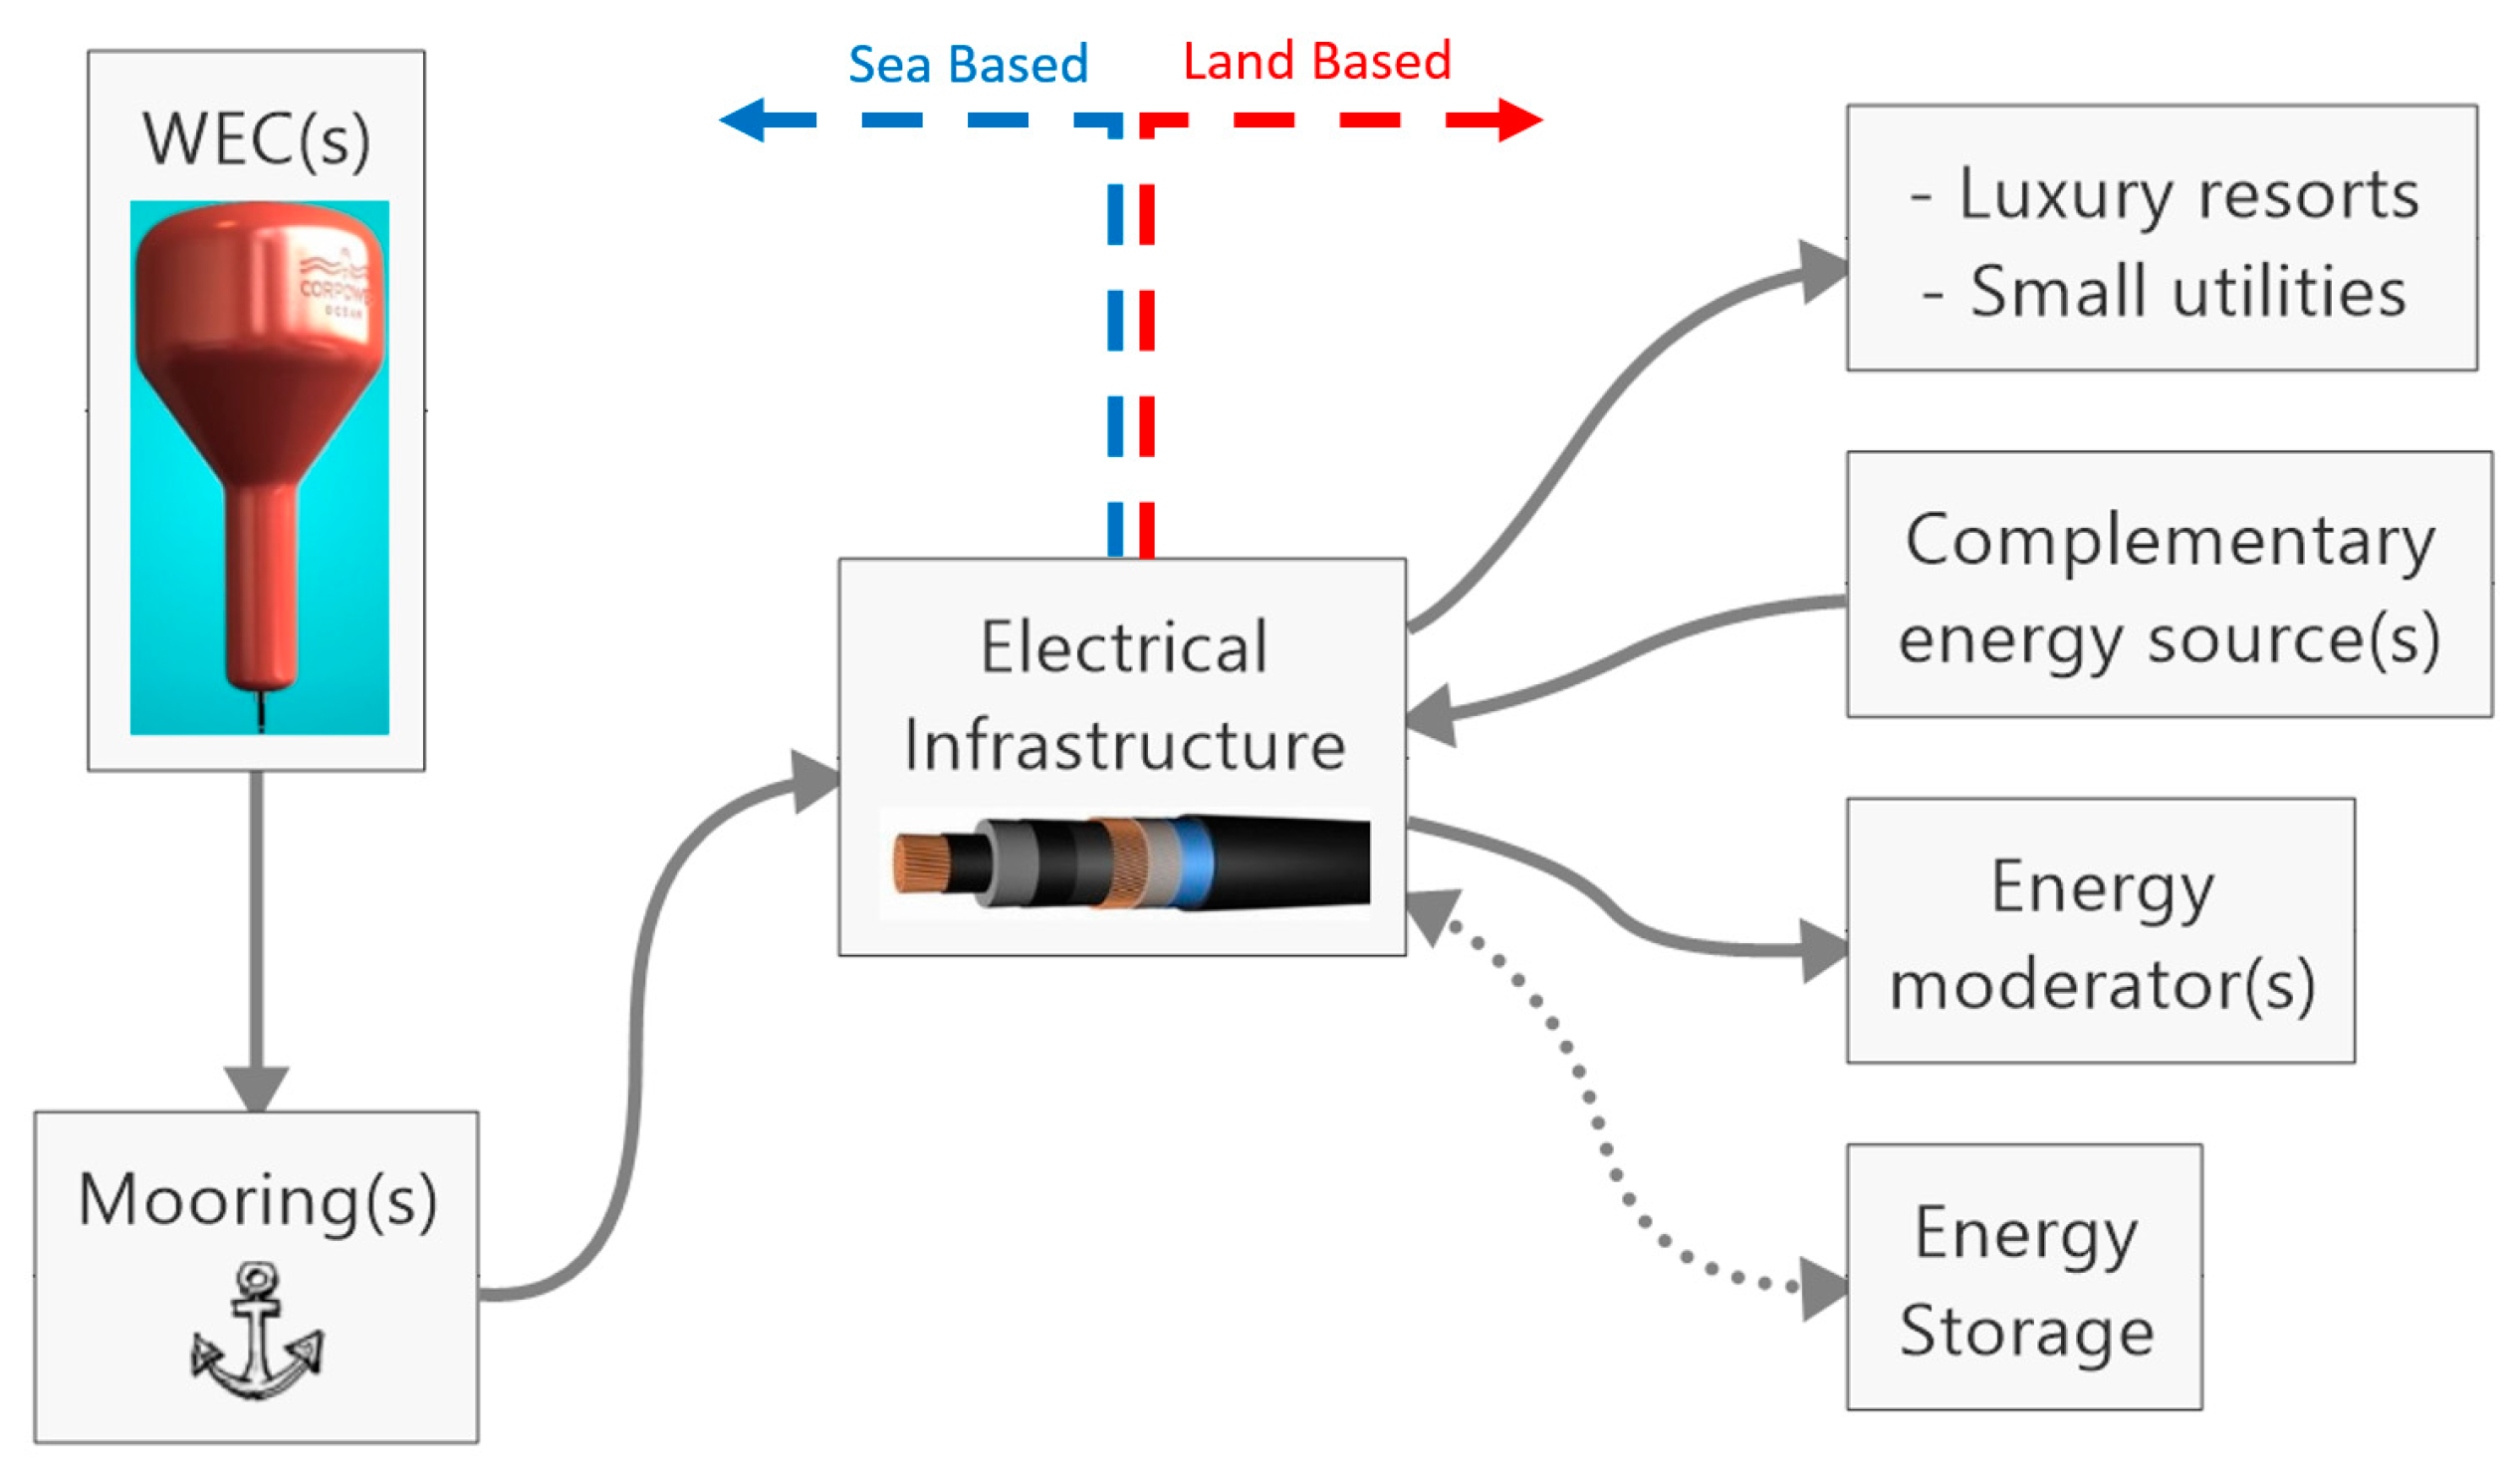
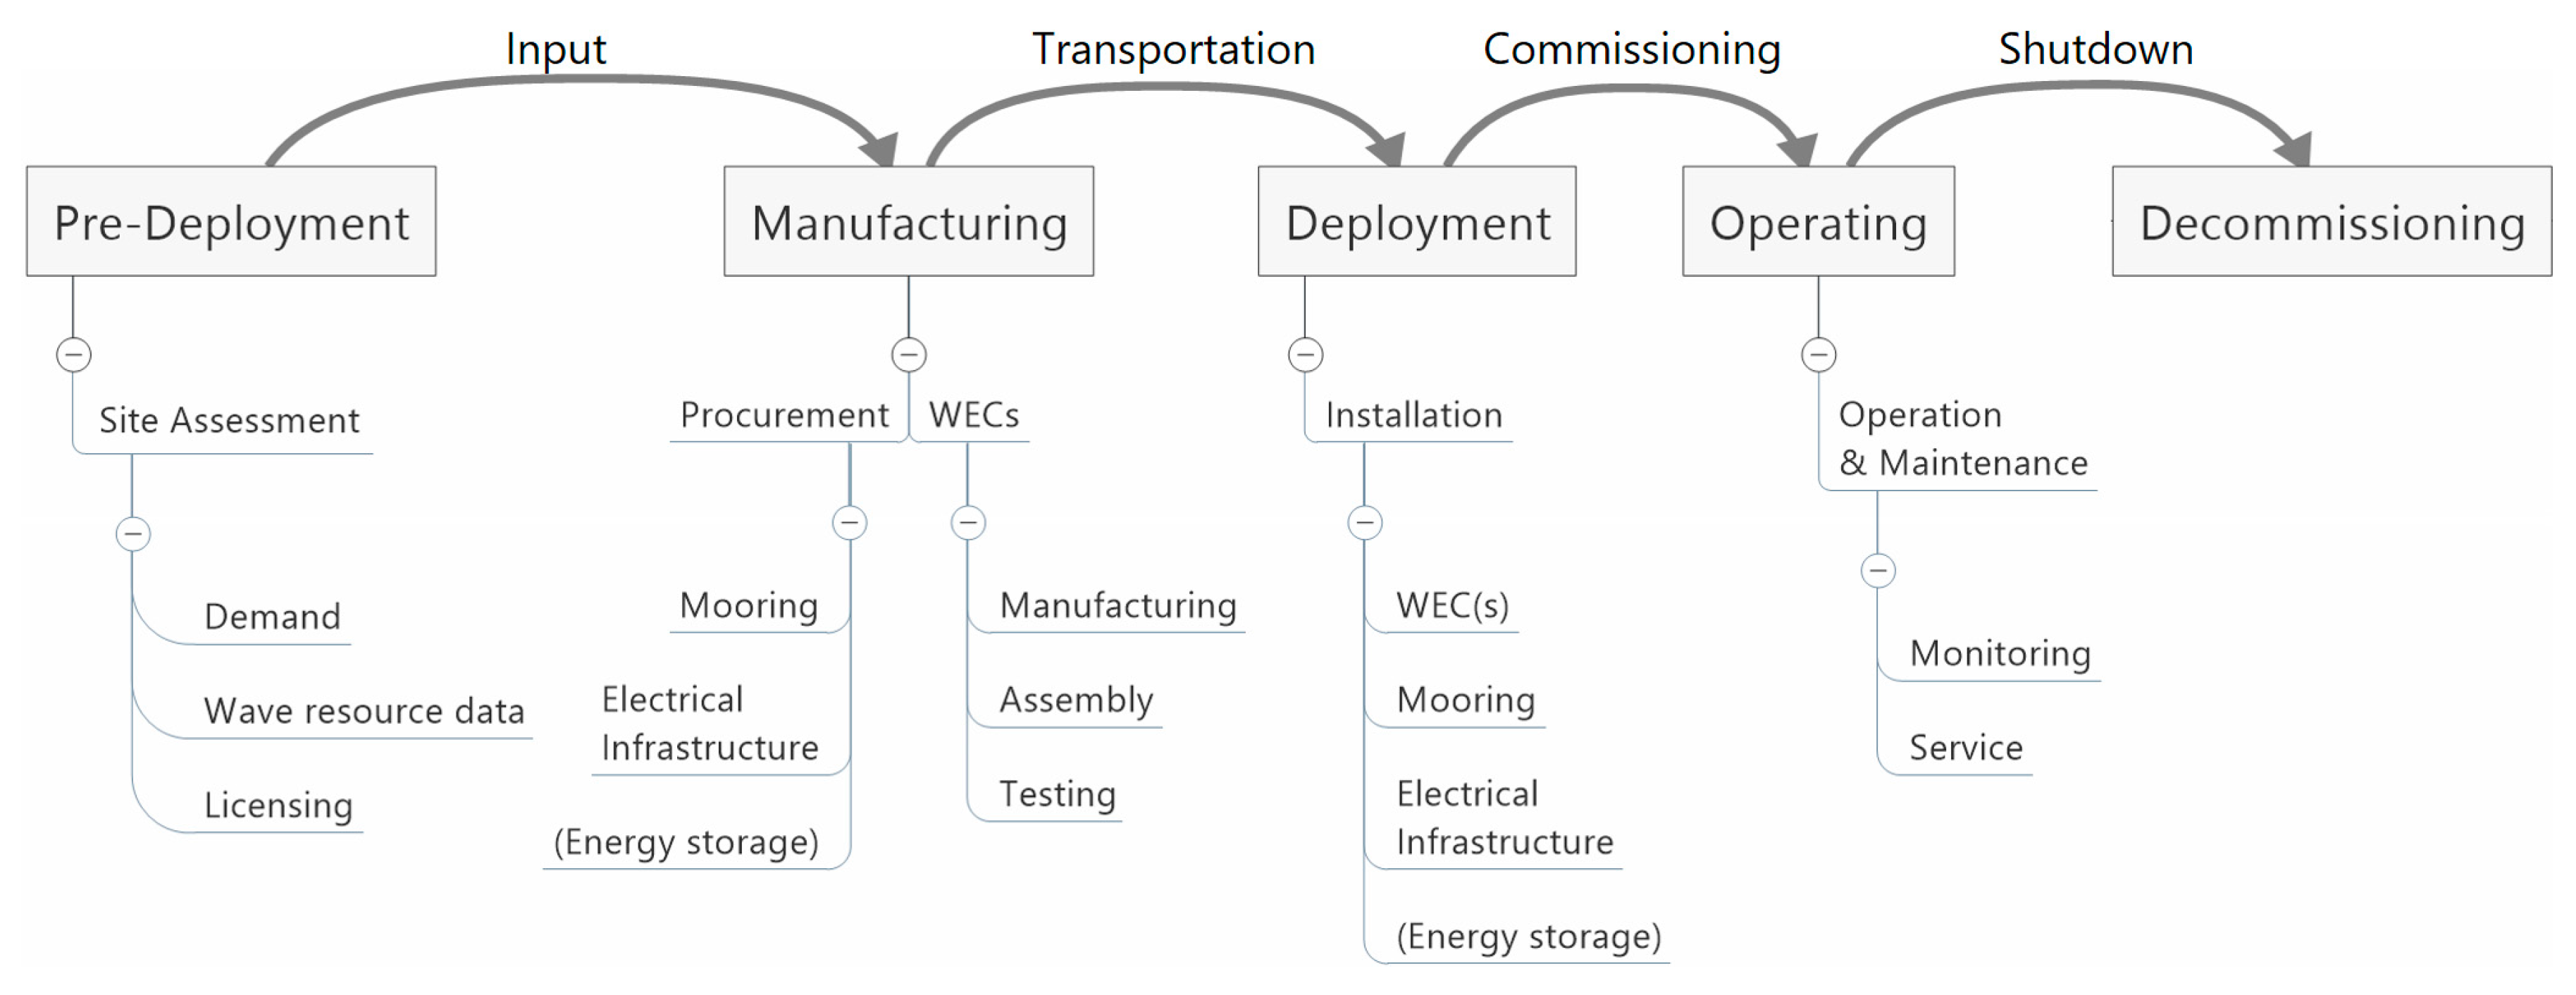
2.1. Wave Energy Converter Farm System

Waves set the buoyant WEC in motion while traveling through the ocean. This movement drives an axle connected to a cascade gear inside the buoy, which generates electricity. This electricity is directed through a connection between the WEC and the mooring, and the electricity is guided back to power consuming entities at shore, as shown in Figure 2.
Energy consumers, such as luxury resorts and small utilities, have variations in demand. The electrical infrastructure needs to regulate the supply of energy according to the consumer’s demand to ensure stability of supply. Available means for regulation are control of complementary energy sources, control of energy moderators, and using energy storage as buffer. Moderators are other systems that can moderate energy consumption by shifting energy use over time, such as swimming pool heating, cooling installations, and desalination systems. Regulation gets more critical when supplying power with intermittent energy sources, such as wave energy. The power demand and the stability requirements determine the maximum amount of power intermittent sources can supply, which determines the number of WECs that can be installed.
The intermittent nature of wave energy makes matching the power output of the WEC system with the demand of customers a challenge. Because of this, WEC systems for off-grid markets will be a secondary source of energy, where the primary or complementary source(s) must be able to cater for any missing WEC energy production. Alternatively, wave energy may take larger shares using energy storage and/or moderators.
Figure 3 shows the product flow chart of the WEC system throughout its life cycle. It shows the activities involved, from assessing a potential location for commercialization, to the final decommissioning of the system.
Pre-deployment consists of a variety of assessments to determine the characteristics of the location and the optimal WEC system configuration. In manufacturing, these inputs are used to manufacture and procure necessary equipment. Transport and installation are possibly large cost-factors depending on location, as equipment and towing vessels are required. Once operational, monitoring and service maintenance must be performed. Monitoring is done to gather operational data and check correct system readings. Minor services can be performed at sea, while major services must be done on dry land, where equipment such as cranes and service skids are required.

2.2. Theoretical Framework

This paper determines viability of off-grid commercialization of the WEC system by addressing critical technical and non-technical factors. Factors are identified by modelling Levelized Cost of Energy, and through PESTEL and P5F analysis, as shown in Figure 4. Location variables are geographical and environmental aspects, and the system configuration relates to configuration choices of the WEC farm system.
The paragraphs below describe the different tools in the theoretical frameworks.

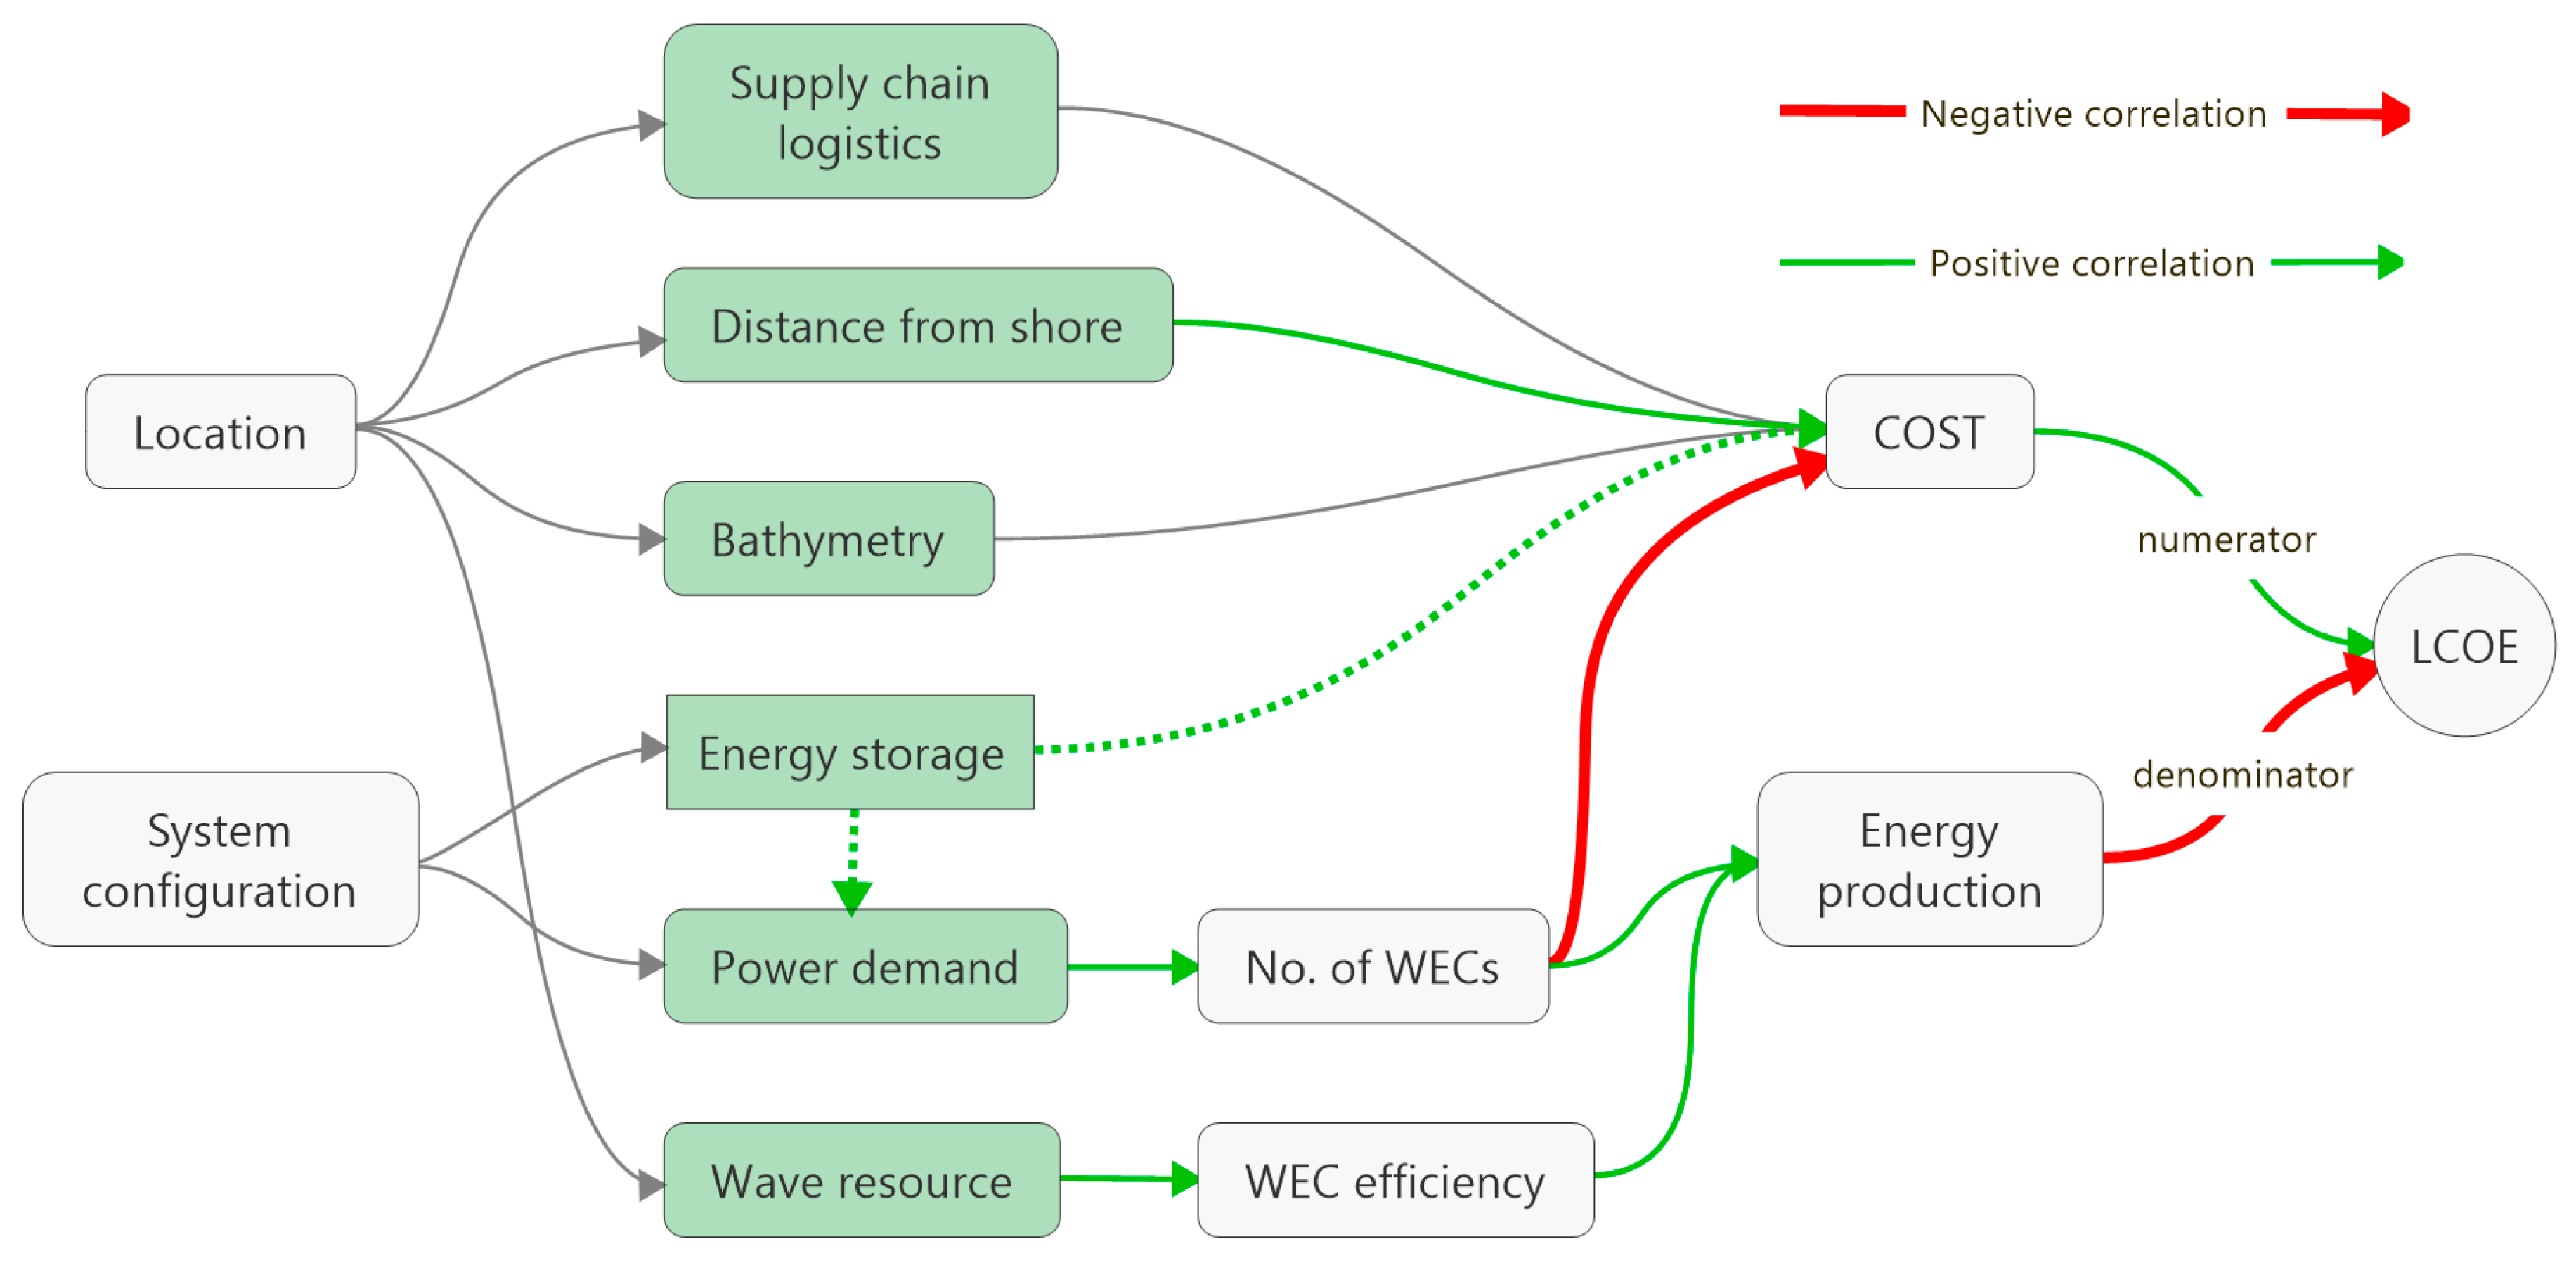
2.2.1. Levelized Cost of Energy

LCOE is used to evaluate a WEC system’s viability from a financial perspective. Critical factors in the LCOE are analyzed to see how they can be managed to lower the LCOE, and thereby increase the viability of a potential off-grid commercialization. Acknowledging that looking at LCOE is an important measure of viability, it must be seen relative to the LCOE of alternative sources of energy (e.g., small utilities, diesel generators, PV, wind energy, etc.).
LCOE considers the total life cycle costs divided by total energy generated throughout the lifespan of the system, to calculate a price per energy unit generated [10]: Life cycle cost and Annual Energy Production (AEP) therefore determines the LCOE [11]:
LCOE = CAPEX + Σ t = 1 n OPEX t ( 1 + r ) t Σ t = 1 n AEP t ( 1 + r ) t
Life Cycle Cost is the total cost of all processes and activities in a project, from initiation to decommissioning (i.e., from cradle to grave) [12]. All costs are annually discounted back to a present value using a discount rate (r). The life cycle cost is traditionally broken down to two major cost structures; Capital Expenditure (CAPEX) and Operational Expenditure (OPEX). CAPEX represents the initial investment cost for acquiring physical assets needed for the system, while OPEX are the costs related to installation, operation and decommissioning of the WEC system. OPEX costs are calculated on an annual basis between starting project year (t = 1), and ending project year (t = n).
Annual Energy Production throughout a WEC systems lifetime is the product of maximum energy capacity, capacity factor and availability. The capacity factor is the average-to-maximum-energy-capacity ratio, indicating the actual output to the rated output. Availability is defined as the proportion of time the WEC is in functional operation. AEP is calculated between starting project year (t = 1), and ending project year (t = n).

2.2.2. PESTEL

PESTEL is a mnemonic derived from: Political, Economic, Social, Technical, Environmental, and Legal. It is a structured way of organizing environmental factors influencing the industry [13], and is used to analyze and map the environment influencing the industry of interest. The tool gives an overview of macro-environmental factors that a company needs to take into consideration when assessing viability of commercialization.
Wave energy has lower energy density (W/m2) than non-sustainable energy (e.g., diesel generators). A consequence of this is that WEC technology will be more noticeable and spread across larger areas. This makes siting decisions affect a greater number of stakeholders [14]. RE projects often fail not because of technical difficulties, but due to developers not devoting enough attention to key stakeholders’ needs [2].

2.2.3. Porter’s 5 Forces (P5F)

WEC systems are part of the wave-energy-production-domain, competing with other WEC producers and alternative energy producers in the industry. Porter’s theory of competitive advantage serves as a tool to describe the competitive landscape in an industry [15]. The fundamental assumption of Porter’s 5 Forces is that the internal resources and capabilities are fully transferrable between companies, and that a company therefore cannot create any competitive advantage with these. A company can only gain competitive advantage through strategic placement in the industry, in relation to its competitors. This can be done by either differentiating the product, or differentiation by low cost. P5F is used to analyze the threats of the following five industry-forces: Rivals, Suppliers, Entrants, Customers, and Substitutes. Identifying what minimizes external threats gives valuable input to determining the factors for viability of commercialization, and the most promising business case for off-grid commercialization.

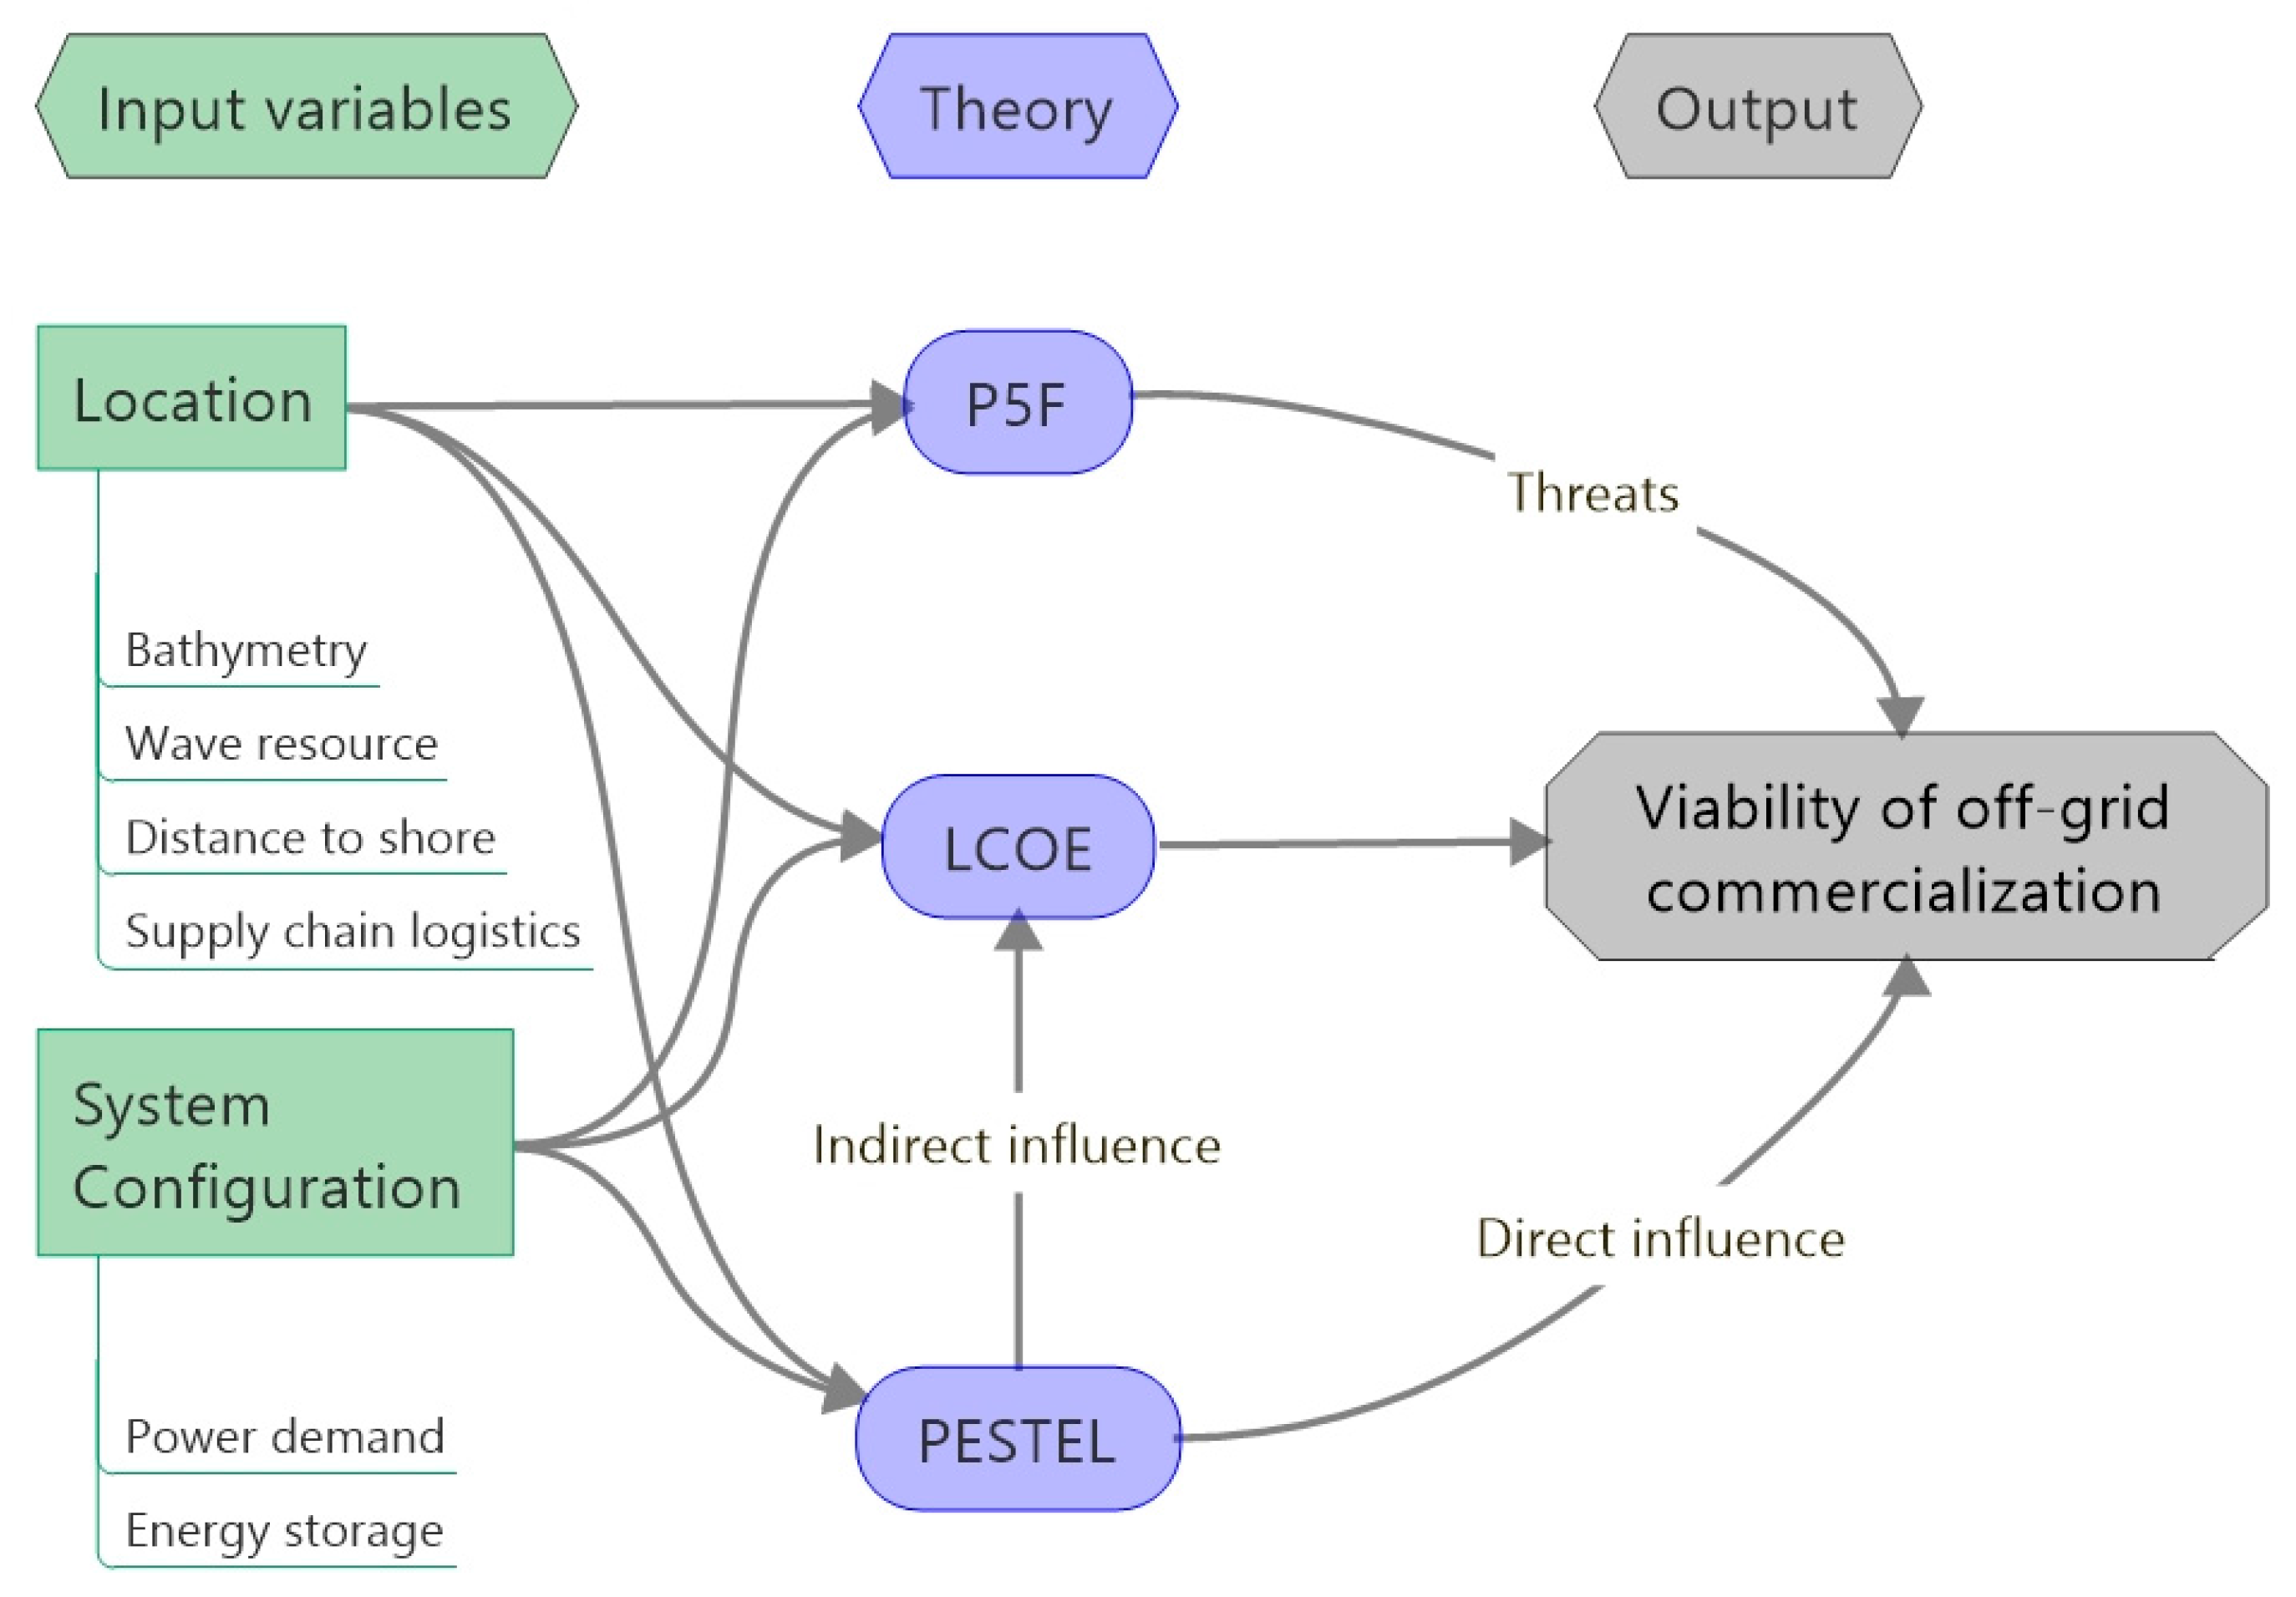
2.3. Research Methodology and the Viability Model

To determine viability of an off-grid commercialization, the theoretical framework of LCOE, PESTEL, and P5F is applied on the WEC system in the market of small utilities and luxury resorts. This is then applied on three case studies. This identifies the impact of the different factors on the viability of hypothetical business cases for off-grid commercialization.
The viability framework is based on information from the WEC system and from literature research of LCOE, PESTEL, P5F, wave energy, and renewable energies.
Using a case study research approach provides the means of getting a deeper understanding of processes and contextual influences in the problem statement [16]. Yin [17] argues that a case study investigates a contemporary aspect in a real-life context, where the juncture between the phenomenon and context is not clearly defined. Triangulation of found case data also provides accuracy and credibility to the research.
Figure 5 shows LCOE broken down into multiple factors, as well as positive and negative correlations between them. Dotted lines represent possible impacts if energy storage is implemented. From this model, input factors and their influence on the WEC system LCOE is analyzed.

3. Results and Discussion

In this section, the critical factors are discussed. Firstly, the factors are discussed in general, substantiating the importance and consensus of the factors. Then, the factors are set into relation with the three chosen cases to view how/if they differ depending of the case. Factors are not ranked by relative importance, as the importance of each individual factor will differ from case to case. The paper also discusses how well the theoretical framework is fit to solve viability of commercialization of the WEC solution in an off-grid market.

3.1. Discussion of Factors Affecting Viability of Off-Grid WEC Systems
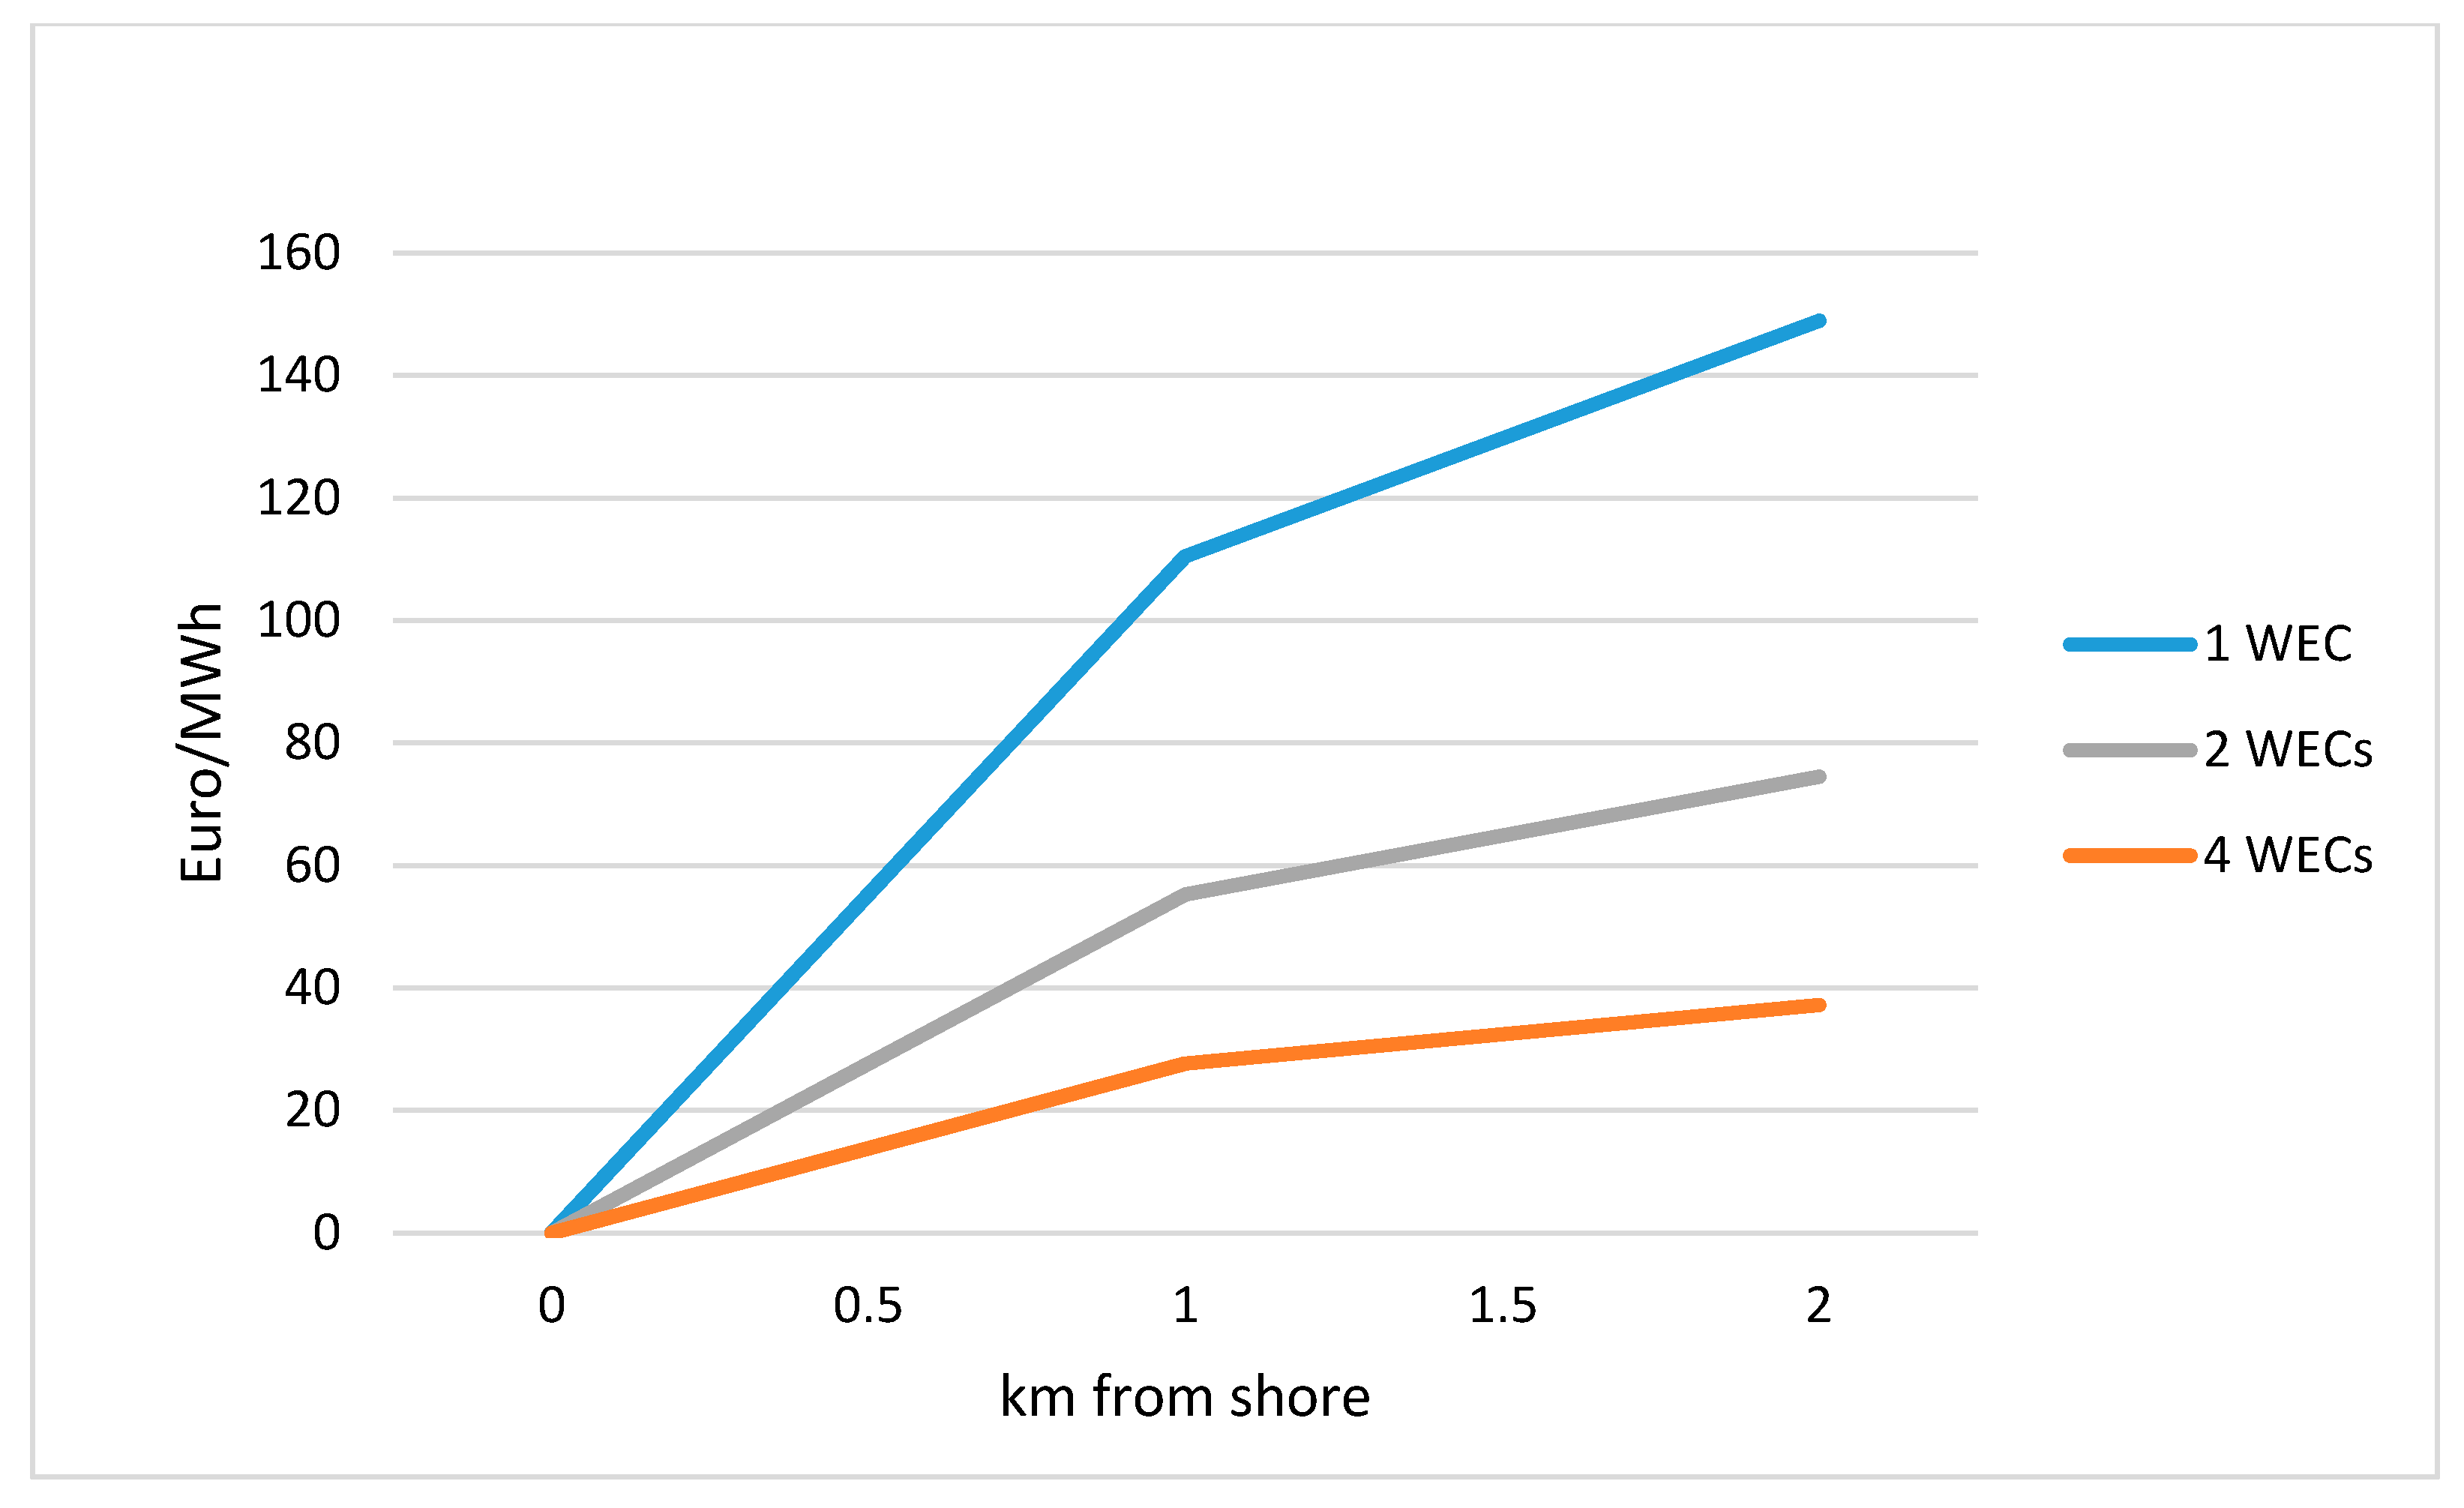
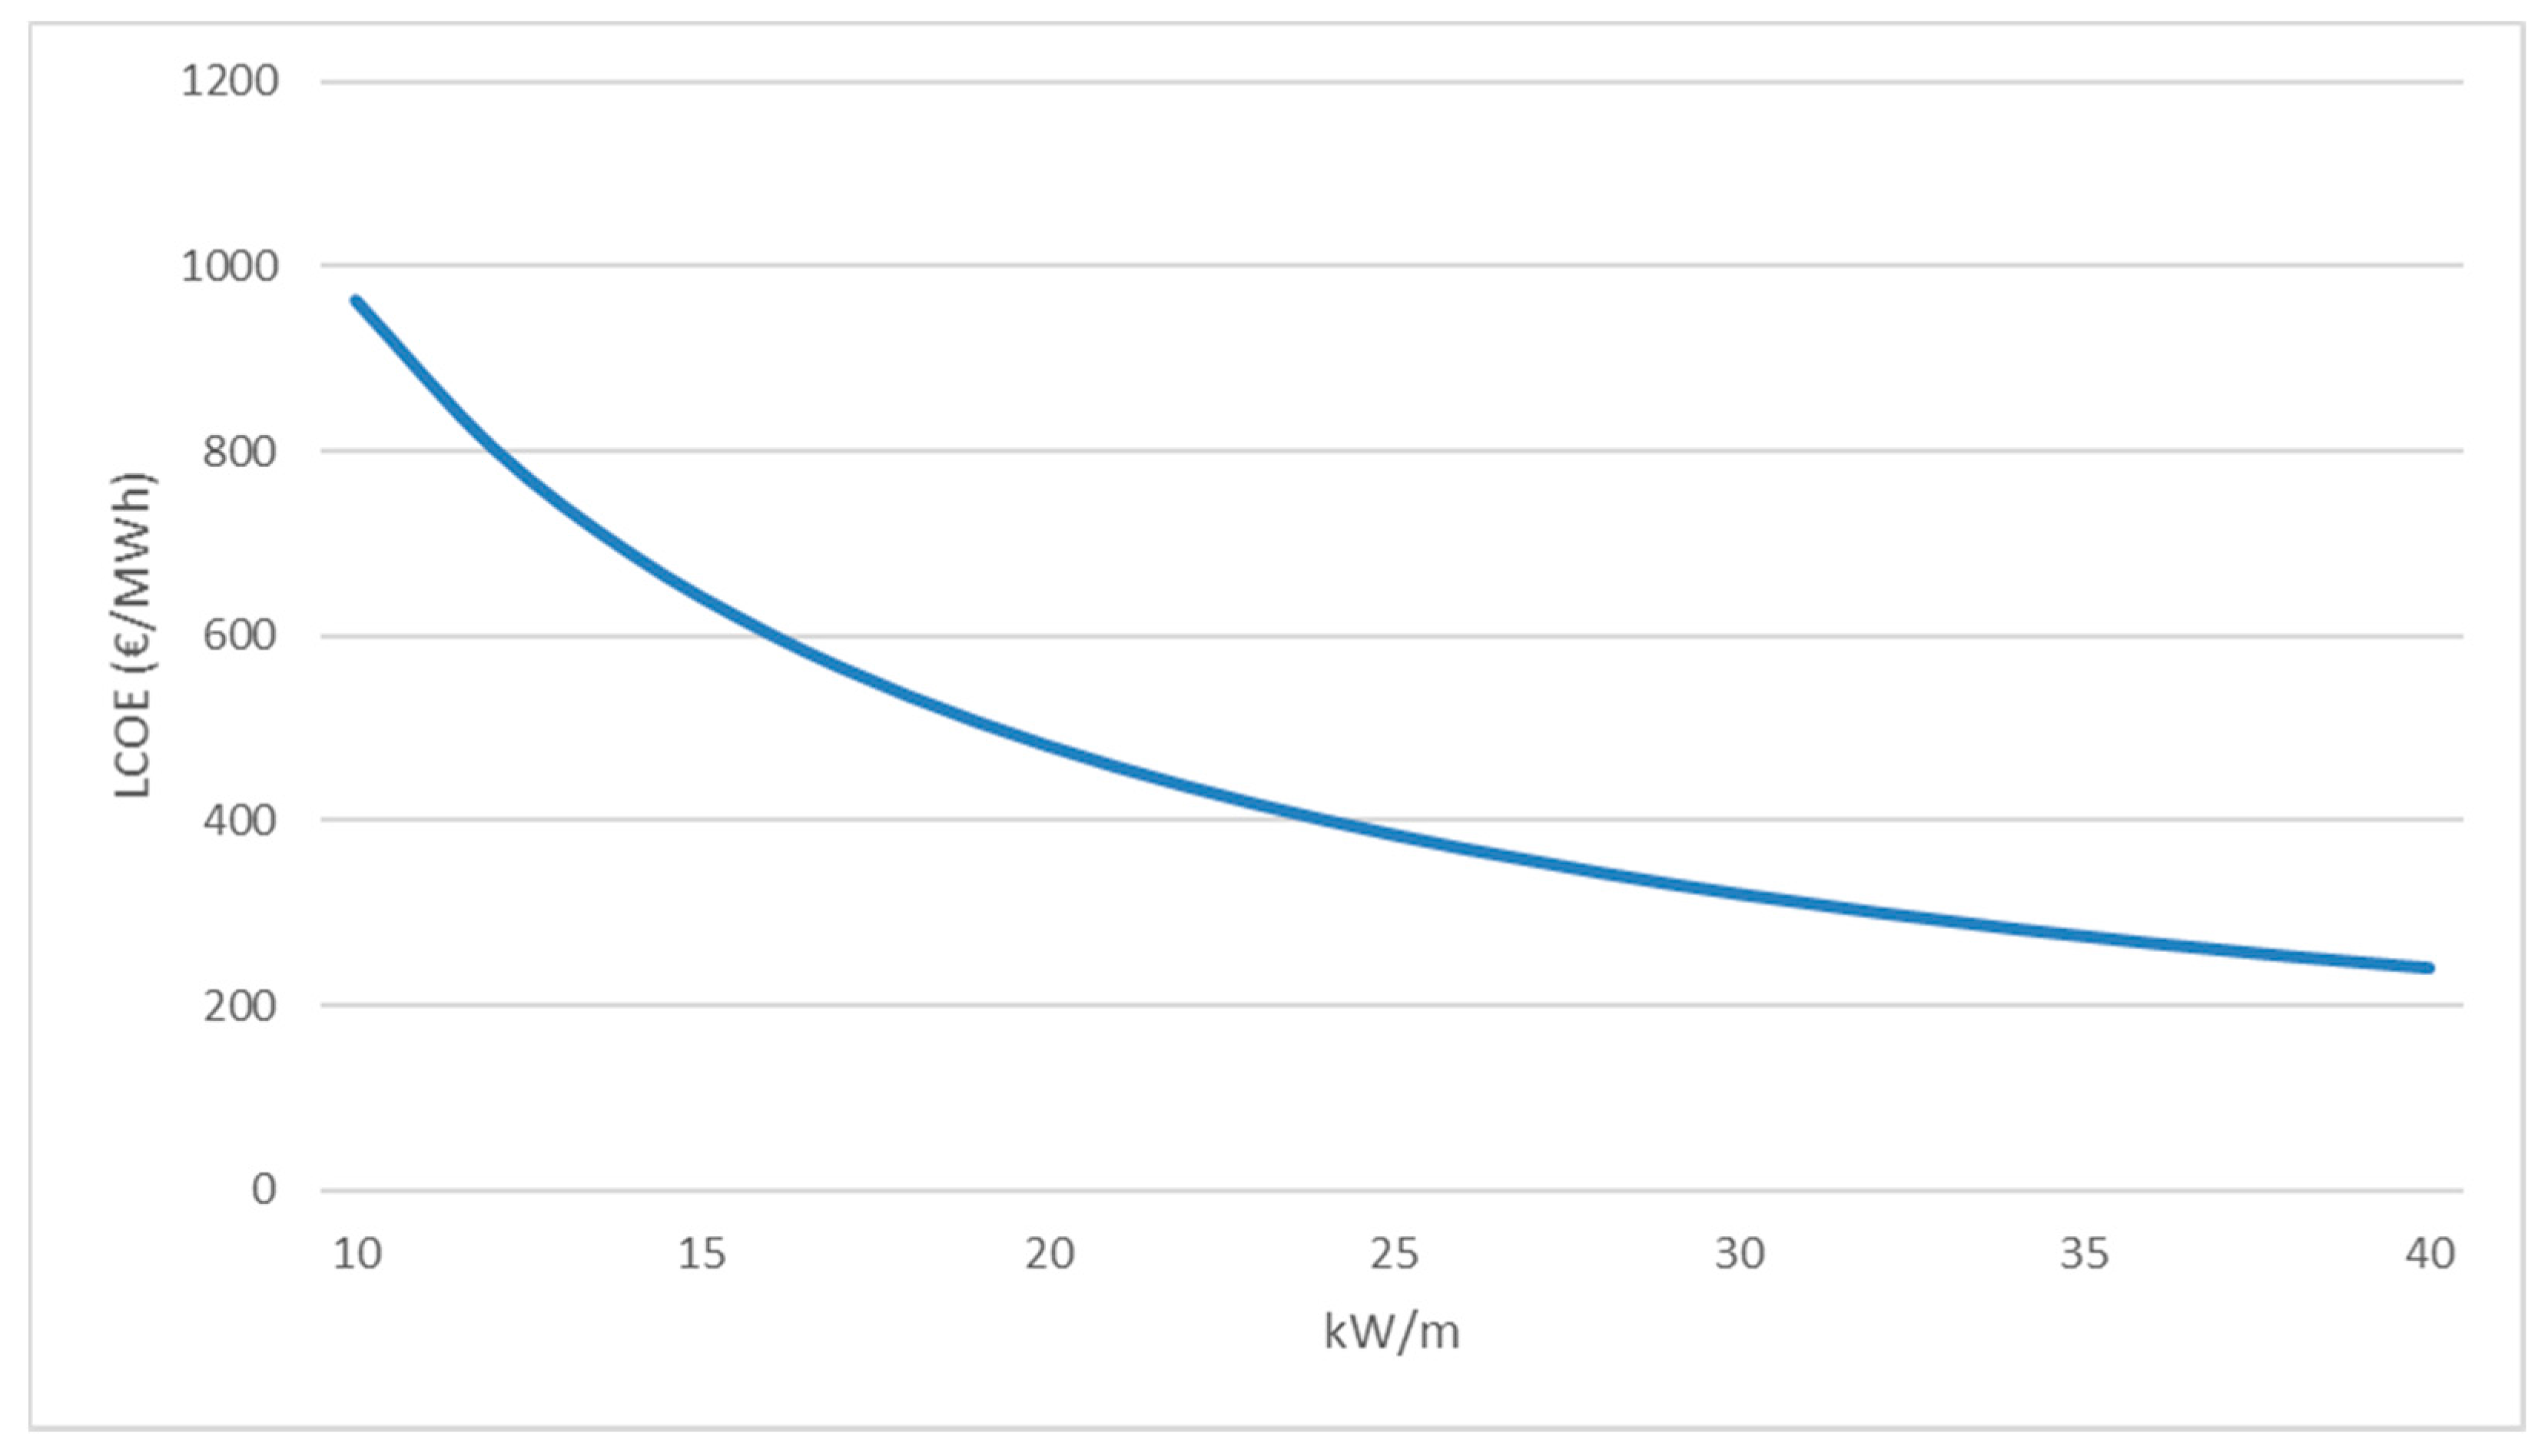
3.1.1. LCOE

This subsection elaborates the critical factors shown in the LCOE breakdown model (Figure 5).
Wave resource. Available wave resource varies on a global basis, and through climatic seasons. Available wave resource determines the movement of the WEC and therefore the power output of the WEC. A large average available wave resource increases the power output from each WEC, which subsequently lowers the LCOE. The ability to evaluate wave resource is critical to determine the LCOE for a business case. High peaks in wave resource might negatively impact the average power output from the WEC, as this may force the WEC into survival mode, where it will have a lower power output. Data used in this research assumes a positive correlation between available wave resource and WEC power output.
Frazerhurst [18] states that local bathymetry has significant impact on wave characteristics, creating “hotspots” of wave energy. Choosing a location with ocean characteristics that matches the performance characteristics of the WEC is vital, as financial revenue is generated from this match [19]. Therefore, References [19,20,21] argue that detailed resource data collection and analysis is imperative to viability of commercialization.
With the predicted power matrix of CPO’s 250 kW WEC, the LCOE is expected to scale roughly according to Figure 6. Due to commercial reasons, the complete power matrix is not available for review. The figure shows LCOE as a function of available wave resource, based on the LCOE formula explained in Section 2.2.1. To show the LCOE progression, the graph is plotted using an assumed fixed cost relative to a LCOE of 400 €/MWh at approximately 24 kW/m (corresponding to a capacity factor of 0.4). The scaling will be similar regardless of the project cost or number of WECs; the whole graph will simply be skewed up or down. This figure showcases the importance of deploying WECs in location with a high available energy resource.
Smaller scale WECs will harness energy more efficiently in smaller waves, and is a possible alternative for locations with lower wave resources. However, installing smaller units generally increases WEC CAPEX per kW installed.
Power demand and Energy storage. Both luxury resorts and small utility grids have a variation in demand. This variation does not necessarily match the power output supply from the WEC system, making discrepancies in the relationship between demand and supply. The viability of a business case can also be affected by how the seasonality of the wave resource correlates with the seasonality of the energy demand. This becomes more important the higher share of the demand wave energy aim to provide.
As argued by Khan et al. [22], average power output of wave energy is predictable, and can be estimated with good margins on a daily to hourly basis. Momentary WEC power output however, fluctuates on the basis of minutes, depending on sea states. As any consuming entity needs stable power supply to operate successfully, this fluctuation in energy output causes stability problems for the energy consumer, and may even damage electrical equipment [23]. To keep this fluctuation at a controlled level, Reference [24] and IEC [25] argues that the energy capacity share of WEC technologies is limited to max. 30% of the total capacity for both supply to grid and in combination with diesel generator(s). 100% energy share can be produced to resorts that are connected to a grid, as long as WEC system capacity is below 30% of the grid supply capacity. This issue of power stability is the foundation for the need of a complementary energy source, and sets the limitation of 30% of total capacity share for wave energy.
To cater for this intermittency, and raise the level of energy predictability, a possible solution is to implement energy storage, where battery storage is considered to be the most viable option for renewable technologies [26]. As suggested by Passey et al. [23] and Weitemeyer et al. [27], batteries can be used to regulate power output, both enhancing output stability and predictability.
Another possible solution to cater for this intermittency is to have moderators that can vary their demand according to the power output of the WEC system. As suggested by Peterson [9], implementing WEC technology with a desalination system is a possible way of doing this. By regulating the energy output of the desalination system, one can increase the WEC energy share without causing stability problems.
Distance from shore. For large wind-farms, electrical infrastructure costs can represent up to 20% of the total CAPEX, and the same is expected for large wave farms [28]. For small-scale WEC installations, this can be expected to be even higher. Procurement and installation of umbilical cabling make up a big percentage of the electrical infrastructure cost. Cable-cost scales linear with distance from shore, making it one of the decisive factors for viability.
Dalton et al. [29] suggests a cable cost (including installation) of 998k €/km for rock covered, 20 kV, 0.25–7 MW cable. Small off-grid installations are assumed to only need 10 kV cable, so price is down-rated from 20 kV to 10 kV by a factor of 1.05, as suggested by [28]. Dalton et al. [29] also considers rock coverage required for the first km from shore. Trenched or un-trenched cable installation is considerably cheaper than rock covered (288k and 159k €/km, respectively), and can be an alternative after the first km of rock coverage. Dalton [3] found a variation in cable costs between 0.3 and 1.3M €/km, which indicates that these numbers are in line with the norm. This is a fixed cost, so having more WECs will cause a lower LCOE contribution from the umbilical cable. Figure 7 shows LCOE-contribution from umbilical cable for different farm-sizes as function of distance from shore, using a combination of rock-covered and trenched cable installation.
Distance from shore also influences installation, mooring, and operation and maintenance (O&M) costs, all of which are expected to increase with further distance from shore. However, umbilical cable cost is the major contributor and driver of cost as a function of distance from shore.
In total, this makes off-grid applications vulnerable to costs infused by distance from shore. This indicates that off-grid commercialization should be focused towards locations where deployment close to shore is a possibility, as this significantly increases the viability from a LCOE perspective.
Bathymetry influences many cost factors in the LCOE. Deep water makes mooring, installation, electrical infrastructure, and O&M costly. As small projects are sensitive to these costs, it is recommended to constrain the water depth to as shallow as possible. In most cases, this will also mean that the WECs will be situated closer to shore, decreasing umbilical cable cost.
Supply chain logistics are viewed as all the logistical activities (i.e., movement and storage of finished goods and equipment) downstream the delivery from WEC developer, to decommissioning of goods and equipment at place of deployment.
The size and weight of the WECs presents challenges for the supply chain logistics, as well as infrastructure needs for off-grid transportation, installation, O&M, and decommissioning. Challenges related to supply chain logistics increases with the distance between point of distribution and the location the WEC system is commercialized. In addition, accessibility to place of deployment also plays a role in logistical challenges.
It is evident that simple logistical processes increase viability for commercialization. For off-grid projects, logistics can quickly add significant costs. In this paper, installation and O&M include these costs.
The industry standard for installation cost of WECs is between 4% and 15% of total project cost [30,31]. For large wave farms, this is expected to be closer towards the lower end (4%) of this variation. The upper end (15%) is assumed for off-grid projects, due to the relatively few WEC units and the often remote locations.
Annual O&M cost for WEC farms are assumed to be between 4% and 8% of WEC CAPEX [30,31]. For the same reasons as installation, the upper end (8%) is assumed for O&M in off-grid locations.
Most WECs are not specifically designed for off-grid applications. This means that e.g., maintenance work will require cranes, skids, and special equipment, which might not be available at all locations. This also adds challenges in storing and maintaining the needed equipment. Cost of maintenance-equipment compared to total system cost may therefore become large. Maintenance for off-grid applications will have to be investigated thoroughly, as the equipment needs and costs can have a potentially large impact on the off-grid viability.
Qualified local personnel are also likely to be required, as it is probably not viable to bring service personnel in from the WEC developer for each intervention, due to the increased response time and travel costs. This can be a challenge in early commercialization, as WECs are technically advanced units and needs special competence to maintain.

3.1.2. PESTEL

In order to get a broader understanding of viability, PESTEL is used to analyze the environment surrounding the specified WEC systems.
Political factors arguably influence the viability of small utilities more than luxury resorts. Small utilities are more likely to be dependent on the support and acceptance from a governmental level, than privately owned resorts.
Regardless of small utilities or luxury resorts, targeting nations with high RE ambitions is recommended, as the governmental incentives for implementing RE will be higher, and investors can reap benefits (e.g., tax reductions) from investing in RE. Ambitious RE goals are often the case for many island communities, as most of their current energy comes from fossil fuel.
Political stability can be a risk when assessing viability. This is especially the case with WEC integration to small utilities, where WEC developer and customer highly depend on the government’s ability to facilitate for RE. Governmental stability also affects investors’ and banks’ willingness to invest in renewable projects.
Economical. An important viability-factor for wave energy is the use of feed-in tariffs (FIT). A FIT is a governmental incentive that ensures a premium fixed price for energy generated to the grid, making calculations of viability more predictable. FITs can raise a customer’s willingness to invest in WEC systems, as a fixed price for energy generation is given, which increases the financial predictability. Most countries however, do not have set FITs for wave energy at this point. Note that FIT is only applicable for grid-connected WEC systems, and does not play a role for direct connection to a luxury resort.
For a wave farm that is configured to deliver electricity directly to a resort, the resort’s customers are indirectly the ones that have to pay for the resorts’ expenses, there amongst expenses for a WEC system. Dalton et al. [32] found that half of resort guests are willing to pay between 1% and 5% more if resorts have taken measures to be environmentally friendly. This can be an incentive for resorts to invest in wave energy.
Numerous global economic factors can also impact the viability. Exchange rates, taxes, labor costs, and other tariffs, are some examples. Such economic factors are not specific for off-grid wave energy, and therefore not looked further into in this paper.
Social. Any WEC installation needs acceptance from the local society to be viable. Social acceptance for marine energy is closely linked to the level of stakeholder involvement and public perception of the RE [33]. Renewable energy itself does not make individuals and/or groups oppose deployment, but rather the characteristics of the technology and the location of installation [33].
Due to noise and visual impacts, opposition against WECs are consistent with proximity to nearby stakeholders. This is supported by Clément et al. [34] and Stefanovich et al. [35], arguing for an increased risk of “Not In My Back Yard”-syndrome (NIMBY) as proximity decreases. NIMBY-syndrome leads to a slower process of technology adaptation, which can stagnate, or potentially hinder, WEC deployment. However, this is a location-specific problem, as NIMBY-syndrome depends on public perception of wave energy in different markets. With thoughtful placement in agreement with relevant stakeholders, WECs may instead contribute to positive public relations, and a way for luxury resorts and/or off-grid utilities to display their willingness to embrace sustainable technologies. The increased public opposition of installing close to shore must be seen in relation to the reduced monetary cost of having the WEC(s) closer to shore.
WEC farm size is also likely to correlate with public opposition. Installing a larger farm will cause a stronger NIMBY-syndrome than a small farm, regardless of the positive outcomes of green energy production.
Technological aspects for the PESTEL analysis are covered in the LCOE modelling.
Environmental. WEC installation usually requires some level of Environmental Impact Assessment (EIA). EIA is used with the purpose of ascertain the effects projects have on the natural environment, species, biological and physical processes [36]. There are still many uncertainties for EIAs, as the long-term environmental effects of WEC deployment are unknown [37]. This increases the risk of EIA being time consuming and costly, and could potentially hinder commercialization of RE technologies [37,38]. This view is supported by Bonar et al. [33], advocating that the greatest barrier to marine energy deployment is the overwhelming lack of certainty in ecological impact assessment.
Legal. Securing the proper licenses and permits is vital for any WEC project. Legal factors can be unpredictable, especially in countries that have limited knowledge and experience with marine energy.
Some countries have established simplified processes for deploying REs. Countries like Denmark and UK have set up “one stop-shops” for licensing and approval of RE, while Ireland, Portugal and USA have set up simplified rules [3]. This streamlines the licensing process by limiting the number of instances required for acquiring operational permits. Simplified processes are however not common practice, so every location has to be individually evaluated on licensing risks and bureaucratic barriers to commercialization. This includes licenses for deploying the WEC system in the ocean as well as eventual grid-connection(s).

3.1.3. P5F

P5F is used to describe competitive threatening forces towards the WEC system in the industry of interest.
Entrants. As no unsubsidized WEC system has yet been commercialized, the barriers for entrants are proven to be high in this industry. Large research- and development costs, need for economy of scale, long testing periods, and unproved technology are some of the reasons for these high entrant barriers. This implies a low threat from entrants, meaning that if a WEC solution can get proper foothold in the market, the threat from new entrant companies will be low.
Substitutes are a big threat for the viability of the WEC system. There are numerous renewable and non-renewable alternatives to off-grid wave energy, and many of them are proven technologies with lower initial investment costs and infrastructure needs. The most common substitutes for wave energy in off-grid locations are fossil fuel generators, PV and wind energy.
Substitutes with low LCOE are a big threat. As LCOE is location dependent, the comparative costs are important to assess competitiveness. WEC systems will not have lower LCOE than substitutes everywhere in the world, but in some places WEC LCOE may be lower than for example PV.
LCOE figures alone do not govern competitiveness. Locations where the system has the least negative impact on social and environmental factors compared to substitutes, will also increase competitiveness. For example, wave energy is considered less prone to public opposition than land-based RE, such as wind farms [39]. This increases viability of WEC commercialization compared to some substitutive technologies.
Identifying that the viability of WECs increases where the substitutes have disadvantages, implies not to only consider commercialization where the WEC system would perform best, but where it performs best relative to threatening substitutes.
Some business cases enable multiple RE-technologies to co-exist without stealing each other’s market shares. This is because they have different output characteristics, thus providing the customer with more stable power supply. To reach high levels of RE and still maintain power stability, it is a big advantage for small utilities and luxury resorts to have multiple sources of RE with non-correlating output characteristics. This will reduce the need for fossil fuels or energy storage to stabilize output, and lowers the threat from substitutes. The WEC system can therefore be a viable option, even if it ends up having a higher LCOE than e.g., PV and wind energy. In order to reach larger shares of RE and maintain a stable power supply, IRENA [40] argues that multiple RE sources must be implemented.
The predictability of power production for WECs is 32%–46% higher than for wind turbines [41]. This can increase the viability of commercializing the WEC system, relative to substitutes.
Customers. Supplying power to a small utility requires cooperation and an agreement with energy providing companies. Supplying energy for an independent resort only requires a deal with that resort, and possible license for allowing installation in the ocean. Dealing with a private customer like a resort can result in far less bureaucratic processes. Large resort chains are also likely to have more capital for investments than local governments in off-grid locations.
Suppliers are not considered to be a significant threat to viability. WECs are not dependent on single suppliers, and suppliers generally pose little threat of vertical integration. The WEC system generally make use of standard components. However, many components are tailor-made for the WEC system, which may create lock-in effects between WEC developer and suppliers of these components. This lock-in effect raises the suppliers’ bargaining power.
Rivals. The WEC system defined in Section 1.2 is differentiated, in terms of being designed with high-end technology and high efficiency, compared to many competitors. For off-grid applications, differentiation can become a problem, as off-grid customers might be looking for a simpler solution and smaller investment for providing wave energy electricity. There are WEC developers that strategically aim for off-grid locations with smaller units to reduce cost of logistics and O&M. These units are typically custom made to fit inside standardized transportation goods, such as ship containers. This is especially an advantage in areas with less rigid infrastructure, where supply chain logistics is an issue.
The differentiated WEC unit can most likely be deployed in more severe sea conditions then some of the other units aimed towards off-grid solutions, as advanced technology increases survivability in storms.
The market for wave energy is unsaturated, as no WECs have yet been commercialized without subsidies. This lowers the threat from rivals, as there is room for many different WEC designs in the market, given they can compete with substitutes.

3.2. Case Discussion

The case studies look at implementing CPO’s WEC system in three different locations: A small utility at Bora Bora (French Polynesia), an arbitrary resort in the Maldives, and Club La Santa Sports Hotel in Lanzarote (Spain). Bora Bora and the Maldives were chosen based on recommendation from CPO’s previous research [8]. Deciding factors for these locations are wave resource, current cost of energy, and electricity demand, see Table 1. Lanzarote is chosen due to its history with ocean energy, and the infrastructure at Lanzarote is more developed than the other cases. All cases have different technical and non-technical characteristics, capturing a diversity of factors to take into consideration. For an actual WEC deployment in these locations, WECs with different capacities would be evaluated for each location to optimize performance. For the sake of comparison and simplification are all locations analyzed with the same WEC.
The business case on the Maldives is assessed both with and without a storage solution. A resort in The Maldives has the lowest energy demand of all cases, so it is estimated that this is where a storage solution will have the biggest impact on power stability. Storage is not considered for the two other locations in this paper.

3.2.1. LCOE

Available wave resource. Data used for the Maldives and Bora Bora is gathered from [8]. Nilsson [8] obtained the data from pinpointing the location on a worldwide wave resource map. If these two locations were to be further looked into, a more accurate method for gathering wave data is needed. An interval of 20–30 kW/m is also too inaccurate, as the difference between 20 and 30 kW/m has a large impact on the LCOE, as exemplified in Figure 6. For further business case assessment, it becomes imperative to have accurate and credible wave data to determine viability. Data collected for Lanzarote is more accurate, as wave resource levels specific to this location has been calculated in [42].
In addition to large global differences, available wave resource also has a large variation on a local level. Wave direction, currents, and bathymetry can heavily influence the available wave resource at a specific location. WECs placed close to shore may also be affected by reflecting waves, also influencing available wave resource. These factors affect the accuracy of the available wave resource numbers, and highlight the importance of localizing possible hotspots at each location.
Current Cost of energy. Cost of energy in island countries, like the Maldives, have a wide variation depending on the size and demand of the island. The variation in the table represents medium electricity consuming islands (1–3 GWh annually), but energy prices in the whole of Maldives vary from 261 to 681 €/MWh [43].
Current costs of energy in Bora Bora and Lanzarote are more stable, as these are larger islands with one electricity grid, compared to the many small islands driven by fossil fuel generators in the Maldives.
In all the cases, the largest contributor to current cost of energy is fossil fuel generators. Prices of fossil fuels have also gone significantly down since most of these numbers were gathered, which can affect the accuracy of these numbers.
Demand and seasonality. 73% of Bora Bora’s energy is consumed by hotels and resorts [47] (p. 96). Tourist high season is between May and October. Bora Bora has a low wave resource seasonality with a minimum monthly wave resource of 70%–80% relative to annual average [8]. The seasonality of waves peaks roughly around the same months as the tourist season. This increases the stability of the power supply, as the output better matches the demand.
Tourist season at the Maldives is between December and April, and the demand for electricity and water is higher in this period than for rest of the year. Available wave resource is highest between the period of May and September [48] with 40%–60% seasonality [8]. This results in a mismatch between supply and demand of energy, increasing the instability of the related electrical system.
The hotel at Lanzarote needs heating of two Olympic-sized swimming pools, which favors WECs instead of e.g., PV, since solar radiation is absent when the pools need heating at nighttime. Heating of swimming pools can also be used as an energy moderator. Increased heating of the hotel and pools during winter season also correlates well with increased wave resources at Lanzarote during the winter.
Table 2 shows proposed WEC configuration for the three business cases based on the input data from Table 1. It shows the Maldives both with and without battery storage, to display how the WEC system configuration differs when adding batteries.
Possible wave power. Constricted by intermittency and stability, each case has a limit how much wave power they can produce.
Bora Bora: Intermittent energy must be below 30% at all times [44]. Based on the daily load curve [44] (p. 9) and the annual demand, it is estimated that 1 MW of intermittent power never will exceed this limit.
The Maldives: 30% of the 1 MW capacity of an arbitrary resort [43].
Lanzarote: 50% of the hotel’s 1 MW demand can be provided by wave power [46].
Number of WECs. Number of WECs are chosen so the output from WEC system does not peak over the possible wave power limit, using the capacity of CPO’s WEC (250 kW).
Energy storage. It is assumed that a resort in The Maldives could allow for installation of an additional WEC, if battery storage is added to the system. Assuming a storage equal to 24 h of the average WEC power output would solve the intermittency issue, results in an energy storage capacity of 3000 kWh (2 × 250 kW × 24 h × 0.25). Storage capacity needed to allow for an additional WEC, are best guess estimates.
Moderation through desalination could be an alternative to this battery storage. Resorts in the Maldives usually have desalination equipment already installed. Storing fresh water is cheaper than storing electricity, so this could be an option assuming the power consumption of the desalination equipment can be varied to cater for the intermittency of the WEC system output.
The Capacity factor is a product of average available wave resource and WEC size, taken from CPO’s power matrix. Due to commercial reasons, the complete power matrix is not available for review. CPO’s WEC device has a design wave resource of 30 kW/m. The estimated capacity factor becomes less accurate the further away the actual wave resource is from the design wave resource.
Distance from shore. Due to the steep pacific reef type bathymetry at Bora Bora, it is assumed that distance from shore is approx. 200 m. Assumed distances for the Maldives and Lanzarote are also best guess estimates.
Table 3 shows derived inputs from Table 2 used to calculate LCOE for all business cases.
The Maldives has a low average capacity factor, due to the low wave resource. This, in addition to few WEC units dividing the costs, results in a significantly higher LCOE than the other business cases. Lanzarote’s LCOE is lower than Bora Bora’s due to the increased wave resource, even though there are more WEC’s at Bora Bora.
Compared to their respective current cost of energy, Bora Bora has greater financial opportunities for wave energy than the other cases, even though they are all at a higher LCOE than the current cost of energy.
Table 4 shows estimated capacity and costs for adding battery storage at the Maldives.
The LCOE calculations show a slightly lower LCOE with added storage and one additional WEC. Economy of scale earned by adding one additional unit compensates for the cost of adding battery storage. The option with storage will however require a larger initial investment, possibly making the WEC solution a harder product to sell. Cost of storage can vary significantly from case to case, depending on capacity, output, and storage solution, in addition to many other factors described by IRENA [26].
Numbers are largely based on industry standards and estimates, due to limited experience data. Calculations in Table 3 are scaled from a WEC farm calculation, based on 40 units installed. The factors marked with a percentage are not scaled linearly, but rather kept the percentage of total costs. Other costs are, for simplicity reasons, scaled by WEC number. Not all these costs are likely to scale exactly in such a way, as many of these are likely to gain some sort of economy of scale.
Other external factors also affect costs, such as raw material costs for umbilical cables, and exchange rates. Calculations on such costs should be performed when assessing costs for specific business cases.
Discount rate is set to 8%. Variation in discount rate can have a large impact on the LCOE, as argued by [50]. Calculations should be revisited if other discount-rates are applicable.
Evaluation of method. Using LCOE as a tool for assessing factors impacting viability works well, as there is a clear correlation between viability of commercialization and LCOE. The LCOE-breakdown, sets focus on the critical factors with the biggest influence on LCOE and how these can be managed for potential cost reductions or performance enhancements, increasing the viability.
However, LCOE needs copious amounts of information to produce accurate results. As no commercialized WEC systems exist yet, there is limited information available for the cost of different factors and with limited transferability to off-grid applications. This limits the possibility to calculate LCOE accurately for any off-grid application or location at such an early phase. Judging from the large differences in LCOE between cases, even calculations based on limited information can give valuable economic insight.
Although the uncertainties have had an impact on the accuracy of the LCOE for each case study, it allows identification of where the major unknowns and uncertainties of different costs are located.

3.2.2. P5F

In addition to diesel generators, there are substitutive sources of RE present at all the cases. PV is the largest substitutive threat at Bora Bora, with an energy share of 2.5% [44]. However, land space is limited, and expansion of PV will negatively impact esthetics, which is bad for tourism. LCOE for PV in Bora Bora was 670 $/MWh in 2012 [44], but PV installed in 2016 are expected to be around 420 $/MWh [47]. FIT for PV in French Polynesia is 470 $/MWh [51]. From a resource point of view, wind energy is a plausible substitute. However, due to failed project of a windmill farm in Tahiti in the late 2000s, important governmental stakeholder can be expected to be skeptical to wind as a source of energy.
The aggressive RE goals for 2020 (50% RE-share) and 2030 (100% RE-share) in French Polynesia are expected to decrease the threat of diesel generators. A possible threat is Sea Water Air Conditioning (SWAC), which has been successfully been implemented at Thalasso Spa Resort at Bora Bora, at an LCOE between 40 and 70 $/MWh ([52], p. 48). However, SWAC is not an energy producing technology, but rather an energy saving technology. SWAC is used as a heat exchanger for air-conditioning systems, which can stand for up to 50% of the total energy consumption of resorts in tropical climates [52] (p. 6). The capability for SWAC to substitute WECs is considered to be somewhat limited, but might threaten WEC technology by lowering the demand for energy, negating the potential for economies of scale.
The resorts islands in the Maldives have scarce land areas, with some luxury resorts even mounted to pillars in the sea. This reduces the threat of generating energy from PV, as the available land area is typically used for other necessities. On the greater capital island (Malè), LCOE of PV is estimated to be 230 $/MWh, and 350 $/MWh at smaller islands [43]. An alternative could be floating PV [53]. Although technically feasible, we question the financial viability at due to higher anticipated cost than land-based PV and far lower energy density than WEC systems. Wind energy is also considered feasible, but due to the low demand of 0.5 MW average, and noise and visual impacts, it is not considered a large threat for a luxury resort at the Maldives. Islands in the Maldives are at most 2 m above sea level, which increases the visual impact of windmills. As the WEC LCOE is significantly higher than both current cost of energy and substitutes at the Maldives, WECs would have to rely on these opportunities for a viable commercialization.
On the North side of Lanzarote, where Club La Santa Sports Hotel is located, cloudy weather lowers the viability for PV. Wind energy is also not particularly suitable due to rapid shifting wind directions. The largest threat of substitutes is the grid power originating from fossil-fueled generators.
In terms of supply chain logistics, Lanzarote is more accessible than Bora Bora and the Maldives, which reduces transportation costs and challenges related to transportation. Lanzarote also has a higher level of infrastructure and more technical skilled labor, which would have a positive influence on WEC system interventions and logistics. Labor costs are however likely to correlate with increased infrastructure and technical skilled labor.
Prices for PV in Bora Bora are quite high compared to the other locations. This might indicate increased costs due to low level of infrastructure and challenging supply chain logistics, as Bora Bora is more remote than the other locations, especially compared to Lanzarote. These costs might also impact a WEC installation, possibly raising the LCOE. Still, high costs for the substitutes indicate that there is a possibility of making RE at competitive prices if the challenges are effectively dealt with.
Rivals with smaller WEC solution that have less issues with supply chain logistics may be a threat in the Maldives and Bora Bora. Lanzarote has a higher level of infrastructure, which lowers the threat from these rivals.
Evaluation of method. For viability of commercialization, strategic positioning relative to competitors (i.e., substitutes, rivals, and entrants) is critical. P5F-analysis helps identify competitive aspects not identified in other tools, by focusing on competitors and substitutes instead of having tunnel vison on wave energy.
The assumption in P5F that resources and capabilities cannot be used for competitive advantage is, to some extent, the case with mature industries. However, it does not fit as well with new or emerging industries, like the wave energy industry. Combining the conclusion from Karniouchina et al. [54], that the environment is the most dynamic in infant industries and the argument from Schilke [55], that dynamic capabilities are important in an dynamic environment, the conclusion is that a firm’s internal capabilities have greatest performance-impacts when an industry is at an early stage of its life-cycle. A resource base theory approach (analyzing WEC developer’s internal resources and capabilities) could arguably be a valuable addition to P5F for assessing competitiveness.

3.2.3. PESTEL

Bora Bora’s economy is driven by tourism and fishing, making tourists and fishermen important stakeholders for social acceptance. The Maldives is in a similar situation with over 40% of their economy driven by tourism, followed by commercial fishing. For these locations, conflicts with tourism and commercial fishing must be avoided for a commercialization to be viable.
WECs would be located within line of sight from shore for all business cases, resulting in an increased risk of the “Not In My Back Yard” (NIMBY) syndrome. Guests at the Club La Santa Sports Hotel do however, vacate because of the sporting activities available at the hotel. This is likely to limit the social impact of the WECs on this location, because they are not as affected as the sunbathing tourist.
In the Maldives, the system of EIA and obtaining operational licenses are insufficient, and may therefore pose risk in the task of commercialization [56]. The situation is similar in Bora Bora, where there is little experience with EIA and obtaining licenses. Due to Spain’s history of being one of the main driving countries for RE (thereof marine REs), environmental impact assessment is more standardized than for the other two cases. Procedures and necessary documentation for EIA in marine energy exists, resulting in a more predictable set of requirements that needs to be met. A possible downside is the risk of having large amounts of “red rape”, where bureaucratic processes may slow down commercialization process, as exemplified by Chozas [2] (p. 29). This may also be applicable for legal hinders in obtaining operating licenses for Club La Santa Sports Hotel.
The RE-share goal for Maldives is to reach 30% within 2020. This is a significant reduction from the previously communicated aim for carbon neutrality and 100% renewable electricity by 2020 [57]. Malone [58] argues that local banks and investors are hesitant of investing in renewable projects due to the political instabilities, which consequently lowers the attractiveness for developers of renewable technologies.
French Polynesia is also in an unpredictable political situation, with 11 leadership changes the last decade [59]. Reaching their goal of 50% RE by 2020, from present RE share of 26% in 2014 [60] (p. 12), is highly uncertain due to limited political stability.
Spain had very lucrative FITs for RE up until 2012. After this, FITs were completely brought to a halt, due to an immense financial deficit caused partly by this incentive [61]. Business potential for renewables went from being very promising, to being an unreasonable option, proving that economic factors can change rapidly, even from a governmental level in an EU country. Today, no FIT for wave energy is established by Spain’s government. This is also the case for the Maldives and Bora Bora.
Evaluation of method. PESTEL is found to be a useful tool for assessing viability, as it takes many of the “soft” factors into considerations that LCOE does not cover. Where PESTEL works as a great tool to identify “soft” factors, answering how factors should be dealt with is not the primary function, and limits using PESTEL to analyze environments. Identifying these soft-factors are however an important step on the way to knowing how to deal with them.

3.2.4. Cases

The cases served the purpose of setting the analysis into a real-life context. This functioned well to exemplify and make a clearer message with which factors affect off-grid viability. Using examples clearly shows how these factors cause a difference in viability between cases.
All the chosen cases are islands in tropical climates where tourism is a major part of the economy, and many of the critical factors found are influenced by this. Transferability of critical factors to other cases with different characteristics might be limited.
Using three different tools helps showing off-grid viability from different perspectives, covering both technical and non-technical factors. Combining this with case studies provides a framework where it is easy to see the real-life impacts.
The wave energy industry is at an infant stage, even though wave energy technology has been developed over several decades. This causes the environment to be more dynamic than in matured industries [54]. The dynamic environment affects the lifetime of the results of the methods used, as the environment may have changed between the time when the analysis was made and the time deployment commences. Transferability and reuse of the analysis may therefore be limited. However, critical factors found can be transferred and/or used as starting points for evaluation of viability in other business cases.
Factors for viability in off-grid business cases are summarized in Table 5 below. Assessment of the factors in each of the case-locations are evaluated.
The LCOE of CPO’s WEC system compared to current cost of energy shows the financial viability. Calculated LCOE for the business cases show a large variation from case to case, as shown in Table 3.

4. Conclusions

This paper shows critical factors that influence the viability of off-grid commercialization of a WEC system in small utilities and luxury resorts. These factors are found by modelling Levelized Cost of Energy, and through a PESTEL and a P5F analysis. These factors are applied to three case studies, to see how they impact these potential business cases. This identified a large variety of factors affecting viability, both technical and non-technical.
The relative importance of each factor somewhat differs from case to case. Some factors do however seem to have a larger general impact than others. Available wave resource, power demand, supply chain logistics and alternative energy sources all have large impacts regardless of case. Low available wave resource will raise the LCOE of any project above the level of viability. Same goes for projects where the power demand is not high enough to provide any economy of scale with several WECs. Challenging supply chain logistics can be costly for off-grid projects, as the projects are in general not large enough to justify large investments in an efficient supply chain. Some areas have cheap alternative energy (e.g., areas with hydropower, or large PV installations), significantly decreasing the viability of wave energy. These are factors that by themselves can have the potential to kill the viability of a wave energy project.
Calculations show that a WEC system at Bora Bora has the lowest LCOE compared to the current cost of energy. Bora Bora does however come out unfavorable compared to Lanzarote in most of the other factors assessed. The LCOEs on both Bora Bora and Lanzarote show somewhat competitive prices compared to their respective current cost of energy. The LCOE of a WEC system in the Maldives (with, and without battery storage) is roughly twice as high as the current cost of energy. Although these calculations are based on early estimates, we can conclude that there are potentially viable off-grid business cases for commercialization of off-grid WEC systems.
Wave energy technology has a low technology readiness level. Data used in this study is therefore largely based on prognoses and assumptions. Experience data used is mostly from pilot projects with governmental support. This will impact the accuracy of the results found in this paper.
LCOE, PESTEL, and P5F, are found to be good tools for assessing the viability of commercialization. Together they cover a broad specter of critical factors, minimizing the risk of important aspects not being evaluated. However, an internal analysis of the developer’s resources and capabilities through a resource based theory approach could have provided additional insight in critical factors.
An analysis contrasting differences between a grid-connected application and an off-grid application would help to build a better understanding in commercialization of wave energy converters. Factors discussed may not affect the viability of off-grid systems in exactly the same way as in grid-connected systems.

Acknowledgments

This research was funded by CorPower Ocean. CorPower Ocean were also part of designing the study, and in the decision to publish the results. Funding for publishing in open access are provided by EPSRC.

Author Contributions

Aksel Botne Sandberg, Eirik Klementsen determined research approach, reviewed literature, collected and analyzed data, wrote the paper; Jèromine Maillet provided data and domain expertise, supervised data collection; Adrian De Andres provided literature and domain expertise, guided and reviewed results and paper; Gerrit Muller (academic supervisor) provided literature and systems approach, supervised the entire research, reviewed research method, analysis, data collection, and participated in writing.

Conflicts of Interest

The authors declare no conflict of interest.

References

  1. The International Renewable Energy Agency (IRENA). Wave Energy Technology Brief. 2014. Available online: http://www.irena.org/documentdownloads/publications/wave-energy_v4_web.pdf (accessed on 1 April 2016).
  2. Chozas, J.F. Technical and Non-Technical Issues towards the Commercialisation of Wave Energy Converters; River Publishers: Aalborg Ø, Denmark, 2013. [Google Scholar]
  3. Dalton, G. Non-Technical Barriers to Wave Energy in Europe; Input to the Waveplam Project; University College Cork, HMRC: Cork, Ireland, 2009. [Google Scholar]
  4. Edenhofer, O.; Pichs-Madruga, R.; Sokona, Y. Renewable Energy Sources and Climate Change Mitigation: Special Report of the Intergovernmental Panel on Climate Change; Cambridge University Press: Cambridge, UK, 2011. [Google Scholar]
  5. Callaghan, J.; Boud, R. Future Marine Energy: Results of the Marine Energy Challenge: Cost Competitiveness and Growth of Wave and Tidal Stream Energy; Carbon Trust: London, UK, 2006. [Google Scholar]
  6. International Energy Agency (IEA). Key World Energy Statistics 2015. 2015. Available online: https://www.iea.org/publications/freepublications/publication/key-world-energy-statistics-2015.html (accessed on 22 March 2016).
  7. Magagna, D.; Uihlein, A. 2014 JRC Ocean Energy Status Report. 2014, p. 74. Available online: https://setis.ec.europa.eu/sites/default/files/reports/2014-JRC-Ocean-Energy-Status-Report.pdf (accessed on 12 February 2016).
  8. Nilsson, H. Off-Grid Market Opportunities for Wave Power Technology. Master’s Thesis, Department of Production Management, Lund University, Lund, Sweden, January 2016. [Google Scholar]
  9. Peterson, T. Multi Market Business Development Research; Marshfield Hills: Marshfield, MA, USA, 2016. [Google Scholar]
  10. Branker, K.; Pathak, M.; Pearce, J.M. A review of solar photovoltaic levelized cost of electricity. Renew. Sustain. Energy Rev. 2011, 15, 4470–4482. [Google Scholar] [CrossRef]
  11. De Andres, A.; Maillet, J.; Todalshaug, J.H.; Möller, P.; Bould, D.; Jeffrey, H. Techno-Economic Related Metrics for a Wave Energy Converters Feasibility Assessment. Sustainability 2016, 8, 1109. [Google Scholar] [CrossRef]
  12. Boussabaine, A.; Kirkham, R. Whole Life-Cycle Costing: Risk and Risk Responses; John Wiley & Sons: New York, NY, USA, 2008. [Google Scholar]
  13. Gupta, A. Environmental and pest analysis: An approach to external business environment. Merit Res. J. Art Soc. Sci. Hum. 2013, 1, 13–17. [Google Scholar]
  14. Wüstenhagen, R.; Wolsink, M.; Bürer, M.J. Social acceptance of renewable energy innovation: An introduction to the concept. Energy Policy 2007, 35, 2683–2691. [Google Scholar] [CrossRef]
  15. Porter, M.E. How Competitive Forces Shape Strategy. Harv. Bus. Rev. 1979, 57, 137–145. [Google Scholar]
  16. Woodside, A.G. Case Study Research: Theory, Methods and Practice: Theory, Methods, Practice; Emerald Group Publishing: Bingley, UK, 2010. [Google Scholar]
  17. Yin, R. Case Study Research: Design and Methods; Sage Publishing: Beverly Hills, CA, USA, 1994. [Google Scholar]
  18. Frazerhurst, J. Determination of Optimum Wave Power Sites in New Zealand by Analysis of the Coastline, Continental Shelf and Wave Climate; Wavegen, ASR: Inverness, UK, 2006. [Google Scholar]
  19. Dalton, G.; Allan, G.; Beaumont, N.; Georgakaki, A.; Hacking, N.; Hooper, T.; Kerr, S.; O’Hagan, A.M.; Reilly, K.; Ricci, P.; et al. Economic and socio-economic assessment methods for ocean renewable energy: Public and private perspectives. Renew. Sustain. Energy Rev. 2015, 45, 850–878. [Google Scholar] [CrossRef]
  20. Gonçalves, M.; Martinho, P.; Soares, C.G. Assessment of wave energy in the Canary Islands. Renew. Energy 2014, 68, 774–784. [Google Scholar] [CrossRef]
  21. Iglesias, G.; Carballo, R. Choosing the site for the first wave farm in a region: A case study in the Galician Southwest (Spain). Energy 2011, 36, 5525–5531. [Google Scholar] [CrossRef]
  22. Khan, J.; Bhuyan, G.; Moshref, A. Potential Opportunities and Differences Associated with Integration of Ocean Wave and Marine Current Energy Plants in Comparison to Wind Energy; Final Annex III Technical Report—2009-IEA-OES Document; Ocean Energy Systems: Lisbon, Portugal, 2009; p. 64. [Google Scholar]
  23. Passey, R.; Spooner, T.; MacGill, I.; Watt, M.; Syngellakis, K. The potential impacts of grid-connected distributed generation and how to address them: A review of technical and non-technical factors. Energy Policy 2011, 39, 6280–6290. [Google Scholar] [CrossRef]
  24. Hafemeister, D.; Kammen, D.; Levi, B.G.; Schwartz, P. Physics of Sustainable Energy II: Using Energy Efficiently and Producing It Renewably. In Proceedings of the American Institute of Physics Conference Series, Berkeley, CA, USA, 5–8 March 2011.
  25. International Electrotechnical Commission (IEC). Grid Integration of Large-Capacity Renewable Energy Sources and Use of Large-Capacity Electrical Energy Storage; White Paper; International Electrotechnical Commission: Geneva, Switzerland, 2012. [Google Scholar]
  26. The International Renewable Energy Agency (IRENA). Battery Storage for Renewables: Market Status and Technology Outlook. 2015. Available online: http://www.irena.org/menu/index.aspx?mnu=Subcat&PriMenuID=36&CatID=141&SubcatID=495 (accessed on 13 March 2016).
  27. Weitemeyer, S.; Kleinhans, D.; Vogt, T.; Agert, C. Integration of Renewable Energy Sources in future power systems: The role of storage. Renew. Energy 2015, 75, 14–20. [Google Scholar] [CrossRef]
  28. Sharkey, F.; Bannon, E.; Conlon, M.; Gaughan, K. Maximising value of electrical networks for wave energy converter arrays. Int. J. Mar. Energy 2013, 1, 55–69. [Google Scholar] [CrossRef]
  29. Dalton, G.; Lewis, T.; O’Connor, M. Impact of inter-annual resource data variability on techno-economic performance of the WaveStar and Pelamis P1. In Proceedings of the 2012 4th International Conference of Ocean Energy, Dublin, Ireland, 17–19 October 2012.
  30. O’Connor, M.; Lewis, T.; Dalton, G. Operational expenditure costs for wave energy projects and impacts on financial returns. Renew. Energy 2013, 50, 1119–1131. [Google Scholar] [CrossRef]
  31. Guanche, R.; de Andrés, A.D.; Simal, P.D.; Vidal, C.; Losada, I.J. Uncertainty analysis of wave energy farms financial indicators. Renew. Energy 2014, 68, 570–580. [Google Scholar] [CrossRef]
  32. Dalton, G.; Lockington, D.; Baldock, T. A survey of tourist attitudes to renewable energy supply in Australian hotel accommodation. Renew. Energy 2008, 33, 2174–2185. [Google Scholar] [CrossRef]
  33. Bonar, P.A.; Bryden, I.G.; Borthwick, A.G. Social and ecological impacts of marine energy development. Renew. Sustain. Energy Rev. 2015, 47, 486–495. [Google Scholar] [CrossRef]
  34. Clément, A.; McCullen, P.; Falcão, A.; Fiorentino, A.; Gardner, F.; Hammarlund, K.; Lemonis, G.; Lewis, T.; Nielsen, K.; Petroncini, S.; et al. Wave energy in Europe: Current status and perspectives. Renew. Sustain. Energy Rev. 2002, 6, 405–431. [Google Scholar] [CrossRef]
  35. Stefanovich, M.; Chozas, J.F. Toward best practices for public acceptability in wave energy: Issues developers need to address. In Proceedings of the ICOE 2010 3rd International Conference on Ocean Energy, Bilbao, Spain, 6–8 October 2010.
  36. Leeney, R.H.; Greaves, D.; Conley, D.; O’Hagan, A.M. Environmental Impact Assessments for wave energy developments—Learning from existing activities and informing future research priorities. Ocean Coast. Manag. 2014, 99, 14–22. [Google Scholar] [CrossRef]
  37. Margheritini, L.; Hansen, A.M.; Frigaard, P. A method for EIA scoping of wave energy converters—Based on classification of the used technology. Environ. Impact Assess. Rev. 2012, 32, 33–44. [Google Scholar] [CrossRef]
  38. Azzellino, A.; Conley, D.; Vicinanza, D.; Kofoed, J.P. Marine renewable energies: Perspectives and implications for marine ecosystems. Sci. World J. 2013. [Google Scholar] [CrossRef] [PubMed]
  39. Bailey, I.; West, J.; Whitehead, I. Out of sight but not out of mind? Public perceptions of wave energy. J. Environ. Policy Plan. 2011, 13, 139–157. [Google Scholar] [CrossRef]
  40. The International Renewable Energy Agency (IRENA). Renewable Energy Integration in Power Grids. 2015. Available online: http://www.irena.org/DocumentDownloads/Publications/IRENA-ETSAP_Tech_Brief_Power_Grid_Integration_2015.pdf (accessed on 2 March 2016).
  41. Chozas, J.F.; Kofoed, J.P.; Sørensen, H.C. Predictability and Variability of Wave and Wind; Department of Civil Engineering, Aalborg University: Aalborg, Denmark, 2013. [Google Scholar]
  42. Sierra, J.; González-Marco, D.; Sospedra, J.; Gironella, X.; Mösso, C.; Sánchez-Arcilla, A. Wave energy resource assessment in Lanzarote (Spain). Renew. Energy 2013, 55, 480–489. [Google Scholar] [CrossRef]
  43. Ministry of Environment and Energy. Maldives SREP Investment Plan; Ministry of Environment and Energy: Athens, Greece, 2012. Available online: https://www-cif.climateinvestmentfunds.org/sites/default/files/meeting-documents/srep_5_maldives_0_0.pdf (accessed on 26 March 2016).
  44. Foo, M.C. From Fuel Based Electricity to Renewable Energy. 2012. Available online: http://www.pecc.org/resources/minerals-a-energy/1826-from-fuel-based-electricity-to-renewable-energy/file (accessed on 5 January 2016).
  45. Otto, S.D.; Bevacqua, M.; Ferràn, F. Energy (R)evolution for the Canary Islands. 2015. Available online: http://www.dlr.de/dlr/Portaldata/1/Resources/documents/2015/Energy_R_evolution_CanaryIslands_ExecutiveSummary_EN.pdf (accessed on 22 January 2016).
  46. Renvall, M. Norway’s Langlee Inks Wave Power Agreement with Spain’s Tenerife Island. 2014. Available online: http://www.nordicgreen.net/startups/article/norway-s-langlee-inks-wave-power-agreement-spain-s-tenerife-island (accessed on 17 March 2016).
  47. Blac, J.; Bitot, S. Schéma Directeur des Energies Renouvelables. Carbon 4. 2012. Available online: http://www.carbone4.com/download/polynesie/Schema_Directeur_Polynesie.pdf (acessed on 4 January 2016).
  48. Kench, P.S.; Brander, R.W.; Parnell, K.E.; McLean, R.F. Wave energy gradients across a Maldivian atoll: Implications for island geomorphology. Geomorphology 2006, 81, 1–17. [Google Scholar] [CrossRef]
  49. Naan, R. Why Energy Storage Is about to Get Big—And Cheap. Ramez Naan Energy Blog. 2015. Available online: http://rameznaam.com/2015/04/14/energy-storage-about-to-get-big-and-cheap/ (accessed on 1 December 2016).
  50. Myhr, A.; Bjerkseter, C.; Ågotnes, A.; Nygaard, T.A. Levelised cost of energy for offshore floating wind turbines in a life cycle perspective. Renew. Energy 2014, 66, 714–728. [Google Scholar] [CrossRef]
  51. Perraud, M. The Economic Challenge of Distributed Technologies for Insular Utilities. In Proceedings of the 2014 Pacific Power Association (PPA) Conference, Tahiti, French Polynesia, 10 July 2014; Available online: http://www.ppa.org.fj/wp-content/uploads/2014/07/1630-Blacktip-Consulting-Blistering-in-the-sun-v1-2-Final.pdf (accessed on 2 March 2016).
  52. The International Renewable Energy Agency (IRENA). Renewable Energy Opportunities for Island Tourism. 2014. Available online: http://www.irena.org/DocumentDownloads/Publications/IRENA_RE_Island_Tourism_report_2014.pdf (accessed on 13 March 2016).
  53. Hameed, S. Gili Lankanfushi Resort Goes Green with Floating Solar Panels. 2015. Available online: http://www.gili-lankanfushi.com/publication/a-solar-future-gili-lankanfushi-plugs-in-the-largest-floating-solar-panel-in-the-maldives/ (accessed on 19 February 2016).
  54. Karniouchina, E.V.; Carson, S.J.; Short, J.C.; Ketchen, D.J., Jr. Extending the firm vs. industry debate: Does industry life cycle stage matter? Strateg. Manag. J. 2013, 34, 1010–1018. [Google Scholar] [CrossRef]
  55. Schilke, O. On the contingent value of dynamic capabilities for competitive advantage: The nonlinear moderating effect of environmental dynamism. Strateg. Manag. J. 2014, 35, 179–203. [Google Scholar] [CrossRef]
  56. Zubair, S.; Bowen, D.; Elwin, J. Not quite paradise: Inadequacies of environmental impact assessment in the Maldives. Tour. Manag. 2011, 32, 225–234. [Google Scholar] [CrossRef]
  57. The International Renewable Energy Agency (IRENA). Renewable Energy Roadmap: The Republic of Maldives. 2015. Available online: http://www.irena.org/EventDocs/Maldives/Maldivesroadmapbackgroundreport.pdf (accessed on 1 March 2016).
  58. Malone, L. Political Instability Is Key Concern at Maldives Renewable Energy Investment Conference. 2013. Available online: http://minivannewsarchive.com/politics/participants-identify-political-instability-as-key-concern-at-maldives-renewable-energy-investment-conference-59697 (accessed on 6 April 2016).
  59. MacLellan, N. Down but Not Out in French Polynesia. 2014. Available online: http://pacificpolicy.org/2014/11/down-but-not-out-in-french-polynesia/ (accessed on 27 February 2016).
  60. Hourçourigaray, J.; Wary, D.; Bitot, S. Renewable Energy in the Pacific Islands: An Overview and Exemplary Projects. 2014. Available online: http://www.afd.fr/webdav/site/afd/shared/PUBLICATIONS/RECHERCHE/Scientifiques/Serie-grise/Energies-renouv-VA.pdf (accessed on 1 December 2016).
  61. Renewables International. Spanish Feed-in Tariffs—A Wrapup. 2013. Available online: http://www.renewablesinternational.net/spanish-feed-in-tariffs-a-wrapup/150/537/71424/ (accessed on 12 February 2016).
Figure 1. CorPower Ocean AB (CPO)’s wave energy converter (WEC) and WEC farm.
Sustainability 08 01274 g001
Figure 2. WEC farm system and connected entities.
Sustainability 08 01274 g002
Figure 3. Product flow chart of WEC system life cycle.
Sustainability 08 01274 g003
Figure 4. Theoretical framework.
Sustainability 08 01274 g004
Figure 5. Levelized Cost of Energy (LCOE) breakdown model for WEC system.
Sustainability 08 01274 g005
Figure 6. 250 kW WEC LCOE as function of average wave resource.
Sustainability 08 01274 g006
Figure 7. LCOE contribution from umbilical cable.
Sustainability 08 01274 g007
Table 1. Parameters of WEC system for business cases.
MaldivesBora Bora (French Polynesia)Sports Hotel (Lanzarote, Spain)
ApplicationLuxury resortSmall utilityLuxury resort
Average wave resource10–20 kW/m (a)20–30 kW/m (a)29 kW/m (b)
Current Cost of energy280–430 €/MWh (c)300 €/MWh (d)240 €/MWh (e)
Annual Demand4.38 GWh (f)42 GWh (d)8.76 GWh (g)
(a) [8]; (b) [42]; (c) [43]; (d) [44]; (e) [45]; (f) Calculated average is 50% of 1 MW capacity [43]; (g) [46].
Table 2. Proposed WEC configurations.
Bora BoraMaldivesMaldives w/Battery StorageLanzarote
Possible wave power1 MW0.3 MW0.5 MW0.5 MW
Number of WECs4122
Energy storage--3000 kWh-
Average capacity factor0.40.250.250.5
Availability (a)90%90%90%90%
Annual energy production3154 MWh493 MWh986 MWh1971 MWh
Percent of total demand7.5%11.3%22.5%22.5%
Distance from shore200 m500 m500 m400 m
(a) Estimated 90% availability for the WEC system [30].
Table 3. LCOE calculation based on WEC configurations.
Bora Bora (M€)Maldives (M€)Maldives w/Battery Storage (M€)Lanzarote (M€)
Device CAPEX (a)2.560.641.281.28
Moorings & anchor (a)0.520.130.260.26
On-shore grid connection (fixed)0.50.50.50.5
Cable cost (b)0.190.480.480.38
Battery storage 0.96
Spare parts (2%)0.2340.080.150.13
Siting and permits (2%)0.2340.080.150.13
GHG investigations (0.05%)0.0060.0020.0040.003
Installation cost (15%)1.750.591.170.98
Management cost (a)0.80.20.40.4
Decommissioning (a)0.80.20.40.4
O&M (8% of WEC CAPEX/year) (c)4.091.022.052.05
Total project cost11.683.927.806.51
Discount rate8%8%8%8%
Average capacity factor0.40.250.250.5
LCOE (€/MWh)310633628282
Current Cost of energy (€/MWh)300280 €–430 €240
(a) Scaled from 40-unit wave farm estimation performed by WEC developer; (b) Derived from Figure 7; (c) Based on upper level industry standards.
Table 4. Maldives w/battery storage.
Storage Capacity3000 kWh
Cost/kWh260 €/kWh (300 $/kWh) (a)
Initial cost780k €
Replacement cost180k € (b)
(a) [49]; (b) Assumed batteries being replaced after 10 years to half the cost, discounted to present value.
Table 5. Factors for viability in off-grid.
ToolFound FactorViability InfluenceBora BoraMaldivesLanzarote
LCOEAvailable wave resource−  Large available wave resource lowers the LCOE.++
Distance from shore−  LCOE increases with distance from shore.+00
Bathymetry−  LCOE increases with depth.
Power demand and energy storage−  Power stability limits number of WECs.+
−  Having more WECs decrease LCOE, due to gained economy of scale.+0
−  Energy storage allows for more WECs. +
Supply chain logistics−  Challenges with supply chain logistics increase with distance from WEC developer.0
−  Level of infrastructure is linked with supply chain Issues.0
PESTELProximity to society−  Public opposition increases with proximity.+
Interfering with marine activities−  WECs share ocean space with other activities.00+
Environmental impact assessment−  Varying and uncertain requirements for environmental assessment.0
Political stability−  Political stability influence commercialization process.00
Operational Licensing−  Uncertainties in obtaining operational licensing can cause delays or cancellations.0
Politics−  High RE goals increase wave energy viability.++0
Porter’s Five ForcesSubstitutes−  Threat-level from fossil fuel generators.0+
−  Threat-level from other Res.00+
Rivals−  Smaller and lighter WECs can have competitive advantages in remote locations.0+
Table symbol explanation: + means favorable, − is un-favorable, and 0 neither favorable nor un-favorable. Blank means that the factor has not been assessed for that location.

