Article

A Comparison of Electricity Generation System Sustainability among G20 Countries

1
School of Economics and Management, North China Electric Power University, Beijing 102206, China
2
Medical College, Hebei University, Baoding 071002, China
3
Department of Economic Management, North China Electric Power University, Baoding 071000, China
*
Author to whom correspondence should be addressed.
Sustainability 2016, 8(12), 1276; https://doi.org/10.3390/su8121276
Submission received: 24 August 2016 / Revised: 21 November 2016 / Accepted: 1 December 2016 / Published: 7 December 2016
(This article belongs to the Special Issue Sustainable Electric Power Systems Research)

Abstract

:
Planning for electricity generation systems is a very important task and should take environmental and economic factors into account. This paper reviews the existing metrics and methods in evaluating energy sustainability, and we propose a sustainability assessment index system. The input indexes include generation capacity, generation cost, and land use. The output indexes include desirable and undesirable parts. The desirable outputs are total electricity generation and job creation. The undesirable outputs are external supply risk and external costs associated with the environment and health. The super-efficiency data envelopment analysis method is used to calculate the sustainability of electricity generation systems of 23 countries from 2005 to 2014. The three input indexes and three undesirable output indexes are used as the input variables. The two desirable outputs are used as the output variables. The results show that most countries’ electricity generation sustainability values have decreasing trends. In addition, nuclear and hydro generation have positive effects. Solar, wind, and fossil fuel generation have negative effects on sustainability.

1. Introduction

Electric power usage has been growing over time. The electricity generation system is becoming an important factor in energy sources of industrialized countries. The global electricity generation installed capacity was 4114 gigawatts (GW) in 2005, which increased to 5699.36 GW in 2014. The electricity generation system of each country has a different constitution and structure, which leads to different performances in terms of electric power quality, prices, emissions, and so on. In order to improve the efficiency and sustainability of electricity generation systems, many countries have worked out corresponding measures. The Chinese government announced an ambitious plan to modulate the proportion of non-fossil fuel energy to 20% by 2030. China also plans to increase nuclear generating capacity to 58 GW with 30 GW more under construction by 2020 [1]. The U.S. has planned to modulate its electricity generation share to 39% coal, 27% natural gas, 18% nuclear, 16% renewable energy, and 1% oil and other liquids till 2035 [2]. Japan has decreased the proportion of fossil fuels in the power sector and has planned to adjusted it to 55% by 2030. India will also plan to modulate its electricity generation system to 31% coal, 19% solar PV, 16% hydro, 15% wind, 11% gas, and others [3]. However, because each country only considers its own situation when making its energy plan, their rationalities and their levels of sustainability have not been calculated and compared with other countries’ electricity generation plan.
As a result of these aforementioned circumstances, establishing an evaluation index system and a model to measure the rationality and sustainability of the electricity generation systems plays a vital role in this area of research. This paper aims to solve this problem by exploring the relationships between electricity generation systems, society, the economy, the environment, and resources. We gathered data from consultant reports and government websites. The remainder of the paper is as follows: Section 2 overviews the research literature about sustainability at present; Section 3 introduces the status of electricity generation and the developmental tendency of the world, particularly the G20 countries; Section 4 sets up the electricity generation system sustainability evaluation indexes and model; Section 5 presents the results and a discussion; Section 6 summarizes conclusions and defines research directions for future work.

2. Literature Review

Sustainable development is defined as “development that meets the needs of the present without compromising the ability of future generations to meet their own needs” [4]. Since providing an increasing amount of energy services is a necessary precondition for eradicating hunger and poverty, and even limiting the global population increase, since about three-quarters of anthropogenic emissions of CO2 are released by the energy system, since today’s energy system consumes a major share of finite fossil resources and is the single most important source of air pollution, and since securing economic productivity will not be possible without a functioning energy infrastructure and competitive energy prices, energy system sustainability evaluation research is very important. There has been considerable research conducted concerning renewable energy, micro-generation technologies, nuclear fission power, photovoltaic solar power plants, thermal power generation, wind power, biomass generation, and so on. Some published papers are shown in Table 1.
From Table 1, we find that most indexes evaluating the sustainability of energy systems come from the environment, the economy, resources, society, and security. The evaluation methods include the Analytic Hierarchy Process (AHP) method, a mathematical model and data envelopment analysis. The AHP method, developed by Saaty [16], is a user-friendly, simple, and logical multi-criteria analysis (MCA) method, but it has subjectivity, while evaluation rationality is based on the experiences of the decision-makers. A mathematical model is a description of a system using mathematical concepts and language. Here, the sustainability index is calculated with a mathematical equation with several variables. However, it is very difficult to set up the coefficients of the equation accurately. Since data envelopment analysis (DEA) was set up by Charnes et al. (1978) [17], DEA as a non-parametric approach to efficiency measurement has been widely studied and applied. DEA is fit to analyze efficiencies in systems featuring multiple inputs and outputs. Many researchers have addressed the applications of different DEA models in various ranking and efficiency measurement problems. Sustainability evaluation of an electric power generation system is known as an efficiency problem, for which DEA is commonly used method. However, the DEA method has two main disadvantages: (1) results arising from DEA are sensitive to the selection of inputs and outputs; and (2) the number of efficient firms on the frontier tends to increase with the number of input and output variables [18]. To deal with the above disadvantages, we select inputs and outputs based on sustainability theory according to previous works.

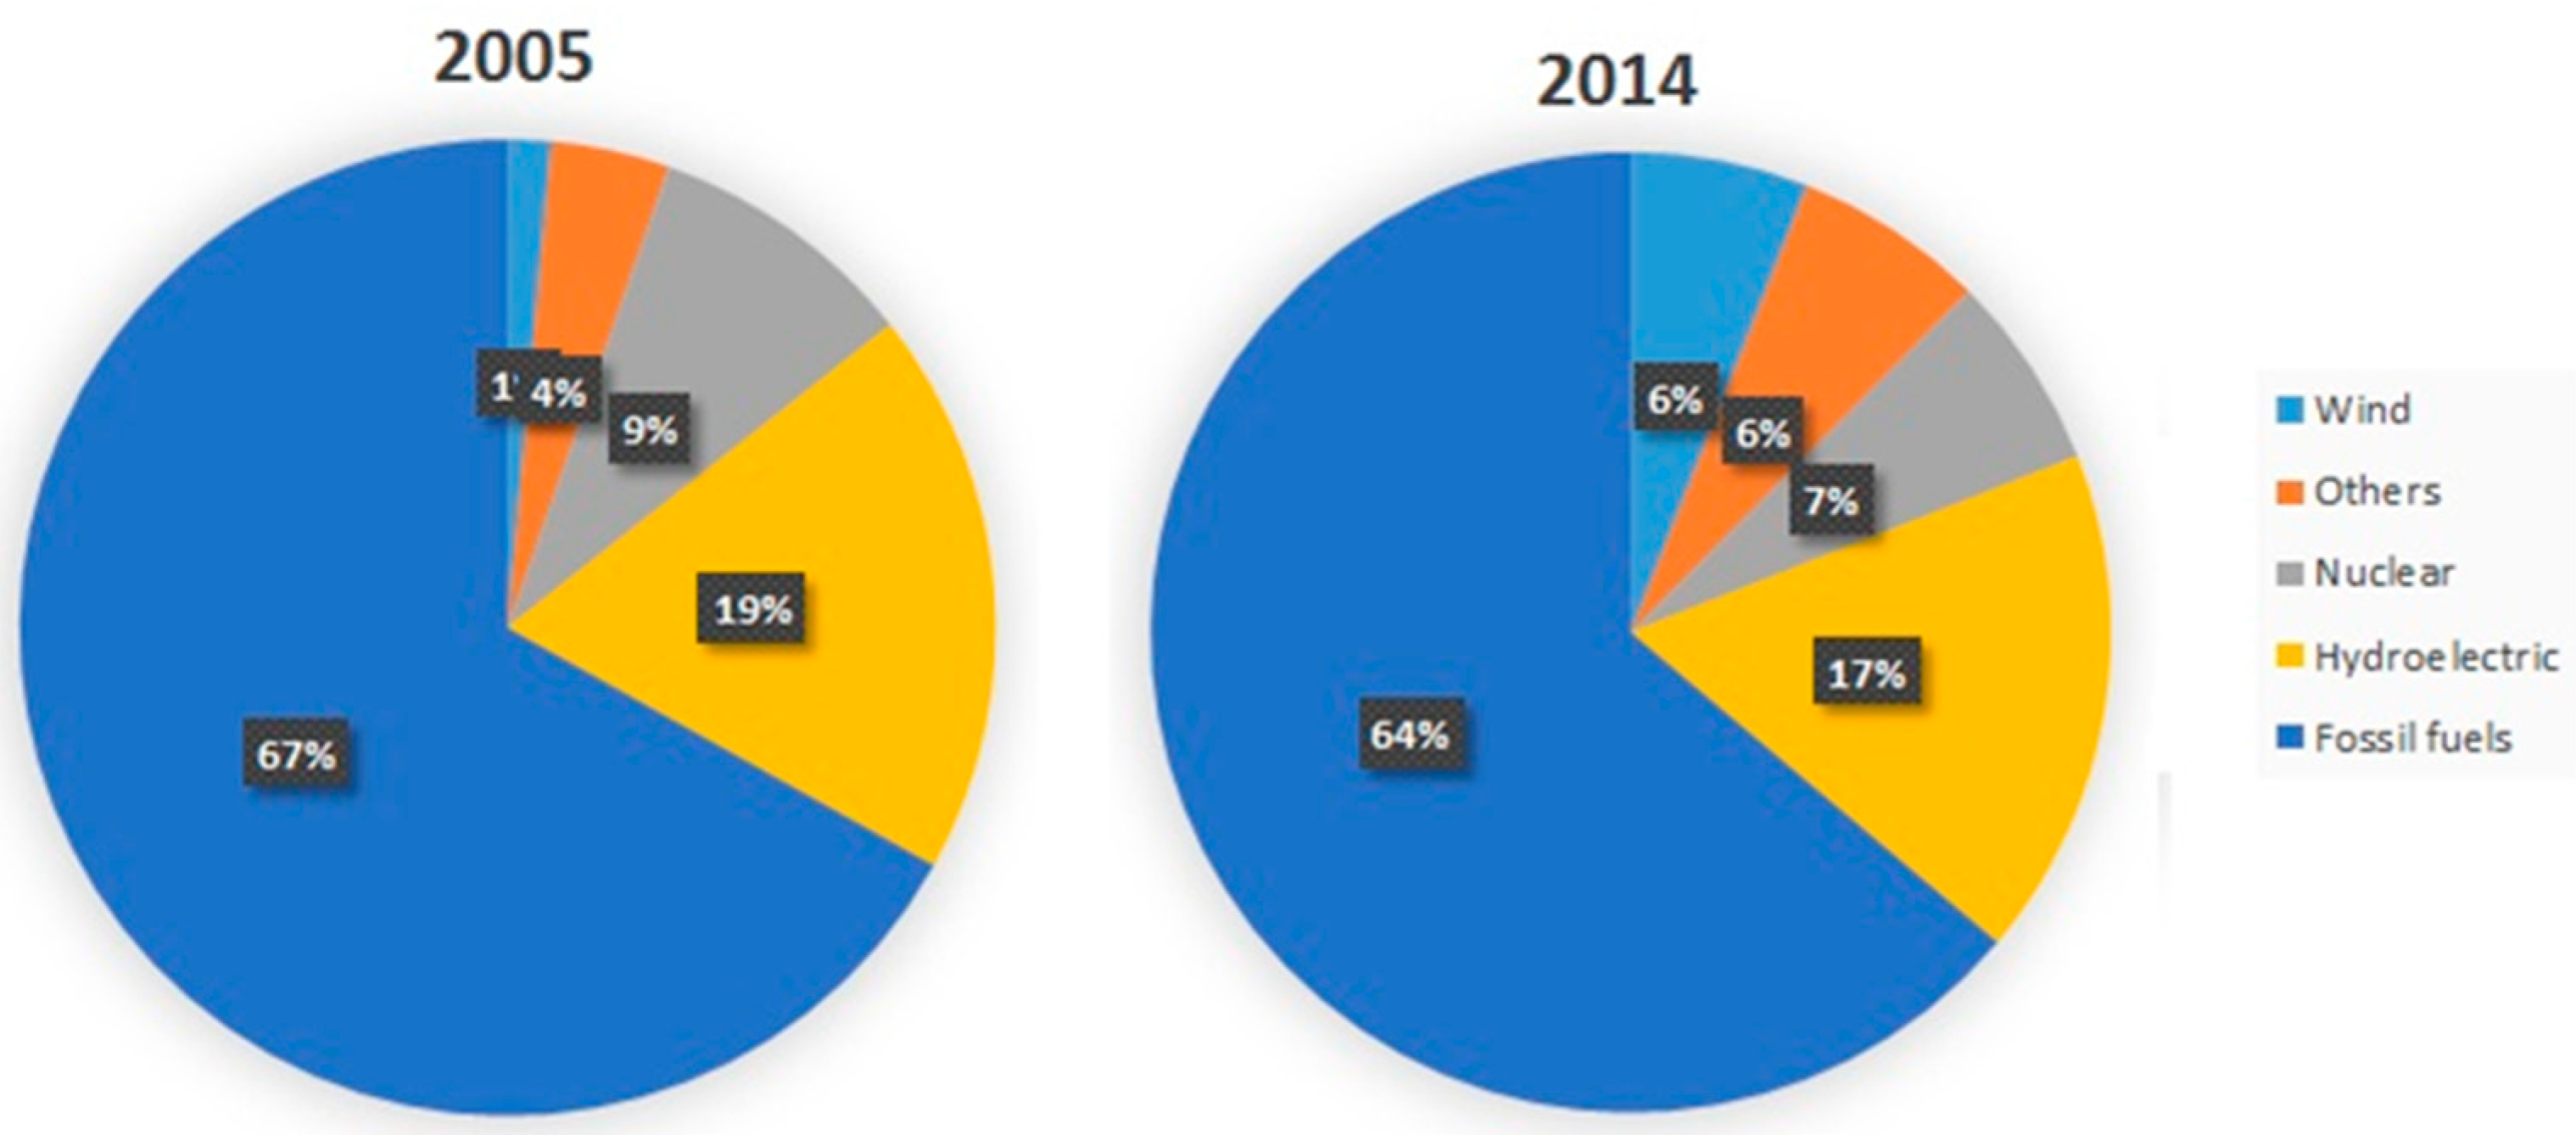
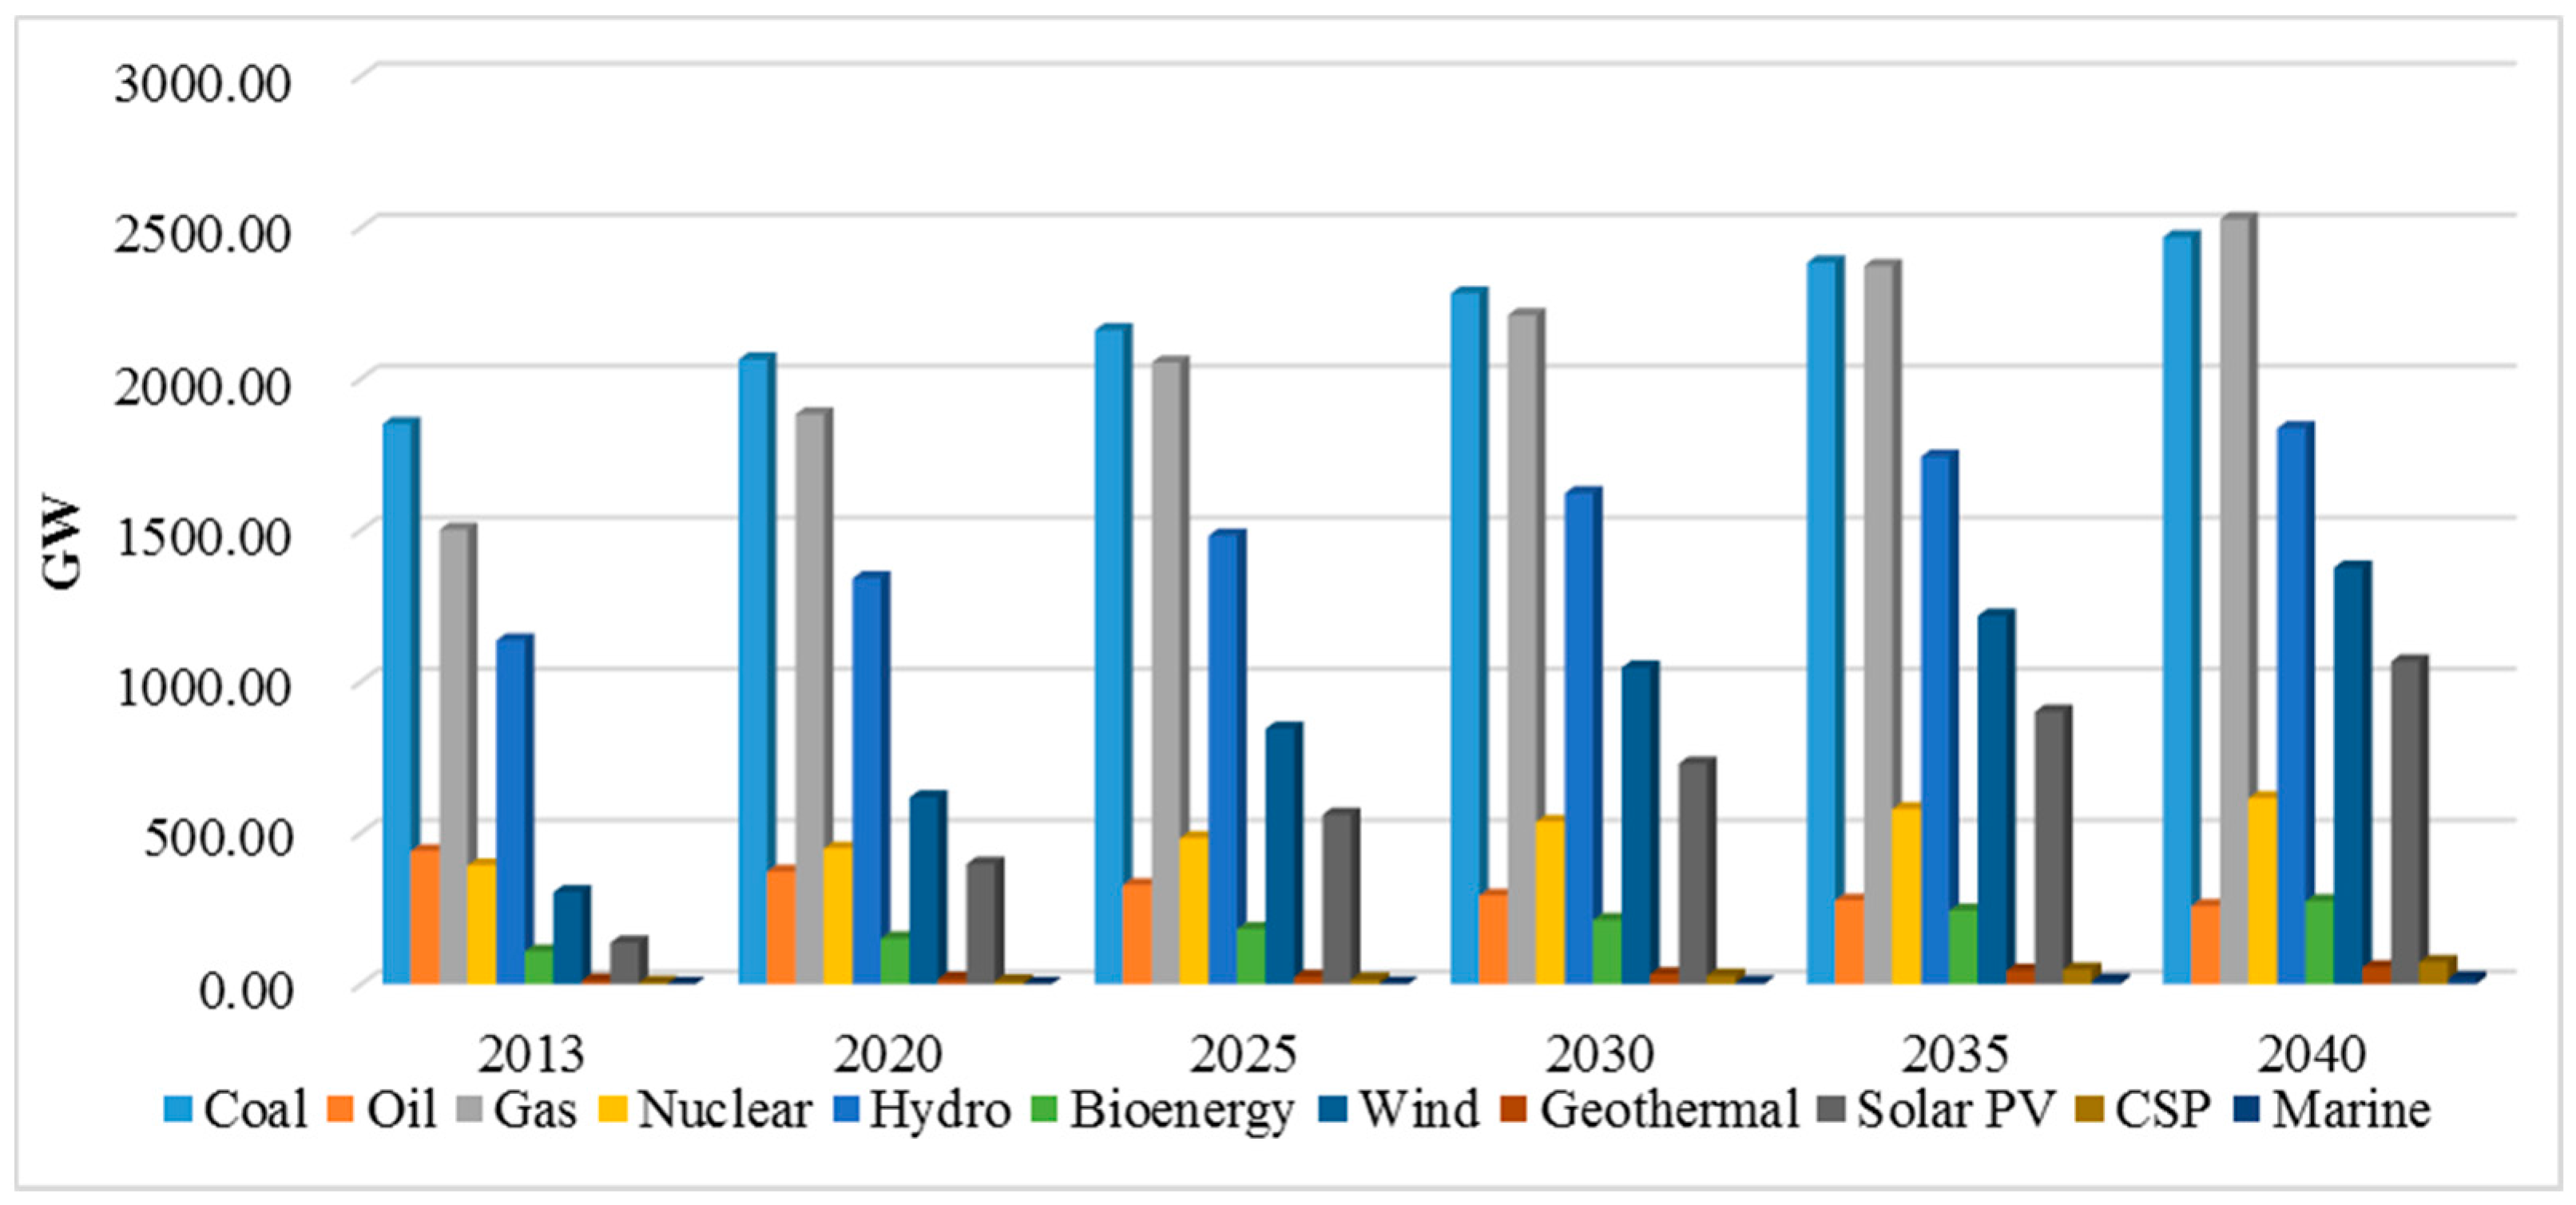
3. Electricity Generation Status and Future

By 2014, the global electricity generation installed capacity was 5699.4 GW. World power generation capacities from all energy sources in 2005 and 2014 are shown in Figure 1. Compared with 2005, the proportions of fossil fuels, hydro, and nuclear electricity capacities in 2014 slightly declined, and the proportions of wind and other electricity capacities slightly increased. Fossil fuel electricity generation is still the main source and constituted over 60% of electricity generation in 2014. Meanwhile, fossil fuel electricity is the main contributor of CO2, NOx, SO2, and other harmful gases among all energy sources. It contributed 42% of total CO2 emissions in 2013. Thus, many countries nowadays are trying to reduce the amount of fossil fuel electricity by rolling out incentive policies. Under a new policy scenario (which takes into account the policies and implementing measures affecting energy markets adopted as of mid-2015), the fossil fuel electricity generation capacity will be less than 50% of the whole in 2040 [19]. The world’s electricity generation capacities in the future are shown in Figure 2.
G20 is an international forum comprised of governments and central bank governors from 20 major economies. The members include 19 individual countries and the European Union. Collectively, the G20 economies account for around 85% of the gross world product (GWP), 80% of world trade (or, if excluding EU intra-trade, 75%), and two-thirds of the world population. In this paper, we study electricity generation system sustainability of Argentina, Australia, Brazil, Canada, China, France, Germany, India, Indonesia, Italy, Japan, South Korea, Mexico, Netherlands, Russia, Saudi Arabia, South Africa, Spain, Sweden, Switzerland, Turkey, the United Kingdom, and the United States. These 23 countries account for about 80% of total global electricity generation capacity. The electricity generation proportions of the 23 countries from all energy sources since 2005 to 2014 are shown in Figure 3. The solar PV and wind electricity generations have high growth rates, and their average growth rates are 44.10% and 21.89%, respectively, from 2005 to 2014. The proportions of solar PV and wind of the 23 countries were 0.15% and 1.60% in 2005, and were 2.61% and 6.67% in 2014. The 23 countries have different developing trends on the energy sources for electricity generation. From the historical data, we find that most countries have high fossil fuel electricity generation proportions, such as Argentina, Australia, China, India, Indonesia, Italy, Japan, South Korea, Turkey, the United Kingdom, and the United States. Three countries have high hydroelectric installed capacity proportions, namely Brazil, Canada, and Switzerland. France has a high proportion of nuclear generation. Germany, Spain, and Sweden have relatively balanced sources of electricity generation. In this paper, we set up an evaluation model to calculate the sustainability of these electricity generation systems.

4. The Evaluation Indexes and Model

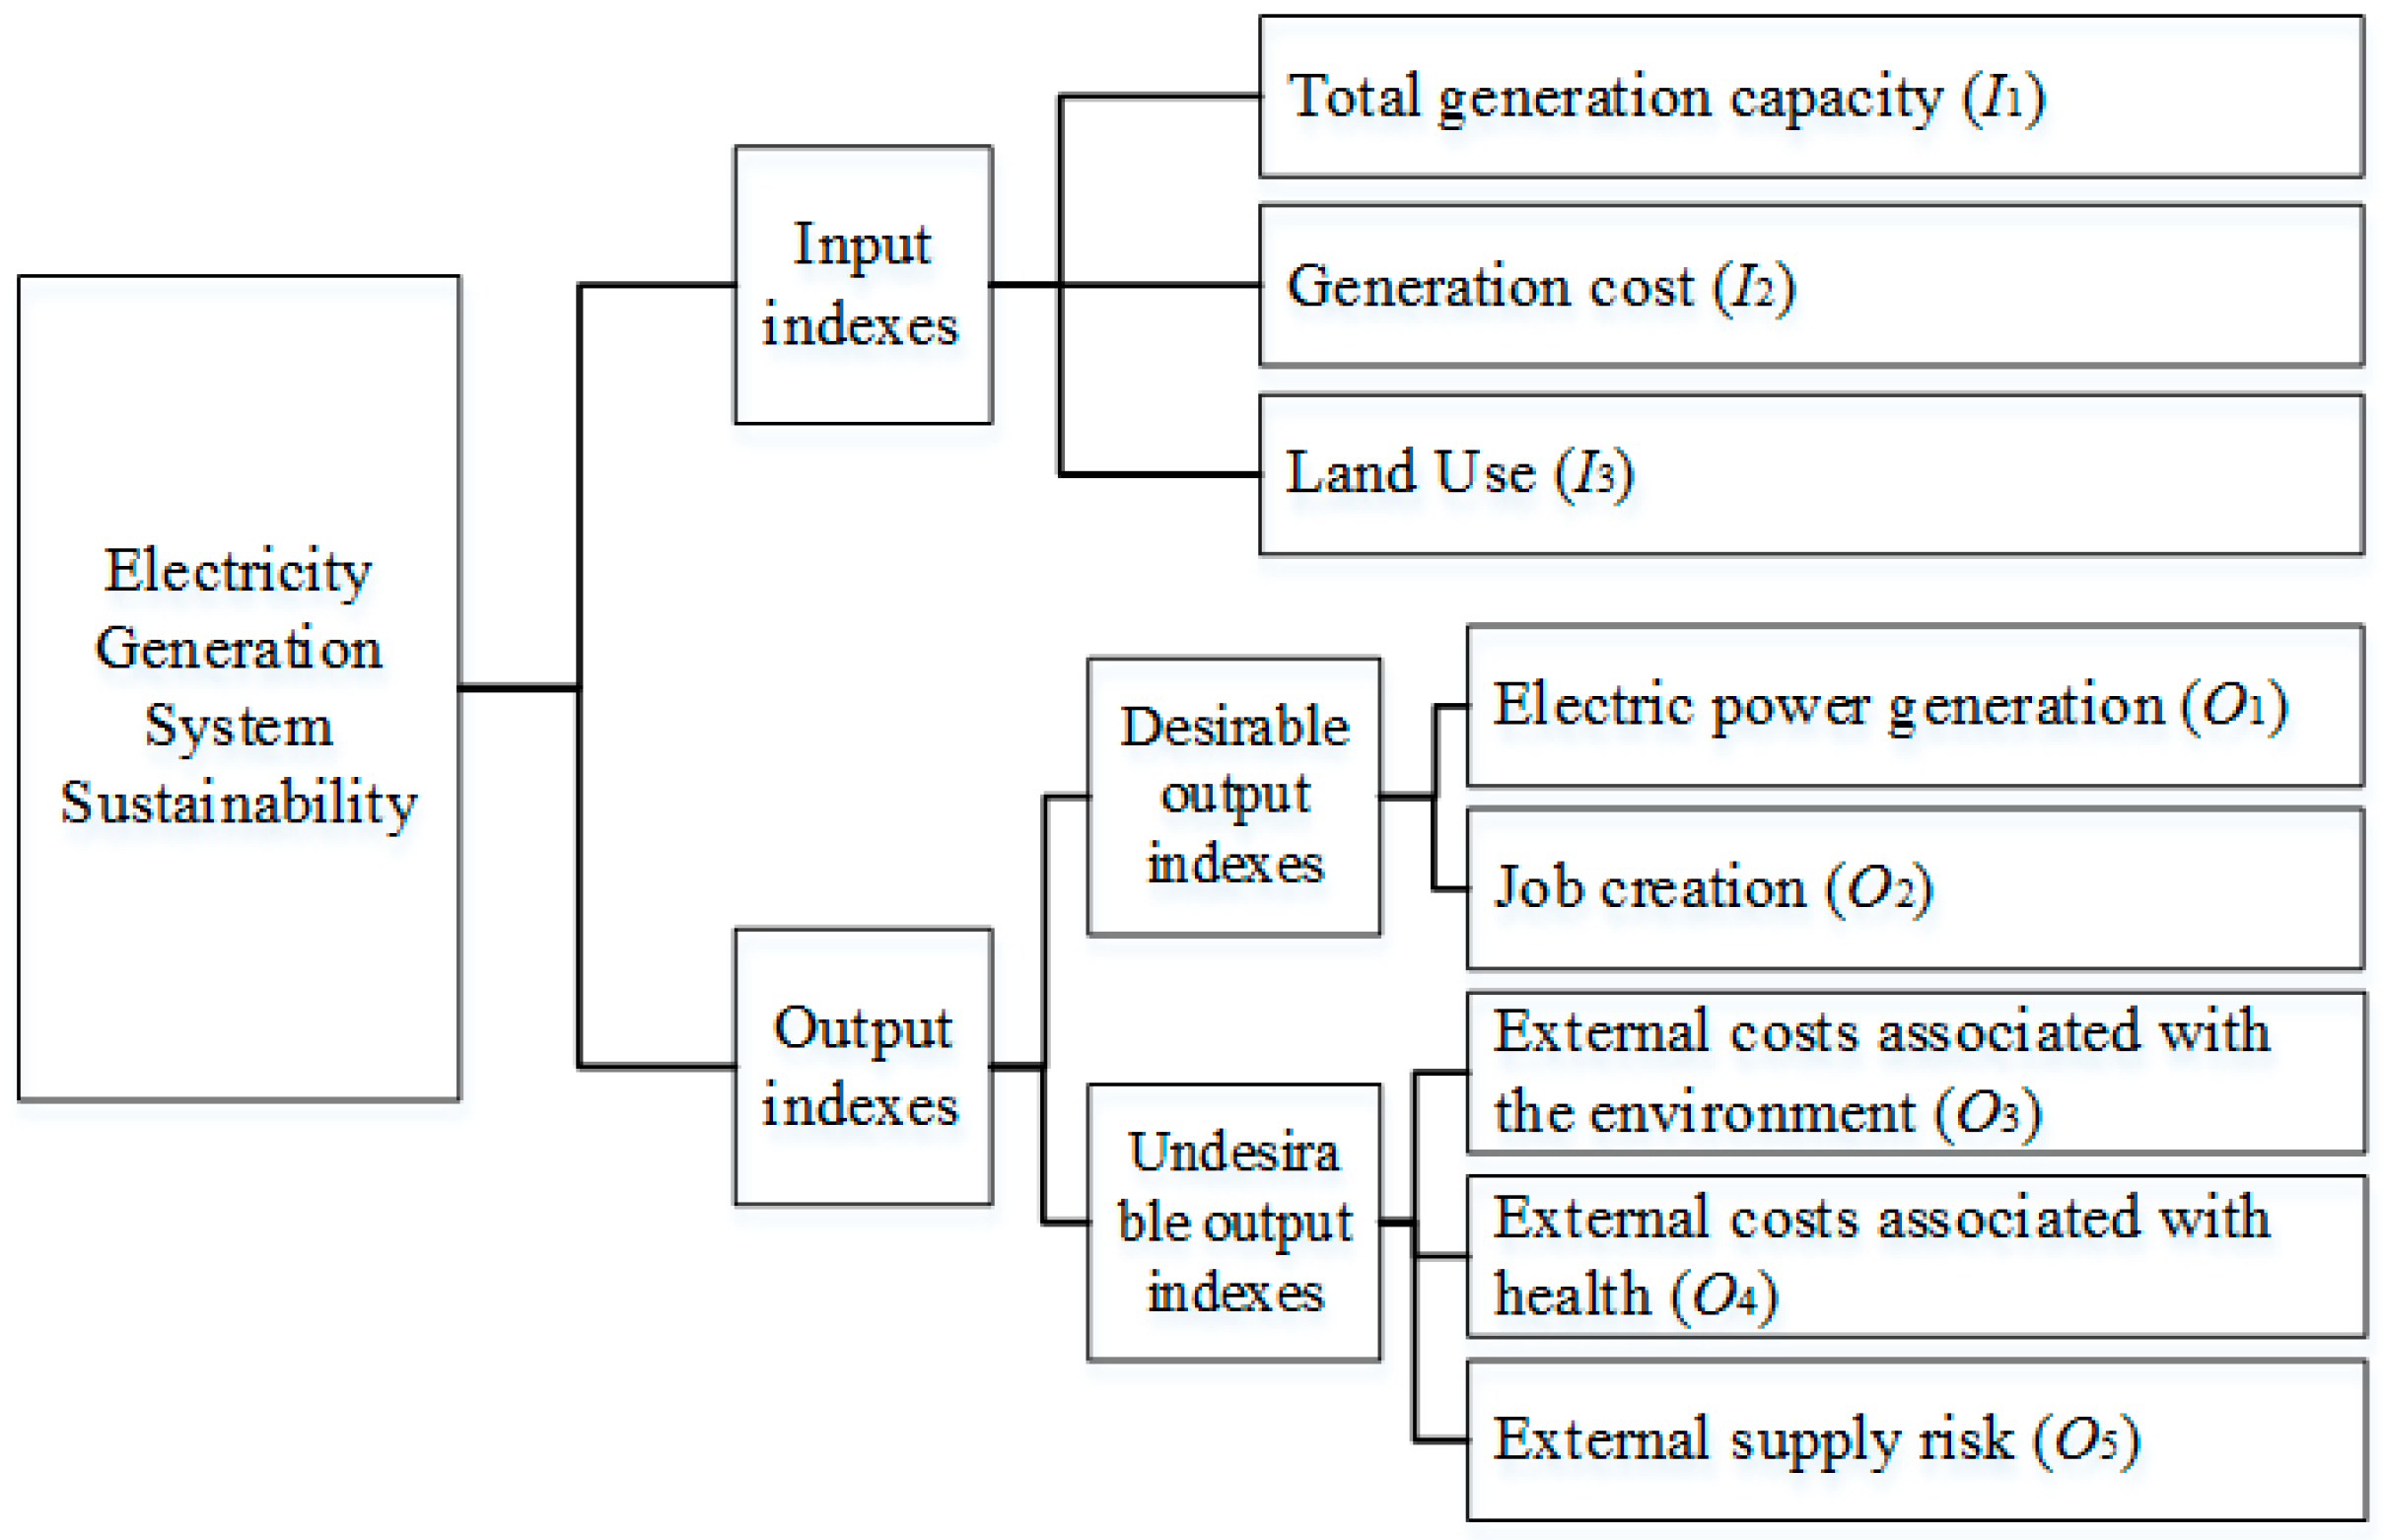
4.1. The Evaluation Indexes of Electricity Generation System Sustainability

According to the concept of sustainable development, the evaluation indexes are set up with four aspects—society, the economy, the environment, and security. The specific indexes are shown in Figure 4. The output indexes include desirable (good) and undesirable (bad) outputs. Electric power generation and job creation are desirable outputs. External supply risk and external costs associated with the environment and health are undesirable outputs.

4.2. Analysis Method

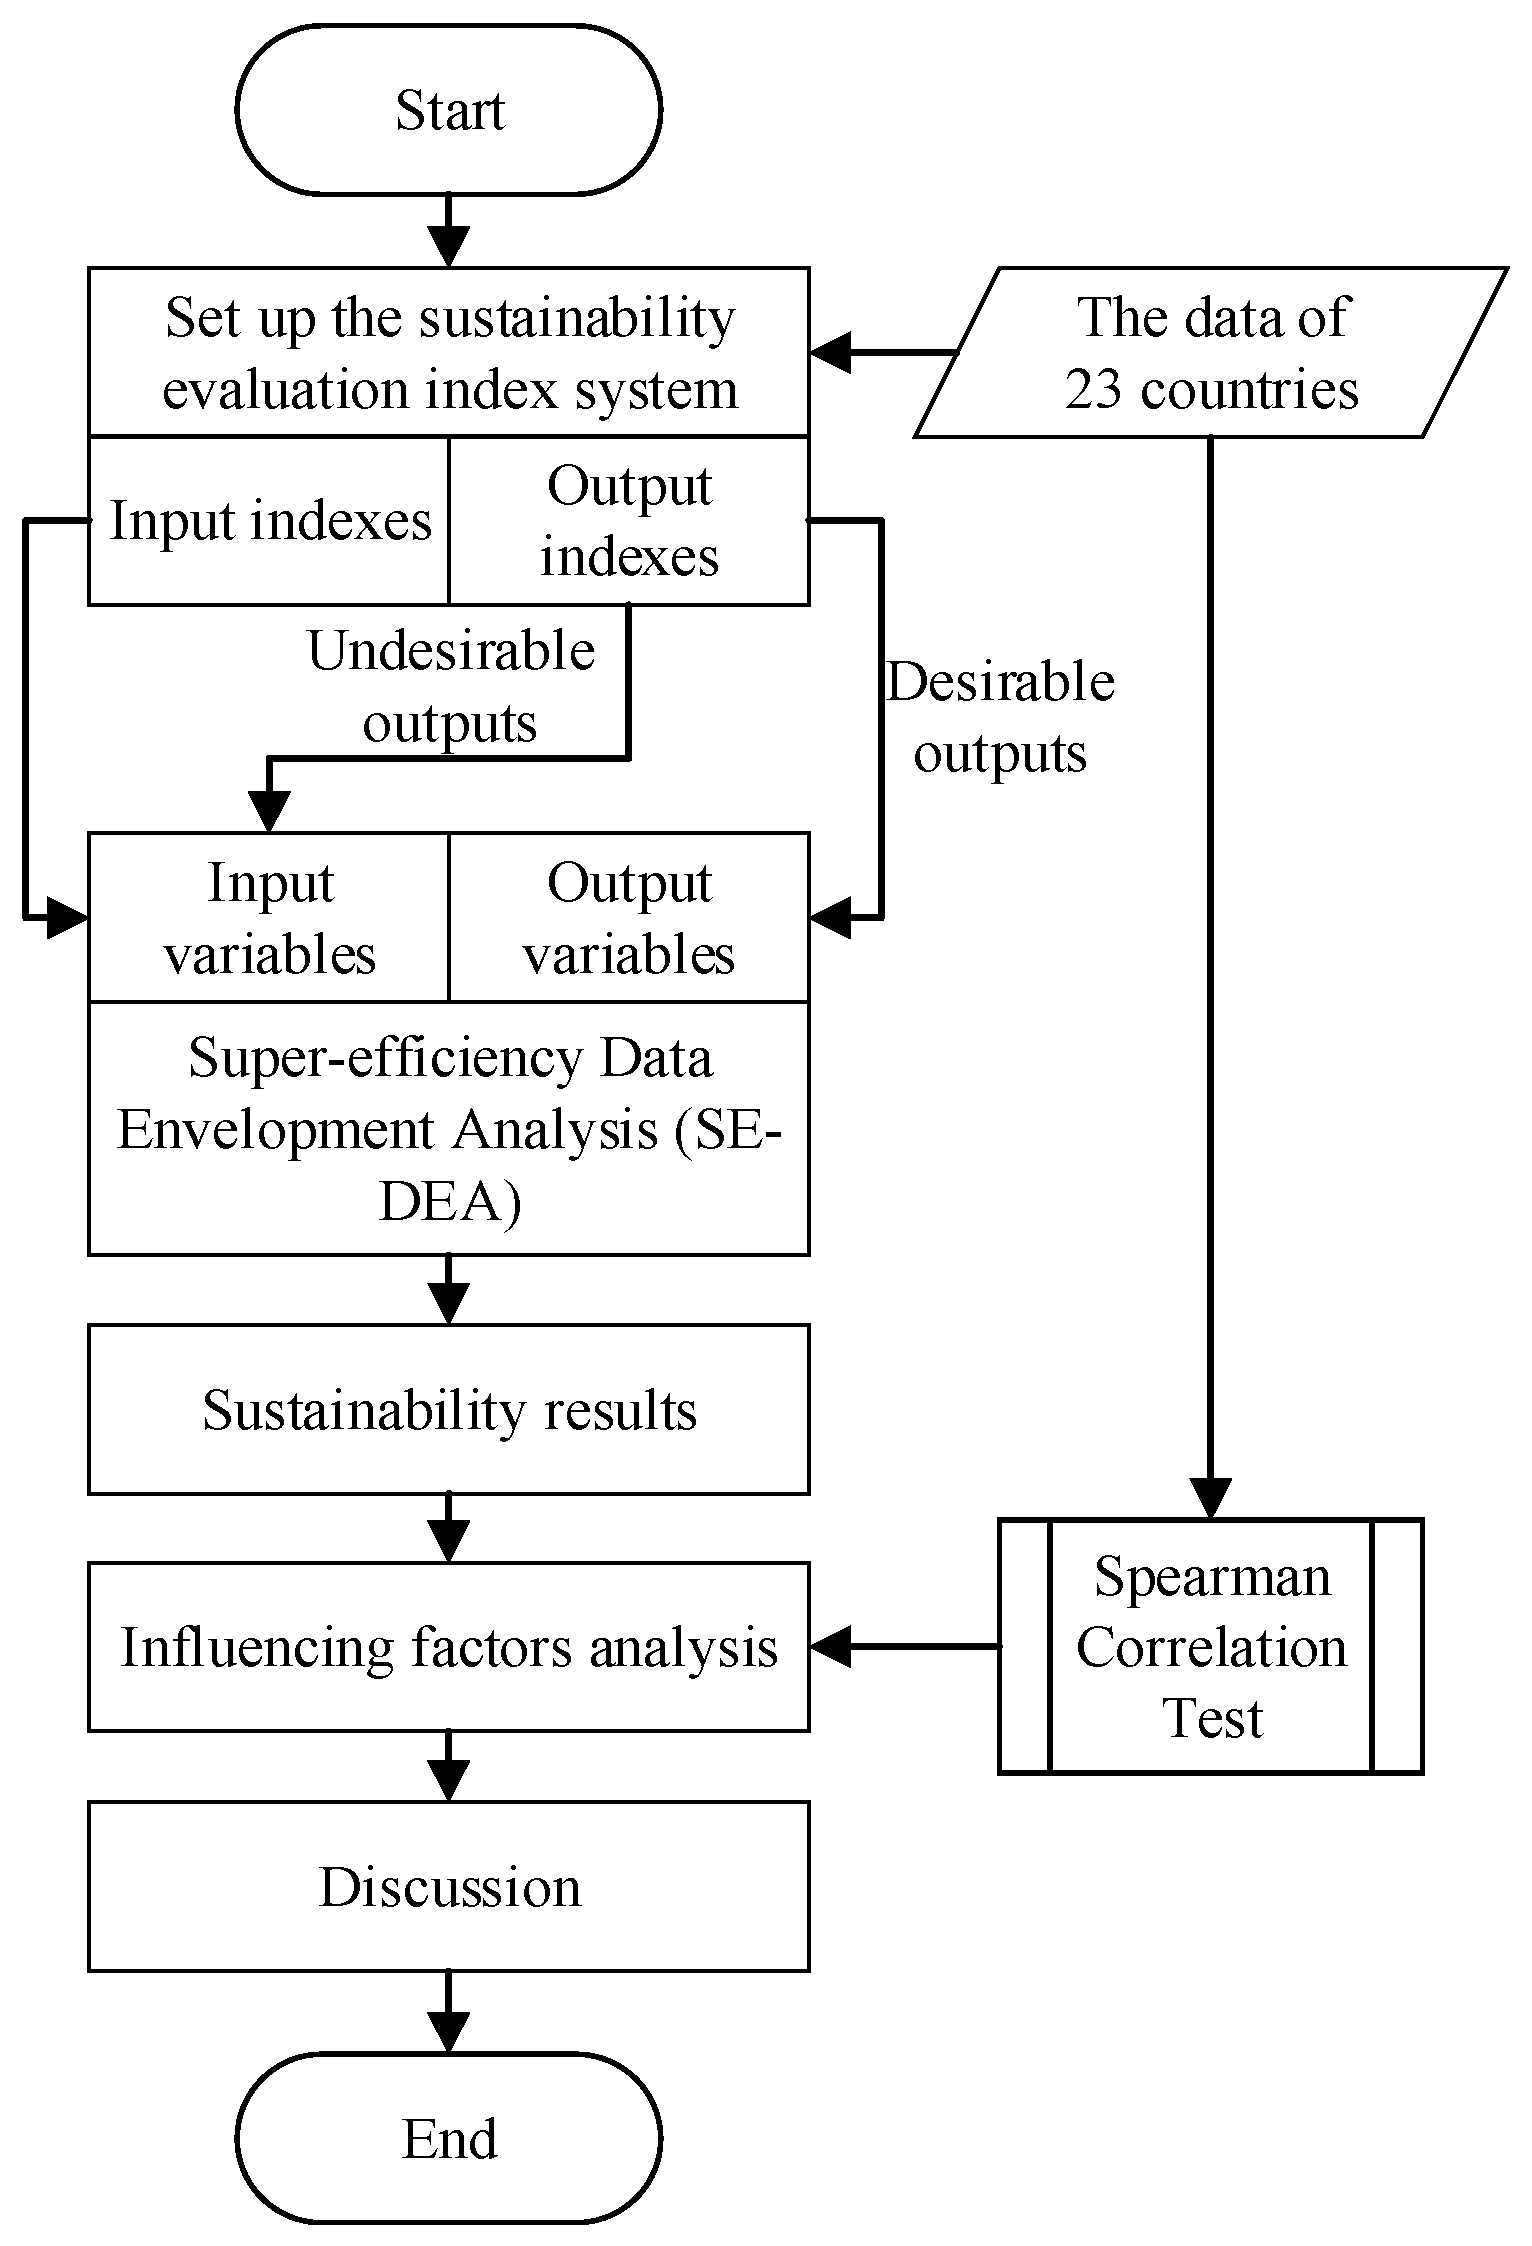
4.2.1. Analysis Process

In this paper, we use a super-efficiency DEA method to calculate the sustainability of an electricity generation system and use the Spearman’s correlation test to determine the factors influencing sustainability. The detailed analysis processes are shown in Figure 5.

4.2.2. The Super-Efficiency DEA (SE-DEA) Model

In the SE-DEA model, the efficiency scores from the model are obtained by eliminating the data of the decision-making units (DMUs) to be evaluated from the solution set [20]. In this paper, the DMUs represent the electricity generation systems of the G20 countries from 2005 to 2014. The SE-DEA model is defined as follows:
θ S * = min θ o S s . t . j = 1 j o n λ j x i j θ o S x i o i = 1 , , m j = 1 j o n λ j y r j y r o r = 1 , , s λ j 0 j = 1 , , n .
Equation (1) computes the score of the DMU by removing it from constraints. Here, θ S * indicates the score of the DMU under consideration. x i o and y r o are respectively the i-th input and r-th output for the D M U o under evaluation. We suppose that θ S * shows optimal amounts. x i j is the i-th input of the j-th D M U . y r j is the r-th output of the j-th D M U . λ j is the parameter that needs to be estimated.
In this paper, input indexes (I1, I2, I3) and undesirable output indexes (O3, O4, O5) are used as the input variables (x) of the SE-DEA model. Desirable output indexes (O1, O2) are used as the output variables (y) of the SE-DEA model.

4.2.3. Spearman’s Correlation Test

Spearman’s rank-order correlation is equivalent to Pearson’s product-moment correlation coefficient performed on the ranks of the data rather than the raw data, and it is the nonparametric version of Pearson’s product-moment correlation. Spearman’s correlation coefficient can measure the strength of association between two ranked variables. Its calculation equation is shown in Equation (2) [21].
r s = i = 1 n { ( x i x ¯ ) ( y i y ¯ ) } i = 1 n ( x i x ¯ ) 2 i = 1 n ( y i y ¯ ) 2
Here, r s is Spearman’s correlation, and x ¯ ,   y ¯ are the average values of the two variables x i and y i . Spearman’s correlation rank will yield a value 1 r s 1 . The higher the absolute value of r s is, the stronger the correlation between the two variables is. A positive value suggests a positive correlation, while a negative value means a negative correlation.

5. The Sustainability of the Electricity Generation Systems of 23 Countries

5.1. Data Collection

We collected information about 23 countries based on data recorded from 2005 to 2014. The data was gathered from the U.S. Energy Information Administration and the World Bank-World Development Indicators. The preliminary data include installed electricity capacity of 23 countries, including different kinds of energy sources, and net generation, which includes nuclear installed capacity (NC) and net generation (NUG), hydroelectric installed capacity (HC) and net generation (HG), wind installed capacity (WC) and net generation (WG), fossil fuel installed capacity (FC) and net generation (FG), geothermal installed capacity (GC) and net generation (GG), solar, tide, and wave installed capacity (SC) and net generation (SG), and biomass and waste electricity net generation (BG). Table 2 shows the descriptive statistics of the data.

5.2. Parameter Collection

In order to obtain the values of the input and output indexes, some parameters are needed. The parameters include life costs of electricity generation (LCOE), land use (LU), external costs associated with environment (ECAWE), external costs associated with health (ECAWH), the number of employees per unit of electricity produced (JC), and external supply risk (ESR). The values [22] of the parameters mentioned above are shown in Table 3. In Table 3, Nu indicates nuclear electricity generation, H indicates hydroelectric generation, S indicates solar, tide and wave electricity generation, W indicates wind electricity generation, F indicates fossil fuel electricity generation, G indicates geothermal electricity generation, and B indicates biomass and waste electricity generation. There are no data for geothermal electricity generation on ECAWE and ECAWH. Kagel and Gawell (2005) [23] pointed out that the geothermal electricity generation had low emission output. Considering the technical characters of geothermal electricity generation, we used the same parameters with hydroelectric generation. There is no unit of ESR in [22]. Considering the characters of the DEA method, the unit does not have effect the sustainability evaluation result, so here we use score/TWh as its unit. The two group values of LCOE under the condition of discount rate are 5% and 10%.

5.3. Descriptions of Indexes’ Values

Because a 5% discount rate is suited for most countries’ economic situations, we used a 5% discount rate. For the importance of environmental sustainability, we used a maximum cost value of ECAWE and ECAWH. The values of indexes are shown in Table 4.

5.4. Sustainability of Electricity Generation System

Because the external costs associated with the environment (O3), the external costs associated with health (O4), and the external supply risk (O5) are undesirable outputs, here we used them as input variables of the SE-DEA method. Thus, the SE-DEA method’s input variables include I1, I2, I3, O3, O4, and O5, and the output variables include O1 and O2. The sustainability results of the electricity generation systems are shown in Table 5 and Figure 6.
The results show that the sustainability of the 23 countries’ electricity generation system developing trends can be divided into three groups. The details of their developmental trends are shown in Figure 6a–c.

5.5. Influencing Factors Analysis

In this paper, we analyze the relationship among different energy sources’ installed capacities and the sustainability of the electricity generation system through Spearman’s correlation test. The test results are shown in Table 6.
The calculation results show that nuclear and hydroelectric electricity generation installed capacities have positive relationships with sustainability, while solar, wind, fossil fuel, and geothermal electricity generation installed capacities have negative relationships with sustainability.

6. Conclusions

In this paper, we set up a sustainability evaluation index system of electricity generation with undesirable outputs for G20 countries. The evaluation index system includes three input indexes and five output indexes. We use the three input indexes and three undesirable output indexes as the input variables of the SE-DEA method, and the two desirable output indexes as the output variables of the SE-DEA method.
We conducted an empirical study on the sustainability of the electricity generation systems in 23 countries based on data from 2005 to 2014. The results indicate that most countries’ electricity generation systems have low scores in sustainability. Only France and Switzerland’s average sustainability scores from 2005 to 2014 are over one. France has the highest proportion of nuclear electricity generation installed capacity, which is over 50%. Switzerland has the highest proportion of nuclear and hydroelectric electricity generation among the total, which was over 80%. The correlation test results indicate that nuclear and hydroelectric electricity generation has a positive influence on the sustainability of an electricity generation system. The results also show that fossil fuel, solar, wind, and geothermal electricity generation have a negative relationship with the sustainability.
Future studies are encouraged to gain more insight into the optimal structure calculation of electricity generation systems considering the life cycle cost of electricity generation technology. Meanwhile, a greater amount of data, such as those concerning additional environmental cost data for energy technologies, might also be needed.

Acknowledgments

The authors thank the two reviewers whose comments improved the quality of this paper. This work has been supported by the Fundamental Research Funds for the Central Universities, No. 2014ZD21, the Ministry of Education, Humanities and Social Science Fund, No. 15YJC630058, and the China Scholarship Council Project.

Author Contributions

Jinchao Li contributed to the conception, design, and computation. Xian Geng contributed to the English editing and checking. Jinying Li collected and interpreted the data. All of the authors drafted and revised the manuscript together and approved its final publication.

Conflicts of Interest

The authors declare no conflict of interest.

References

  1. China General Office of the State Council. Energy Development Strategy Action Plan (2014–2020); China General Office of the State Council: Beijing, China, 2014.
  2. U.S. Energy Information Administration. Annual Energy Outlook 2012 Early Release; EIA: Washington, DC, USA, 2012.
  3. International Energy Agency. Energy Climate and Change; IEA: Paris, France, 2015. [Google Scholar]
  4. World Commission on Environment and Development. Our Common Future; Oxford University Press: Oxford, UK, 1987. [Google Scholar]
  5. Karger, C.R.; Hennings, W. Sustainability evaluation of decentralized electricity generation. Renew. Sustain. Energy Rev. 2009, 13, 583–593. [Google Scholar] [CrossRef]
  6. Wang, L.; Xu, L.; Song, H. Environmental performance evaluation of Beijing’s energy use planning. Energy Policy 2011, 39, 3483–3495. [Google Scholar] [CrossRef]
  7. Rahman, M.M.; Paatero, J.V.; Lahdelma, R. Evaluation of choices for sustainable rural electrification in developing countries: A multi criteria approach. Energy Policy 2013, 59, 589–599. [Google Scholar] [CrossRef]
  8. Yang, Q.; Chen, G.Q.; Liao, S.; Zhao, Y.H.; Peng, H.W.; Chen, H.P. Environmental sustainability of wind power: An emergy analysis of a Chinese windfarm. Renew. Sustain. Energy Rev. 2013, 25, 229–239. [Google Scholar] [CrossRef]
  9. Phillips, J. Determining the sustainability of large-scale photovoltaic solar power plants. Renew. Sustain. Energy Rev. 2013, 27, 435–444. [Google Scholar] [CrossRef]
  10. Kurka, T. Application of the analytic hierarchy process to evaluate the regional sustainability of bioenergy developments. Energy 2013, 62, 393–402. [Google Scholar] [CrossRef]
  11. Verbruggen, A.; Laes, E.; Lemmens, S. Assessment of the actual sustainability of nuclear fission power. Renew. Sustain. Energy Rev. 2014, 32, 16–28. [Google Scholar] [CrossRef]
  12. Bi, G.-B.; Song, W.; Zhou, P.; Liang, L. Does environmental regulation affect energy efficiency in China’s thermal power generation? Empirical evidence from a slacks-based DEA model. Energy Policy 2014, 66, 537–546. [Google Scholar] [CrossRef]
  13. Al Garni, H.; Kassem, A.; Awasthi, A.; Komljenovic, D.; Al-Haddad, K. A multicriteria decision making approach for evaluating renewable power generation sources in Saudi Arabia. Sustain. Energy Technol. Assess. 2016, 16, 137–150. [Google Scholar] [CrossRef]
  14. Streimikiene, D.; Sliogeriene, J.; Turskis, Z. Multi-criteria analysis of electricity generation technologies in Lithuania. Renew. Energy 2016, 85, 148–156. [Google Scholar] [CrossRef]
  15. Grilli, G.; De Meo, I.; Garegnani, G.; Paletto, A. A multi-criteria framework to assess the sustainability of renewable energy development in the Alps. J. Environ. Plan. Manag. 2016, 10, 1–20. [Google Scholar] [CrossRef]
  16. Saaty, T.L. Decision making with the analytic hierarchy process. Int. J. Serv. Sci. 2008, 1, 83–98. [Google Scholar] [CrossRef]
  17. Charnes, A.; Cooper, W.W.; Rhodes, E. Measuring the efficiency of decision making units. Eur. J. Oper. Res. 1978, 2, 429–444. [Google Scholar] [CrossRef]
  18. Berg, S. Water Utility Benchmarking: Measurement, Methodologies, and Performance Incentives; International Water Association: London, UK, 2010. [Google Scholar]
  19. International Energy Agency. World Energy Outlook 2015; IEA: Paris, France, 2015. [Google Scholar]
  20. Li, J.; Li, J.; Zheng, F. Unified Efficiency Measurement of Electric Power Supply Companies in China. Sustainability 2014, 6, 779–793. [Google Scholar] [CrossRef]
  21. Puth, M.-T.; Neuhauser, M.; Ruxton, G.D. Effective use of Spearman’s and Kendall’s correlation coefficients for association between two measured traits. Anim. Behav. 2015, 105, 77–84. [Google Scholar] [CrossRef]
  22. Maxim, A. Sustainability assessment of electricity generation technologies using weighted multi-criteria decision analysis. Energy Policy 2014, 65, 284–297. [Google Scholar] [CrossRef]
  23. Alyssa, K.; Karl, G. Promoting Geothermal Energy: Air Emissions Comparison and Externality Analysis. Electr. J. 2005, 18, 90–99. [Google Scholar]
Figure 1. World electricity generation capacities from all energy sources in 2005 and 2014.
Sustainability 08 01276 g001
Figure 2. World electricity generation capacities: developing trends under a new policy scenario.
Sustainability 08 01276 g002
Figure 3. The electricity generation proportions of the 23 countries from all energy sources (2005–2014).
Sustainability 08 01276 g003
Figure 4. The sustainability evaluation indexes of electricity generation.
Sustainability 08 01276 g004
Figure 5. The process by which electricity generation system sustainability is determined.
Sustainability 08 01276 g005
Figure 6. (a) The sustainability development trend of the upward trend group; (b) The sustainability development trend of the downward trend group; (c) The sustainability development trend of the fluctuation group.
Sustainability 08 01276 g006
Table 1. Information on evaluation indexes and methods in related papers.
AuthorsEvaluation ObjectIndexesMethod
Cornelia R. Karger, Wilfried, Hennings [5]Decentralized electricity generationEnvironmental protectionAnalytic Hierarchy Process
Health protection
Security of supply
Economic aspects
Social aspects
Lei Wang, Linyu Xu, Huimin Song [6]Energy systemStructure of energy useAnalytical Hierarchy Process
Technical and efficiency
Environmental impacts
Socio-economic benefits
Md. Mizanur Rahman, Jukka V. Paatero, Risto Lahdelma [7]Rural electrificationTechnical dimensionMulti-criteria approach
Economic dimension
Social dimension
Environmental dimension
Policy/regulation dimension
Q. Yang, G.Q. Chen, S. Liao et al. [8]Wind PowerPercent renewableMathematical model
Energy yield ratio
Environmental loading ratio
Energy investment ratio
Energy sustainability index
Jason Phillips [9]Photovoltaic solar power plantsHuman health and well-beingMathematical model
Wildlife and habitat
Land use and geohydrological resources
Climate change
Thomas Kurka [10]BioenergyGHG EmissionsAnalytic Hierarchy Process
Air Quality
Waste
Economic Viability
Regional Energy Self-Sufficiency
Efficiency
Technology
Regional Job Creation
Regional Food Security
Aviel Verbruggen, Erik Laes, Sanne Lemmens [11]Nuclear fission powerEnvironmental/ecologicalEmpirical analysis
Economics
Risks
Social
Governance/policy
G.-B. Bi, W. Song, P. Zhang, L. Liang [12]Thermal power generationInstalled capacityData envelopment analysis
Labor
Coal total
Gas total
Power Generated
SO2
NOx
Soot
Hassan Al Garni, Abdulrahman Kassem, Anjali Awasthi et al. [13]Renewable power generationTechnicalAnalytic Hierarchy Process
Environmental
Socio-political
Economic
Dalia Streimikien, Jurate Sliogeriene, Zenonas Turskis [14]Electricity generation technologiesInstitutional political criteriaAnalytic Hierarchy Process
Economic Criteria
Social-ethics criteria
Technological criteria
Environmental protection criteria
Gianluca Grilli, Isabella De Meo, Giulia Garegnani, Alessandro Paletto [15]Renewable energyEnvironmental impactsMulti-criteria analysis
Social impacts
Economic impacts
Table 2. Descriptive statistics of preliminary data of the 23 countries, 2005–2014.
VariableUnitNo.MeanStDevMinMax
Installed CapacityNCGW23014.44423.9560.000101.885
HCGW23029.11444.4300.000249.000
SCGW2301.9605.1580.00032.771
WCGW2306.97713.3910.00088.380
FCGW230113.214196.8440.477823.900
GCGW2300.2570.5610.0002.592
Net GenerationNUGTWh23097.774176.8330.000806.968
HGTWh230106.653167.6660.0001029.300
SGTWh2302.1085.2750.00033.880
WGTWh23013.66528.1130.000182.090
FGTWh230468.407801.3570.7643697.000
GGTWh2301.5443.4700.00015.562
BGTWh23011.222 16.7980.00078.970
Table 3. The parameters’ value of electricity generation system.
ParameterUnitTypeNuHSWFGB
LCOE$/MWh5%53.7926.35177.8076.2864.3739.9872.00
$/MWh10%87.2946.66301.89109.6179.3668.4597.00
LUm2/MWh 0.124.100.461.570.390.7412.65
ECAWE€c/MWhMin0.040.010.160.020.980.010.03
Max0.130.330.160.087.350.330.75
ECAWH€c/MWhMin0.160.020.440.031.020.020.17
Max0.570.670.440.177.650.674.25
JCJob years/GWh 0.140.550.230.170.110.250.21
ESRScore/TWh 1.800.000.000.005.700.000.00
Table 4. Descriptive statistics of the 23 countries’ input and output index values.
VariableUnitNo.MeanStDevMinMax
I1GW230172.79 264.07 19.09 1223.37
I2Billion $23040.51 63.14 2.23 288.69
I3km2230797.21 1097.63 64.57 6466.94
O1TWh230700.69 1063.92 55.41 5060.70
O2Job years230129,422.97183,657.6511,194.431,028,172.23
O3Billion €23035.01 59.51 0.22 275.76
O4Billion €23037.63 63.17 0.50 292.62
O5Score2302845.91 4757.03 45.60 21,307.94
Table 5. Descriptive statistics of the 23 countries’ electricity generation system.
CountryRankMeanStDevMinMaxCountryRankMeanStDevMinMax
Argentina140.8880.0100.8780.911Mexico130.890 0.010 0.876 0.908
Australia180.8490.0160.8270.871Netherlands220.799 0.024 0.766 0.828
Brazil50.9900.0440.9041.073Russia90.912 0.003 0.909 0.917
Canada30.9970.0080.9861.011Saudi Arabia80.924 0.000 0.924 0.925
China150.8840.0130.8700.912South Africa70.954 0.014 0.938 0.990
France11.0180.0340.9891.091Spain200.815 0.037 0.766 0.862
Germany230.7950.0660.7140.888Sweden60.979 0.059 0.915 1.092
India110.8930.0200.8680.920Switzerland21.010 0.032 0.979 1.085
Indonesia100.8960.0140.8760.917Turkey120.893 0.014 0.861 0.909
Italy210.7990.0560.7070.846United Kingdom190.839 0.035 0.778 0.886
Japan170.8550.0330.7970.884United States160.869 0.008 0.855 0.879
South Korea40.9910.0230.9631.039
Table 6. Influencing factors calculation results.
NCHCSCWCFCGC
Correlation0.348 **0.431 **−0.427 **−0.535 **−0.331 **−0.276 **
Sig. (Two side)0.0000.0000.0000.0000.0000.000
No.230230230230230230
Note: ** means: the possibility of no significant correlation is not more than 0.01.

