Article

Nuclear Insurance Subsidies Cost from Post-Fukushima Accounting Based on Media Sources

by
John J. Laureto
1 and
Joshua M. Pearce
1,2,*
1
Department of Materials Science and Engineering, Michigan Technological University, 601 M&M Building, 1400 Townsend Drive, Houghton, MI 49931-1295, USA
2
Department of Electrical & Computer Engineering, Michigan Technological University, 601 M&M Building, 1400 Townsend Drive, Houghton, MI 49931-1295, USA
*
Author to whom correspondence should be addressed.
Sustainability 2016, 8(12), 1301; https://doi.org/10.3390/su8121301
Submission received: 14 October 2016 / Revised: 5 December 2016 / Accepted: 8 December 2016 / Published: 12 December 2016
(This article belongs to the Special Issue Sustainability and Nuclear Power)

Abstract

:
Quantification of nuclear liability insurance is difficult without arbitrary liability caps; however, post-mortem calculations can be used to calculate insurance costs. This study analyzes the Fukushima (Daiichi) nuclear power plant disaster to quantify the cost per unit electricity ($/kWh) of nuclear energy from the lifetime of the plant after accounting for the true cost of the liability needed to cover the damages from the nuclear disaster determined from news reports. These costs are then compared to the cost of electricity currently paid by Japanese consumers, and then are aggregated to determine the indirect subsidy for nuclear power providers in both Japan and the USA. The results show that the reported costs of the Fukushima nuclear disaster are $20–525 billion, which results in a real insurance cost from the lifetime of electricity produced at the plants between $0.22–5.78/kWh. These values are far higher than the current insurance costs by Japanese law of $0.01/kWh and even the total costs consumers pay for electricity. Although the spread in the input costs is large and the reported metrics are incomplete, the nuclear insurance subsidy is clearly substantial in Japan and in the USA. Ideally, energy sources should be economically sustainable without the need for a government insurance subsidy. For the electricity market to function effectively and efficiently in all other countries using nuclear power, the insurance costs should be reported accurately and included in nuclear electricity costs without arbitrary government liability caps.

1. Introduction

In the event of a nuclear accident, liability insurance protections on nuclear reactors must be able to provide adequate monetary funds to fulfill public claims of personal injury and property damage. The magnitude of the encumbering costs associated with a nuclear disaster disallows private insurance agencies from realistically providing the appropriate lability insurance [1]. In all likelihood, the costs of a large-scale nuclear energy disaster would bankrupt the representing insurance agency [2]. To provide the nuclear industry with the appropriate means to construct a nuclear reactor, in 1957 the U.S. government passed legislation entitled the Price–Anderson Nuclear Industries Indemnity Act (PAA). In practice, the PAA requires all private non-military nuclear facilities in the USA to supply a maximum allotted primary liability of $375 million [3]. This arbitrary upper limit allows nuclear energy facilities to acquire liability insurance. According to the United States Nuclear Regulatory Commission (U.S. NRC) Office of Public Affairs the PAA legislation has increased the “limit of liability” (i.e., the nuclear disaster insurance pool) to over $12 billion in total. The provided insurance pool is split into a primary and secondary tiered structure. In the first tier, nuclear power plants pay the $375 million premium per year to private insurance entities for offsite liability per reactor site. If the disaster damages exceed the initial $375 million, the second tier is utilized, where each private licensee is provided a prorated amount of just over $121 million per reactor. Currently, there are 104 reactors eligible to qualify for the PAA insurance subsidy in the USA. Thus, the second tier, in total, contains nearly a $12.6 billion insurance pool [3]. Effectively, any liability in excess of $12.6 billion forces the U.S. Congress to cover the cost burden. As there is no payment unless a catastrophe occurs there is no direct subsidy, but this public cost burden is an indirect subsidy because the costs of operating a nuclear power plant would be far higher than currently accounted for if full accident liability were to be taken into account. The U.S. NRC concluded that the liability limits provided by nuclear insurance were significant enough to constitute a subsidy, but a quantification of the amount was not attempted [4]. While low-probability risks are familiar in many disciplines such as structural and safety engineering, insurance, financial and electricity markets, and climatology [5], this kind of statistical analysis has, unfortunately, seldom been applied to economics of nuclear liability. This represents a significant impediment to enabling the free market to appropriately choose an electricity source based on full costs.
Quantification of appropriate liability protections is difficult with estimation alone. However, post-mortem calculations can be made with better accuracy after an accident. This paper uses the Fukushima (Daiichi) nuclear power plant disaster, for the first time, to aid in cost modeling nuclear energy insurance. Specifically, this paper will quantify the cost per unit electricity (USD/kWh) of nuclear energy after properly accounting for the true cost of the liability insurance needed to cover the damages from the Fukushima disaster. These costs are then compared to the cost of electricity currently paid by Japanese consumers and then aggregated to determine the indirect subsidy for nuclear power providers in both Japan and the USA. Thus, an accurate cost analysis is to be presented to quantify the PAA indirect subsidy for nuclear power providers, so that the market can function effectively in the USA and all other countries using nuclear power. This method of analysis has not been used previously.

2. Background

2.1. Fukushima (Daiichi) Summary

The Fukushima (Daiichi) nuclear power plant consists of six General Electric (GE) light water boiling water reactors (BWRs) with a combined power of 4.7 gigawatts (GWe), making it one of the world’s 25 largest nuclear power stations. It was the first GE-designed nuclear plant to be constructed and run entirely by the Tokyo Electric Power Company (TEPCO, Tokyo, Japan). Operational history/timeline of the six reactors is displayed in Table 1.
In a BWR a nuclear power plant’s thermal energy created from fission is utilized to turn water into steam to drive turbines and ultimately an electrical generator. Subsequently, the generated steam is transformed back into water via a condenser and pumped back into the core of the reactor. A complete lifetime electrical profile for Fukushima (Daiichi), as provided by the International Atomic Energy Agency (IAEA), is shown in Table 2.

2.2. Fukushima (Daiichi) Nuclear Disaster

On Friday 11 March 2011 a magnitude 9.0 earthquake impacted the eastern coat of Japan. According to the World Nuclear Association (WNA), the earthquake originated 130 km offshore and resulted in a 650 km length of sea floor shift of 10–20 m, while in the mainland of Japan the entire country shifted [7]. Following the earthquake was a tsunami that ultimately led to the demise of the Fukushima (Daiichi) facility. The tsunami waves crippled the power supply and cooling systems (i.e., the nuclear power plant facilities lost the ability to control water circulation and reactor cooling functions [7]). While the nuclear power plant was capable of maintaining control as result of an earthquake, the nuclear incident on 11 March 2011 was the result of the nuclear power plant’s failure to adequately cool the reactor core (more specifically to remove the decay heat) as a result of the damage sustained after the tsunami. The American Nuclear Society (ANS) compiled the operational status of each BWR reactor before and after the tsunami/earthquake. The information specific to the Fukushima (Daiichi) site is displayed in Table 3.

3. Methods

3.1. Fukushima (Daiichi) Clean-Up Cost Analysis

A complete cost analysis of the Fukushima (Daiichi) nuclear disaster is difficult to quantify accurately as it is necessary to establish the primary metrics by which all direct and indirect costs are evaluated. A system of metrics allows all costs to be weighted proportionally to allow a fair and rational quantitative cost summation. At this time, numerous research agencies and government organizations have produced elaborate reports describing all significant findings of the Fukushima disaster. Particularly useful to understanding the disaster from a technical perspective are the ANS and IAEA reports, which provide scientific information regarding: accident analysis/assessment, emergency analysis, radiological health physics, and post-accident recovery/cleanup [9]. The science and engineering behind the disaster are paramount in the case of both reports, which unfortunately did not allow for sufficient depth regarding the economic analysis of the Fukushima nuclear accident. The ANS reports a collaborative study between Tokyo Electric Power Company (TEPCO) and the Japanese government. Approximately $15 billion was determined to be required for properly decommissioning the four reactors. Meanwhile the IAEA report presents only off-site decontamination budget figures in yen/m2. Conversely, the World Nuclear Association recently published a July 2016 update to their Fukushima accident report [7]. The report highlights the cost implications of both liability concerns and payable compensation packages to the parties affected. Similar to private owners of U.S. nuclear facilities, the Japanese government has two laws governing the plant operator liability in the event of a disaster. The Law on Compensation for Nuclear Damage and Law on Contract for Liability Insurance for Nuclear Damage, require operators to provide $1.12 billion in financial security [7]. The report continues to evaluate agreements between TEPCO and the Japanese government in regards to refugee compensation and government aid/support. Specific to the Fukushima (Daiichi) situation, the Japanese government developed a state institution to provide in total $62 billion. The provided bonds act as a type of insurance to the nuclear industry in the event of another nuclear accident. In order for TEPCO to receive aid from the government there is an annual fee; however, the magnitude of that cost is not provided in the report. According to a collaborative report by the Organization for Economic Co-Operation and Development (OECD) and the Nuclear Energy Agency (NEA), as of 31 July 2012, TEPCO was placed under state control during bond payback period. Thus, TEPCO is 50% owned by the Japanese government, making it the largest majority shareholder [10]. In 2012 the Japanese Atomic Energy Insurance Pool (JAEIP), comprised of 23 industry insurers, distributed $1.56 billion in funds to TEPCO [11]. As of 2012 the pool will not continue to back TEPCO; it is assumed that the fund/pool cannot continually provide financial aid of this magnitude. As stated above, establishing the costs of the disaster is of the upmost importance for quantitative analysis of appropriate nuclear insurance rates. To aid in this endeavor, multiple news sources with articles on Fukushima (Daiichi) containing cost reporting have been reviewed. Specifically, articles were collected from seemingly reputable news sources from 2011 to 2016. News sources were selected based on their inclusion in major mainstream media sources, which are generally regarded to provide accurate information and play a role in policy formation. The selected time span allows for reported data from multiple time perspectives (i.e., near the Fukushima (Daiichi) disaster occurrence and hindsight on the event upon engineering review). Collected articles were categorized based upon the cost metrics the news source reported, providing insight into the potential cost implications of a nuclear disaster. In total eight articles were selected from the most respected and largest news sources (Bloomberg, CNN, The Economist, Forbes, The Guardian, Reuters, The Wall Street Journal, and The Washington Post). The costs are reported for any metric (clean-up costs, refugee compensation, etc.) in which the news source provided a quantitative value. Summation of the reported costs is then utilized for Fukushima (Daiichi) economic impact estimations and modeling scenarios presented. It should be noted that all economic values are given in 2016 U.S. dollars unless otherwise noted. In addition, yen is reported when a quantity that was originally reported was sourced in yen.

3.2. Yearly Electrical Consumption Cost per Household (USD) for Insurance due to Fukushima Disaster

A report published by Japan’s Statistics Bureau describes the country’s yearly electrical usage and distinguishes the production method (nuclear, thermal, hydro, or other). Table 4 describes data presented in the Statistic Bureau’s Ministry of Internal Affairs and Communications (MIAC) report [12].
The MIAC report utilized to produce Table 4 reports approximately 51.8 million active households, including; single person, nuclear, third generation, and other [12]. The statistical household quintile data, also reported by the MIAC, allows for the determination of average yearly electrical energy costs throughout all quintiles. Averaging all five quintile distinctions yields a yearly electrical energy cost of 223,631 yen (~$2119) [12]. The average, multiplied over the entire Japanese population (51.8 million), equates to ~$110 billion. From Table 4 the 2010 values will be utilized to determine the true cost of nuclear power once the insurance subsidies and full disaster costs are taken into account. Approximately 24.9% of all electrical power generated in 2010 in Japan was from nuclear power plant sources. Visualizing the relative production percentage in monetary terms shows that Japanese citizens and industries pay ~$27 billion yearly for power produced by nuclear power plants. The 2015 Statistical Handbook of Japan reports that, in total, 931,059 million kWh of electrical energy were utilized by the population from electrical utilities [12]. All nuclear energy facilities, like TEPCO’s Fukushima (Daiichi), produced 231,833 million kWh alone. Thus, Equation (1) allows for a determination of the average cost for nuclear energy paid by consumers and industries. Utilizing the values reported above, the average cost of nuclear energy utility is $0.12/kWh (12.67 yen/kWh).
N u c l e a r   E n e r g y   U t i l i t y = ( E H C H ) × N
where:
  • EH = Total household yearly expenditure over 51.8 million households (units: USD/kWh) [12]
  • CH = Total household yearly consumption (kW-h) over 51.8 million households [12]
  • N = Nuclear Energy Utilization (24.9%) [12]
Ikarii et al. of the Institute of Energy Economics, Japan’s (IEEJ) Energy Data and Modeling Center, reports that as a result of the Great East Japan Earthquake both low-income and high-income households have witnessed a significant increase in electricity costs [13]. Specifically, Ikarii evaluates the impact of rising energy costs on each economic bracket along with regional variances. In these analyses, the Energy Engels Coefficient (EEC) is the most critical metric as it relates to the total energy cost relative to the total household expenditure. The EEC quantifies the total energy cost, which includes utilities such as electricity, kerosene, gas, and gasoline. In 2014 low-income households, earning approximately 2 million yen/year (~$19,000/year), paid 1.5 million (~$14,300/year) yen on housing per year, with 210,000 yen ($2000) solely for electrical energy [13]. In comparison, high-income households, greater than 15 million yen/year (~$143,000/year), paid 6.39 million yen (~$61,000) on housing per year, with 389,000 yen ($3700) for electrical consumption [13]. Equation (2) allows for a determination of EEC provided the given metrics are available:
E n e r g y   E n g e l s   C o e f f i c i e n t   %   ( E E C ) = ( C q u i n t i l e   I V H q u i n t i l e   I V ) × 100 ,
where:
  • Cqunitile I–V = Total quintile relative to electricity cost [12];
  • Hquintile I–V = Total quintile relative to housing expenditure [12].
Determined EEC values enable us to compare the electrical consumption cost relative to each quintile. By identifying the proportioned amount of energy produced by nuclear power plant facilities and the Fukushima (Daiichi) disaster, a semi-quantitative comparison is possible. The economic impact (EEC) placed upon the Japanese citizens as a result of proper cost accounting procedures will be identified with deviation in the EEC value over a specific timeline. Specifically, this study will compare the 2010 EEC determination without insurance disasters costs, as reported by Japan’s Statistics Bureau, Ministry of Internal Affairs and Communications (MIAC), to those costs collected from news sources.

4. Results

4.1. Fukushima (Daiichi) Clean-Up Cost

Table 5 provides a comparison not only of reported costs, but of the gradations by which the costs are labeled or categorized. Costs have been summarized for the following sources: Bloomberg, CNN, The Economist, Forbes, The Guardian, Reuters, The Wall Street Journal, and The Washington Post.
It is clear from the survey of the mainstream media shown in Table 5 that there is a lack of quality sourced information depicting the cost metrics of the Fukushima accident. Not only do the vast majority of the available news resources fail to account for many of the cost categories, but they also fail to establish the same magnitude within a given category. Cost metrics of refugee compensation, decommissioning costs, and decontamination costs are the most abundantly reported, with three out of the utilized eight sources reporting in the same category/metric. The reported costs differ by $9.6 billion, $5.9 billion, and $39.7 billion, respectively. Meanwhile, lesser-reported metrics, such as government buoy/aid, with two sources reporting, differ by $27 billion. Beyond the inconsistency in the categories, Table 6 describes all noted costs reported by the news agencies and Table 5, including the total average and standard deviation of the dataset. News sources CNN and The Washington Post did not report any cost metrics and are not included in the future analyses. The significant deviation between the reported total costs calls into question the validity of the reported data by the news agencies sourced. For example, The Guardian value, which is the lowest reported cost, only includes nuclear fuel removal cost at $20 billion. The Economist, Forbes, and Reuters are equivalently comprehensive, with four cost metrics reported. However, the four metrics are not the same in any case. Acknowledging the clear weakness of these input parameters, the average values of the combined cost metrics will be utilized in a sensitivity analysis to estimate the true cost of a major nuclear accident and then determine the appropriate liability costs per unit energy in Japan. The limitations of the current reporting on this issue will be analyzed carefully in the discussion.

4.2. Insurance Cost per Unit of Energy (USD/kWh) for Nuclear Power Plant Fukushima (Daiichi)

Reported cost metrics for the Fukushima (Daiichi) disaster have been utilized as a model to determine the true cost of insurance (USD/kWh) for the electricity produced there. This is done by using the total reported costs (Table 6) and the total supplied kWh output for the lifetime of Fukushima (Daiichi), a USD/kWh value determinable with Equation (3):
I E =   C D 1 6 1970 2011 E y , n ,
where:
  • IE = Fukushima (Daiichi) nuclear insurance cost per unit of energy (Units: USD/kWh)
  • CD = Tabulated / estimated insurance costs (Units: USD) [14,15,16,17,18,19,20,21]
  • Ey,n = Tabulated energy produced during Fukushima (Daiichi) reactors 1–6 lifetime [6]
The magnitude of the insurance subsides and premiums offered by the U.S. government will be compared to the true costs, using the Fukushima (Daiichi) model as an example.
Table 7 presents the total cost and corresponding true insurance cost per unit of energy (USD/kWh) based on the reported cost values from the news source for the Fukushima (Daiichi) nuclear power plants.

4.3. Comparing Reported Nuclear Power USD/kWh to Researched True Nuclear Insurance Cost Subsidy USD/kWh

Considering the evaluated costs of insurance (i.e., the true cost of a nuclear accident as shown in Table 7) to those reported in the 2016 IEEJ report (2010: $0.05/kWh and 2015: $0.06/kWh)) there is an apparent disconnect [22]. Preemptively paid insurance premiums and post-accident costs differ by at least 4× and go up to several orders of magnitude. Thus, it appears clear that nuclear insurance policy is inappropriately low in Japan as it cannot cover the costs for this single accident, which is exceptional enough in magnitude for the Japanese government to consider it a “...grave natural disaster of exceptional character” [7]. All sources utilized for the cost determination of the Fukushima (Daiichi) disaster summarized in Table 7 indicate a significantly larger USD/kWh cost for nuclear energy. In effect, the pricing models presented by the IEEJ seem to exclude the presence of insurance cost beyond the minimum baseline required by Japanese law, which is only $1.12 billion [11], which results in an additional cost of only about $0.01/kWh/year. This is in stark contrast to the more comprehensive estimates from Forbes and The Economist, which create an additional cost of over $5.00/kWh.
The standard utility cost of nuclear energy as determined and the discovered insurance/clean-up costs are summed to yield a total cost of nuclear energy if the insurance premiums and excessive catastrophe costs were not covered by the Japanese government and/or similar support funding agencies. Specifically, the total kW-h output of the Fukushima (Daiichi) facility (Table 4) is conservatively compared to the MIAC reported 2010 Japanese nuclear energy consumption of ~232 billion kWh [12]. Extrapolating 2010 nuclear energy consumption over the ~51.8 million households at the previously calculated $0.12/kWh provides the pre-Fukushima (Daiichi) disaster consumption for the nuclear energy utility in 2010. Upon cost summation for the standard utility delivery, additional inputs are required to account for the insurance cost. Equation (4) describes the formulation. Table 8 presents the post-mortem (after Fukushima Daiichi accident) total yearly household energy costs for each news entity identified in Table 6 and Table 7 and describes the relative relationship between the standard nuclear utility and the cost of insurance (IE) counterpart.
C H I = C H × N × ( I E + 0.12 ) ,
where:
  • CH-I = Yearly electrical cost over 51.8 million homes, including insurance costs (Units: USD)
  • CH = Total household yearly consumption (kWh) over 51.8 million households [12]
  • N = Nuclear Energy Utilization (24.9%) [12]
  • IE = See Equation (3) and Table 6 (Units: USD/kWh)

5. Discussion

5.1. What Do the Results Mean for Japan?

Application of Equation (2) yields an EEC of 14% and 6.1% for low-income and high-income households, respectively. Comparing energy costs from 2000 to 2014, the total economic burden placed upon low-income households is more severe than the burden on high-income households. Low-income households suffered an increase EEC from 9.4% (2000) to 14% (2014), while high-income housing only saw a relative increase of 5.3% (2000) to 6.3% (2014) [13]. Greater expendable income means individuals/families in the high-income bracket could cut back on excessive use, but still have sufficient energy to maintain their lifestyle. Low-income families do not have the same luxuries (i.e., any cutback in energy consumption would result in a significant degradation to quality of life). Thus, low-income families are required to pay the, currently excessive, energy costs to sustain a manageable standard of living. These costs do not include the full cost of nuclear insurance.
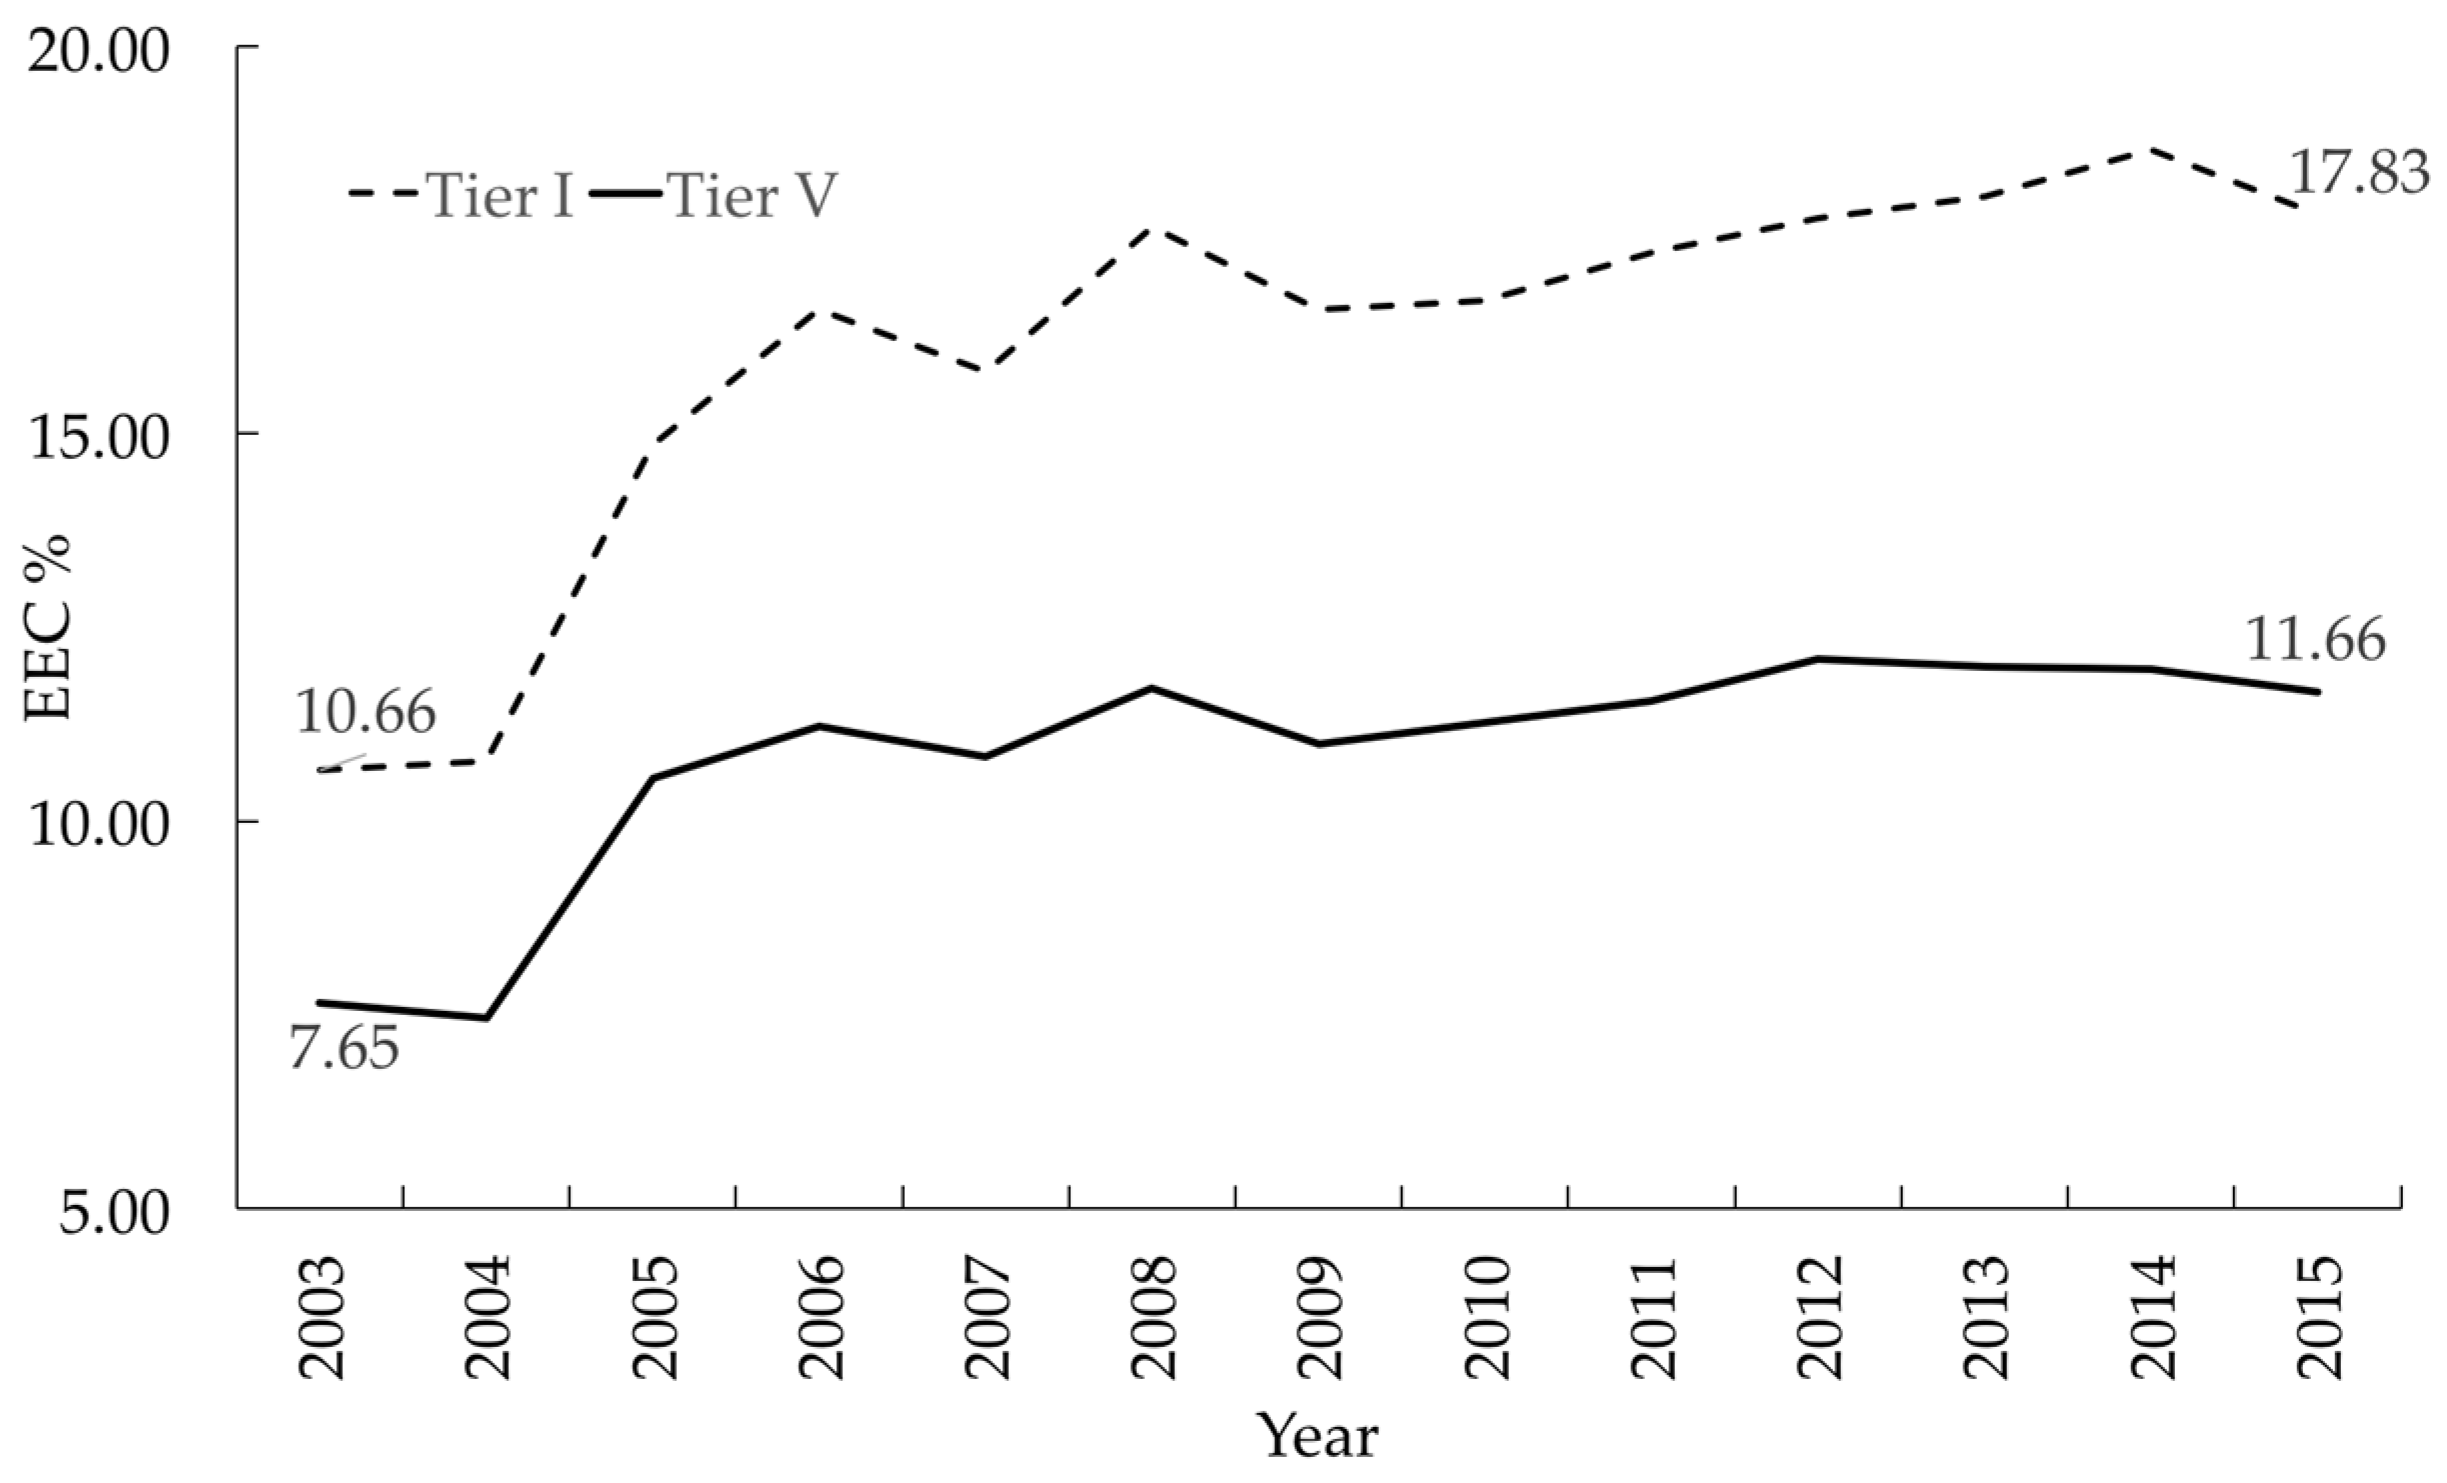
Another analysis was compiled from data collected by the Japan Statistics Bureau, Ministry of Internal Affairs and Communications (MIAC). Similar to Ikarii’s study, this analysis compares similar metrics from 2003 to 2015, while household income is divided into quintile groups. The approximate segregation in the year income quintiles are as follows: quintile I: maximum 2,680,000 yen (~$26,000), quintile II: 2,680,000 to 3,960,000 yen (~$26,000–39,000), quintile III: 3,960,000 to 5,400,000 yen (~$39,000–53,000), quintile IV: 5,400,000 to 7,780,000 yen (~$53,000–76,000), quintile V: minimum 7,780,000 yen (~$76,000) [23]. Figure 1 describes the trend of increased energy cost for low-income (quintile I) and high-income (quintile V) families for comparison to Ikarii’s study.
Table 9 displays the entire deviation for all noted quintiles from 2003 to 2015. Thus, it is again apparent that the increase in energy cost is a further burden upon the low-income tiered households.
The values described earlier evaluate the relative cost implications as a result of a significant decrease in the application of nuclear power plants for nuclear generation after the Great East Japan Earthquake. However, the figures do not yet account for the possible insurance cost(s) borne by Japanese energy providers and subsequently the consumers. By merging the calculated yearly electrical consumption costs per household (Table 8) with Fukushima (Daiichi) insurance costs, a new valid EEC value can be determined. Relative to low-income and high-income households, the redistributed EEC values are larger, in all circumstances, compared to the 2010 pre-disaster metrics. 
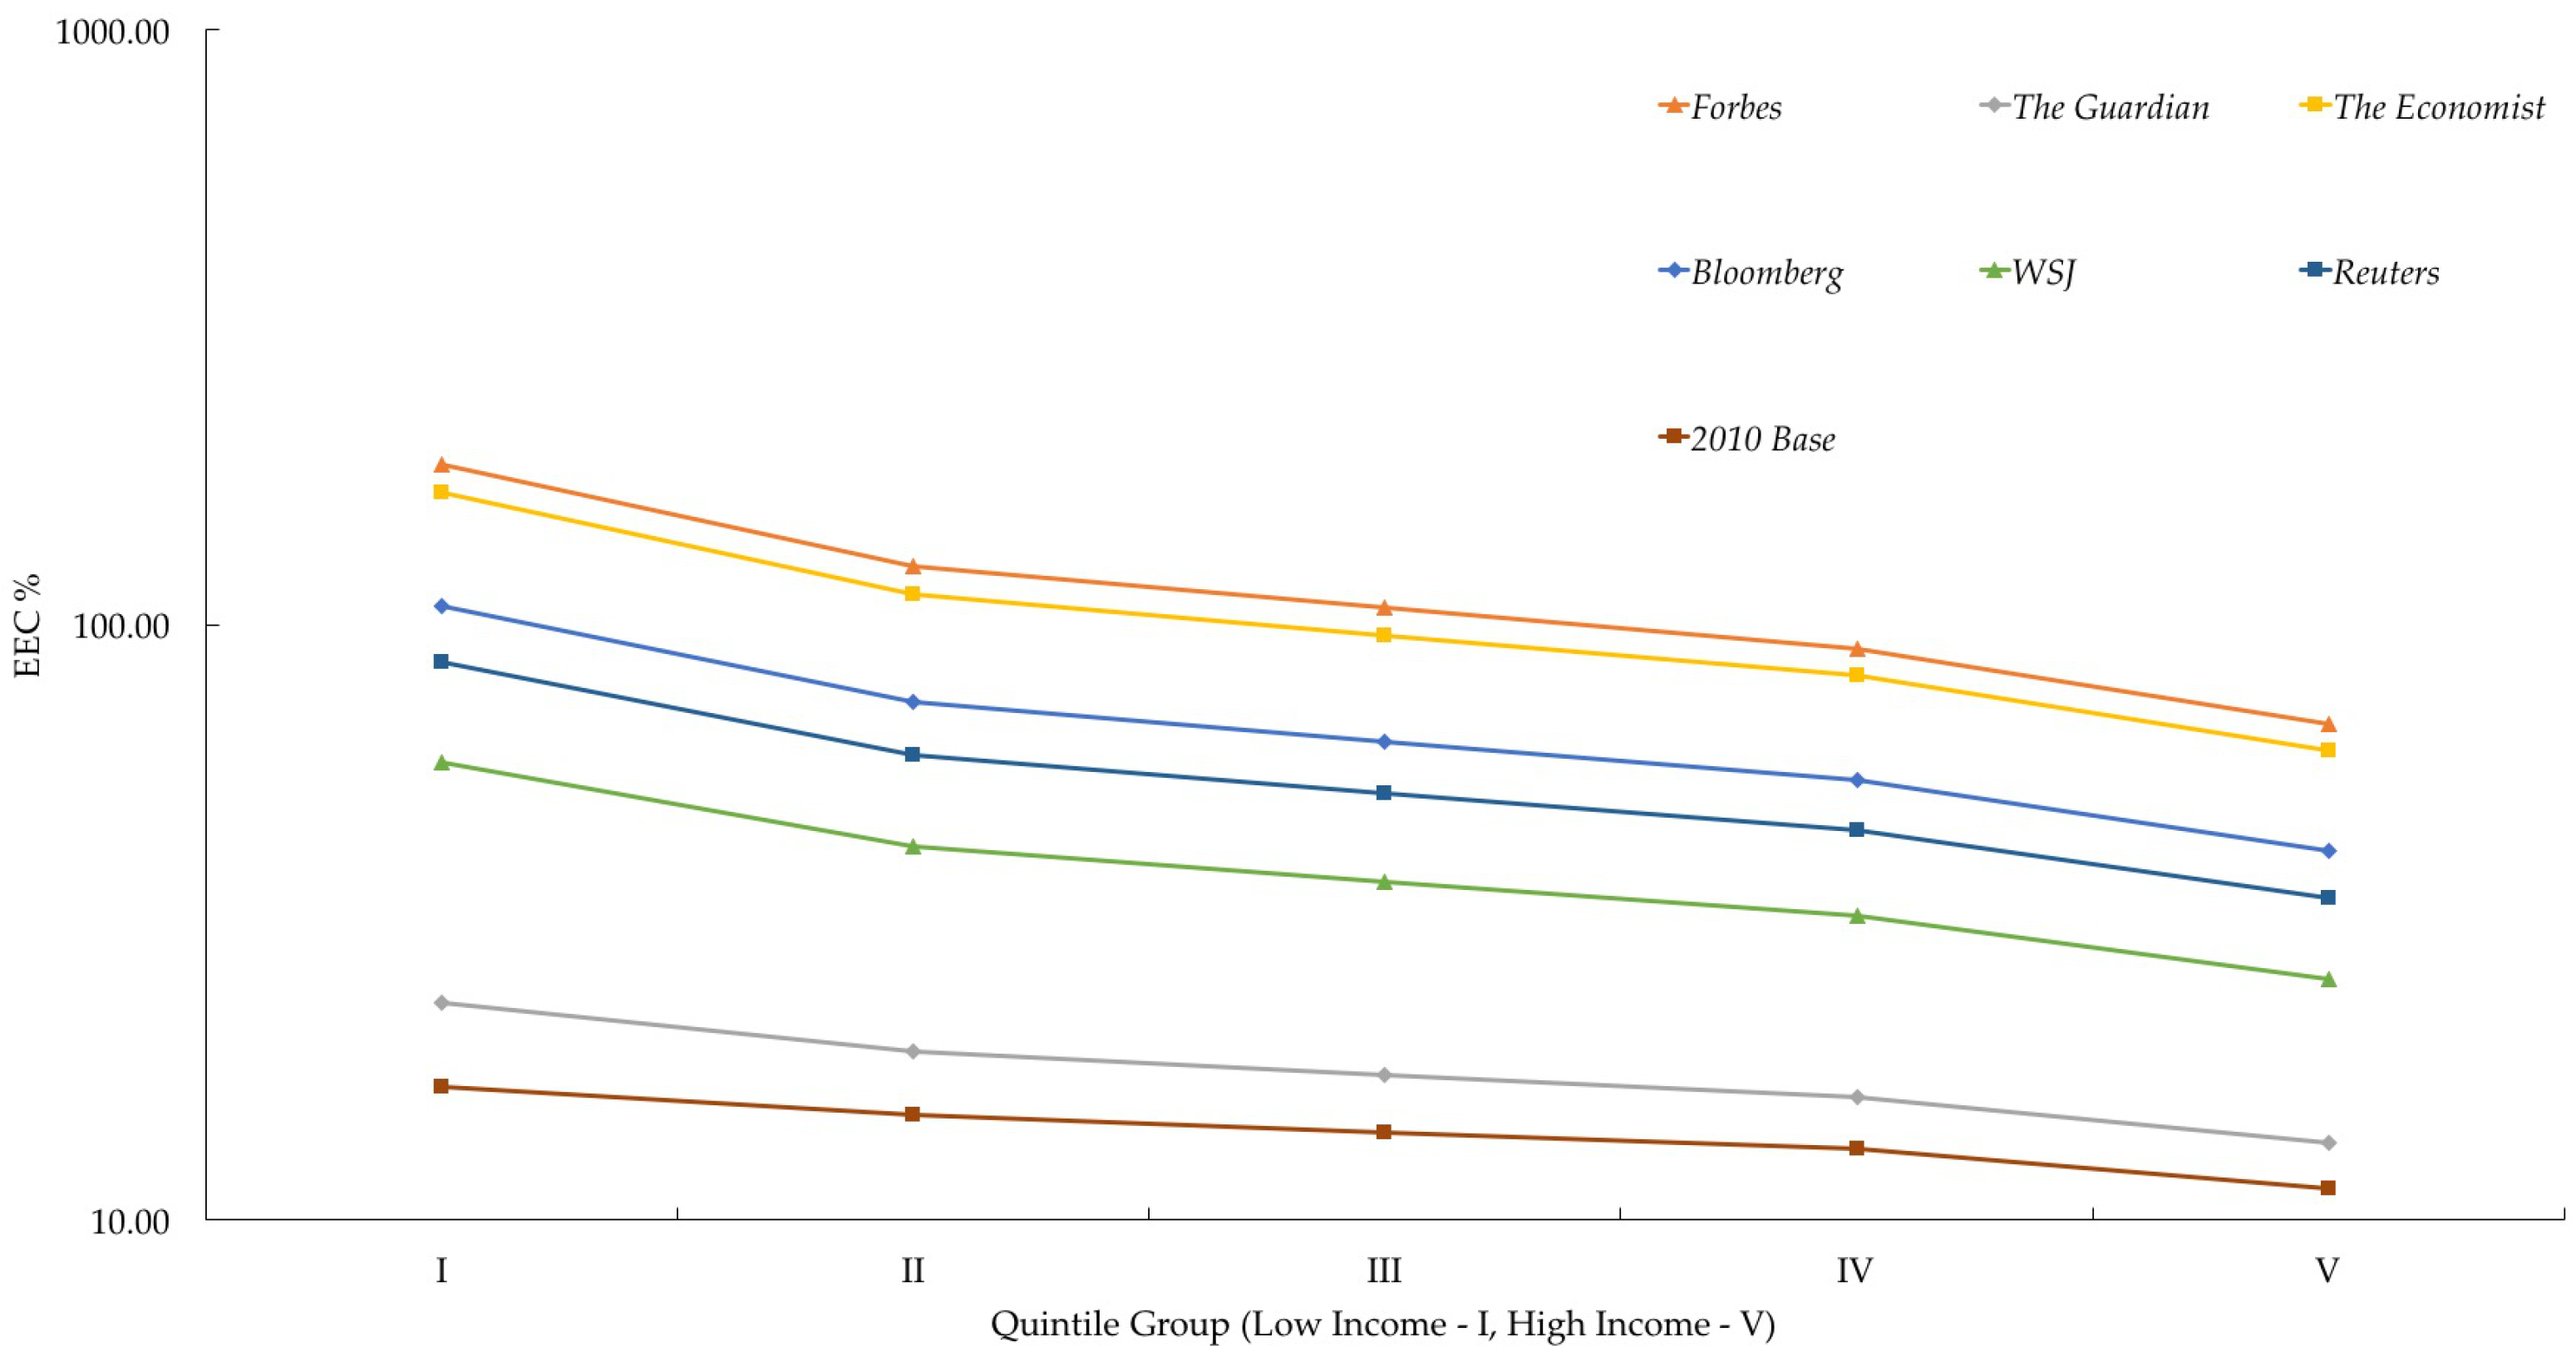
Figure 2 compares the traditional model for EEC in 2010 vs. the EEC calculated with insurance costs per news source.
Determined EEC metrics suggest that a significant, if not illogical, amount of consumer funds would have to be utilized to properly support the required insurance premiums of nuclear power plants. As demonstrated by Figure 2, for most low-income households, more than 100% of their expenditure would be needed solely to pay for electrical energy. In extreme cases, the true cost of the nuclear power plant generated electrical energy exceeds 250% of a household’s current total consumption expenditure. Further utilizing 2010 METI reported survey results, the total consumption expenditure for quintiles I, II, III, IV, and V was ~85%, 78%, 65%, 55%, and 48%, respectively, of their yearly income [12]. Thus, significant increases will result in a significant portion, if not all, of a household’s income being dedicated to paying the electricity bill. The extent of this cost is such that all quintiles will be affected to the fullest extent (i.e., it would impact their quality of life with regard to monetary freedom).

5.2. The Price–Anderson Act (PAA) and U.S. Government Indirect Nuclear Subsidy in Perspective

The academic literature currently provides limited thorough economic analyses of liability limits under the Price-–Anderson Act (PAA). To date, the most complete and comprehensive analysis was performed by Dublin and Rothwell in 1990 [23]. The study [24] aimed to compare the insurance premiums nuclear power plant operators currently pay under the PAA to the premiums weathered if facilities were responsible for full liability coverage in the absence of PAA limits. The work presented by Dublin and Rothwell is conservative (e.g., no health effects are included in the analysis). Thus, the estimated insurance subsidy per reactor was $60 million in 1982 [24]. The 1988 amendments to the PAA increased the total provided coverage to $7 billion, which consequently reduces the subsidy per reactor to $22 million. In total, by 1988 the total subsidy available to the nuclear industry was $111 billion. In 1998, Heyes and Liston-Heyes published an article that modified the methodology applied by Dublin and Rothwell with regard to the insurance arrangements. The article suggests that Dublin and Rothwell’s method misinterpreted the terms on which the insurance arrangements are applied [25]. The corrections presented reduce the reported subsidy per reactor by a factor of four and 10. Specifically, the Price–Anderson liability limit was $13.32 million before the 1988 amendments and $2.32 million after the amendments [25]. However, the correction presented implies that the current risk assumptions are correct (i.e., the provided nuclear subsidy is adequate for the risk environment of a nuclear power plant). In a 2003 publication, Heyes acknowledges the fact that he is merely an economist with limited understanding of the working principles of a nuclear facility. As such, economic models by Dublin and Rothwell, later re-imagined by Heyes-Liston Heyes, may not accurately present the true consequence-probability model [26]. While updating the 1988 estimate of $22 million per reactor to $33 million (2001 dollars) per reactor, Heyes suggests that the actual subsidy could be even higher. Heyes further describes an ideal situation in which a cost assessment, based on private industry nuclear knowledge, is readily available, however, such knowledge is not accessible. As a result of the lack of quantitative information, further economic analysis of nuclear power, as stated by Dublin, “depend[s] crucially on assumptions” [26].
Thus, Heyes’s 2003 estimate of $33 million (2001 dollars) per reactor can be compared to the values calculated for the Fukushima (Daiichi), a six reactor facility here. In an extremely conservative comparison, utilizing The Guardian’s relatively low estimate of $20 billion in insurance costs, distributed over Japan’s 43 operational reactors yields ~$456 million per reactor in the total required insurance pool. Thus, even using the lowest estimate, which excludes the vast majority of the liability, of Fukushima (Daiichi)’s real costs the equivalent U.S. subsidy amounts to over ~$192.3 million per reactor. Alternatively, utilizing the highest and most comprehensive estimates (e.g., The Economist), the total U.S. subsidy amounts climbs to ~$4.4 billion per reactor. The field of nuclear insurance subsidy remains considerably under-investigated, and although this study represents the most comprehensive to date because it uses post-disaster data (with the limitations of the data discussed above) it is instructive to compare it to the other studies conducted on the topic, which have focused on the USA. In all sources utilized, including Forbes, The Guardian, The Economist, The Wall Street Journal, Reuters, and Bloomberg, the reported insurance costs greatly exceed the current PAA insurance pool of $121 million per reactor.
To further clarify the magnitude of the evaluated costs, consider if the Fukushima (Daiichi) disaster costs were determined as a baseline analysis to be compared to the current U.S. government PAA subsidy. A six-reactor facility similar to Fukushima (Daiichi) would have been provided in total $726 million for cleanup compensation beyond the first-tier $375 million. Although this is a large sum, it is apparent that the subsidy fails to adequately provide a sufficient backing to a nuclear disaster by ~(-)180% by comparing insurance backing vs. actual. In the lowest estimates, The Guardian reports $20 billion in damages, which is ~$19 billion greater than the available PAA compensation that would be provided via the PAA insurance pool. In fact, the lowest reported cost of a nuclear facility with six reactors (Fukushima) is greater than the total insurance pool for the entire U.S. nuclear power plant fleet at $12.6 billion (utilizing 104 reactors). It has been claimed before that the building of a nuclear power plant is not possible without government involvement to cover accident liability [23]. The economic analysis, with regard to the value of the government subsidy, has not accounted for the excessive costs associated with a nuclear disaster. Although rare in occurrence, nuclear accidents’ costs and subsequent damages are not fully accounted for, as is evident by the deficit of PAA support vs. the cost of a six-reactor catastrophe.
For nuclear energy to be a prominent energy source, the economic, safety, engineering, and climatology impacts must be fully understood prior to becoming a sustainable energy source [27]. The aforementioned cost implications are not fully understood and as a result nuclear energy generation continues to be viewed by the public as an economically viable source. Nuclear insecurity must be reduced to prevent accidents like Chernobyl [28,29] and prevent new national sacrifice zones [30,31]. This means there is a need to reduce nuclear power risk factors, which include potential nuclear disasters due to accidents, negligence, poor design, natural disasters, and terrorism [32] (as a prime target, but also for theft and the creation of ‘dirty bombs’). The public is aware of the risks associated with nuclear power plants, as evidenced by, for example, the willingness of Chinese consumers to pay more for electricity to stop their communities from housing a nuclear power plant [33]. It is clear from this study, however, that, as seen in the past [34], the real economic costs of nuclear power far exceed the competing sources of electrical generation. It is also clear that when the full costs of insurance are included with current nuclear power systems, they are not economical. Furthermore, a government-provided insurance guarantee removes the economic incentive for the nuclear industry to seek private insurers. As a result, taxpayers are at risk of being subjected to continuous payments during operation and potential nuclear disaster of any nuclear power plant. Worse than this, the low liability cap placed upon the nuclear industry may not incentivize the nuclear power plant facilities to invest in proper safety measures [35]. Similarly, a liability cap of $75 million for offshore drilling could have been a contributing factor in the British Petroleum (BP) Gulf of Mexico oil disaster. BP will utilize $20 billion to correct this environmental disaster, which calls into question the economics of liability caps, including clean-up costs and safety incentives [36].

5.3. Availability and Accountability of Post-Disaster Economic Reporting

The results shown above underscore the need for high-quality journalism on issues related to public hazards, economics, and energy policy. The significant variability, ±$194 billion, apparent in the sourced Fukushima (Daiichi) cost accounting is troubling. Understandably, each news agency utilizes its own sources in reporting. For example, Forbes [17] used a secondary story about TEPCO [37] and data from Japan’s reconstruction agency [38] in the story. Other news providers like The Economist and CNN did not provide direct links to sources, but, for example, quoted former employees of Japan’s Atomic Energy Commission or TEPCO employees. In addition, some news agencies did not specifically cite a source (or a method) for their estimate. Thus, within the given dataset the validity of the reported cost data must be questioned. Specifically, the standard deviation is, relatively, the same magnitude as the dataset average of $262 billion. Statistically, in any another context outside the scope covered in this document, the validity of the reported data would be heavily questioned due to the relative size of the dataset’s standard deviation. Validity and accuracy in reporting should, again, be paramount. Incorrectly reported values published without due diligence or values not corrected as new information becomes available is irresponsible. The sources of data used here have made no retractions or published updated information other than what is cited here.
The importance of journalism to society [39,40] and particularly democracy [41,42,43] is not only generally accepted, but often held up as the factor that makes democracy possible. The influence of mass media and journalism on policy in a number of arenas is also well established [44,45,46,47,48,49,50,51]. Perhaps nowhere is this influence more important than when journalists inform the public about hazards; for hazards both commonplace and rare, the mass media is typically the primary source of knowledge for the public [52]. This heavy responsibility falls upon the media because their published information will shape the public perception of the hazard and often drive the resultant policy. This is a non-trivial challenge as, in general, large-scale hazards such as nuclear power disasters are complex and scientific hazard reports are long and include great detail highlighting all aspects of risk or an incident. Thus, as Singer’s research indicates, this results in news stories that omit results, overgeneralize scientific findings, omit discussion of research design and methods, and in some cases overdramatize the scientific findings [52]. This study investigates the potential impact of such journalistic failures by analyzing the effects of reporting on the inputs to calculating nuclear liability insurance subsidies and the resultant nuclear energy policy. As the results clearly show, mainstream media coverage of nuclear disaster costs is sorely lacking.
Some of these oversights can be partially explained by a general trend in reporting scientific information. Pulford’s [53] research claims that most scientific articles commonly contain errors. Unfortunately, there is variance in the methods of publication utilized by the scientific community as compared to the media [54]. Carsten and Illman further elaborate on the discourse between the two communities; scientists rely on objectivity and detail, while journalists write to both entertain and inform the public. Perhaps more important is the need for sufficient oversight of the generation of technical information. Maier’s cross-market analysis of 4800 news sources cited in 14 news articles identifies the newspapers’ accuracy and ultimate credibility [55]. The news sources surveyed lack understanding, suffer deadline pressure, and perform insufficient research, leading to publishing errors in 25.9%, 18.9%, and 17.3%, respectively, of the articles analyzed [55].
To help rectify this problem, there are several steps that can be taken. First, data should be accessible to the public (e.g., open access). With the advent of the Internet, journalists can now provide hyperlinks to direct sources, more in-depth explanations, actual studies, etc. from the electronic versions of their stories. Second, publication of scientific articles or news reports requires trustworthy, quantitatively accurate, and concise data. In cases of public subsidization of a particular technology/company are accompanied by acceptance of risks, the public must be quantitatively informed of those risks. If adequate resources (e.g., funding and support) are not available to the research entities (e.g., universities, NPOs, and government offices), the production of quality scientific data is difficult. Thus, thirdly, ensuring appropriate funding measures for scientific research into appropriate cost-benefit analysis of technologies that represent a hazard to the public is warranted and allows for legitimate policy discussion and reform.

6. Conclusions

This paper provided a review of the potential cost implications for nuclear power that result from a substantial nuclear disaster. By using the Fukushima (Daiichi) disaster as an economic model, cost reporting from multiple news sources and public offices was collected. The results of the cost summations indicate and identify multiple areas of improvement. First, the metrics by which costs are tabulated are highly variable between public entities and news sources. Secondly, the relative total cost deviation between each public entity and news source is significant enough to question the validity of the respective reports. However, in all circumstances, proper tabulation of lifetime cost metrics and subsequent total costs are critical to support energy policy reform and appropriate energy generation techniques. Inadequate techniques and reform lead to unfair economic burdens being placed upon the general population. It is the responsibility of scientists, journalists, and policy makers to properly analyze, report, and reform energy practices so that they are economically practical. Specifically for the United States, the models utilized suggest that the current economic subsidy pool provided by the Price–Anderson Act is not sufficient. In effect, the disaster insurance per reactor provided by the PAA alone will not cover the costs of a major nuclear accident. Ideally, nuclear power countries should maintain the ability for their industry to economically support recovery from at least one environmental disaster. The Fukushima (Daiichi) model has provided the following insights into nuclear energy: (i) the fundamental costs associated with a disaster may not be fully understood and/or be practically calculable; and (ii) the current risk factors are not properly accounted for in energy policy discussion. Thus, nuclear power states need to bear in mind the true cost of insurance required for a nuclear power plant.

Author Contributions

John Laureto completed the calculations and analysis and Joshua Pearce proposed the research ideas and analyzed the data. Both authors wrote and edited the paper.

Conflicts of Interest

The authors declare no conflict of interest.

References

  1. McNeil, B. The costs of introducing nuclear power to Australia. J. Aust. Polit. Econ. 2007, 59, 5–29. [Google Scholar]
  2. Pearce, J.M. Increasing PV velocity by reinvesting the nuclear energy insurance subsidy in large-scale photovoltaic production. In Proceedings of the 2009 34th IEEE Photovoltaic Specialists Conference (PVSC), Philadelphia, PA, USA, 7–12 June 2009; pp. 1338–1343.
  3. United States Nuclear Regulatory Commission (U.S. NRC). Backgrounder on Nuclear Insurance and Disaster Relief. Available online: http://www.nrc.gov/reading-rm/doc-collections/fact-sheets/nuclear-insurance.html (accessed on 30 June 2016).
  4. United States Nuclear Regulatory Commission. The Price-Anderson Act: The Third Decade; NUREG-0957; United States Nuclear Regulatory Commission: Washington, DC, USA, 1983.
  5. Hultman, N.E.; Koomey, J.G.; Kammen, D.M. What History Can Teach Us about the Future Costs of U.S. Nuclear Power. Environ. Sci. Technol. 2007, 41, 2087–2094. [Google Scholar] [CrossRef]
  6. International Atomic Energy Agency (IAEA). Power Reactor Information System (PRIS). Available online: https://www.iaea.org/pris/CountryStatistics/CountryDetails.aspx?current=JP (accessed on 1 July 2016).
  7. World Nuclear Association (WNA). Fukushima Accident; WNA: London, UK, 2016; Available online: http://www.world-nuclear.org/information-library/safety-and-security/safety-of-plants/fukushima-accident.aspx (accessed on 16 July 2016).
  8. Klein, D.; Corradini, M. Fukushima Daiichi: ANS Committee Report; American Nuclear Society: La Grange Park, IL, USA, 2012. [Google Scholar]
  9. International Atomic Energy Agency (IAEA). The Fukushima Daiichi Accident; International Atomic Energy Agency: Vienna, Austria, 2015; Available online: http://www-pub.iaea.org/books/IAEABooks/10962/The-Fukushima-Daiichi-Accident##description http://www.world-nuclear.org/information-library/safety-and-security/safety-of-plants/fukushima-accident.aspx (accessed on 15 July 2016).
  10. Organization for Economic Co-Operation and Development. Japan’s Compensation System for Nuclear Damage as Related to the TEPCO Fukushima Daiichi Nuclear Accident; OECD Publishing: Paris, France, 2012; Available online: https://www.oecd-nea.org/law/fukushima/7089-fukushima-compensation-system-pp.pdf (accessed on 22 June 2016).
  11. World Nuclear Association (WNA). Liability for Nuclear Damage; WNA: London, UK, 2016; Available online: http://www.world-nuclear.org/information-library/safety-and-security/safety-of-plants/liability-for-nuclear-damage.aspx (accessed on 13 June 2016).
  12. Statistics Bureau, Ministry of Internal Affairs and Communications (MIAC). Available online: http://www.stat.go.jp/english/data/handbook/c0117.htm#c07 (accessed on 15 June 2016).
  13. Ikarii, R.; The Institution of Energy Economics Japan (IEEJ). Household Energy Burden in Japan—Efficient Energy Subsidy Systems Should Be Provided to Low-Income Households. Available online: https://eneken.ieej.or.jp/data/5970.pdf (accessed on 14 July 2016).
  14. Bloomberg. Fukushima $137 Billion Cost Has Tepco Seeking More Aid. Available online: https://www.bloomberg.com/news/articles/2012-11-07/fukushima-137-billion-cost-has-tepco-seeking-more-aid (accessed on 15 June 2016).
  15. CNN. Japan: Fukushima Clean-up May Take up to 40 Years, Plant’s Operator Says. Available online: http://edition.cnn.com/2016/02/11/asia/japan-inside-fukushima-cleanup/ (accessed on 15 June 2016).
  16. The Economist. Fukushima Dai-ichi: Mission Impossible—An Industrial Clean-up without Precedent. Available online: http://www.economist.com/news/asia/21642221-industrial-clean-up-without-precedent-mission-impossible (accessed on 15 June 2016).
  17. Forbes. Energy: After Five Years, What Is the Cost of Fukushima? Available online: http://www.forbes.com/sites/jamesconca/2016/03/10/after-five-years-what-is-the-cost-of-fukushima/#770389e86016 (accessed on 15 June 2016).
  18. The Guardian. Environment: Five Years on, Cleanup of Fukushima’s Reactors Remains a Distant Goal. Available online: https://www.theguardian.com/environment/2016/mar/11/fukushima-daiichi-nuclear-reactors-decommission-cleanup-japan-tsunami-meltdown (accessed on 15 June 2016).
  19. Reuters. Technology: Japan Readies Additional $30 Billion for Fukushima Clean-up: Sources. Available online: http://www.reuters.com/article/us-japan-fukushima-borrowing-idUSBRE9AB0H520131112 (accessed on 15 June 2016).
  20. The Washington Post. Asian & Pacific: How is Fukuhsima’s Cleanup Going Five Years after Its Meltdown? Not So Well. Available online: https://www.washingtonpost.com/world/asia_pacific/five-years-after-nuclear-meltdown-no-one-knows-what-to-do-with-fukushima/2016/02/10/a9682194-c9dc-11e5-b9ab-26591104bb19_story.html (accessed on 15 June 2016).
  21. The Wall Street Journal. Japan News: Fukushima Still Rattles Japan, Five Years After Nuclear Disaster. Available online: http://www.wsj.com/articles/fukushima-still-rattles-japan-five-years-after-nuclear-disaster-1457482830 (accessed on 15 June 2016).
  22. The Institution of Energy Economics Japan (IEEJ). Expected Roles of IEEJ/APERC under the Uncertain Energy Situation. Available online: https://eneken.ieej.or.jp/data/6763.pdf (accessed on 19 June 2016).
  23. Statistics Bureau, Ministry of Internal Affairs and Communications (MAIC). Results of Total Households. Available online: http://www.stat.go.jp/english/data/sousetai/1.htm (accessed on 28 April 2016).
  24. Dubin, J.A.; Rothwell, G.S. Subsidy to nuclear-power through price-anderson liability limit. Contemp. Policy Issues 1990, 8, 73–79. [Google Scholar] [CrossRef]
  25. Heyes, A.G.; Liston-Heyes, C. Subsidy to nuclear power through Price-Anderson liability limit: Comment. Contemp. Econ. Policy 1998, 16, 122–124. [Google Scholar] [CrossRef]
  26. Heyes, A.G. Determining the price of Price-Anderson. Regulation 2003, 25, 105–110. [Google Scholar]
  27. Pearce, J.M. Limitations of nuclear power as a sustainable energy source. Sustainability 2012, 4, 1173–1187. [Google Scholar] [CrossRef]
  28. BBC News. Neighbours Count Cost of Chernobyl Disaster. BBC News, 26 April 1998. [Google Scholar]
  29. CBC News. The Catastrophe of Chornobyl. CBC News. 26 April 2006. Available online: http://www.cbc.ca/news/background/ukraine/chernobyl.html (accessed on 11 April 2012).
  30. Kuletz, V. Invisible Spaces, Violent Places: Cold War Nuclear and Militarised Landscapes. In Violent Environments; Peluso, N.L., Watts, M., Eds.; Cornell University Press: Ithaca, NY, USA, 2001. [Google Scholar]
  31. Hooks, G.; Smith, C.L. The Treadmill of Destruction: National Sacrifice Areas and Native Americans. Am. Sociol. Rev. 2004, 69, 558–575. [Google Scholar] [CrossRef]
  32. Behrens, C.; Holt, M. Nuclear Power Plants: Vulnerability to Terrorist Attack; Report for Congress, Order Code RS21131; Congressional Research Service: Washington, DC, USA, 2005.
  33. Sun, C.; Lyu, N.; Ouyang, X. Chinese public willingness to pay to avoid having nuclear power plants in the neighborhood. Sustainability 2014, 6, 7197–7223. [Google Scholar] [CrossRef]
  34. Zelenika-Zovko, I.; Pearce, J.M. Diverting indirect subsidies from the nuclear industry to the photovoltaic industry: Energy and financial returns. Energy Policy 2011, 39, 2626–2632. [Google Scholar] [CrossRef]
  35. Trebilcock, M.; Winter, R.A. The economics of nuclear accident law. Int. Rev. Law Econ. 1997, 17, 215–243. [Google Scholar] [CrossRef]
  36. White House Office of the Press Secretary. Statement by President Barack Obama; White House Office of the Press Secretary: Washington, DC, USA, 2010.
  37. Phys.org. TEPCO’s Fukushima Compensation Cost to Reach over $57 BN. Available online: http://phys.org/news/2015-07-tepco-fukushima-compensation-bn.html (accessed on 11 October 2016).
  38. Japan Reconstruction Agency. Efforts for Reconstruction. Available online: http://www.reconstruction.go.jp/english/ (accessed on 11 October 2016).
  39. Lowrey, W.; Anderson, W. The journalist behind the curtain: Participatory functions on the Internet and their impact on perceptions of the work of journalism. J. Comput. Med. Commun. 2005, 10. [Google Scholar] [CrossRef]
  40. Harcup, T. Questioning the ‘bleeding obvious’: What’s the point of researching journalism? Journalism 2012, 13, 21–37. [Google Scholar] [CrossRef]
  41. Carey, J.W. Afterword: The Culture in Question. In James Carey: A Critical Reader; Munson, E.S., Warren, A.C., Eds.; University of Minnesota Press: Minneapolis, MN, USA, 1997; p. 332. [Google Scholar]
  42. Schudson, M. News and Democratic Society: Past, Present, and Future. The Hedgehog Review, Institute for Advanced Studies in Culture, Summer. 2008. Available online: http://www.iasc-culture.org/eNews/2009_10/Schudson_LO.pdf (accessed on 5 December 2016).
  43. Usher, N.; Layser, M.D. The quest to save journalism: A legal analysis of new models for newspapers from nonprofit tax-exempt organizations to L3Cs. Available online: http://conference.freepress.net/sites/default/files/resources/488-1748-1-PB.pdf (assessed on 5 December 2016).
  44. Lambeth, E.B. Perceived influence of the press on energy policy making. J. Mass Commun. Q. 1978, 55, 11. [Google Scholar] [CrossRef]
  45. Cook, F.L.; Tyler, T.R.; Goetz, E.G.; Gordon, M.T.; Protess, D.; Leff, D.R.; Molotch, H.L. Media and agenda setting: Effects on the public, interest group leaders, policy makers, and policy. Public Opin. Q. 1983, 47, 16–35. [Google Scholar] [CrossRef] [PubMed]
  46. Atkinson, M.; Baumgartner, F.; Coggins, K.; Stimson, J. Mood and Agendas: Developing Policy-Specific Conceptions of Mood. In Proceedings of the Annual Meetings of the Midwest Political Science Association, Chicago, IL, USA, 2011.
  47. Stimson, J. Public Opinion in America: Moods, Cycles, and Swings, 2nd ed.; Westview Press: Boulder, CO, USA, 1999. [Google Scholar]
  48. Stimson, J. Tides of Consent: How Public Opinion Shapes American Politics; Cambridge University Press: New York, NY, USA, 2004. [Google Scholar]
  49. Enns, P.; Kellstedt, P. Policy Mood and Political Sophistication: Why Everybody Moves Mood. Br. J. Polit. Sci. 2008, 38, 433–454. [Google Scholar] [CrossRef]
  50. Robert, B.; Carmichael, J.; Jenkins, C. Shifting Public Opinion on Climate Change: An Empirical Assessment of Factors Influencing Concern over Climate Change in the U.S., 2012–2010. Clim. Chang. 2012, 114, 169–188. [Google Scholar]
  51. Bachner, J.; Hill, K.W. Advances in Public Opinion and Policy Attitudes Research. Policy Stud. J. 2014, 42, S51–S70. [Google Scholar] [CrossRef]
  52. Singer, E. A Question of Accuracy: How Journalists and Scientists Report Research on Hazards. J. Commun. 1990, 40, 102–116. [Google Scholar] [CrossRef]
  53. Pulford, D.L. Follow-up of Study of Science New Accuracy. Available online: http://search.proquest.com/openview/edf9cab2d44c082a5c106771cea89591/1?pq-origsite=gscholar (accessed on 20 July 2016).
  54. Carsten, L.D.; Illman, D.L. Perceptions of Accuracy in Science Writing. IEEE Trans. Prof. Commun. 2002, 45, 153–156. [Google Scholar] [CrossRef]
  55. Maier, S.R. Accuracy Matters: A Cross-Market Assessment of Newspaper Error and Credibility. J. Commun. Q. 2005, 82, 533–551. [Google Scholar] [CrossRef]
Figure 1. Rise in energy costs from 2003 to 2015 relative to low-income (Tier 1) and high-income households (Tier V) [23].
Sustainability 08 01301 g001
Figure 2. EEC% comparison to base 2010 METI values upon modeling Fukushima (Daiichi).
Sustainability 08 01301 g002
Table 1. Physical description and operational dates of Fukushima (Daiichi) Reactors [6].
Name/DescriptionFirst Grid Connection DatePermanent Shutdown DateReactor TypeNet Capacity (MWe)
Fukushima Daiichi-117 November 197019 May 2011BWR439
Fukushima Daiichi-224 December 197319 May 2011BWR760
Fukushima Daiichi-326 October 197419 May 2011BWR760
Fukushima Daiichi-424 February 197819 May 2011BWR760
Fukushima Daiichi-522 September 197717 December 2013BWR760
Fukushima Daiichi-64 May 197917 December 2013BWR1060
Table 2. Lifetime and average yearly electrical output of Fukushima (Daiichi) reactors [6].
Name/DescriptionLifetime Electrical Output (TWh)Average Yearly Electrical Output (±σ) (GWh) 1Average Annual Time Online (±σ) (h) 1
Fukushima Daiichi-182.351974.12 (1106.25)4726.45 (2530.51)
Fukushima Daiichi-2148.153857.78 (1585.06)5402.95 (2132.41)
Fukushima Daiichi-3155.94 4129.28 (1387.57)5707.13 (1763.84)
Fukushima Daiichi-4154.304528.18 (1490.63)6154.74 (1943.56)
Fukushima Daiichi-5156.434259.29 (1775.16)5800.35 (2337.03)
Fukushima Daiichi-6206.655899.66 (2392.47)5658.03 (2253.11)
1 Calculated from first grid connection to permanent shutdown date.
Table 3. Operational status of Fukushima (Daiichi) BWR reactors pre- and post-tsunami/earthquake [8].
NPS NamePower (MWe)Operational Status PRE-EventOperational Status POST-Event
Fukushima Daiichi-1460OperatingSignificant Damage
Fukushima Daiichi-2784OperatingSignificant Damage
Fukushima Daiichi-3784OperatingSignificant Damage
Fukushima Daiichi-4784Cold shutdown/outageSignificant Damage
Fukushima Daiichi-5784Cold shutdown/outage; RPV pressure testingReached cold shutdown 20 March 2011
Fukushia Daiichi-61100Cold shutdown/outage; RPV head onReached cold shutdown 20 March 2011
Table 4. Japan’s total electrical usage presented in millions of kWh [12].
YearElectrical Output by Type in Millions of kWh (Relative %) 1Total Yearly Output
ThermalHydroNuclearOther 2Total
2000669,177 (61.3)96,817 (8.9)322,050 (29.5)3456 (0.3)1,091,500
2005761,841 (65.8)86,350 (7.5)304,755 (26.3)4980 (0.4)1,157,926
2010771,306 (66.7)90,681 (7.8)288,230 (24.9)6671 (0.6)1,156,888
2012986,758 (90.2)83,645 (7.6)15,939 (1.5)7608 (0.7)1,093,950
2013987,586 (90.5)84,885 (7.8)9303 (0.9)8949 (0.8)1,090,723
1 Includes homeowner power generation; 2 Includes solar, wind, and geothermal generation.
Table 5. Estimated Fukushima (Daiichi) disaster costs (USD) per reported metric [14,15,16,17,18,19,20,21].
News Agency
Cost Metric (Billion USD)BloombergCNNThe EconomistForbesThe GuardianReutersThe Washington PostThe Wall Street Journal
Clean-up109--15-80--
Clean-up without Farming/Fishing Compensation--395-----
Refugee Compensation--5660-38-50
Production of Makeup Power Requirements---200----
Reconstruction/Recovery Cost---250----
Fuel Removal----20---
Ice Wall Building--0.272-----
Decommissioning9.8-9.7----20
Decontaminate/Compensate99----20.3-50
Government Buoy/Aid-----78-10
Table 6. Total cost averages and deviations in reporting Fukushima (Daiichi) cost metrics [14,15,16,17,18,19,20,21].
News AgencyTotal Reported Cost in USD (Japanese Yen)
Bloomberg$218 Billion (~22.6 Trillion Yen)
The Economist$461 Billion (~46.7 Trillion Yen)
Forbes$525 Billion (~53.1 Trillion Yen)
The Guardian$20 Billion (~2 Trillion Yen)
Reuters$216 Billion (~21.8 Trillion Yen)
The Wall Street Journal$130 Billion (~13.2 Trillion Yen)
AVERAGE~$262 Billion (~26.6 Trillion Yen)
ST. DEVIATION~$194 Billion (~19.6 Trillion Yen)
Table 7. Insurance cost per unit of energy USD.
News AgencyInsurance Cost $USD/kWh
Bloomberg2.40
The Economist5.08
Forbes5.78
The Guardian0.22
Reuters2.38
The Wall Street Journal1.43
Table 8. Japan’s true nuclear energy cost, including insurance.
SourceNuclear Insurance Cost in Comparison to Current Nuclear Utility Costs
IE + Std. Nuclear Utility Cost 1 (USD/kWh)Annual Electrical Consumption Cost 2 (Billions USD)Annual Electrical Consumption Cost per Household with No Insurance Included 3 (USD)Nuclear Insurance Cost per Household 4 (USD)
Bloomberg2.52 583 528.1210,741.50.69
The Economist5.19 1204 528.1222,714.82
Forbes5.90 1368 528.1225,868.29
The Guardian0.34 78 528.12985.46
Reuters2.50 579 528.1210,645.95
The Wall Street Journal1.55 359 528.126405.48
1 Includes standard calculated $0.12/kWh and Table 7 insurance costs; 2 Assumes the average yearly nuclear electricity consumer consumption 231,833 million kWh; 3 Only includes standard calculated $0.12/kWh; 4 Only includes insurance costs presented in Table 6.
Table 9. Japan’s dependency upon fossil fuels for power generation compared to other available sources [23]. Values are representative of their relative percentage of their use.
Yearly Household Income Quintile
IIIIIIIVV
Total Deviation (2003 to 2015)+7.18%+6.18%+5.13%+5.13%+4.02%

