1. Introduction
Due to the exhaustion of traditional fossil energy and deterioration of the ecological environment, renewable energy has been favored by many countries all over the world owing to its low pollution, being environmental friendly, renewable features and other characteristics [
1,
2]. China is a big nation in terms of energy consumption, and its current energy consumption place heavy reliance on fossil fuels, such as coal, oil, natural gas and so on. Consequently, the development of renewable energy has become China’s strategic choice for sustainable utilization of energy and energy security. Supported by national policy, China’s renewable energy power generation has been developing rapidly in last ten years, and wind power in China has the largest scale and fastest development in the world [
3]. The projection of the renewable energy provides alternative for sustainable utilization of energy in China. However, the characteristics of instability, random fluctuations, large-scale and centralized renewable development mode of renewable energy have brought great challenges to power grid planning and construction and operation in China [
4].
At present, there are still many problems in the development of regional power grid and renewable energy power supply [
5], such as uncoordinated planning, asynchrony between the approval and construction of supporting power grid projects, lack of uniform standard for grid connected technology, improper operation management of the grid, the incomplete economic incentive policies and so on [
6,
7]. In order to better grasp the status of regional power grid and renewable energy sources, we need a comprehensive evaluation index system urgently to improve the level of coordinated development, find key factors that affect the coordinated development and promote coordinated and sustainable development of regional power grid and renewable energy sources [
8,
9,
10].
Research on power network evaluation started earlier [
11,
12,
13,
14,
15], and the evaluation of traditional power grid is mainly from the perspective of network reliability, security, economy and power supply quality. According to the shortcomings of traditional evaluation methods of power grid, Cui
et al. [
8] presents the aspects of power grid planning evaluation index system from five aspects: power supply safety, power supply reliability, economy, adaptability and coordination. The gray theory is applied to the safety assessment of the power grid [
11]. Liu
et al. [
12] argues that the power grid construction can not only be limited to the economy of power grid investment, but also put forward that the evaluation system should include the network benefits, social benefits and long-term benefits in the economic evaluation system. The technical and economic level of the power grid is evaluated from different perspectives and directions [
11,
12], but it lacks of integrity and systematic evaluation of the power grid. On the evaluation of power grid planning, Liang [
13] constructs the comprehensive evaluation index system, but it lacks the consideration of power generation planning. On the evaluation of power generation planning, Yang
et al. [
14] proposes a comprehensive evaluation method based on multi attribute decision theory for distributed generation planning scheme, and then applied it to three kinds of micro power network schemes. According to the actual situation of Ningxia power grid, Gao
et al. [
15] constructs an index system that can be integrated to evaluate the rationality of the comprehensive utilization of resources and power point layout.
The meaning of “coordination” can be understood as the degree of matching and adaptation, and coordination of regional power grid and development of renewable energy power supply is the matching degree between the regional power grid and the renewable energy source, and also can be understood as the mutual adaptability between them [
16]. The coordination of regional power grid and renewable energy source is important basis for safe and stable operation of power network, which achieve full coordination in various links between power grid and power development. Otherwise, the security, economy and stability of power system cannot be guaranteed. Therefore, through the research of regional power grid and renewable energy power development coordination evaluation, we can find that it has very important practical significance to improve the coordination degree between regional power grid and renewable energy sources in different components and promote sustainable development of regional power grid [
17].
Due to randomness and volatility of the renewable energy generation, if it continues to use the traditional evaluation method and only evaluates from the view of single point and single project, it cannot get comprehensive and objective evaluation results of coordination development degree for the traditional power grid and renewable energy power. Currently, many scholars have conducted research on the coordinated development between them [
18,
19,
20,
21]. Wang [
18] establishes a complete evaluation system from power balance, peaking capacity, acceptance degree of wind power capacity, utilization degree of thermal power, power grid, power supply coordination construction and other aspects. The influence mechanism of photovoltaic grid connected to the traditional power network planning is analyzed and index system is constructed from the aspects of safety, reliability, economy and environment benefit [
19]. Dai
et al. [
20,
21] construct the evaluation index system of the coordinated development of renewable energy, smart grid and low carbon power network planning from power system, power transmission and distribution and scheduling. Wang
et al. [
18,
19] study the evaluation index of the development planning of power grid and power supply but not study the coordinated development between power supply and power network. Dai
et al. [
20,
21] present the coordination index of power network and power planning, but do not consider the index of construction coordination and operation coordination.
Through the review and summary of the literature, it can be found that there are still some deficiencies in the research on coordinated development of traditional power grid and renewable energy grid. The research angle is mainly concentrated in power generation process, but the coordination of the transmission, distribution and scheduling is less considered. The main methods for the evaluation of coordinated development between power grid and renewable energy are analytic hierarchy process and fuzzy comprehensive evaluation method. Fuzzy comprehensive evaluation method itself is subjective and arbitrary, and the process of quantification for qualitative indicators is relatively rough. Compared with general fuzzy comprehensive evaluation, the objectivity of analytic hierarchy process (AHP) is improved. But when there are many factors, the workload is bigger. At the same time, the existing quantitative information is not fully utilized. Therefore, we need to build a comprehensive index system and select a more intelligent and reasonable method to improve the reliability of coordinated development evaluation for traditional power grid and renewable energy supply. Due to its simple principle and flexible application, TOPSIS method has been used in many fields, such as management, medicine, military, environmental protection, etc. This method can make full use of the existing information, and can enhance the objectivity of the evaluation result. Besides, the calculation is simple. Based on this, this paper designs the evaluation index system from three aspects of power generation, transmission, distribution and scheduling, and combines the characteristics of the entropy weight method, the matter element extension and the TOPSIS algorithm for complementary advantage to improve reliability of the evaluation. The innovations of this paper are as follows:
(1) Considering the two main bodies of regional power grid and renewable energy power generation, a comprehensive evaluation index system is constructed from the three aspects of power generation, transmission, distribution and scheduling. That is to say, not only the power generation needs of renewable energy sources, but also the security, stability and economic operation of power systems are taken into account.
(2) In view of the problem that the index weight of TOPSIS comprehensive evaluation model is difficult to determine, this paper uses the entropy weight method to determine the weight of each evaluation index, and overcomes the defects of the traditional model.
(3) As the TOPSIS method can only sort the evaluation results of each project and cannot get the evaluation classification, this paper introduces matter element extension theory to improve the traditional TOPSIS.
Combined with the characteristics of the above three algorithms, this paper innovatively constructs combined evaluation model. Based on the index data of Ningxia power grid and renewable energy sources, the evaluation model is applied to empirical study. The research results show that the model is consistent with the actual situation in Ningxia, which has a certain reference value.
2. Coordinated Development Index System for Regional Power Grid and Renewable Energy Supply
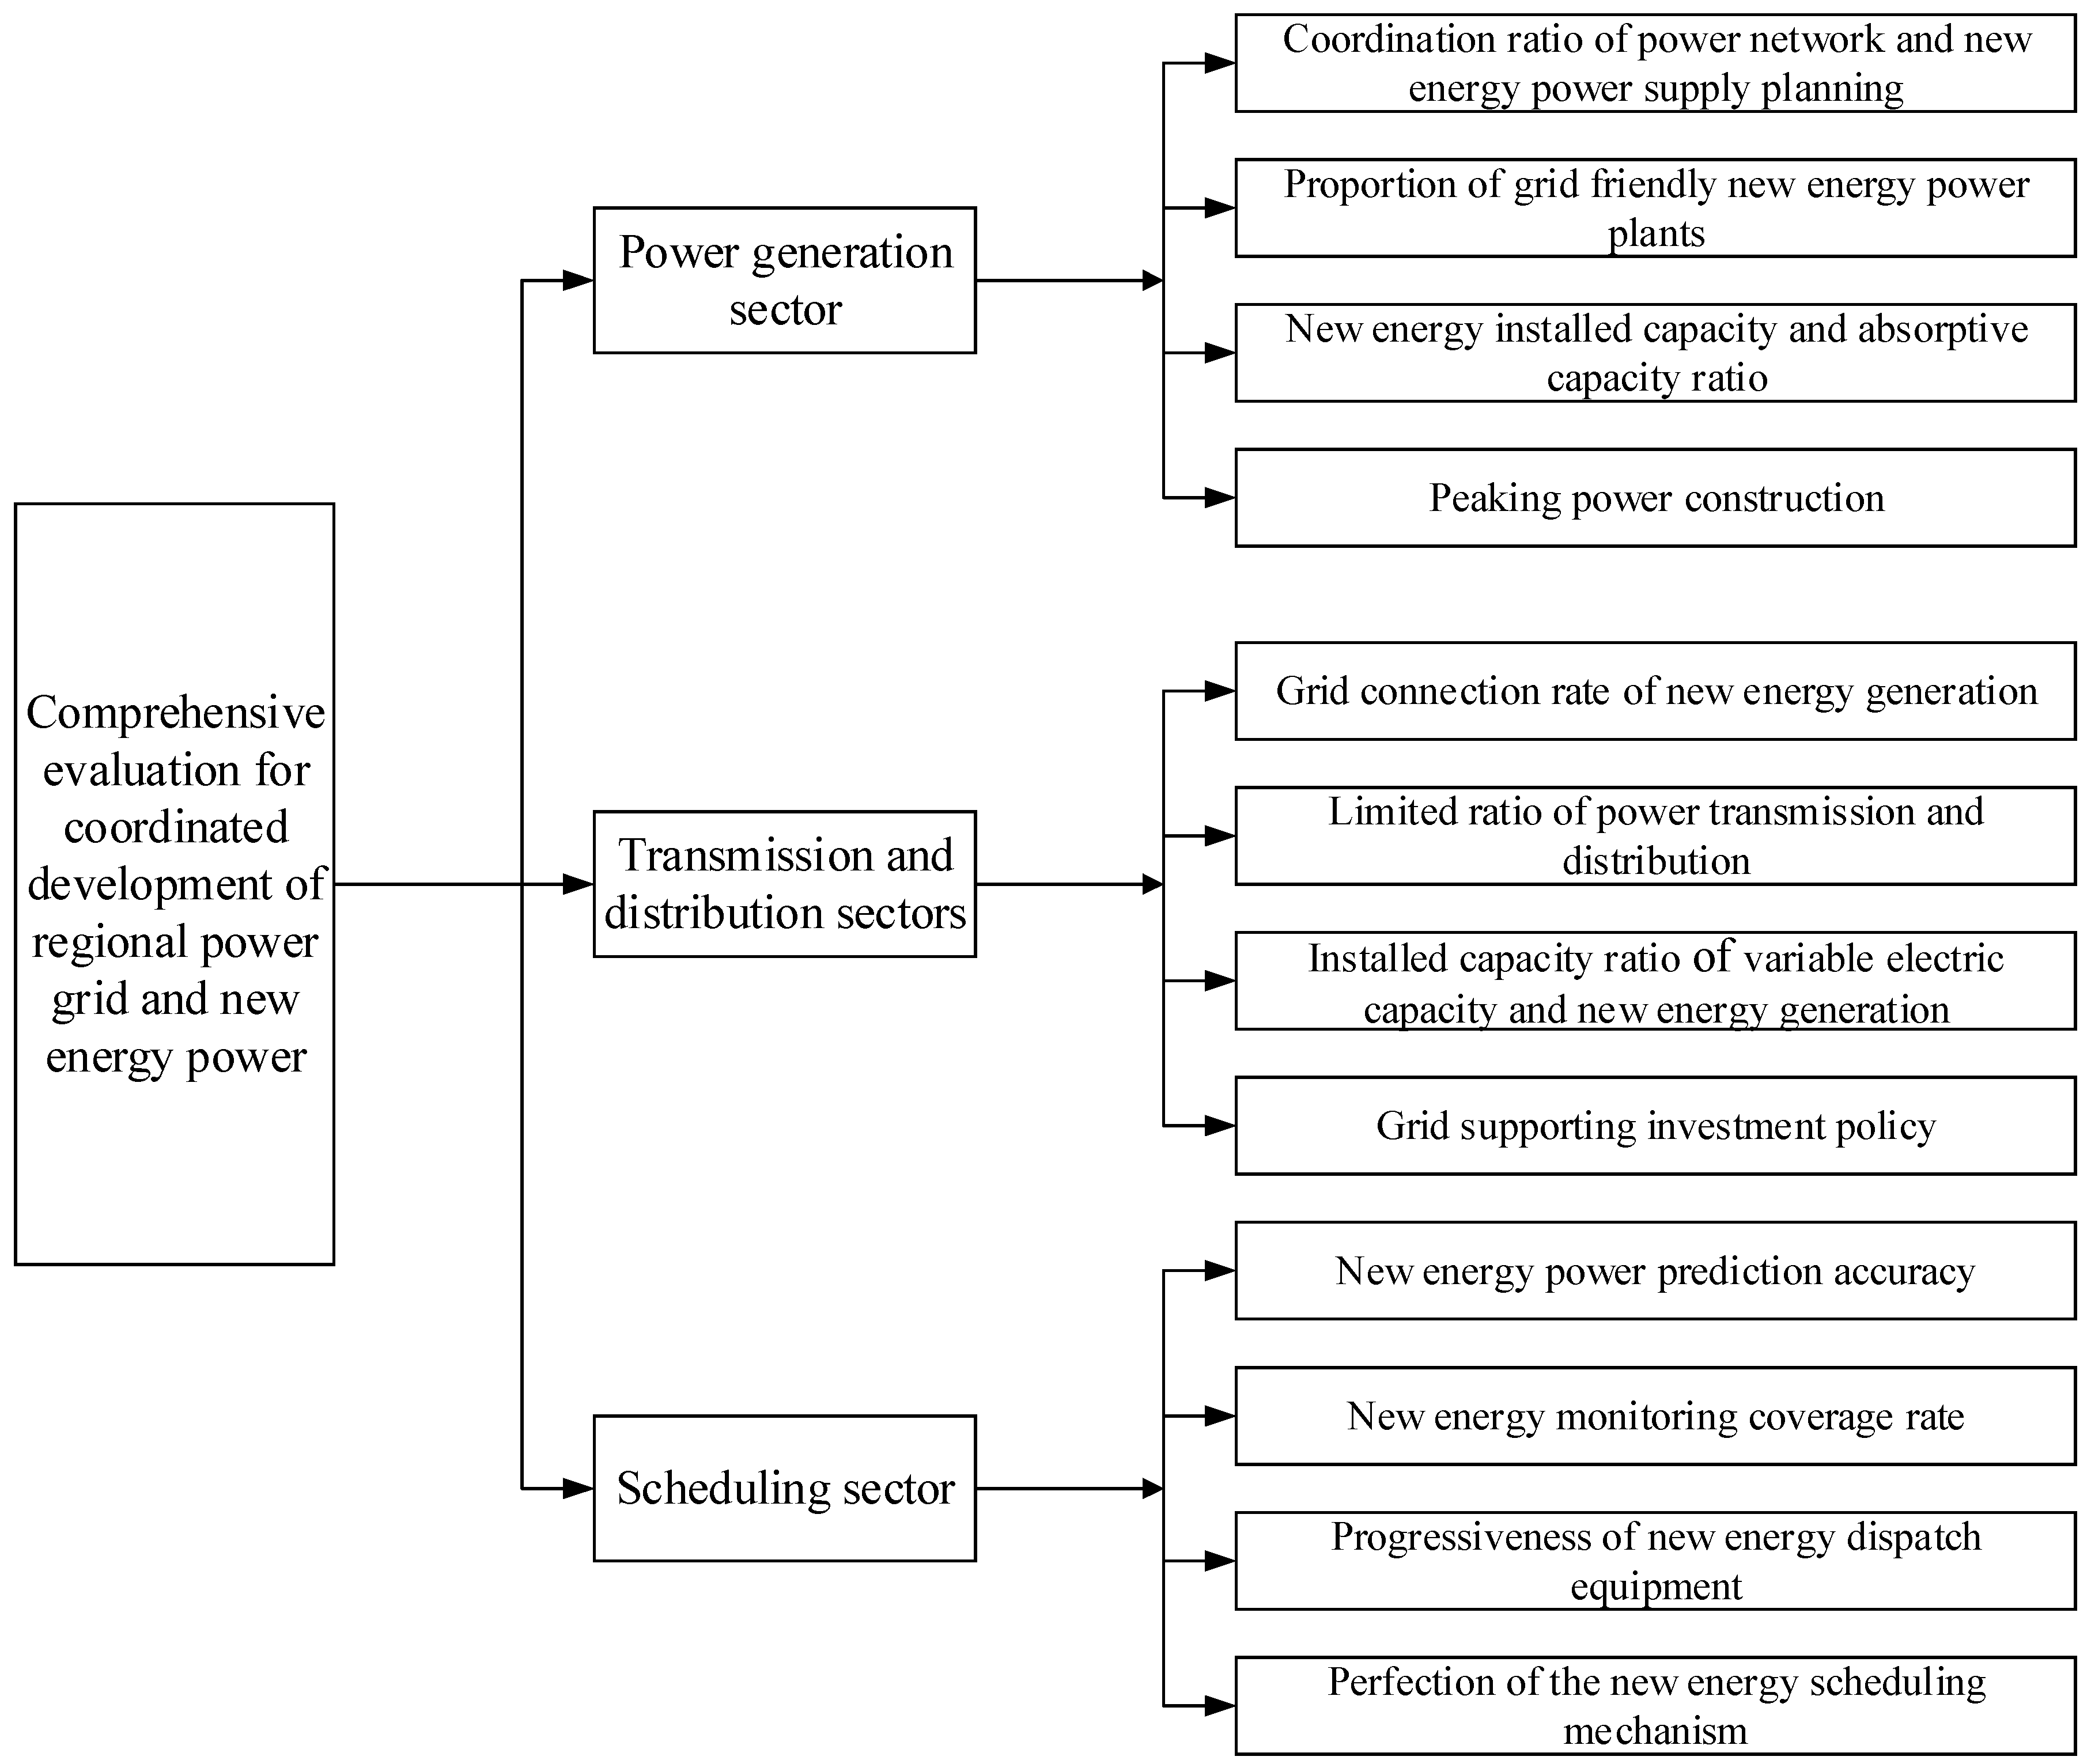
The coordinated development system of the regional power grid and renewable energy power supply emphasizes the overall and comprehensive balanced development. What it pursues is the balanced and sustainable development of the system in a specific goal, rather than the one-sided pursuit of the development of individual elements or local factors. From the connotation of coordinated development, the coordinated development of regional power grid and renewable energy power supply requires the two parties to meet each other in the development speed, scale, technology and policy [
20].
From the composition of the power system, the coordination issues of regional power grid and renewable energy power development relate to power generation, transmission and distribution, scheduling and other aspects. It is clearly not complete to evaluate their coordination only from one single aspect. The coordination of the development should be adapted and coordinated in all links covered. Only by realizing the coordinated development of the regional power grid and the renewable energy source in all aspects can we realize the overall coordinated development of renewable them. Therefore, this paper designs and develops coordination evaluation index system from three aspects of power generation, transmission, distribution and scheduling, and comprehensively evaluates the coordination degree of regional power grid and the development of renewable energy sources.
Considering the subjective and objective factors of service recipients affecting the coordinated development of renewable energy and traditional power grid, as well as the current development situation related to the renewable energy in China, the factors influencing coordinated development of renewable energy and traditional power grid are identified by the Delphi method [
22], the literature review method and the on-spot interview methods. By reviewing related literature and conducting on-spot interviews, the initial and important factors are identified. Then, the questionnaires, including initial factors, are distributed to experts and practitioners. By analyzing the questionnaire results, the key and representative factors are finally determined from the perspective of sustainability (
Figure 1 and
Table 1).
Figure 1.
Comprehensive evaluation index system for regional power grid and renewable energy power supply coordination development.
Figure 1.
Comprehensive evaluation index system for regional power grid and renewable energy power supply coordination development.
The corresponding index number is listed in
Table 1.
Table 1.
Evaluation index number.
Table 1.
Evaluation index number.
| Index Name | Index Number |
|---|
| Coordination ratio of power network and renewable energy power supply planning | |
| Proportion of grid friendly renewable energy power plants | |
| Renewable energy installed capacity and absorptive capacity ratio | |
| Peaking power construction | |
| Grid connection rate of renewable energy generation | |
| Limited ratio of power transmission and distribution | |
| Ratio of variable electric capacity and installed capacity of renewable energy generation | |
| supporting grid investment policy | |
| Renewable energy power prediction accuracy | |
| Renewable energy monitoring coverage rate | |
| Progressiveness of renewable energy dispatch equipment | |
| Perfection of the renewable energy scheduling mechanism | |
(1) The generation sector coordination degree of the regional power grid and renewable energy power in the development mainly reflects on the match degree of the current situation of the renewable energy power development and the regional power grid absorption ability. It includes four secondary indices of coordination ratio of power network and renewable energy power supply planning, proportion of grid friendly renewable energy power plants, renewable energy installed capacity and absorptive capacity ratio, and peaking power construction.
Coordination ratio of power network and renewable energy power supply planning means the ratio of the added renewable energy power scale and the added supporting transmission and distribution size in the planning period. This index reflects the coordination degree between the renewable energy development planning and power grid planning, which is the basis and premise of the coordination.
Proportion of grid friendly renewable energy power plants refers to the proportion of installed capacity of the grid friendly renewable energy power plants in the total renewable energy power plants capacity.
Renewable energy installed capacity and absorptive capacity ratio refers to the ratio of construction scale of renewable energy and the maximum absorptive capacity based on the structure of system power supply. The index reflects the acceptance ability of renewable energy in power generation system. To a region, system peak-load regulation determines its absorption ability of the renewable energy, without considering grid constraint conditions.
Peaking power construction says that the peaking power mainly includes the pumped-storage power station and gas power generation, the shortage of the peaking power construction will affect the renewable energy power generation output.
(2) Transmission and distribution are the power transmission sector of power system, which is the key to meeting the needs of renewable energy development. Transmission and distribution system coordination degree mainly reflects in the supporting grid construction, grid scale and related management policies, including four indicators of grid connection rate of renewable energy generation, renewable, limited ratio of power transmission and distribution, ratio of variable electric capacity, and installed capacity of renewable energy generation and supporting grid investment policy.
Grid connection rate of renewable energy generation refers to the proportion of connected renewable energy installed capacity accounting for all renewable energy installed capacity. Renewable energy power generation projects that cannot be connected to the grid in a timely manner are the embodiment of uncoordinated development with the regional power grid. This index can reflect the coordination degree of regional power grid and renewable energy power supply intuitively.
Limited ratio of power transmission and distribution refers to the proportion of renewable energy limited generation due to the shortage of transmission capacity accounting for all renewable energy generation. This indicator reflects the coordination degree in the development scale of regional grid and renewable energy.
Ratio of variable electric capacity and installed capacity of renewable energy generation reflects the matching degree of construction scale for power grid and renewable energy.
Supporting grid investment policy means the relevant incentive policies and the intensity of policy that the state encourages investing renewable energy sources.
(3) Scheduling is the operation control of power system. Intelligent scheduling is conducive to the realization of renewable energy priority scheduling, which protects renewable energy power generation. Scheduling sector coordination mainly includes renewable energy power prediction accuracy, renewable energy monitoring coverage rate, progressiveness of renewable energy dispatch equipment and perfection of the renewable energy scheduling mechanism.
Renewable energy power prediction accuracy has vital significance to the power generation scheduling. Accurate prediction of renewable energy is an important prerequisite to ensure the safe and stable operation of power grid, and promote the coordination of grid and renewable energy.
Renewable energy monitoring coverage rate is the proportion of renewable energy installed capacity that incorporates monitoring.
Progressiveness of renewable energy dispatch equipment reflects the technology and capability of dispatch renewable energy.
Perfection of the renewable energy scheduling mechanism is a series of control strategies and the implementation effect of the power grid in order to ensure the coordinated operation of the renewable energy power supply and power system, which reflects the power grid dispatch response capability of the renewable energy generation.
3. Comprehensive Evaluation Based on Entropy Weight and Improves TOPSIS Method Optimized by Matter Element Extension
3.1. Method Principle
- (1)
Basic idea of entropy weight method
Shannon has introduced entropy into information theory, which has been applied in many fields and has achieved success [
23]. According to the principle of information theory, information is used to measure the order degree of the system, and entropy is used to measure the disorder degree [
24,
25,
26]. The absolute values of the two are the same, but they are the opposite number of each other. In the process of evaluation, if the information entropy of a certain index is smaller, it means the degree of variation index is greater, the information it contains is greater, the impact on the evaluation goals is bigger and then the weight of the index is greater. Conversely, the bigger the information entropy means the smaller it changing, the less information it contains, the less impact on the evaluation target, and the smaller weight of the index [
27]. Therefore, in the actual analysis, entropy weight method based on the principle of information entropy can determine the weight of evaluation index, and detailed mathematical model is shown in the second section [
28].
- (2)
The introduction of improved TOPSIS
- (a)
Basic idea of TOPSIS method
Technique for Order Preference by Similarity to Ideal Solution (TOPSIS), which was first proposed by Hwang and Yoon in 1981 [
29], is also known as close to the ideal solution sorting method, and the idea is derived from the decision problem of multivariate statistical analysis. It is a kind of scientific decision-making technology used in multiple attribute decision making of limited scheme system engineering. The basic idea of TOPSIS method is as follows: First, on the basis of normalization of the original matrix, it needs to find the optimal scheme and the worst scheme in the finite evaluation schemes, which are the positive and negative ideal solution. Second, the relative closeness degree between the evaluation object and the optimal solution is obtained, through calculating the distance between the object and the optimal scheme and the worst scheme, respectively. Third, the schemes are ranked to determine the optimal scheme [
30,
31]. The optimal scheme means each attribute value is the best of all the alternatives; contrarily, the worst scheme means the value of each attribute is the worst of all the alternatives. Fourth, the distance between each scheme and the optimal scheme and the worst scheme are measured and, if the scheme is close to the optimal scheme and far from the worst, the scheme will be the best one.
- (b)
Improved TOPSIS method based on matter-element extension
The main idea of matter-element extension evaluation is that, first, according to the existing data, the level of the evaluation object is divided into several levels, and the range of each level is from the database or experts [
32,
33,
34]. Second, the evaluation indices are put into every level set for multi index evaluation and the evaluation results are obtained. Finally, the results are compared with association of each level set. The greater the association degree is, the greater the conformity degree of the set is.
There will be some defects in the application of TOPSIS to the comprehensive evaluation of coordinated development of regional power grid and renewable energy power source. TOPSIS can only sort the evaluation results of the schemes, but cannot obtain the evaluation classification of each scheme; that is, we cannot distinguish whether the coordination is good, average or poor [
35]. Therefore, in this paper, an improved TOPSIS method based on matter-element extension has been proposed to overcome this shortcoming [
36]. The concrete thought is: TOPSIS is used to find the optimal solution and the worst scheme. The range of extreme values formed from the positive and negative ideal solutions corresponding to the optimal scheme and the worst scheme is equally divided according to the evaluation needs, and give corresponding coordination evaluation set to the partition interval. Then calculate the proximity degree between the various indicators and each level, and ultimately determine which evaluation grade the evaluation object belongs to.
3.2. Evaluation Model
Step 1: Determination of index value
Generally, the qualitative index is fuzzy and difficult to quantify, so the expert scoring method is used to evaluate the qualitative indices, and the property of evaluation index is shown in
Table 2. The qualitative indices are divided into excellent, good, common and bad according to the coordination, and the score division is shown in
Table 3. The average expert scores are taken as the value of the index.
Table 2.
The property of evaluation index.
Table 2.
The property of evaluation index.
| Index Number | Index Property |
|---|
| Quantitative |
| Quantitative |
| Quantitative |
| Qualitative |
| Quantitative |
| Quantitative |
| Quantitative |
| Qualitative |
| Qualitative |
| Quantitative |
| Qualitative |
| Qualitative |
Table 3.
The rating criteria of qualitative index level.
Table 3.
The rating criteria of qualitative index level.
| Index Level | Excellent | Good | Average | Bad |
|---|
| Rating Interval | 75–100 | 50–75 | 25–50 | 0–25 |
Quantitative index data are mainly from the regional power grid companies and renewable energy power generation enterprises.
Step 2: Index data preprocessing
Evaluating the evaluation indices
of objects
, and the original matrix was set up as follows:
(1) Consistency of index
This paper is based on the positive index, so index consistency is only for appropriate and inappropriate indices. The method of transforming the minimal index into maximal index is shown in Equation (2).
M is the upper bound of index.
The transforming method of interval index shows in Equation (3).
Where, is the best stable range of the index ; and and are the allowed upper and lower bounds of , respectively.
(2) Index standardizing
In the process of comprehensive evaluation, in order to eliminate the impact of the different dimension or order of indices, first, non-dimensional processing is needed, according to Equation (4).
Step 3: Determination of index weight
Calculating the information entropy
of each index using Equation (5) [
37,
38].
where,
In addition, calculate the entropy weight
of each index.
where,
Step 4: The calculating process of improved TOPSIS
(1) Setting up the standardized decision matrix
(2) Determination of the positive and negative ideal solution
In the standard decision matrix, the positive ideal point
is the vector of the maximum element of each column, and the negative ideal point
is the vector of the minimum element of each column.
where , and .
(3) Partition the extreme value interval, and calculate the closeness degree of each element with the evaluation interval.
Dividing the extreme values interval of the positive and negative ideal solutions into N layers, and the range of each layer is
, the interval
is comprised of
,
and
. The closeness degree of each element with the evaluation interval is as follows:
The weighted closeness degree of each evaluation scheme is
The level of the maximum
is the evaluation level of evaluation object. However, in the actual evaluation, there may be more than one scheme that belongs to the same level. Thus, it needs to be more clearly defined at the level of the same level scheme by calculating the eigenvalues
. In order to further define which level the scheme is closer to, the eigenvalues
are calculated.
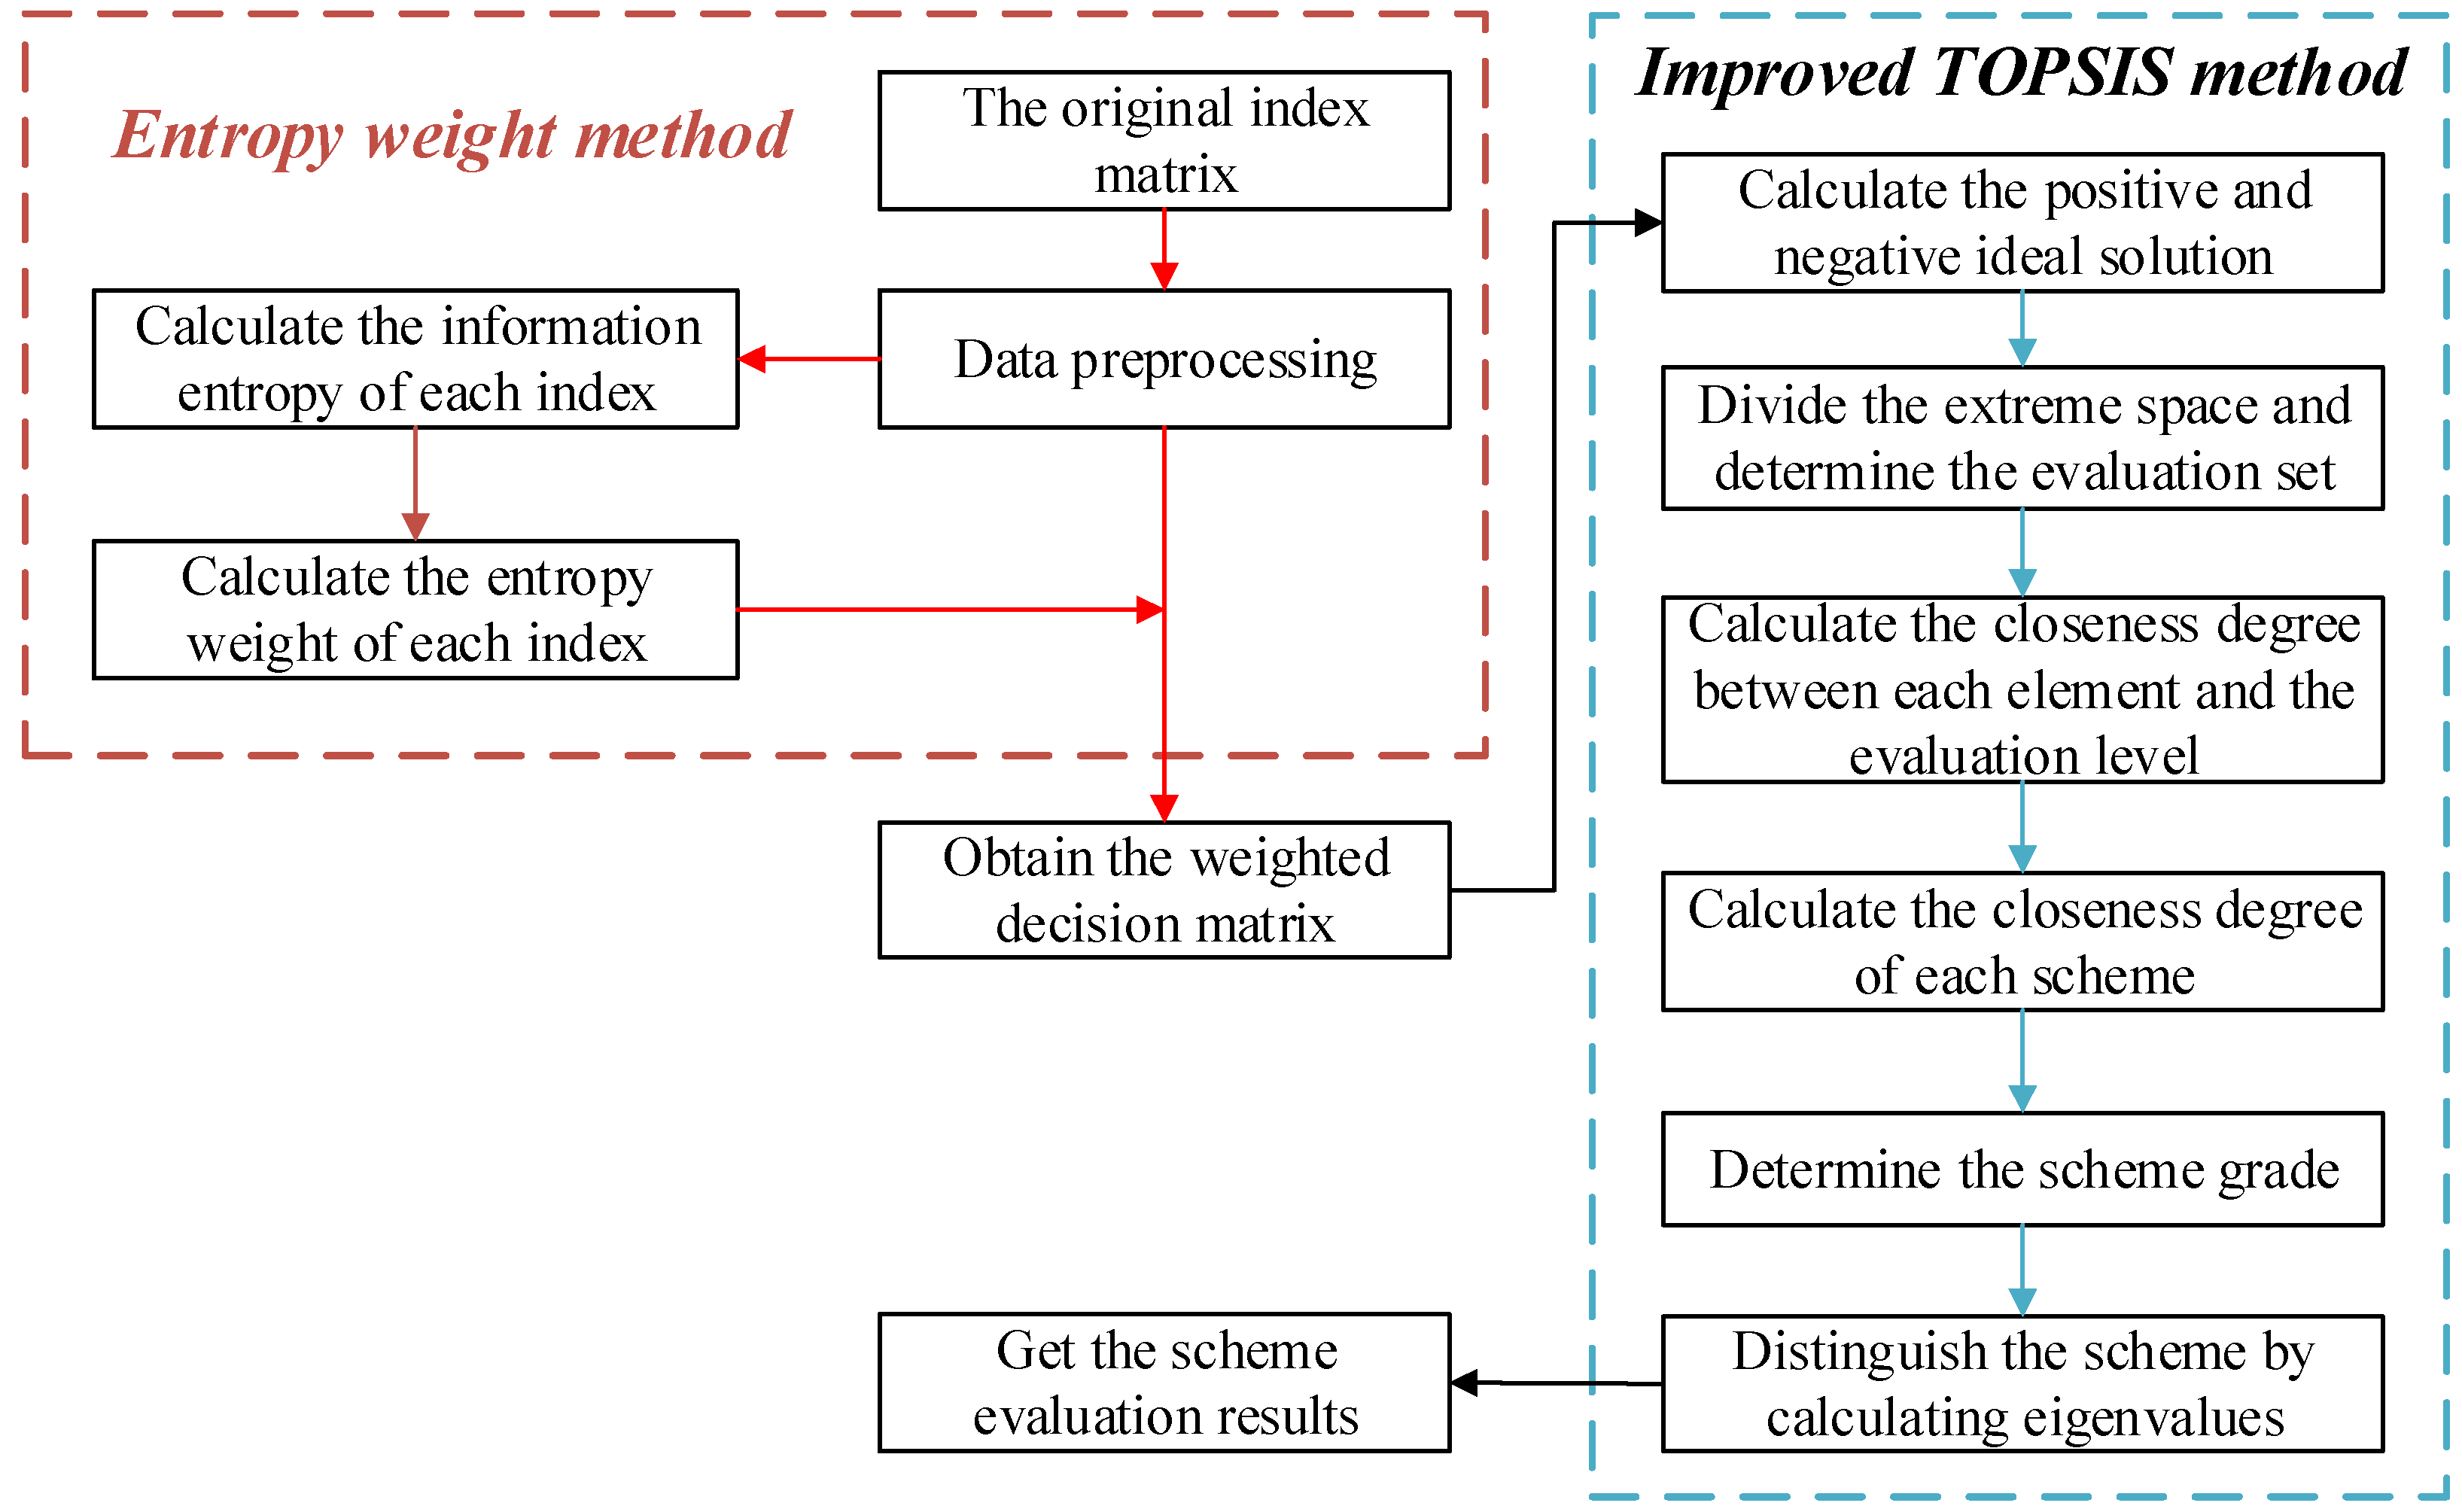
3.3 Evaluation Process
The comprehensive evaluation of the regional power grid and the renewable energy power source based on entropy weight method and improved TOPSIS method are as follows [
39].
Step 1: Set up the original index matrix, and pre-process the index.
Step 2: Determine the weight of each index by entropy weight method.
Step 3: Analyze the index matrix after preprocessing, determine the weights using the entropy weight method, and obtain the weighted decision matrix through calculating the index matrix and weight.
Step 4: Calculate the positive and the negative ideal solution, according to the weighted decision matrix.
Step 5: Determine the evaluation set on the basis of the extreme value interval division of the positive and negative ideal solution.
Step 6: Calculate the closeness degree of each element with the evaluation level.
Step 7: Calculate the closeness degree of each scheme, and determine the evaluation level of each scheme according to the principle of maximum degree of closeness.
Step 8: Further distinguish the good or bad of the same level evaluation scheme by calculating the eigenvalues. The evaluation steps are shown in
Figure 2.
Figure 2.
Comprehensive evaluation based on entropy weight and improved TOPSIS method.
Figure 2.
Comprehensive evaluation based on entropy weight and improved TOPSIS method.
4. Empirical Research
In this paper, the development coordination of the power grid and the renewable energy power in the Ningxia region is studied based on the entropy weight and the improved TOPSIS method. Quantitative data of the samples come from power grid companies and renewable energy power generation enterprises of this region. The assessment panel consists of specialists from grid dispatch and development planning department, renewable energy generation operation and maintenance department and a professor in the field of power economy. The ratings of the qualitative indicators are determined according to the scoring criteria in
Section 3.2. On this basis, the development coordination of power grid and renewable energy power in the Ningxia region is evaluated according to the evaluation model and steps in
Section 3.3. The main procedures are as follows.
Step 1: According to the data preprocessing method above, the indices are normalized and we can get normalized matrix
.
Step 2: According to the entropy weight method, the weights
of the indices are determined, shown in
Table 4.
Table 4.
Evaluation index properties.
Table 4.
Evaluation index properties.
| Index Name | Index Number | Index Weight |
|---|
| Planning coordination ratio of power grid and renewable energy power supply | | 0.0977 |
| The proportion of power grid friendly renewable energy power plant | | 0.0569 |
| The renewable energy installed capacity and absorptive capacity ratio | | 0.0368 |
| Peak power construction situation | | 0.0342 |
| Grid connected rate of renewable energy power generation | | 0.1269 |
| Limited transmission and distribution ratio | | 0.1531 |
| Ratio of variable electric capacity and installed capacity of renewable energy generation | | 0.1190 |
| Supporting grid investment policy | | 0.0056 |
| Accuracy of renewable energy power forecasting | | 0.1474 |
| Coverage of renewable energy monitoring | | 0.0564 |
| Advancement of renewable energy dispatch equipment | | 0.0883 |
| Mechanism of renewable energy dispatching | | 0.0778 |
Step 3: Calculate the weighted standardization decision matrix
.
Step 4: The positive ideal solution
and negative ideal solution
are calculated using the weighted normalized matrix.
Step 5: The extreme value range consisting of the positive and negative ideal solution is divided into four classes, namely
indicates that the coordination level is one class, two class, three class and four class, which is from weak to strong. Taking the index “planning coordination ratio of power grid and renewable energy power supply” as an example, the results of the positive and negative ideal solution are
and
, respectively, which can be divided into four parts:
Next, perform a similar isometric partitioning operation for the other extreme ranges.
Step 6: Calculate the closeness degree between the weighted decision matrix and the four levels.
On the basis of closeness degree of each element, calculate the weighted closeness degree of each evaluation scheme.
Remark level of evaluation objects is the level of max , so the coordination level in 2010 is level one. In the same way, the coordination level in other years can be obtained.
The closeness degree of 2010 was standardized, and the characteristic values were calculated:
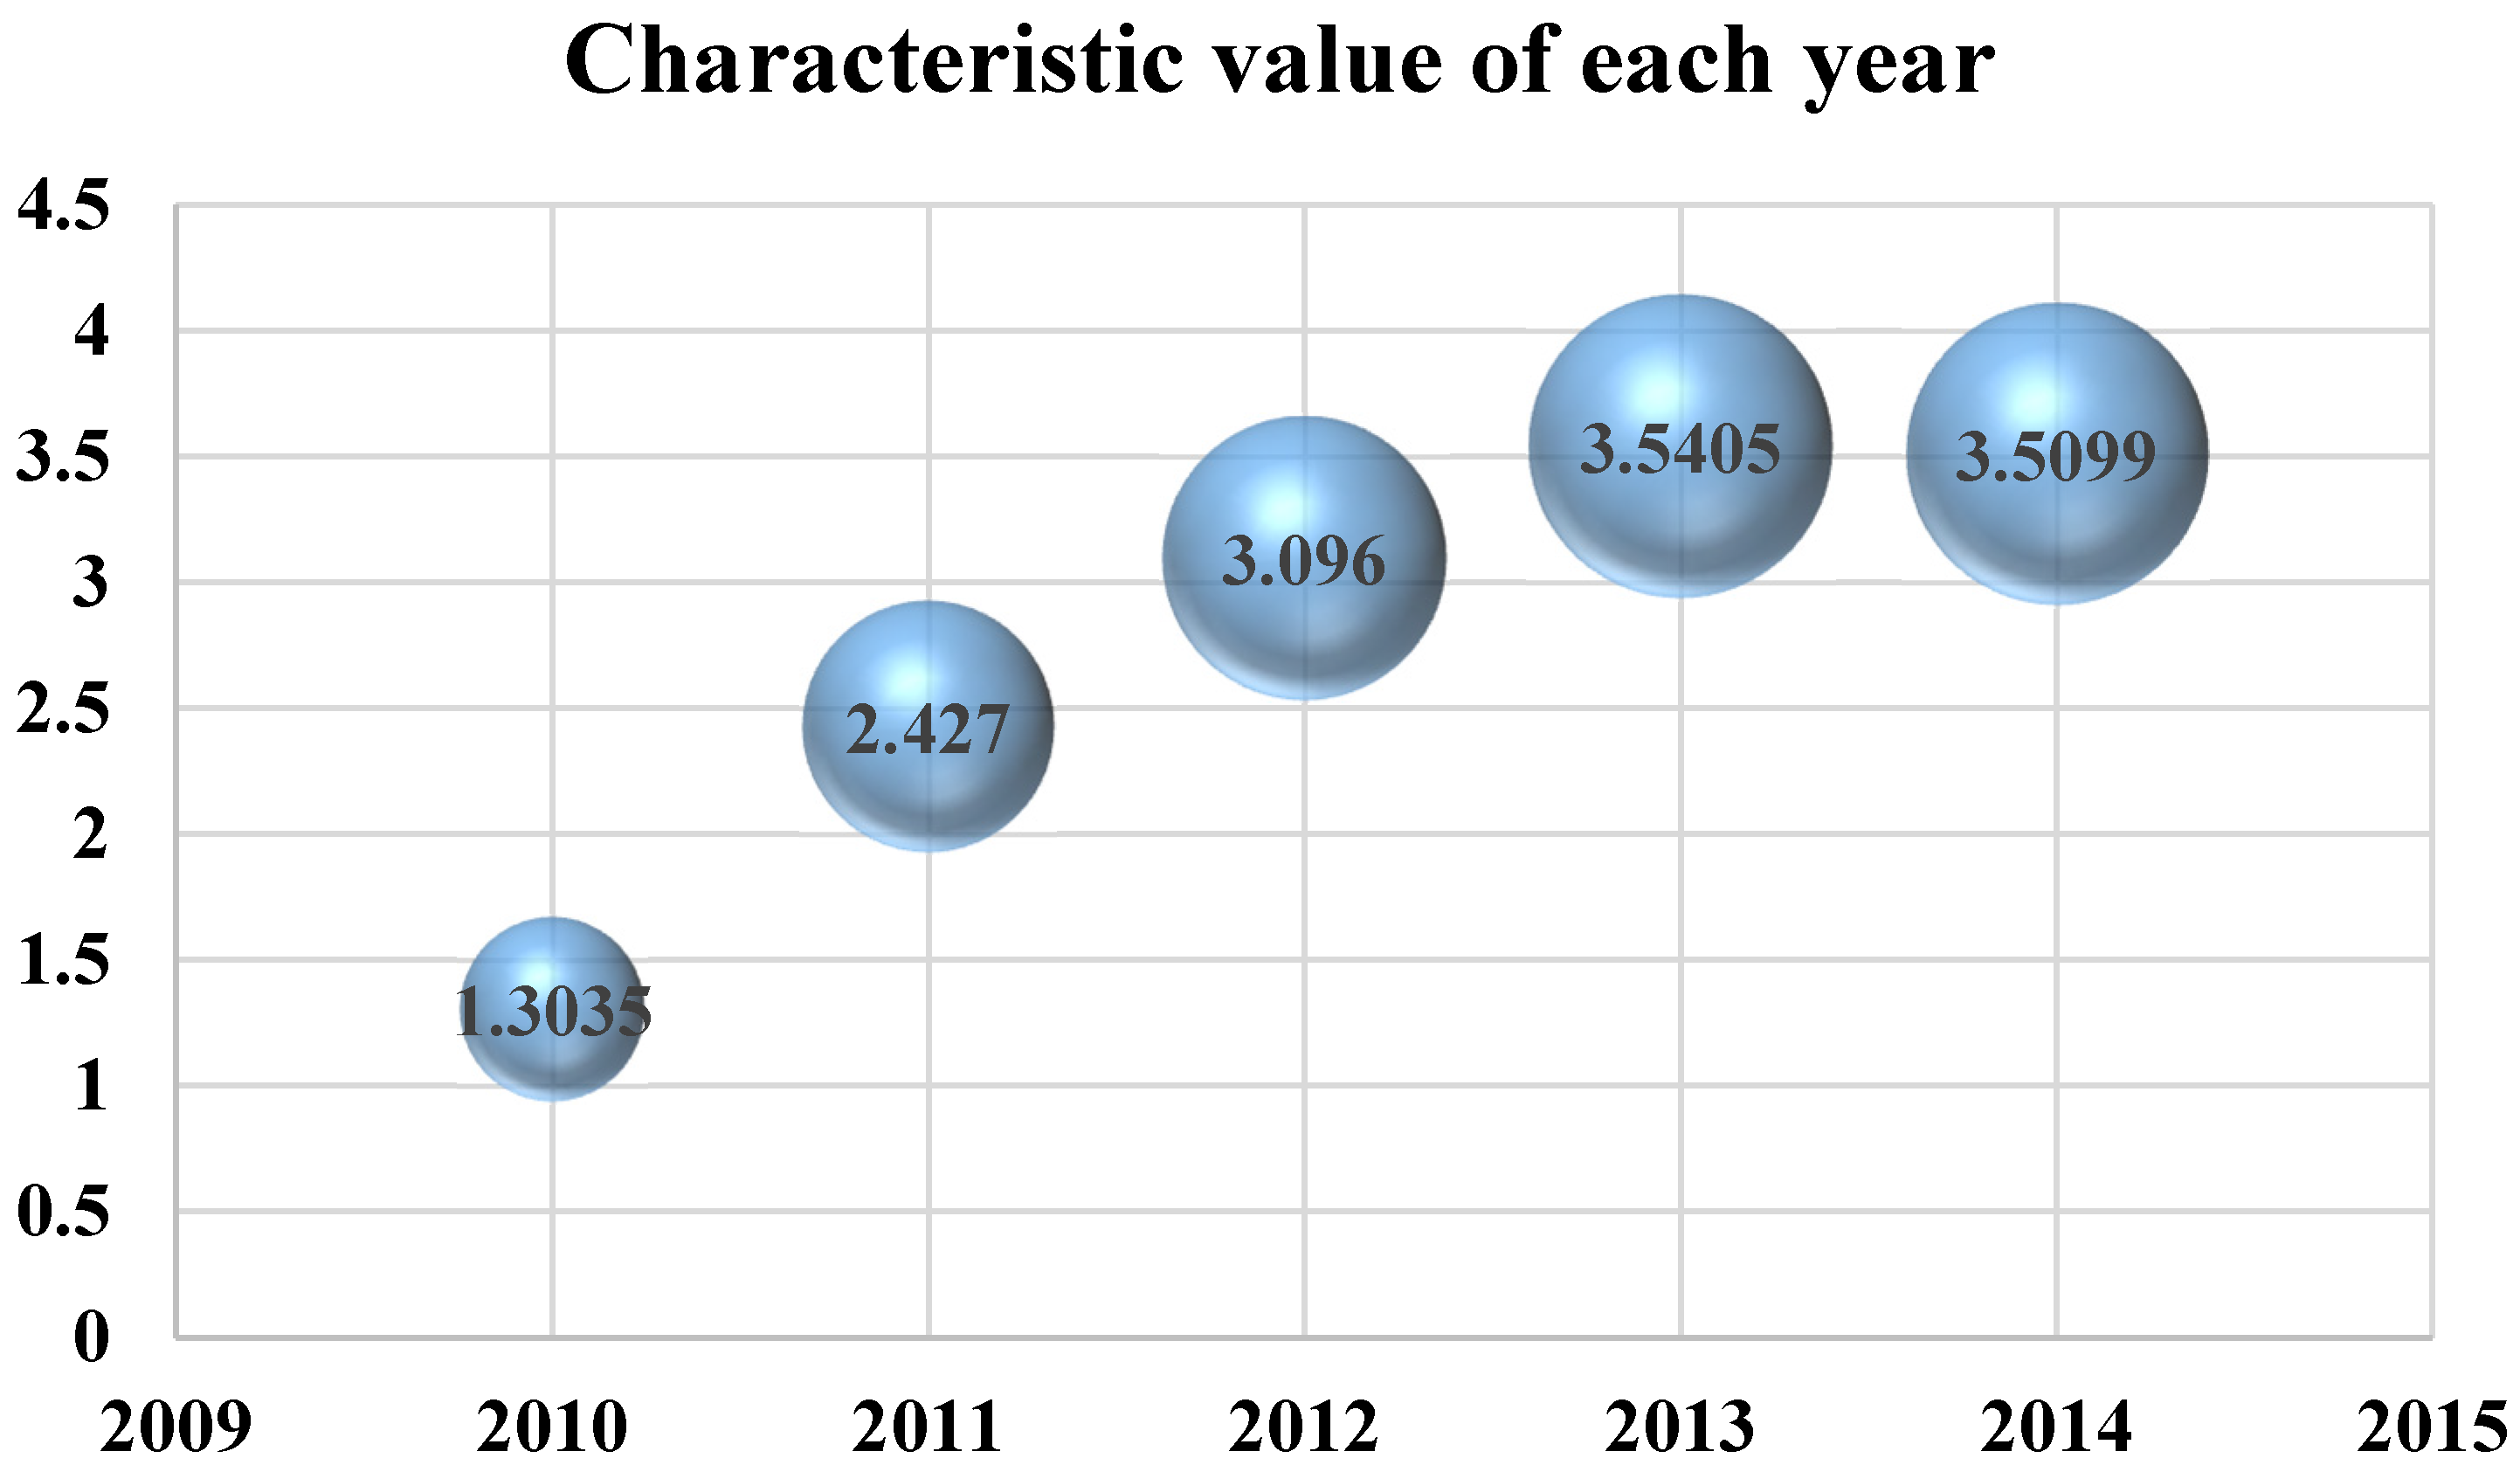
Similarly, other characteristic values can be calculated. The results of the calculation are summarized in
Table 5. The change of the characteristic value of each year is shown in
Figure 3 and the change of the closeness degree of each year is shown in
Figure 4.
Table 5.
Coordination evaluation results.
Table 5.
Coordination evaluation results.
| Year | Characteristic Value | Closeness Degree | Coordination Level | Sort |
|---|
| 2010 | 1.3035 | 0.9983 | 1 | 5 |
| 2011 | 2.4270 | 0.9973 | 2 | 4 |
| 2012 | 3.0960 | 0.9980 | 3 | 3 |
| 2013 | 3.5405 | 0.9967 | 4 | 1 |
| 2014 | 3.5099 | 0.9970 | 4 | 2 |
Figure 3.
Trend chart of characteristic value in 2009–2013.
Figure 3.
Trend chart of characteristic value in 2009–2013.
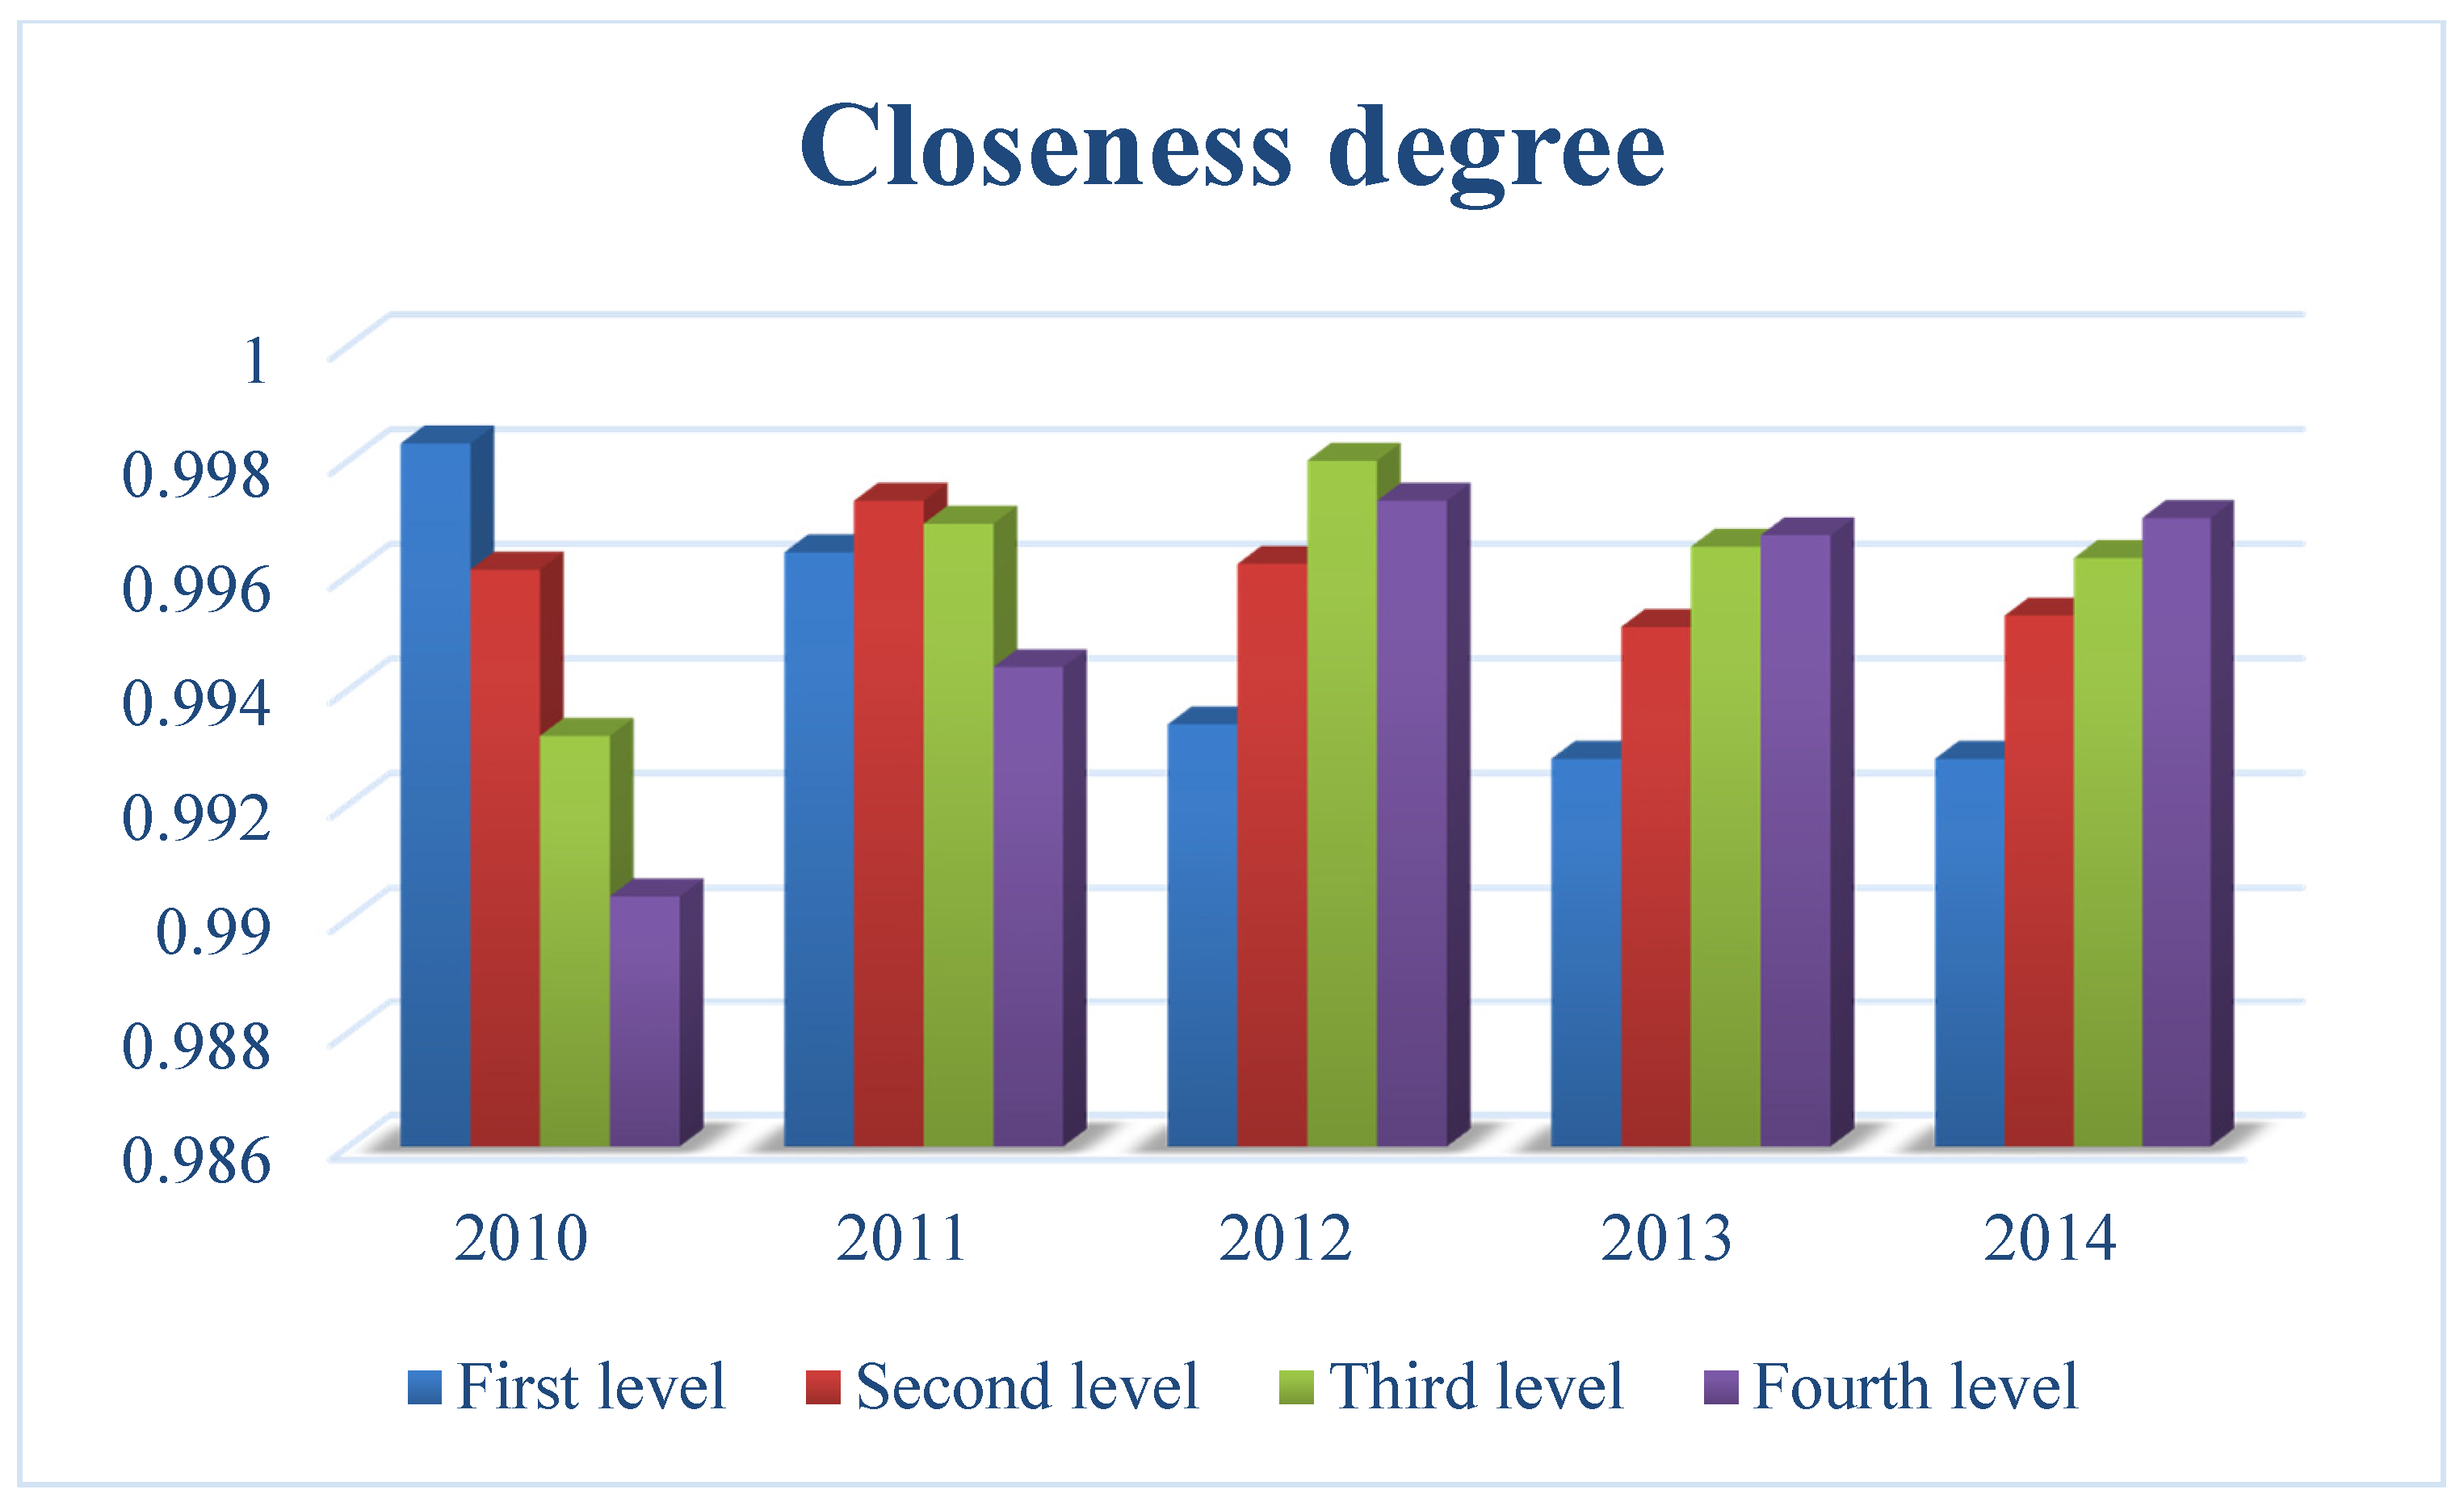
Figure 4.
Trend chart of closeness degree in 2010–2014.
Figure 4.
Trend chart of closeness degree in 2010–2014.
Figure 4 shows closeness degree for each level of each year. According to the principle of maximum membership degree, the coordinated development level of the year is similar to the corresponding level of maximum closeness, as the result of the actual evaluation of a number of programs may be the same level. In order to further distinguish closer levels, the characteristic value
is calculated. For the programs in the same evaluation level, it is closer to the level of the class if its characteristic value is greater.
Step 7: Evaluation results analysis
Seen from the coordination evaluation results above, the coordination sort of power grid and renewable energy power in the Ningxia region is . From the perspective of coordination level, the coordination of renewables is better in 2013 and 2014. The coordination of 2012 belongs to level 3, namely the coordination is average. The coordination of 2011 belongs to level 2 (poor). The development coordination between power grid and renewable energy power is the worst in 2010. The coordination in 2013 and 2014 belongs to the same level, but from the perspective of characteristic value , the coordination in 2013 is closer to level 4, namely it is the best one.
According to the real situation, the scale of the wind farm installed is 503,700 kW in 2010, and solar photovoltaic power station has just started, so the installed capacity is only 330 kW. The scale of renewable energy installed capacity is smaller relatively, and the matching construction of power grids is lagging behind. The on-grid energy of renewable energy grid is 7.5534 × 10⁸ kw/h, and the average utilization hours of wind power equipment is 1835 hours. The average utilization hours of solar photovoltaic electric equipment is 1059 hours, the lowest level in these five years.
In 2011 and 2012, the scale of renewable energy installed capacity has doubled, despite improved equipment utilization hours, wind power curtailment is still a serious problem. With the implementation of relevant national policies, power grid has greater enthusiasm for gird integration of renewable energy, and the matching grid projects are being followed up, and friendly renewable energy technology is also gradually applied. From the grid side, friendly renewable energy technology has been applied successfully, and the monitoring and control level of the renewable energy electric field is gradually improved, and detection management method and system for gird integration of renewable energy are also gradually implemented. As a result, power grid and renewable energy power have experienced a more coordinated development state in 2012 and 2013.
Step 8: policy suggestion
Based on the above analysis, the comprehensive evaluation model constructed in this paper based on entropy weight and TOPSIS objectively reflects the development status of power grid and renewable energy power in the Ningxia region. It also has significance for reference for coordinated development evaluation of power grid and renewable energy source in other regions of China.
From the point of view of coordinated development analysis, the influence degree of each index is different, which determines the key areas of the coordinated development of renewable energy and traditional power grid.
Key areas of power generation include constructing power grid friendly renewable energy power plant, improving power forecasting, and speeding up the construction of peak power.
Key areas of power transmission and distribution include speeding up the construction of the auxiliary power grid, improving the transmission capacity of the power grid, and improving the power grid capabilities.
Key areas of scheduling include implementing flexible scheduling strategy, strengthening the construction of renewable energy control capacity, and bringing renewable energy into the scheduling management system.
By constructing the index system and establishing the evaluation model of optimization, the coordinated development level is obtained, which is helpful for the electric power enterprise manager to identify the current situation of coordinated development between the regional power grid and renewable energy more intuitively, and identify key links and key factors hindering coordinated development to promote the sustainability of enterprise management. It can be targeted for improvement and promote the sustainable management and the coordinated and sustainable development of regional power grid.
5. Conclusions
In this paper, a comprehensive evaluation of the coordination of regional power grid and the development of renewable energy power supply is proposed. First, the significance of comprehensive evaluation is analyzed. Based on the principle of comprehensive evaluation index selection, the regional power grid and renewable energy power generation are considered comprehensively, then coordination evaluation index system of regional power grid and renewable energy power supply development is developed from the three aspects of power generation, transmission, distribution and scheduling. The index system not only considers the power demand of renewable energy sources, but also considers the security, stability and economic operation of the power system. At the same time, a comprehensive evaluation model based on the entropy weight method and improved TOPSIS is put forward. The weights of indices are determined using entropy weight. Aiming at eliminating deficiency of TOPSIS method in the evaluation of object classification, the traditional TOPSIS is improved using the concept of matter-element extension, and the mathematical model of comprehensive evaluation is constructed, which improves the applicability and effectiveness of the model. In order to further verify the validity of the model, this paper selects the index data of power grid development and renewable energy power in Ningxia area, and puts the evaluation model into the empirical research. The results show that the model accords with the actual development of regional power grid and renewable energy power, which has certain significance for reference and promotion.


 ,
, 


