Article

Seven Food System Metrics of Sustainable Nutrition Security

1
ILSI Research Foundation, Center for Integrated Modeling of Sustainable Agriculture and Nutrition Security (CIMSANS), 1156 15th St NW, Suite 200, Washington, DC 20005, USA
2
Center for Public Health Nutrition, University of Washington, Box 353410, Seattle, WA 98195, USA
3
School of Advanced International Studies, Johns Hopkins University, 1740 Massachusetts Ave NW, Washington, DC 20036, USA
4
Environmental Change Institute, University of Oxford, South Parks Road, Oxford OX1 3QY, UK
*
Author to whom correspondence should be addressed.
Sustainability 2016, 8(3), 196; https://doi.org/10.3390/su8030196
Submission received: 15 January 2016 / Revised: 15 February 2016 / Accepted: 17 February 2016 / Published: 23 February 2016
(This article belongs to the Section Sustainable Agriculture)

Abstract

:
Sustainability considerations have been absent from most food security assessments conducted to date, despite the tremendous economic, environmental, and social implications of meeting accelerating food demand in the face of water shortages and climate change. In addition, previous food security work has generally focused only on achieving adequate calories, rather than addressing dietary diversity and micronutrient adequacy, both of which are critical to maintaining a healthy overall nutritional status. In response to the limitations of previous assessments, a new methodology is proposed here based on the concept of “sustainable nutrition security” (SNS). This novel assessment methodology is intended to remedy both kinds of deficiencies in the previous work by defining seven metrics, each based on a combination of multiple indicators, for use in characterizing sustainable nutrition outcomes of food systems: (1) food nutrient adequacy; (2) ecosystem stability; (3) food affordability and availability; (4) sociocultural wellbeing; (5) food safety; (6) resilience; and (7) waste and loss reduction. Each of the metrics comprises multiple indicators that are combined to derive an overall score (0–100). A novel SNS assessment methodology based on these metrics can be deployed by decision-makers and investors to set meaningful goals, track progress, and evaluate the potential impact of food system interventions intended to improve sustainability and human nutrition outcomes.

1. Introduction

The world faces an escalating challenge to meet accelerating demand for sustainably-produced, nutritious food in the face of human population pressure, resource scarcity, ecosystem degradation, and climate change [1]. As the ambitious Millennium Development Goals (MDGs) give way to the Sustainable Development Goals (SDGs), or Global Goals, about 795 million people globally are still without sufficient calories [2] and at least two billion lack sufficient nutrients [3]. The impact of climate change on the sustainability of the food supply is one priority area for consideration and study. The Fifth Assessment Report of the United Nations Intergovernmental Panel on Climate Change (IPCC) highlighted the effects of water scarcity and higher temperatures on crop yields and the higher food prices and diminished food security that may result [4]. Although sustainability considerations have largely been absent from most food security assessments, meeting the accelerating demand for nutritious food in the face of shrinking resources has tremendous economic, environmental, and social implications. In addition, while most previous studies on food security were limited to the availability of adequate calories, there is a pressing need to consider diversity in food supplies and the nutrients-to-calories ratio. Food supplies that provide ample calories but are deficient in key nutrients compromise nutritional status and can contribute to the added burden of non-communicable disease. Hidden hunger and obesity are two components of malnutrition [5].
We propose a new methodology to assess and quantify the broad concept of sustainable nutrition security (SNS). We explicitly add both environmental sustainability and nutrition considerations to studies of food production and food supply [6]. Evaluating and eventually enhancing SNS requires science-based metrics that are relevant to policy making [7,8,9]. Such metrics can be used to categorize and compare different scenarios and evaluate the likely impact of potential food system interventions that are intended to improve food security and human nutrition outcomes. Combining diverse metrics within a holistic food systems approach is an important context-setting assumption. Going beyond food production and food supply is increasingly being seen as the most effective strategy to enhance nutrition security in a more sustainable manner [10], although it must be noted that such a strategy depends on food storage facilities and proper transportation; both aspects are problematic in the developing world.
We developed an initial set of SNS metrics as part of a consensus report by a number of nutrition, climate change, food system, and economic experts representing a range of public and private institutions [6]. Metrics help to assess progress toward a given goal, an important consideration for the SDGs. Composite metrics can be composed of multiple indicators using a variety of algorithms. Indicators can be defined as quantitative or qualitative factors that capture system changes following an intervention in a simple and reliable manner [11]. Indicators, in turn, are derived from multiple variables, with data collected through modeling or direct field observations.
The metrics, and their component indicators, were further refined at a workshop involving a broad set of stakeholders from government, academia, and industry [12]. The seven chosen metrics were: (1) food nutrient adequacy; (2) ecosystem stability; (3) food affordability and availability; (4) sociocultural wellbeing; (5) resilience; (6) food safety; and (7) waste and loss reduction. These metrics were selected due to their importance as measures of the overall food system and its impact on human health, as well as its influence on social, economic and environmental sustainability. In this initial presentation and application of the metrics, our interest is food system performance relating to SNS at the national level, and we sought metrics which can be derived from data that are currently available or can be readily estimated for any given country. Such national data were found for all countries and indicators, with the exception of metrics (6) and (7), for which only regional (multi-country) averages are currently available. However, the existing extensive data on crop yield, food production, or food supply, often collected at aggregate geographic level, cannot be readily joined with individual-level data on nutrition and health. As identified elsewhere [13], joining climate-smart agriculture with nutrition and health outcomes is a particular challenge. Climate-smart agriculture practices (e.g., conservation tillage) are intended to build resilience to weather extremes and contribute to climate mitigation through the sequestration of soil carbon, but any linkages to the improvement of nutrition are indirect.
A key guiding principle in the development of the metrics was to avoid needless creation of new metrics or indicators when suitable ones already existed in the literature or in the community of practice. Another guiding principle is that the metrics be based upon open data. Open data are data that can be freely used, re-used, and redistributed by anyone—subject only, at most, to the requirement to attribute and share-alike [14]. Accordingly, literature reviews were conducted for each of the seven metrics to identify valid and reliable open data related to each metric and to develop appropriate indicators. After thorough evaluation, descriptions of individual metrics were sent to a range of topical experts for further review. The overall document was then given a final review by a larger, broad group of stakeholders from academia, governmental agencies, and the private sector (see Acknowledgements).

2. Metrics Definitions

The indicators that were brought together to define the metrics are listed in Table 1 and are displayed graphically in Figure 1. Each of the metrics and indicators was scored from 0 to 100, with higher values desirable. Various systems have been proposed for weighting indicators [15,16,17]. However, based on stakeholder feedback, we have chosen to apply equal weighting to indicators, as indicated in Table 1. While an overall score will be produced for each metric, some stakeholders will want access to the underlying individual indicators, so these will be retained and made available as open data whenever SNS assessment reports are prepared.
Developing a method for quantifying each indicator on a 0–100 scale was a challenge. In certain cases [18,19], a third-party had already published an indicator scaled in this manner. Those were directly used as indicators. In other cases, such as Non-Staple Energy, the indicator itself was defined as a percentage, readily converted to a 0–100 scale. Other indicators, such as the Shannon Diversity, which measures how many food items there are in a given country, had a finite range of possible values, and could be scaled by simply applying a constant multiplicative factor. More challenging, however, were indicators such as Greenhouse Gas Emissions (GHGs) or Land Use, which did not have a bounded range of possible values. In these cases, the following equation was used to derive a 0–100 score:
M e t r i c   I n d i c a t o r i = 100 × exp [ ln ( 0.5 ) × ( F i / F 50 ) ]
where Fi is the factor (e.g., GHG emissions or Land Use) for the ith unit (e.g., country) under consideration, and F50 is the median (50th percentile) of the full range of values for this factor across all units of interest, measured during a particular base year (e.g., 2015). Use of this equation has desirable characteristics, yielding a score of 100 for the hypothetical case of no emissions/use, a score of 50 for median performance, asymptotically approaching a score of 0 as emissions/use increase, and resulting in a normal distribution of scores if the underlying data are log-normally distributed (as is typical).

2.1. Food Nutrient Adequacy

A literature review and consultation with a series of nutrition experts resulted in the selection of the following five Food Nutrient Adequacy indicators: Non-Staple Food Energy, Shannon Diversity, Modified Functional Attribute Diversity, Nutrient Density Score, and Population Share with Adequate Nutrients. We note that a potentially-relevant indicator has been developed, the Healthy Eating Index [20]; however, this indicator is specific to the United States, having been developed to measure compliance with that country’s Dietary Guidelines. It is also worth noting that these particular indicators focus on the adequacy of national food system nutrient levels to meet dietary requirements, and therefore do not specifically address over-consumption at unhealthful levels or other nonlinear effects. The first four of the chosen indicators refer to food availability for an average consumer in the country of interest, and the fifth refers to the percentage of the population with dietary intake of specified food nutrients above certain thresholds. As such, the last indicator requires the collection of actual dietary data at the individual level, as well as estimates of inter-individual variation in dietary intake. All five of these indicators have recently appeared in the literature, and there are data available at the country level to calculate each of them [21,22,23].

2.1.1. Non-Staple Food Energy

This indicator is defined as the percentage of kilocalories available to a representative consumer from non-staple foods [21]. Staple foods vary dramatically by country and are defined as foods that are eaten routinely and in such quantities that they account for a large share of dietary energy intake. Based on stakeholder feedback, our chosen approach is to define staples as all cereals, roots, tubers, and bananas/plantains, thus this indicator is simply the percentage of available food energy (kilocalories) not coming from these sources.

2.1.2. Shannon Diversity

The general formula for Shannon Diversity is:
S h a n n o n   D i v e r s i t y = i s i ln ( s i )
where si is the share (by weight) of the ith food item in the food supply (Note that if consumption of an item falls to zero then the contribution for that item becomes zero. This requires application of L'Hôpital's rule, due to the undefined nature of ln(0)). Although this diversity indicator was originally developed in the ecological sciences, it has recently been applied as a measure of food supply diversity [21]. When all foods are available in equal amounts, the index is equal to ln(N), where N is the total number of foods considered. The more unequal the distribution, the smaller the indicator value. For example, with the 44 food items tracked by the IMPACT integrated model [24], the maximum possible value for the index is 3.78 = ln(44). Thus it is normalized to the 0–100 scale by application of a constant multiplicative factor: 100/ln(N).

2.1.3. Modified Functional Attribute Diversity

Modified Functional Attribute Diversity (MFAD), originally developed as an ecological diversity index [25], can be used to track the diversity of nutrients provided by the different food items in the food supply. MFAD was recently used as an additional measure of food supply diversity [21], and that reference gives the full mathematical derivation, which describes functional attribute diversity as the sum of the pairwise functional dissimilarities among all items in the food supply. MFAD does not increase with functionally identical consumption items, but does increase with functionally dissimilar items. MFAD is normalized by a constant multiplicative factor, such that a value of 100 corresponds to maximum diversity across the dataset.

2.1.4. Nutrient Density Score

Nutrient density of foods is typically measured as the ratio of nutrients to calories [26]. Foods that contain more nutrients than calories are classified as nutrient-rich. The qualifying nutrients of interest, often chosen based on the nutrient needs of a given population, tend to be protein, fiber, and a variety of vitamins and minerals. As used in developed countries, nutrient density of foods is lowered by the presence of saturated fat, added sugar and sodium, viewed as nutrients of public health concern. The nutrient density metrics can be applied to individual foods, composite meals, total diets, or to some approximation of the food supply [23,26,27].
While some nutrient-by-nutrient food quality indices were developed in the 1970s [26], more recent work conducted in the US, UK, and in France has assigned a single, composite nutrient density score to individual foods. Nutrient density of foods was defined in terms of percent daily value of a given nutrient per reference amount (100 g, 100 kcal, or serving). Typically, the index nutrients were protein, fiber, calcium, iron, and vitamins A and C. The nutrient density score was then the mean (or the sum) of percent daily values, often capped at 100% daily value, in order to guard against inflated score values for foods containing abnormally high amounts of a single nutrient. For the purposes of this paper, we adopt a recent refinement, the Nutrient Balance Score [23], which quantifies the balance of nutrients from different foods in a composite meal. High Nutrient Balance scores, scaled to a maximum value of 100, indicate that a given combination of foods provided both nutrient adequacy and nutrient balance.

2.1.5. Population Share with Adequate Nutrients

Metrics of diet quality depend on collecting dietary intake data from actual respondents. While many methods exist, their applicability is bounded by effort, cost, and participant burden. The collection of dietary intake data to assess diet quality for individuals and groups is critical, given that there may be considerable variation in dietary intakes among individuals, often related to age, gender or socioeconomic status. Studies have shown that a significant share of a population may not be receiving adequate nutrients, even though the average nutrient intake appears to be sufficient [22]. These same authors presented a method for estimating this prevalence of adequate nutrient intakes in the population, defined as the percentage of the population with intakes above the Estimated Average Requirement (EAR). A population distribution of intakes was constructed for each nutrient around the mean by applying a coefficient of variation (CV) equal to previously reported inter-individual CVs of population nutrient intakes [28,29,30,31]. As estimates of this CV, Arsenault et al. used 25 percent for zinc, niacin, and vitamin B-6, 30 percent for calcium, riboflavin, and folate, 40 percent for vitamin C, and 45 percent for vitamin A. This indicator was then specified as the simple average of population shares across all such nutrients with sufficient data availability.

2.2. Ecosystem Stability

The commitment to shaping a more sustainable and more nutrient-rich food supply requires the development of metrics and tools to better understand the impact of food systems on the environment, broadly defined as land, water, and air, as well as biological ecosystems [7,10]. A food system cannot be considered sustainable unless its underlying resource base is sustained and it has neutral or positive impacts on important ecosystem services needed outside food systems. We characterize these overall impacts using the Ecosystem Stability metric, with an indicator that quantifies the current status of ecosystems (Ecosystem Status) [32], together with a group of indicators based on the notion of eco-efficiency—with higher scores for food systems that have lower per capita environmental impacts.
Robust quantitative approaches for describing the environmental impact of agricultural production systems (pre-farm gate) have been developed [15,33], but system boundaries for the analysis must be significantly expanded to include post-farm gate activities in order to quantify the overall impact of the food system on the environment. An example of such an approach using Life Cycle Assessment (LCA) modeling for a number of particular foods was recently reported by a multi-partner collaborative effort, the World Food LCA Database [34]. Based on current global data availability and our previous LCA modeling work [35], we are specifying four eco-efficiency indicators: GHG Emissions, Net Freshwater Withdrawals, Non-Renewable Energy Use, and Land Use, all on a per capita basis. When applied at the national level as they are here, these indicators refer to all food system activities that take place within that country’s borders, except for the GHG emissions and non-renewable energy use associated with movement (though not the production) of exported food, which are both allocated to the ultimate importing country.
All eco-efficiency metrics should be calculated using the accepted principles of LCA as specified in an appropriate International Organization for Standardization (ISO) standard, such as ISO 14040 [36]. As explained in the ISO standards, indirect effects and other forms of so-called “consequential” LCA (comparing current realities to hypothetical counterfactuals) can be used if properly documented. However, for the sake of simplicity, the definitions and example calculations provided in this paper use the more traditional form of LCA, known as “attributional” LCA. This approach considers only the actual emissions and use of resources that can be attributed to current activities—rather than, for instance, comparing them to the water use that would occur in a re-forested farm field, or such factors as indirect land use change.

2.2.1. Ecosystem Status

Among all food system activities, production has the largest ecosystem impacts, although many other aspects (infrastructure, processing, refrigeration, etc.) are also important. The overall national status of ecosystems has been quantified globally by the Yale University Center for Environmental Law & Policy and the Columbia University Center for International Earth Science Information Network using the Environmental Performance Index (EPI) [32]. The EPI ranks how well countries perform on high-priority environmental issues in two broad policy areas: protection of human health from environmental harm and protection of ecosystems. The underlying national data for EPI have been made available as open data, and a simple average of the following indicators (each already scaled 0–100) was calculated in order to construct this food system indicator of Ecosystem Status: Water Resources, Agriculture, Forests, Fisheries, and Biodiversity/Habitat. Additional measures of ecosystem status, such as desertification, salinization, and soil degradation would be desirable to include, but none has yet been reported on the global basis necessary for their inclusion at this time. Accordingly, we strongly endorse efforts to expand data collection and reporting of such additional indicators, so that they may be included in subsequent versions of this indicator.

2.2.2. Per Capita Greenhouse Gas (GHG) Emissions

It is widely recognized that anthropogenic GHG emissions (primarily CO2, N2O, and CH4) contribute to climate change, and that food system activities are an important source of such emissions [37]. Relevant food system activities include land transformation, food production, storage, transport, processing, retail, preparation, and post-consumer waste—the last of which results in significant CH4 (methane) emissions. However, as extensively summarized elsewhere [38], the largest agricultural emission sources are direct land use change (LUC), fertilizer production, fertilizer-based N2O emissions from soil, and methane (rice and ruminants). National GHG inventories and targets for emission reductions are managed through the United Nations Framework Convention on Climate Change (UNFCCC). Although these inventories do not currently contain separate GHG emission estimates for food systems, they do contain agricultural sector emissions (the largest contributor to food system emissions) and LCA modeling methods have now been used to expand the system boundary to include other food system activities [34]. Accordingly, this metric indicator is defined as per-capita annual food system GHG emissions (kg CO2e per person per year), converted to the 0–100 scale through the use of Equation (1). It explicitly includes methane emissions associated with food waste, and it includes the possibility for net carbon sequestration in soils, which is a large climate mitigation opportunity [39]. Recent studies have assessed nutrient density of foods in relation to their carbon footprint [9].

2.2.3. Per Capita Net Freshwater Withdrawals

Water consumption and scarcity have become local environmental issues of international concern. Without an adequate and timely supply of water, crop yields and agricultural efficiency are affected. A large part of the water use in food systems is associated with crop irrigation, but there are other (generally lesser) uses of water throughout food value chains [40]. Just as with GHG emissions, LCA modeling has advanced to the point that water use associated with food systems can now be calculated [34]. There are also published water use indicators which give greater weight to water consumption in areas where there is more competition for water resources [41]. For instance, using such methods, the same amount of water consumed in an arid region would get a much higher score than in a temperate region. However, based on stakeholder feedback we judge that such weighting methods have not yet gained sufficiently broad consensus, thus this indicator is defined as per-capita annual food system net freshwater withdrawals (m3 freshwater per person per year), regardless of where those withdrawals are made. By “net withdrawals” we refer to water consumption (i.e., water used by food systems that is no longer available for other users). It is converted to a 0–100 scale using Equation (1).

2.2.4. Per Capita Non-Renewable Energy Use

There is increasing concern about the high dependence of the global food system on its use of non-renewable energy, which currently accounts for approximately 30 percent of the world’s total energy consumption [42]. High-income countries use a greater portion of this energy for processing and transport, whereas in low-income countries, cooking consumes the highest share. The sharp increase in agricultural use of fossil fuels during the 20th century was largely responsible for the dramatic increase in global food supplies—by boosting fertilizer production, increasing farm mechanization, and improving food processing and transportation. However, cost and environmental sustainability considerations are likely to severely constrain future use of non-renewable energy sources, meaning that a metric indicator specific to such energy use is a highly relevant measure of food system performance. The metric indicator is thus defined as per-capita annual food system non-renewable energy use (MJ per person per year), and is converted to a 0–100 scale using Equation (1).

2.2.5. Per Capita Land Use

Only a finite amount of arable land is available for food production, and an increasing portion is lost each year due to urban sprawl, soil degradation, and factors related to climate change—such as rising sea levels and desertification [38]. It is therefore essential to ensure that existing crop and pasture land is managed in such a way that increasing demand is met without needing to bring new land into production. Such land transformation has major environmental impacts, not only due to global GHG emissions, but also by the harm it may cause to local ecosystems and biodiversity through the loss of natural habitat. Land use inventories are now routinely collected using an assortment of satellite-based earth-monitoring systems, and then reported globally by FAO and others.
Not all land use is equal. For instance, grazing land can provide multiple ecosystem services [43]. Accordingly, just as with water use, there are some efforts to weight categories of land use [41] depending on adjacent lands or the original native status of the land now being used in the food system. However, we have again judged such methods to not yet be appropriate for general use, thus this indicator is defined as per-capita food system land use (m2 per person per year), regardless of where the land use occurs and what kind it is (e.g., rangeland for grazing is included). It is converted to a 0–100 scale using Equation (1).

2.3. Food Affordability and Availability

Taste, cost, convenience, and cultural norms are the primary factors driving consumer food choices. Socioeconomic status and ease of access to foods also affect the type and nutrient quality of food purchases. These choices directly impact nutrition and sustainability outcomes, and the degree to which consumers have the capacity to make such choices is directly related to factors such as disposable income and food availability. At the national scale, additional measures of food access include the prevalence of poverty and the degree of income inequality. As detailed below, we are adopting four indicators: Food Affordability, Food Availability, Poverty Index, and Income Equality. The first three of these factors are reported annually as part of the Global Food Security Index (GFSI) [19]. The GFSI reporting system includes a spreadsheet providing country-level scores (0–100) for 109 countries for the years 2012–2015. This format is directly applicable to the methodology described herein and so no further adjustment is needed.
An additional economic metric that has been suggested by certain stakeholders is a measure of the economic health of the various players in the food system value chain. There are compelling arguments for doing so, as it is clear that these players, especially but not exclusively food producers, must remain financially viable if the overall food system is to remain sustainable. However, we were unable to identify a suitable, widely-accepted, globally-applicable indicator for characterizing the economic health of this sector, so we must leave this as a potential future enhancement of this metric.

2.3.1. Food Affordability

A commonly-used measure of food affordability that is already widely used among economists is simply the share of average annual income that goes to food [44]. As incomes rise, the amount of disposable income that is spent on food declines. Another set of indicators that have been used are calories and nutrients per unit cost [45]. It is possible to construct more complicated affordability metrics by including price volatility and price spikes, both likely under times of food-related shocks. This would require a subjective assessment of the effectiveness of the public structures that have been established to respond to personal or societal shocks [19]. However, these “resilience” factors are already addressed elsewhere within this overall system of metrics. We therefore chose to retain the simplest possible definition of this indicator: the share (as a percentage) of household expenditures on items other than food. An advantage of such a definition is that it may be simply computed for various future socioeconomic and climate scenarios through the use of an integrated model, such as IMPACT [24].

2.3.2. GFSI Food Availability

Affordable food has less value if access to it is difficult, volatile, or uncertain. The GFSI Food Availability metric measures factors that influence the supply of food and the ease of physical access to food. It examines how structural aspects determine a country’s capacity to produce and distribute food and explores elements that might create bottlenecks or risks to robust availability. Economies with fewer structural restrictions on food availability (from both markets and governments) and more advanced agricultural markets (in terms of both infrastructure and support for the sector) tend to have environments that are more conducive to food security. Such environments are often less at risk of food supply shocks and can handle shocks better when they arise. Accordingly, the GFSI examines several aspects of food availability to determine ease of access in each country, and they are calculated by the Economist Intelligence Unit (EIU) using a variety of data sources, including FAO, OECD, World Bank, and the World Food Programme, as well as additional qualitative scoring by EIU [19]. The GFSI Food Availability score is already on a 0–100 scale, so it is used directly as an indicator.

2.3.3. Poverty Index

There are many reasons why families may not have access to food, even when prices are affordable and it is present in the marketplace. One of the most fundamental is that there is no guarantee that a nation’s economy will generate a sufficient level of income for all families to be lifted out of poverty. An impoverished family may not have the resources to purchase the food they need. Alleviation of poverty is therefore a major focus of efforts to improve food and nutrition security [19]. One of the factors reported by GFSI, based on data tabulated by the World Bank, is the proportion of each country’s population living below the “poverty line,” defined either as $1.90/day or $3.10/day. Consistent with GFSI, we chose the $1.90/day threshold and converted the indicator to the desired format by simply expressing it as the percentage living above the $1.90/day threshold.

2.3.4. Income Equality

Recent research has shown that food security is not only impacted by poverty, but also by income inequality [46]. Such studies confirm what might be expected: self-sufficiency of food production and food availability are less likely to result in food reaching the poorest levels of the population when high levels of income inequality are present. Various measures for national income inequality have been proposed, including ratios of the income (or disposable income) levels for the lowest and highest quantiles (10% or 20%) of a country’s population. However, the measure of income inequality with the longest history of use is the Gini Coefficient, G, which has a value of 0 for the case of perfect income equality and unity (1 or 100) for the case of all income earned by a single individual in the country [47]. The indicator is thus transformed to the desired format using 100−G, with higher values indicating higher income equality.

2.4. Sociocultural Wellbeing

Sociocultural wellbeing is essential to sustainable development. Together with environmental and economic considerations, the subject of the two previous metrics, societal factors are widely considered to be the co-equal third “pillar” of sustainability [48]. The Sustainability Consortium has used a broad multi-stakeholder process to conduct an extensive “hot spot” analysis within food supply chains and has identified a number of potential societal issues within commercial supply chains for foods. We evaluated the list to determine which of these factors can be quantified using data currently available at the national scale. This analysis resulted in the selection of the following four “Sociocultural Wellbeing” indicators: Gender Equity, Extent of Child Labor, Respect for Community Rights, and Animal Health & Welfare.

2.4.1. Gender Equity

Women assume critical roles in attaining each of the pillars of food security: availability, access, and utilization. Their role is thus crucial throughout the agricultural value chain, from production on the family plot, to food preparation, to distribution within the household [49]. Serious concerns over gender equity are present within food systems in many countries, especially where mothers find themselves unavoidably involved in smallholder farming activities—potentially putting their children at risk. These issues have been the subject of numerous investigative efforts by international organizations, including FAO, the International Fund for Agricultural Development (IFAD), the International Labour Office (ILO), and the World Economic Forum. The Global Gender Gap Index (GGGI) was developed by the World Economic Forum as a framework for assessing the magnitude of gender disparity [50], and has been chosen as the basis for this indicator. The GGGI ranked 140 countries using a methodology that particularly focuses on identifying gender gaps in access to resources. This allows for the comparison of countries regardless of their level of economic development. The four indicators used to derive the overall GGGI are economic participation and opportunity, educational attainment, health and survival, and political empowerment. The GGGI is reported by the World Economic Forum on a scale of 0–1 and is simply multiplied by 100 in order to be used as an indicator.

2.4.2. Extent of Child Labor

As a potential consequence of gender inequity and unequal wage earning, children may be forced to work and forgo schooling to ensure financial security for their family [51]. In this report, the ILO has undertaken an analysis of global progress toward reducing child labor. It outlines the percentage of child labor by country, socioeconomic status, and sectoral distribution (including agriculture, the most frequent occupation for children). The ILO has not presented their data in a form that is directly applicable as an indicator, but one can be easily constructed. The Child Labor indicator is calculated as the percentage of children (ages 5–17, the ILO definition) in a country that are employed in the food system. As with the environmental indicators, this is converted to a 0–100 score through the use of Equation (1).

2.4.3. Respect for Community Rights

One of the key social issues that has been identified in food supply chains is the topic of “community rights”, particularly when smallholder farmers in lower income countries act as suppliers for corporate buyers. The World Resources Institute (WRI) has recently undertaken a new effort to quantify the degree to which community rights can be equitably maintained in such relationships, by defining the Environmental Democracy Index (EDI) [52]. The index is based on the presence of appropriate legal protections of community rights in the form of national laws, such as those that integrate provisions that support good practice—such as timely, affordable, and proactive information disclosure. EDI launched for the first time in May 2015 with results disseminated on a publicly available online platform that provides in-depth country information, open data, and rankings of countries at various levels of granularity. The EDI is reported on a finite scale ranging from 0 to 2.39, so multiplying by a factor of 40 results in scores on the desired 0–100 scale.

2.4.4. Animal Health and Welfare

Animal health and welfare in agricultural settings has become an increasing societal concern, and has recently led to the publication of the Animal Protection Index (API), which ranks countries on their commitment to animal protection [53], and can be used to quantify this indicator. The index suggests that many countries are lacking in terms of animal welfare, due to issues ranging from illegal wildlife trafficking to the culling of stray animals. A large number of countries are still missing the basic legal frameworks needed to protect animal health and welfare. The API ranking scheme gives letter grades to ranked countries ranging from a high of “A” to a low of “G.” This is converted to the numeric 0–100 scale as follows: A =95, B = 85, C = 75, D = 65, E = 55, F = 45, G =35.

2.5. Resilience

Extreme events, including those related to climate change (droughts, floods, heat-waves), have begun to induce excessive volatility in global food prices [44], causing the United Kingdom to recently sponsor a special report on the resilience of the global food system [54]. This UK report investigated the immediate impacts and indirect effects (due to a variety of potentially unhelpful national responses) of a multiple breadbasket failure. Such shocks threaten food security and livelihoods in complex ways that challenge conventional approaches to providing humanitarian and development assistance.
Resilience has been defined by the USAID as the ability of people, households, communities, countries, and systems to mitigate, adapt to, and recover from shocks and stresses in a manner that reduces chronic vulnerability and facilitates inclusive growth. Resilience is also defined as the capacity that ensures adverse stressors and shocks do not have long-lasting adverse development consequences [55]. Resilience is difficult to measure, but there has been one comprehensive effort to quantify it at the national-level, the ND-GAIN Index [18], one of the two indicators we have chosen to quantify overall resilience. The other is a measure of diversity in food production, which also helps build resilience by avoiding the potential for catastrophic consequences due to the loss of a single crop (such as Ireland’s historic potato famine of the mid-19th century).

2.5.1. ND-GAIN Country Index

The University of Notre Dame Global Adaptation Index (ND-GAIN Country Index) summarizes a country’s vulnerability to climate change and other global challenges in combination with its readiness to improve resilience, with the goal of improving prioritization of investments for climate adaptation. The ND-GAIN score is composed of a vulnerability score and a readiness score. Vulnerability measures a country's exposure, sensitivity, and capacity to adapt to the negative effects of climate change. Readiness measures a country’s ability to leverage investments and convert them to adaptation actions, considering economic-, governance- and social-readiness. We acknowledge that not all of the ND-GAIN underlying indicators are strictly relevant to food systems and that additional factors might be reasonable to include, especially ones relating to preparedness to drought and coastal flooding. Nevertheless, ND-GAIN represents the best available overall indicator for vulnerability and readiness. The overall score is already reported on a 0–100 scale, so it is directly used as an indicator.

2.5.2. Food Production Diversity

Food production diversity at the national level has recently been reported based on the use of Equation (2) (Shannon Diversity) by the authors previously cited in Section 2.1 [21]. In this case, however, instead of the shares (si) representing items in the food supply, they refer to the shares of agricultural production for the country, again by weight of each food produced in the country. As in the case of the previous indicator, a constant multiplicative factor is used to scale the indicator to a 0–100 scale: 100/ln(N), where N is again the total number of foods being considered.

2.6. Food Safety

Foods must obviously be free of biological and chemical hazards if they are to safely provide human nutrition. Some of these hazards, particularly harmful microorganisms, are expected to become an increasing concern under climate change, due to the more rapid growth possible with higher humidity and higher temperatures [56]. Potential hazards exist throughout supply chains, and there is extensive monitoring for foodborne disease, as summarized in the Global Burden of Foodborne Illnesses (GBFI) food safety report [57], which serves as one of the two “Food Safety” indicators. The other indicator comes from the previously cited GFSI report, which contains an independent assessment of country-level efforts to ensure food safety [19].

2.6.1. Foodborne Disease Burden

The most critical measure of food safety for public health is the incidence of foodborne diseases. Accordingly, WHO launched an initiative in 2006 to produce the GBFI report [57]. The report contains information by WHO region (not individual country-level data) on mortality, morbidity, and disability-adjusted life years (DALYs) associated with each major foodborne disease, including enteric diseases, chemicals and toxins, and parasitic diseases. Additionally, the WHO has developed models for estimating foodborne disease burden where current data are lacking. This report provides estimates of the global burden of foodborne diseases, according to age, sex, and region for a defined list of causative agents of microbial, parasitic, and chemical origin. Although reported at the regional, not the individual country level, the GBFI data are nevertheless the best estimates of foodborne disease and are used to estimate the indicator (based on the regional value). The GBFI are translated to the 0–100 scale through the use of Equation (1).

2.6.2. GFSI Food Safety

An additional measure of food safety is being reported annually in the Global Food Security Index (GFSI) [19]. This metric comprises three indicators: (1) whether the country has a regulatory agency to ensure food safety; (2) the percentage of the population with access to potable water; and (3) the presence of a formal grocery sector.
The presence of a regulatory agency to ensure food safety is a qualitative 0–1 (0 = No, 1 = Yes) indicator scored by EIU analysts based on latest available data from 2009 to 2015. The percentage of the population with access to potable water is a quantitative score based on data from the World Bank assessing the percentage of the population with access to potable water using drinking water sources, household connection, public standpipe, borehole, protected dug well, protected spring, and rainwater. The presence of a formal grocery sector qualitatively is scored by EIU analysts on a 0–2 scale (0 = Minimal presence; 1 = Moderate presence; 2 = Widespread presence). The overall GFSI Food Safety metric is calculated from these three indicator indicators using internal weighting and reported annually on a (0–100) scale, which can be used directly as the indicator.

2.7. Waste and Loss Reduction

The FAO estimates that approximately one-third (by weight) of all food produced for human consumption is lost or wasted each year [58]. Pre-consumer losses are relatively more important than post-consumer waste in lower income countries, whereas post-consumer waste is greatest in higher income countries. The environmental and economic costs associated with food waste and loss are immense. As noted previously, food systems generate a significant fraction of GHG emissions, are responsible for the majority of net freshwater withdrawals, and negatively impact biodiversity. Further, if decomposition occurs in predominantly anaerobic environments, much of the wasted food generates CH4, adding to the overall environmental burden of the world’s food systems.
The proposed metric to quantify Waste and Loss Reduction is to simply express, as a percentage, the portion of the produced food that is not either lost (pre-consumer) or wasted (post-consumer). As noted above, about one-third of all produced food suffers one of these two fates, so the average value of this metric for all countries is a little less than 70. This includes the portion of produced food crops that are not harvested and left in the field. However, inedible or unused portions of food that are intentionally used for other purposes (such as energy generation or to restore soils) should not be counted as waste.
Although it has not yet been formally published at the time of this writing, the new “Food Loss and Waste Protocol” (FLW Protocol) now being finalized by the World Resources Institute [59] is a critical multi-stakeholder effort to develop the global accounting and reporting standard for quantifying food and associated inedible parts removed from the food supply chain. It is intended to enable a wide range of entities—countries, companies, and other organizations—to account for and report in a credible, practical, and internationally-consistent manner how much food loss and waste is created and to identify where it occurs, enabling the targeting of efforts to reduce it. We anticipate that this protocol will provide the most appropriate methodology to follow when attempting to quantify this metric in the future.

3. Use of the Metrics

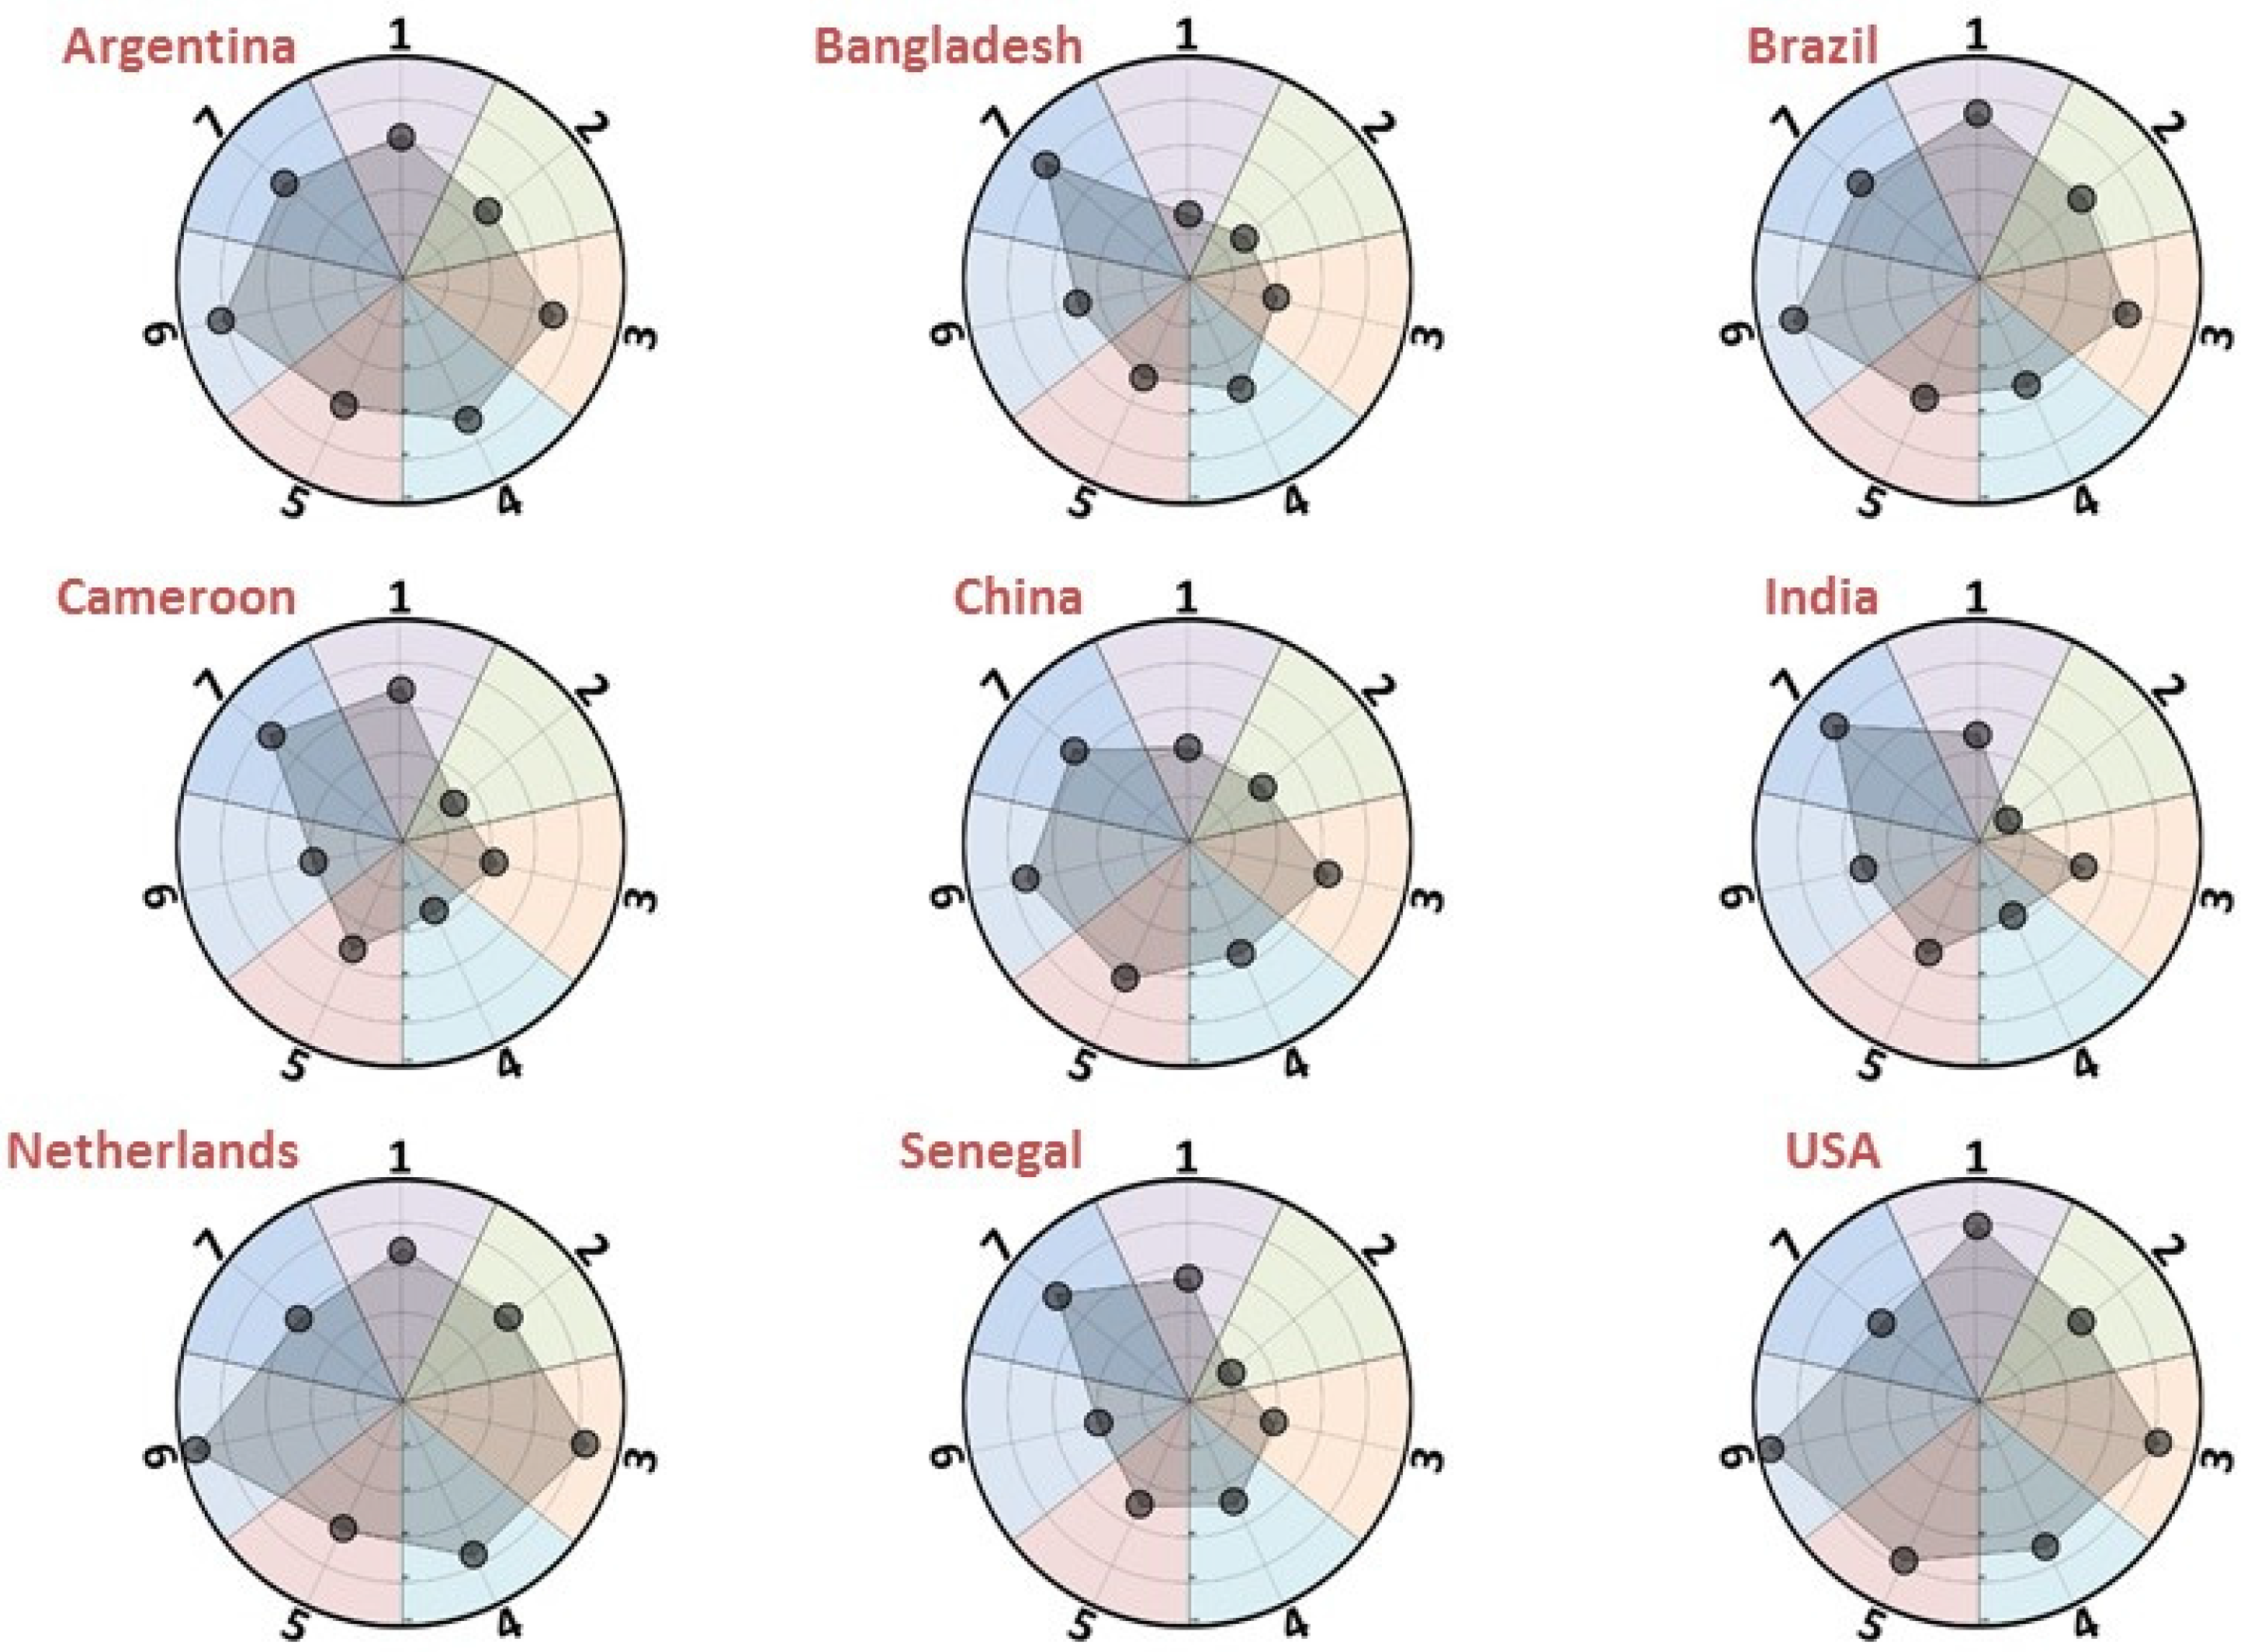
3.1. Example Application to Assess Current SNS Status

As a first example use of the metrics, they were used to describe the current status of SNS among nine countries for which data were readily available from the previously cited literature (see Figure 2). The calculations and data sources used to produce this figure are available in a spreadsheet posted as Supplementary Information to this paper.
Some interesting patterns emerge in this first application of the metrics. Not surprisingly, “Food Nutrient Adequacy” is low in Bangladesh and is highest in the two higher-income countries included in the analysis (The Netherlands and USA). “Ecosystem Stability” is quite low in India, due to the relatively large amount of non-renewable energy use and irrigation in that country. “Food Affordability and Availability” reaches its lowest value in Senegal, but is also quite low in Bangladesh, Cameroon, and India. “Sociocultural Wellbeing” is lowest in Cameroon and India, while Bangladesh has the lowest Resilience score. “Food Safety” is very high in Argentina, Brazil, China, The Netherlands, and USA. The only category where the high income countries (The Netherlands and USA) score worse than other countries is on “Waste and Loss Reduction,” due to their relatively high post-consumer food waste.
Projections of future SNS status are of keen interest to many stakeholders, and these metrics are intended to eventually be incorporated into integrated models such as IMPACT [24] in order to better quantify the effect of climate and water availability changes on future nutrition and sustainability outcomes. One example of this approach already underway involves the calculation of the “Food Nutrient Adequacy” metrics from IMPACT model run results (Nelson et al., in preparation).

3.2. Selection of New Food System Practices

The metrics proposed here are ideal for assessing the effectiveness of food system policies and practices intended to improve human nutrition and sustainability outcomes. Such developments are urgently needed in order to build resilience of the global food system to extreme weather under climate change [54]. For instance, greater adoption of Climate-Smart Agriculture (CSA) practices is one set of actions that may be implemented, including practices that mitigate emissions and build more resilient systems [60]. Modeled values for the seven metrics could be used to assess the relative merits of adopting particular food system policies and practices.

3.3. Setting Targets and Monitoring Progress

The metrics can also be used to set targets and monitor progress on the adoption and impact of new food system practices specifically tailored to the needs of particular countries, especially those relevant to attaining the newly adopted SDGs. Food systems have been characterized as complex adaptive systems [61], which means that unintended consequences are possible. For instance, a recommendation to eat more fruits and vegetables may cause additional ground water depletion in drought-stricken areas and have impacts on social systems through increased immigrant labor requirements. It is therefore essential that whatever metrics are utilized are intrinsically holistic and therefore capable of detecting such nuanced effects. The metrics presented here are specifically intended to do just that, making it possible for policy-makers and investors to set targets on particular areas of current interest (e.g., more nutritious diets), while at the same time having confidence that economic, environmental, and social measures of sustainability are being monitored and potentially improved as well.

4. Conclusions

Multiple lines of evidence confirm that climate change, extreme weather, and dwindling natural resources represent major challenges for food systems to meet accelerating global demand in a manner that will both sustainably meet human nutrition needs and comply with planetary constraints. The food system metrics presented here make it possible—for the first time—to holistically and accurately measure food system performance across all relevant domains of interest: nutrition, environment, economic, social, resilience, safety, and waste. This new methodology thus allows quantification of sustainable nutrition security (SNS), an approach which can now be deployed by decision-makers and investors to set meaningful goals, track progress on SDGs, and evaluate the potential impact of food system interventions intended to improve both human and planetary health. As shown by the examples we have presented, the metrics can be applied to both highly- and less-developed countries. Although our focus in this paper has been on the application of the metrics at the national scale, we believe some or all of the metrics would also have practical utility at smaller geographic scales, albeit with the requirement for collecting and reporting data of finer spatial resolution. We also note that a lack of data for some countries on some of these indicators could represent a lack of policy monitoring and therefore highlight areas for action.

Supplementary Files

Supplementary File 1

Acknowledgments

Many scientists contributed to recent research and discussions that served as the underlying basis for this paper, including the very helpful comments of an anonymous peer-reviewer. Space prohibits us from mentioning all of them, but they include: Tara Acharya, Lindsay Allen, Joanne Arsenault, Steve Betz, Laura Birx, Jessica Bogard, Ken Boote, Marisa Caipo, Joyce Coffee, Janet Collins, Karen Cooper, Brecht Devleesschauwer, Dona Dickinson, Frank Ewert, John Finley, Martijn Gipmans, Rachel Goldstein, Stephen Hall, Paul Hendley, Margaret Henry, Mario Herrero, Mark Howden, Molly Jahn, Sander Janssen, James Jones, Ahmed Kablan, Sue Krebs-Smith, Sascha Lamstein, Marie Latulippe, Ray Layton, Uma Lele, Gene Lester, Keith Lividini, Hermann Lotze-Campen, Sarah Lowder, Matt Lyon, John McDermott, Morven McLean, Hans van Meijl, Gerald Nelson, Rosie Newsome, Victor Pinga, Roseline Remans, Malcolm Riley, Kai Robertson, Mark Rosegrant, Anne Roulin, Sherman Robinson, Barbara Schneeman, Bob Scholes, Erin Sexson, Emily Shipman, Nathalie Sinclair, Christy Melhart Slay, Pamela Starke-Reed, Anne Swindale, Sherry Tanumihardjo, Gail Tavill, Allison Thomson, Dominique van der Mensbrugghe, Michael Wach, Richard Waite, Keith Wiebe, and Manfred Zeller. The work of these tremendously gifted scientists, who were all so generous with their time and efforts, is warmly appreciated.

Author Contributions

David Gustafson, Jessica Fanzo, and John Ingram conceived the original concept for the paper and wrote much of the original text. David Gustafson served in the role of convening lead author throughout the drafting process and wrote the greatest amount of text. Alona Gutman and Whitney Leet provided additional research and text. Adam Drewnowski last joined the author team, providing critical review and adding additional text. Alona Gutman provided a final proofread of the submitted text.

Conflicts of Interest

The authors declare no conflict of interest.

References

  1. Mathijs, E. Sustainable Food Consumption and Production in a Resource-constrained World; European Commission: Brussels, Belgium, 2012. [Google Scholar]
  2. Food and Agriculture Organization (FAO); International Fund for Agricultural Development (IFAD); World Food Programme (WFP). The State of Food Insecurity in the World 2015: Meeting the 2015 International Hunger Targets: Taking Stock of Uneven Progress; FAO: Rome, Italy, 2015. [Google Scholar]
  3. International Food Policy Research Institute. Global Nutrition Report 2015: Actions and Accountability to Advance Nutrition and Sustainable Development; International Food Policy Research Institute: Washington, DC, USA, 2015. [Google Scholar]
  4. Intergovernmental Panel on Climate Change (IPCC). Climate Change 2014: Impacts, Adaptation, and Vulnerability: Summary for Policymakers; IPCC: Geneva, Switzerland, 2014. [Google Scholar]
  5. World Health Organization (WHO). Countries Vow to Combat Malnutrition through Firm Policies and Actions; WHO: Geneva, Switzerland, 2014. [Google Scholar]
  6. Acharya, T.; Fanzo, J.; Gustafson, D.; Ingram, J.; Schneeman, B.; Allen, L.; Boote, K.; Drewnowski, A.; Ewert, F.; Hall, S.; et al. Assessing Sustainable Nutrition Security: The Role of Food Systems; International Food Policy Research Institute: Washington, DC, USA, 2014. [Google Scholar]
  7. Fanzo, J.; Cogill, B.; Mattei, F. Metrics of Sustainable Diets and Food Systems; CGIAR: Washington, DC, USA, 2012. [Google Scholar]
  8. Drewnowski, A.; Fulgoni, V.L. Nutrient density: Principles and evaluation tools. Am. J. Clin. Nutr. 2014, 99 (Suppl. 5), 1223S–1228S. [Google Scholar] [CrossRef] [PubMed]
  9. Drewnowski, A.; Rehm, C.D.; Martin, A.; Verger, E.O.; Voinnesson, M.; Imbert, P. Energy and nutrient density of foods in relation to their carbon footprint. Am. J. Clin. Nutr. 2014, 101, 184–191. [Google Scholar] [CrossRef] [PubMed]
  10. Ingram, J. A food systems approach to researching food security and its interactions with global environmental change. Food Secur. 2011, 3. [Google Scholar] [CrossRef]
  11. Organisation for Economic Co-operation and Development (OECD). Glossary of Key Terms in Evaluation and Results Based Management; OECD: Paris, France, 2002. [Google Scholar]
  12. ILSI Research Foundation. ILSI Research Foundation Gathers Stakeholder Input on the Ability of Our Food Systems to Achieve Long- term Nutrition Security; ILSI Research Foundation: Washington, DC, USA, 2015. [Google Scholar]
  13. World Bank. From Agriculture to Nutrition: Pathways, Synergies and Outcomes; World Bank: Washington, DC, USA, 2007. [Google Scholar]
  14. Open Data Institute. How Can We Improve Agriculture, Food, and Nutrition with Open Data; Open Data Institute: London, UK, 2015. [Google Scholar]
  15. BASF. AgBalance Technical Background Paper; BASF: Ludwigshafen, Germany, 2012. [Google Scholar]
  16. Nguefack-Tsague, G.; Klasen, S.; Zucchini, W. On weighting the components of the human development index: A statistical justification. J. Hum. Dev. Capab. 2011, 12, 183–202. [Google Scholar] [CrossRef]
  17. Chowdhury, S.; Squire, L. Setting weights for aggregate indices: An application to the commitment to development index and human development index. J. Dev. Stud. 2006, 42, 761–771. [Google Scholar] [CrossRef]
  18. Chen, C.; Noble, I.; Hellmann, J.; Coffee, J.; Murillo, M.; Chawla, N. University of Notre Dame Global Adaptation Index Country Index Technical Report; ND-GAIN: South Bend, IN, USA, 2015. [Google Scholar]
  19. The Economic Intelligence Unit. Global Food Security Index 2015: An Annual Measure of the State of Global Food Security; The Economic Intelligence Unit: New York, NY, USA, 2015. [Google Scholar]
  20. Guenther, P.M.; Casavale, K.O.; Reedy, J.; Kirkpatrick, S.I.; Hiza, H.A.B.; Kuczynski, K.J.; Kahle, L.L.; Krebs-Smith, S.M. Update of the healthy eating index: HEI-2010. J. Acad. Nutr. Diet. 2013, 113, 569–580. [Google Scholar] [CrossRef] [PubMed]
  21. Remans, R.; Wood, S.A.; Saha, N.; Anderman, T.L.; Defries, R.S. Measuring nutritional diversity of national food supplies. Glob. Food Secur. 2014, 3, 174–182. [Google Scholar] [CrossRef]
  22. Arsenault, J.E.; Hijmans, R.J.; Brown, K.H. Improving nutrition security through agriculture: An analytical framework based on national food balance sheets to estimate nutritional adequacy of food supplies. Food Secur. 2015, 7, 693–707. [Google Scholar] [CrossRef]
  23. Fern, E.B.; Watzke, H.; Barclay, D.V.; Roulin, A.; Drewnowski, A. The nutrient balance concept: A new quality metric for composite meals and diets. PLoS ONE 2015, 10, e0130491. [Google Scholar]
  24. Rosegrant, M.W. International Model for Policy Analysis of Agricultural Commodities and Trade (IMPACT) Model Description; International Food Policy Research Institute (IFPRI): Washington, DC, USA, 2012. [Google Scholar]
  25. Petchey, O.L.; Gaston, K.J. Functional diversity: Back to basics and looking forward. Ecol. Lett. 2006, 9, 741–758. [Google Scholar] [CrossRef] [PubMed]
  26. Drewnowski, A. Concept of a nutritious food: Toward a nutrient density score. Am. J. Clin. Nutr. 2005, 82, 721–732. [Google Scholar] [PubMed]
  27. Espinoza-Orias, N.; Roulin, A.; Watzke, H.; Cooper, K. Connecting the dots: Assessing sustainable nutrition at Nestlé. In Proceedings of the 9th International Conference on LCA of Food, San Francisco, CA, USA, 8–10 October 2014; American Center for Life Cycle Assessment: San Francisco, CA, USA, 2014; p. 10. [Google Scholar]
  28. Willett, W.C.; Sampson, L.; Stampfer, M.J.; Rosner, B.; Bain, C.; Witschi, J.; Hennekens, C.H.; Speizer, F.E. Reproducibility and validity of a semiquantitative food frequency questionnaire. Am. J. Epidemiol. 1985, 122, 51–65. [Google Scholar] [PubMed]
  29. Nelson, M.; Black, A.E.; Morris, J.A.; Cole, T.J. Between- and within-subject variation in nutrient intake from infancy to old age: Estimating the number of days required to rank dietary intakes with desired precision. Am. J. Clin. Nutr. 1989, 50, 155–167. [Google Scholar] [PubMed]
  30. Calloway, D.H.; Murphy, S.P.; Beaton, G.H.; Lein, D. Estimated vitamin intakes of toddlers: Predicted prevalence of inadequacy in village populations in Egypt, Kenya, and Mexico. Am. J. Clin. Nutr. 1993, 58, 376–384. [Google Scholar] [PubMed]
  31. Murphy, S.P.; Beaton, G.H.; Calloway, D.H. Estimated mineral intakes of toddlers: Predicted prevalence of inadequacy in village populations in Egypt, Kenya, and Mexico. Am. J. Clin. Nutr. 1992, 56, 565–572. [Google Scholar] [PubMed]
  32. Hsu, A.; Emerson, J.; Levy, M.; de Sherbinin, A.; Johnson, L.; Malik, O.; Schwartz, J.; Jaiteh, M. The 2014 Environmental Performance Index; Yale Center for Environmental Law and Policy: New Haven, CT, USA, 2014. [Google Scholar]
  33. Field to Market. Environmental and Socioeconomic Indicators for Measuring Outcomes of on-Farm Agricultural Production in the United States; Field to Market: Washington, DC, USA, 2012. [Google Scholar]
  34. Nemecek, T.; Bengoa, X.; Lansche, J.; Mouron, P.; Riedener, E.; Rossi, V.; Humbert, S. Methodological Guidelines for the Life Cycle Inventory of Agricultural Products, Version 3.0; World Food LCA Database: Lausanne and Zurich, Switzerland, 2015. [Google Scholar]
  35. Gustafson, D.; Collins, M.; Fry, J.; Smith, S.; Matlock, M.; Zilberman, D.; Shryock, J.; Doane, M.; Ramsey, N. Climate adaptation imperatives: Global sustainability trends and eco-efficiency metrics in four major crops—Canola, cotton, maize, and soybeans. Int. J. Agric. Sustain. 2014, 12, 146–163. [Google Scholar] [CrossRef]
  36. International Organization for Standardization (ISO). ISO 14040: 2006—Environmental management—Life Cycle Assessment—Principles and Framework; ISO: Geneva, Switzerland, 2010. [Google Scholar]
  37. Vermeulen, S.J.; Campbell, B.M.; Ingram, J.S.I. Climate change and food systems. Annu. Rev. Environ. Resour. 2012, 37, 195–222. [Google Scholar] [CrossRef]
  38. Intergovernmental Panel on Climate Change (IPCC). 2014: Agriculture, forestry and other land use (AFOLU). In Climate Change 2014: Mitigation of Climate Change; Working Group III to the Fifth Assessment Report of the Intergovernmental Panel on Climate Change; IPCC: Geneva, Switzerland, 2014. [Google Scholar]
  39. Lal, R. Soil carbon sequestration to mitigate climate change. Geoderma 2004, 123, 1–22. [Google Scholar] [CrossRef]
  40. Birendra, K.C.; Schultz, B.; Prasad, K. Water management to meet present and future food demand. Irrig. Drain. 2011, 60, 348–359. [Google Scholar]
  41. Selerant EcodEX Overview. Available online: http://www.selerant.com/main/en-us/solutions/ecodesign.aspx (accessed on 22 July 2015).
  42. Food and Agriculture Organization (FAO). “Energy Smart” Food for People and Climate; FAO: Rome, Italy, 2011. [Google Scholar]
  43. Skaggs, R. Ecosystem services and western U.S. rangelands. Choices 2008, 23, 37–41. [Google Scholar]
  44. World Bank. Responding to Higher and More Volatile World Food Prices; World Bank: Washington, DC, USA, 2012. [Google Scholar]
  45. Drewnowski, A. The Nutrient Rich Foods Index helps to identify healthy, affordable foods. Am. J. Clin. Nutr. 2010, 91, 1095S–1101S. [Google Scholar] [CrossRef] [PubMed]
  46. Karmakar, S.; Sarkar, D. Income inequality, poverty and food security in West Bengal, India. J. Soc. Sci. Stud. 2014, 1, 31–43. [Google Scholar] [CrossRef]
  47. Gini, C. Concentration and dependency ratios. Riv. Politica Econ. 1997, 87, 769–789. (In Italian) [Google Scholar]
  48. The Sustainability Consortium. Transforming the Consumer Goods Industry to Deliver More Sustainable Consumer Products; The Sustainability Consortium: Fayetteville, AR, USA, 2015. [Google Scholar]
  49. Food and Agriculture Organization (FAO). Gender Equality and Food Security—Women’s Empowerment As a Tool against Hunger; FAO: Rome, Italy, 2013. [Google Scholar]
  50. World Economic Forum. The Global Gender Gap Report; World Economic Forum: Geneva, Switzerland, 2014. [Google Scholar]
  51. International Labour Organization (ILO). Marking Progress against Child Labour: Global Estimates and Trends 2000–2012; ILO: Geneva, Swizerland, 2013. [Google Scholar]
  52. World Resources Institute (WRI). The Environmental Democracy Index; WRI: Washington, DC, USA, 2015. [Google Scholar]
  53. World Animal Protection Animal Protection Index. Available online: http://www.worldanimalprotection.org/news/ground-breaking-animal-protection-index-assesses-animal-welfare-around-world (accessed on 5 November 2015).
  54. UK Global Food Security Programme. Extreme Weather and Resilience of the Global Food System (2015); Final Project Report from the UK-US Taskforce on Extreme Weather and Global Food System Resilience; UK Global Food Security Programme: London, UK, 2015. [Google Scholar]
  55. Federation of Saskatchewan Indian Nations (FSIN). A Common Analytical Model for Resilience Measurement; FSIN: Saskatoon, SK, Canada, 2014. [Google Scholar]
  56. Miraglia, M.; Marvin, H.J.P.; Kleter, G.A.; Battilani, P.; Brera, C.; Coni, E.; Cubadda, F.; Croci, L.; De Santis, B.; Dekkers, S.; et al. Climate change and food safety: An emerging issue with special focus on Europe. Food Chem. Toxicol. 2009, 47, 1009–1021. [Google Scholar] [PubMed]
  57. World Health Organization (WHO). WHO Estimates of the Global Burden of Foodborne Diseases; WHO: Geneva, Switzerland, 2015. [Google Scholar]
  58. Food and Agriculture Organization (FAO). Food Wastage Footprints; FAO: Rome, Italy, 2013. [Google Scholar]
  59. World Resources Institute Food Loss and Waste Protocol. Available online: http://www.wri.org/our-work/project/global-food-loss-and-waste-measurement-protocol/documents-and-updates#project-tabs (accessed on 8 January 2016).
  60. Food and Agriculture Organization (FAO). Climate-Smart Agriculture Sourcebook; FAO: Rome, Italy, 2013. [Google Scholar]
  61. International Organization for Migration (IOM); National Research Council (NRC). A Framework for Assessing Effects of the Food System; IOM: Washington, DC, USA, 2015. [Google Scholar]
Figure 1. Food system metric indicators.
Sustainability 08 00196 g001
Figure 2. Example food system metric calculations of present-day conditions. The areas of the polygons represent relative national status of sustainable nutrition security (SNS). 1. Food Nutrient Adequacy; 2. Ecosystem Stability; 3. Food Affordability & Availability; 4. Sociocultural Wellbeing; 5. Resilience; 6. Food Safety; 7. Waste & Loss Reduction.
Sustainability 08 00196 g002
Table 1. Food System Metrics and their Indicators.
MetricIndicatorSection NumberWeighting Factor
Food Nutrient AdequacyNon-Staple Food Energy2.1.10.20
Shannon Diversity2.1.20.20
Modified Functional Attribute Diversity2.1.30.20
Nutrient Density Score2.1.40.20
Population Share with Adequate Nutrients2.1.50.20
Ecosystem StabilityEcosystem Status2.2.10.20
Per-Capita Greenhouse Gas (GHG) Emissions2.2.20.20
Per-Capita Net Freshwater Withdrawals2.2.30.20
Per-Capita Non-Renewable Energy Use2.2.40.20
Per-Capita Land Use2.2.50.20
Food Affordability & AvailabilityFood Affordability2.3.10.25
GFSI Food Availability Score2.3.20.25
Poverty Index2.3.30.25
Income Equality2.3.40.25
Sociocultural WellbeingGender Equity2.4.10.25
Extent of Child Labor2.4.20.25
Respect for Community Rights2.4.30.25
Animal Health & Welfare2.4.40.25
ResilienceND-GAIN Country Index2.5.10.50
Food Production Diversity2.5.20.50
Food SafetyFoodborne Disease Burden2.6.10.50
GFSI Food Safety Score2.6.20.50
Waste & Loss ReductionPre- & Post-Consumer Food Waste & Loss2.71.00
Section number indicates where the indicator is defined and discussed. GFSI: Global Food Security Index; ND-GAIN: Notre Dame Global Adaptation Index.

