Article

The Effects of Urban Policies on the Development of Urban Areas

by
Federico Amato
1,
Biagio Antonio Maimone
1,
Federico Martellozzo
2,*,
Gabriele Nolè
3 and
Beniamino Murgante
1
1
School of Engineering, University of Basilicata, Viale dell’Ateneo Lucano 10, 85100 Potenza, Italy
2
Department of Methods and Models for Economics, University of Rome “La Sapienza”, Via Del Castro Laurenziano 9, 00161 Roma, Italy
3
Italian National Research Council, IMAA C.da Santa Loja, Tito Scalo, Potenza 85050, Italy
*
Author to whom correspondence should be addressed.
Sustainability 2016, 8(4), 297; https://doi.org/10.3390/su8040297
Submission received: 31 December 2015 / Revised: 10 March 2016 / Accepted: 14 March 2016 / Published: 24 March 2016
(This article belongs to the Special Issue 5th World Sustainability Forum - Selected Papers)

Abstract

:
For more than a decade, the European Union recognizes soil as a common good and considers it as a finite resource of inestimable value. The European Union defines it as the “upper layer of earth’s crust, formed by mineral particles, organic matter, water, air and living organisms”. Despite such definitions, usually, planning choices do not take into account the need to reduce soil consumption to build up resilience. This paper presents the controversial case of Agri Valley (Basilicata, Southern Italy); on the one hand, this region is characterized by the presence of extremely valuable land, because of the exceptional degree of soil fertility; on the other hand, Valdagri is also known to have one of the largest oilfields of Europe. An application built around the SLEUTH model was developed in order to produce a simulation and an estimate of the extent to which urban areas may grow in the near future. Results confirm that urban policies implemented so far by local governments—which aimed almost exclusively to favor industrial development—irreversibly threaten the integrity of the natural values of the valley.

1. Introduction

On September 2015 the UN defined and formalized the agenda for sustainable development during a meeting held in New York. The Sustainable Development Goals (SDGs) set specific targets to be globally achieved [1].
Objective Two “Hunger and food security” aims to set hunger to zero. Among the specific objectives of this category, we find the need to double agricultural productivity and incomes deriving from agricultural production in local systems by 2030.
Objective Eleven “Cities” aims to make towns and human settlements more inclusive, safe, resilient and sustainable. This also means reducing per capita rate of air pollution in cities by 2030. This is connected to the necessity of taking urgent actions to reduce climate change.
Finally, protecting and promoting the sustainable use of forests and wetlands, in addition to the reduction of desertification and soil consumption are clearly defined objectives within the goal Fifteen “Sustainably manage forests, combat desertification, halt and reverse land degradation, halt biodiversity loss”.
Human activity, however, generates effects on land use in conflict with the SDGs set by the United Nations. The main challenge for scientists and politicians is to reduce the negative impacts of human activities on the environment, keeping safe the economic and social benefits derived from them.
One of the main threats connected to human activity is soil consumption. A unique definition for this phenomenon still does not exist. In literature, numerous scientific and institutional contributions fueled such debate; however, in spite of the many true findings elicited, still shared consensus on this topic is lacking. In this case, we base our investigation on the simplest definition of land consumption, which sees it as a “change of land cover from natural to artificial“.
The progressive expansion of urban areas and the increased spreading of human settlements (often defined as urban sprawl) onto surrounding natural land, result in a substantial acceleration of soil sealing, thus smoothing the demarcation line between urban and rural areas. Indeed, it is not the entire urbanized area to be covered with artificial materials, such as asphalt or concrete for buildings and roads; in fact, there are also other components such as gardens, parks and other green spaces which do not represent an impermeable surface. However, this does not seem to decelerate the soil sealing process. Impermeabilization is considered among the most important causes of soil degradation in Europe. It involves the rise of flooding risk, contributes to global warming, and represents a threat to biodiversity preservation.
Nevertheless, this phenomenon awakes particular concern when urbanization interests areas that once were fertile farmlands and/or covered with natural and semi-natural areas [2,3,4]. Thus, urban expansion and sprawl contribute together to a gradual and systematic landscape depauperation. Consequently, soil sealing results in a separation of the soil from the other elements of the ecosystem; its impact on the natural environment is dramatic; in fact, it likely determines the total loss or impairment of soil functionality.
Furthermore, the separation between land and other ecosystems may reduce soil functionalities to such an extent that the functional loss—either partial or total—can even be irreversible [5]. If functionality is lost, also the capability of landscapes to serve as a carbon sink is depaupered. Furthermore, urban areas suffer more from heat waves and dry climate, since evapotranspiration in the surrounding environment diminishes [6,7,8]. Ecosystems become more fragmented, consequently representing a threat for several species, and thus also biodiversity is harmed [9].
Hence, soil impermeabilization should be considered a very high environmental cost that does not solely affect the portion of land directly eaten up by artificial cover, but also harming the whole surrounding natural ecosystem [10].
For these reasons, it should deserve special consideration in every landuse planning and design effort. In this paper an application of a Cellular Automata (CA) model [11,12,13,14,15] has been developed to forecast urban growth in an area of Southern Italy, characterized by strong conflict among high landscape values and rapid urban growth due to the presence of huge oil fields and facilities.
The results of the simulation will be evaluated by considering the relationship among the population in the study area and its housing stock. This will be helpful in pointing out how the presence of numerous unoccupied buildings and the trend of depopulation of the area makes unjustifiable the amount/rate of soil consumption observed through both past landuse changes and forecasted trends. Results will also highlight how areas subject to more urban sprawl are those characterized by the presence of out-of-date spatial planning instruments or a poorly planned use of European Structural Funds. Another important aspect to consider is the relationship between soil consumption and landscape planning. Within the area of investigation there is only one Landscape Plan that includes unfortunately only a limited portion of the area. Furthermore, this plan was approved almost twenty-six years ago and never updated. However, as the past analysis will highlight (see Figures 6, 9 and 14) in spite of these severe limitations the Landscape Plan proficiently contributed to cap urban sprawl and soil consumption. In fact, in the areas where the Landscape Plan was implemented urban growth has been lower than in the rest of the region. This highlights a general lack of attention to planning which could combine the needs of development and environmental protection. The result is the production of haphazard settlements and disconnected interventions which are a multiplier of urban sprawl.
The aim is to show how the lack of specific regulations concerning the issue of soil consumption in Italy is irreversibly changing land cover, generating large amounts of impervious surfaces [16].

2. Materials and Methods
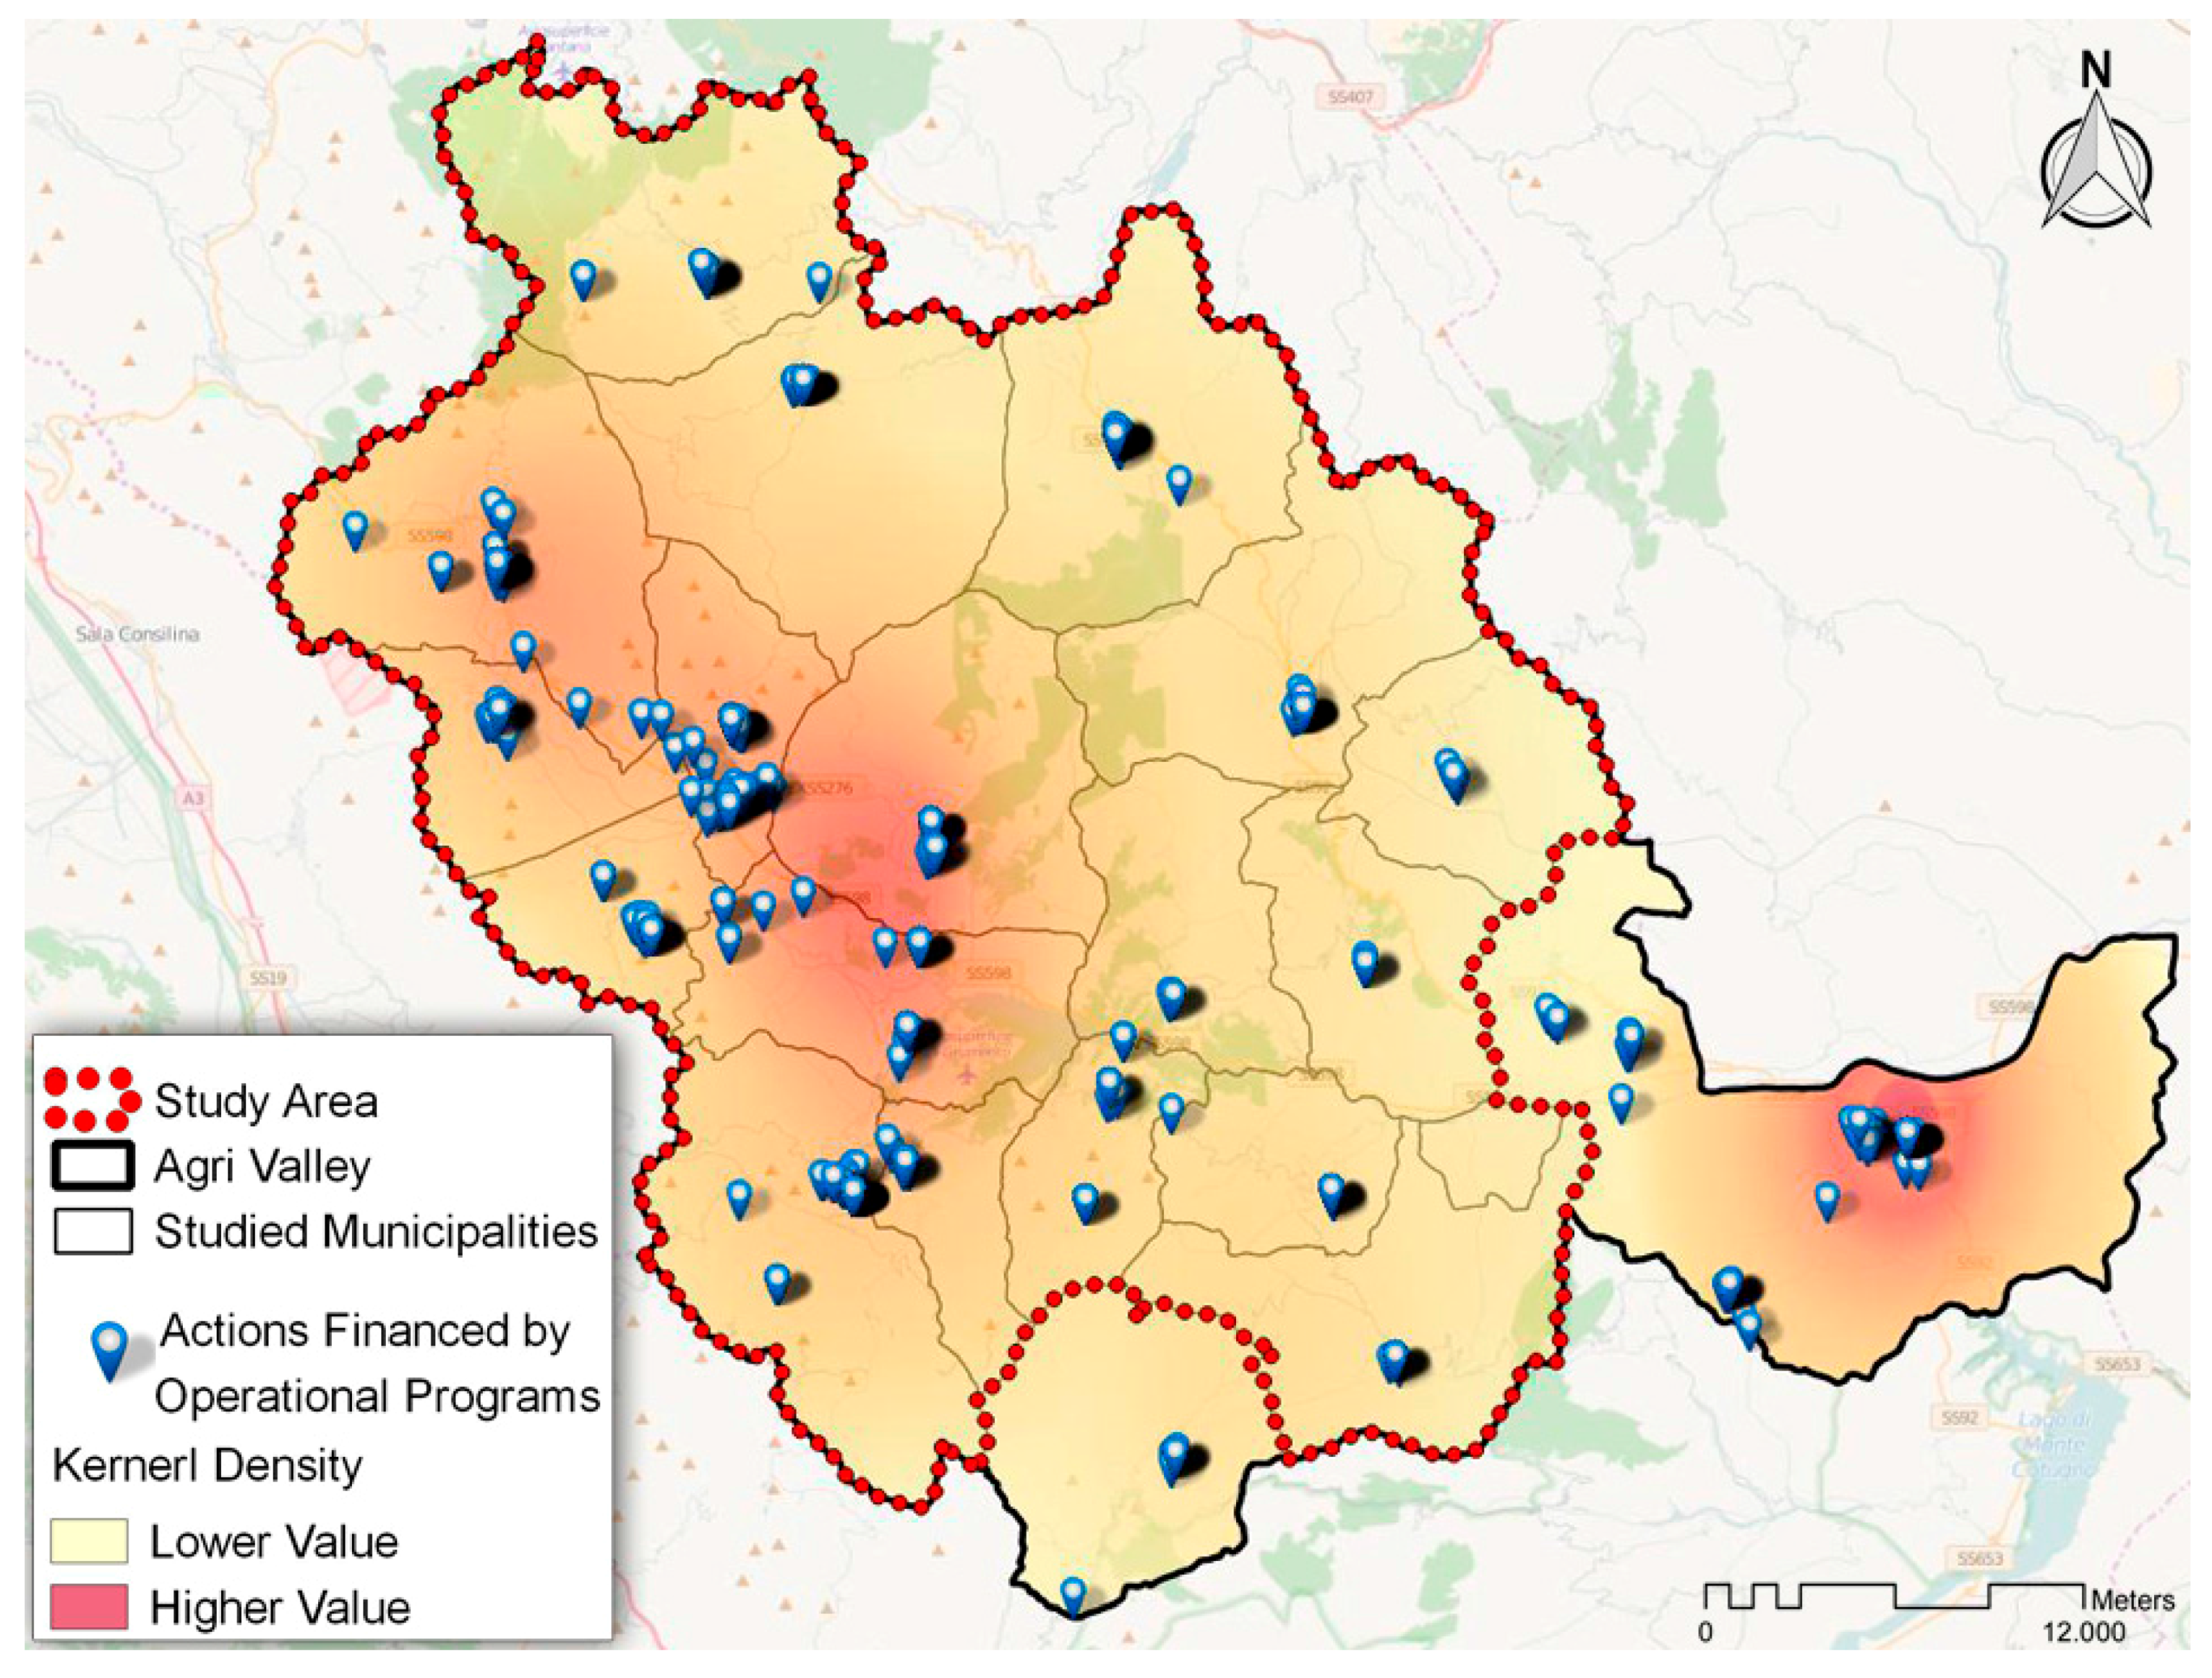
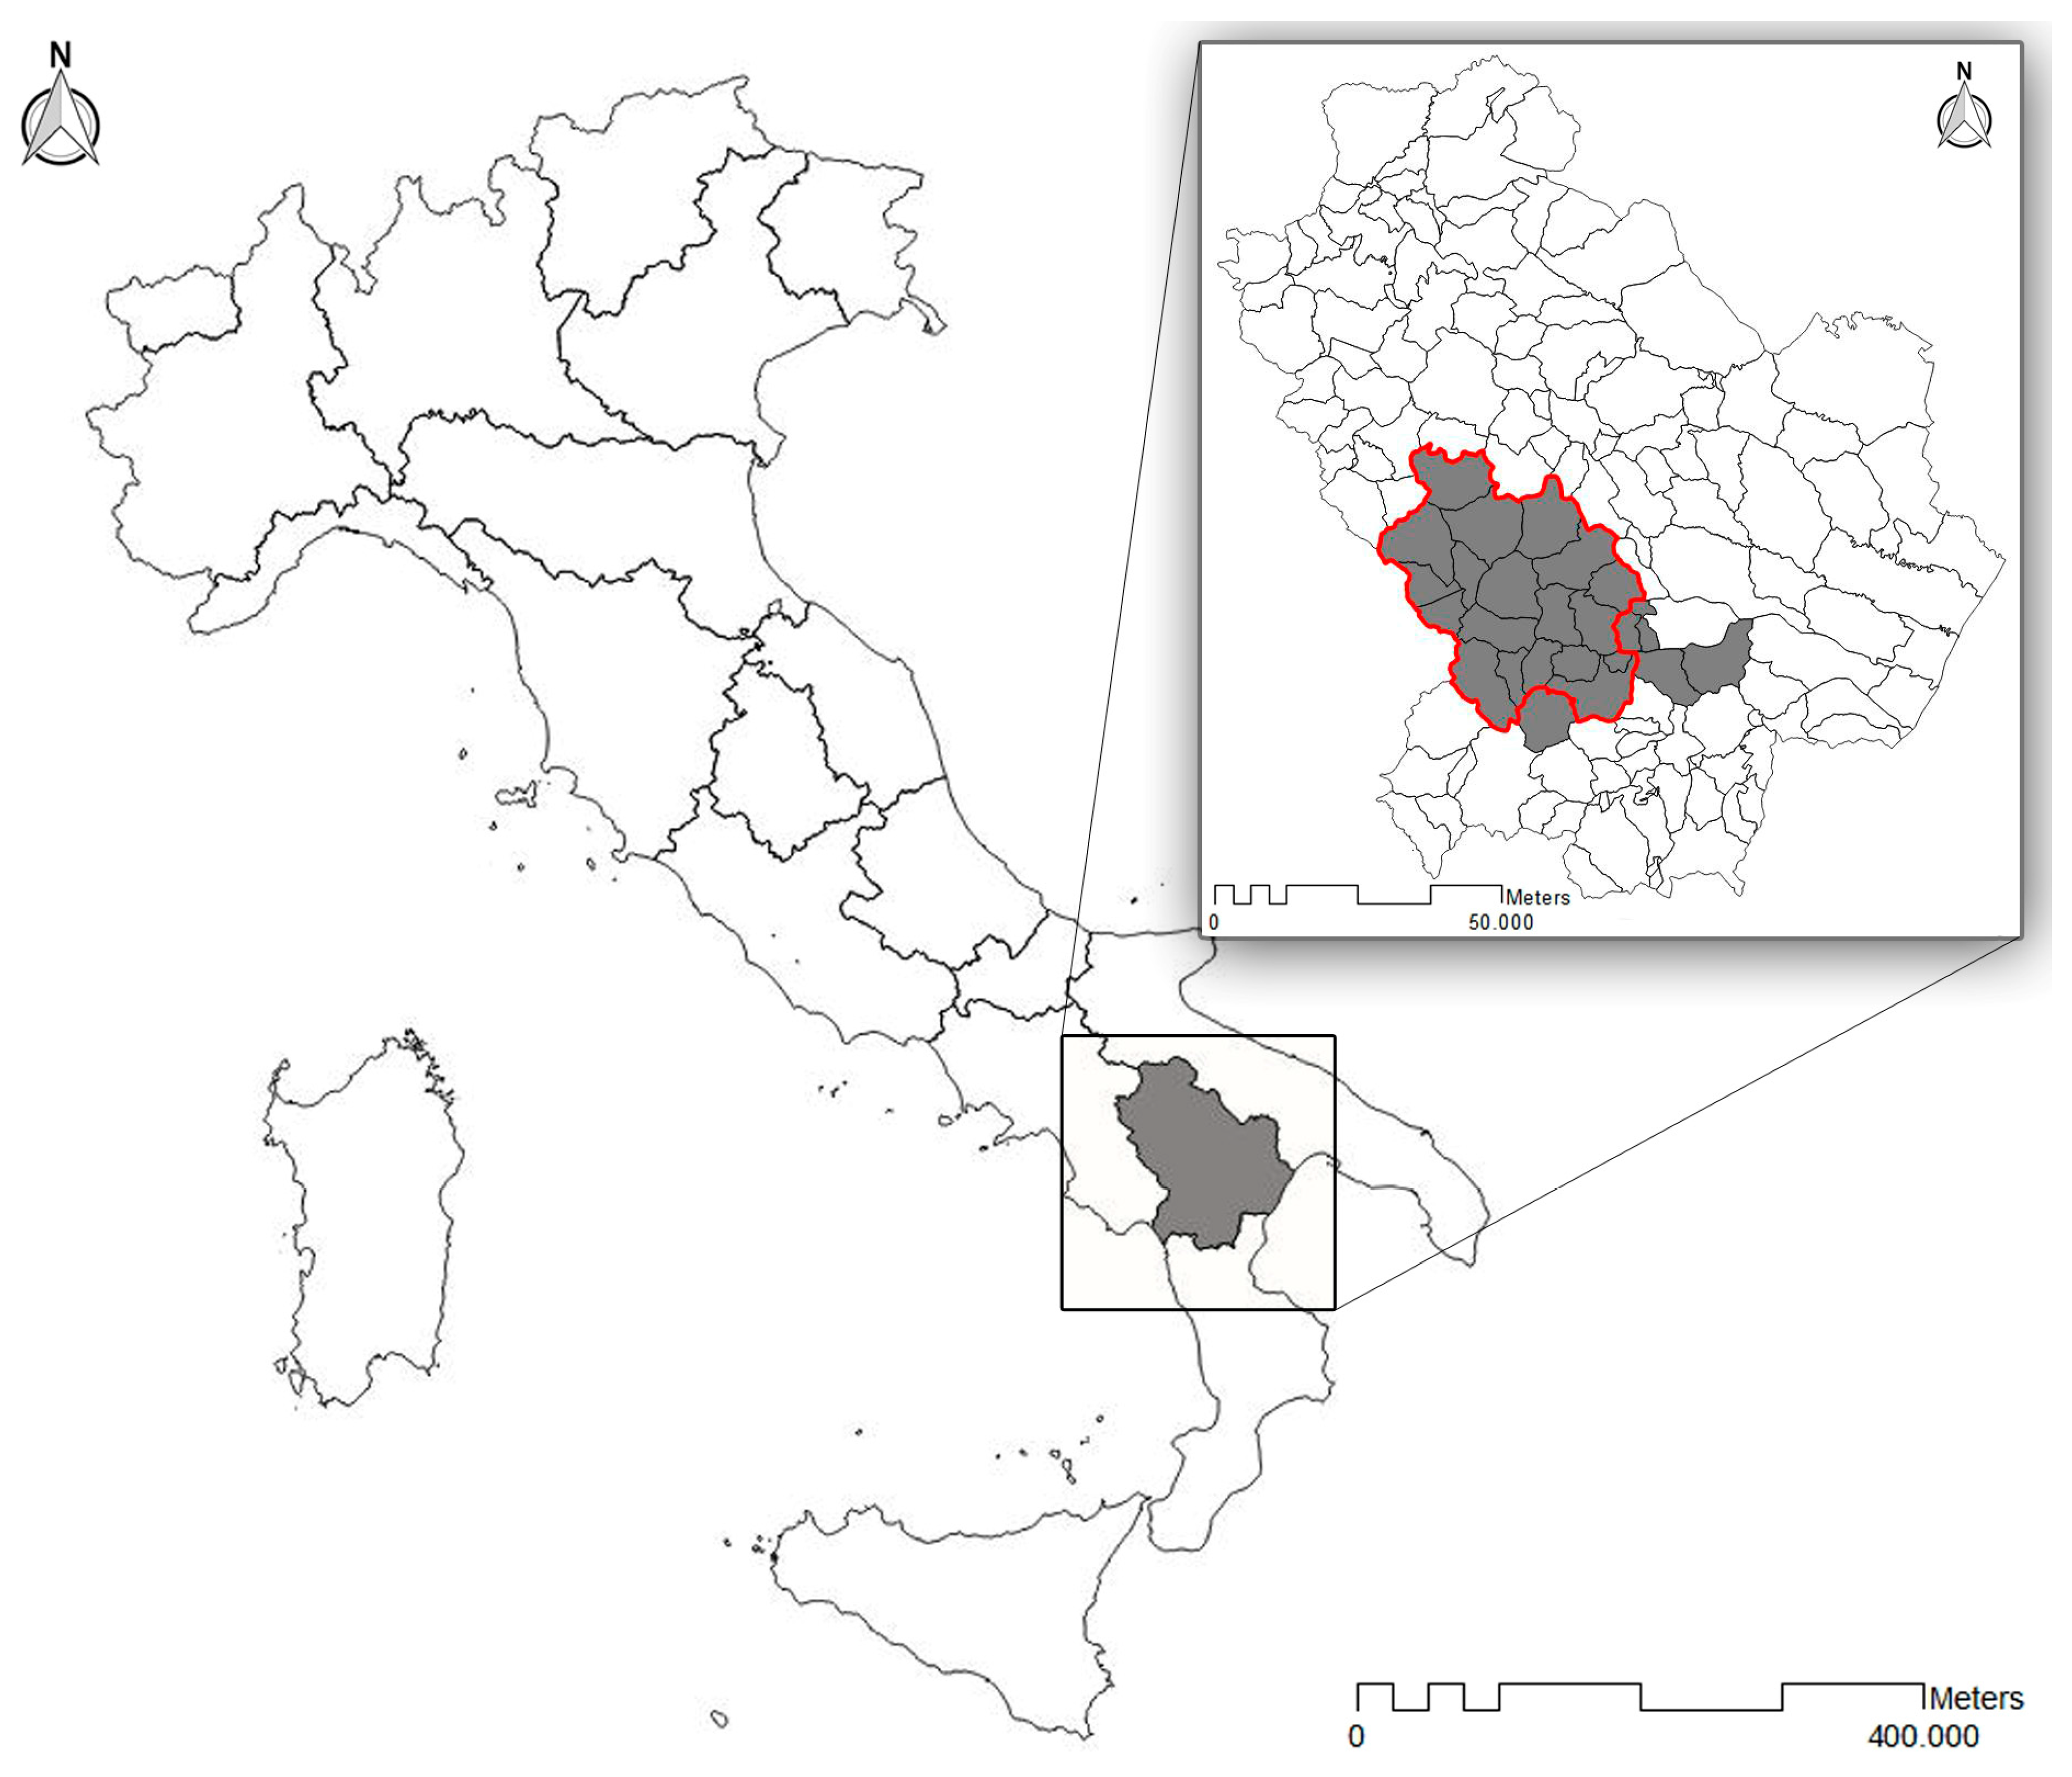
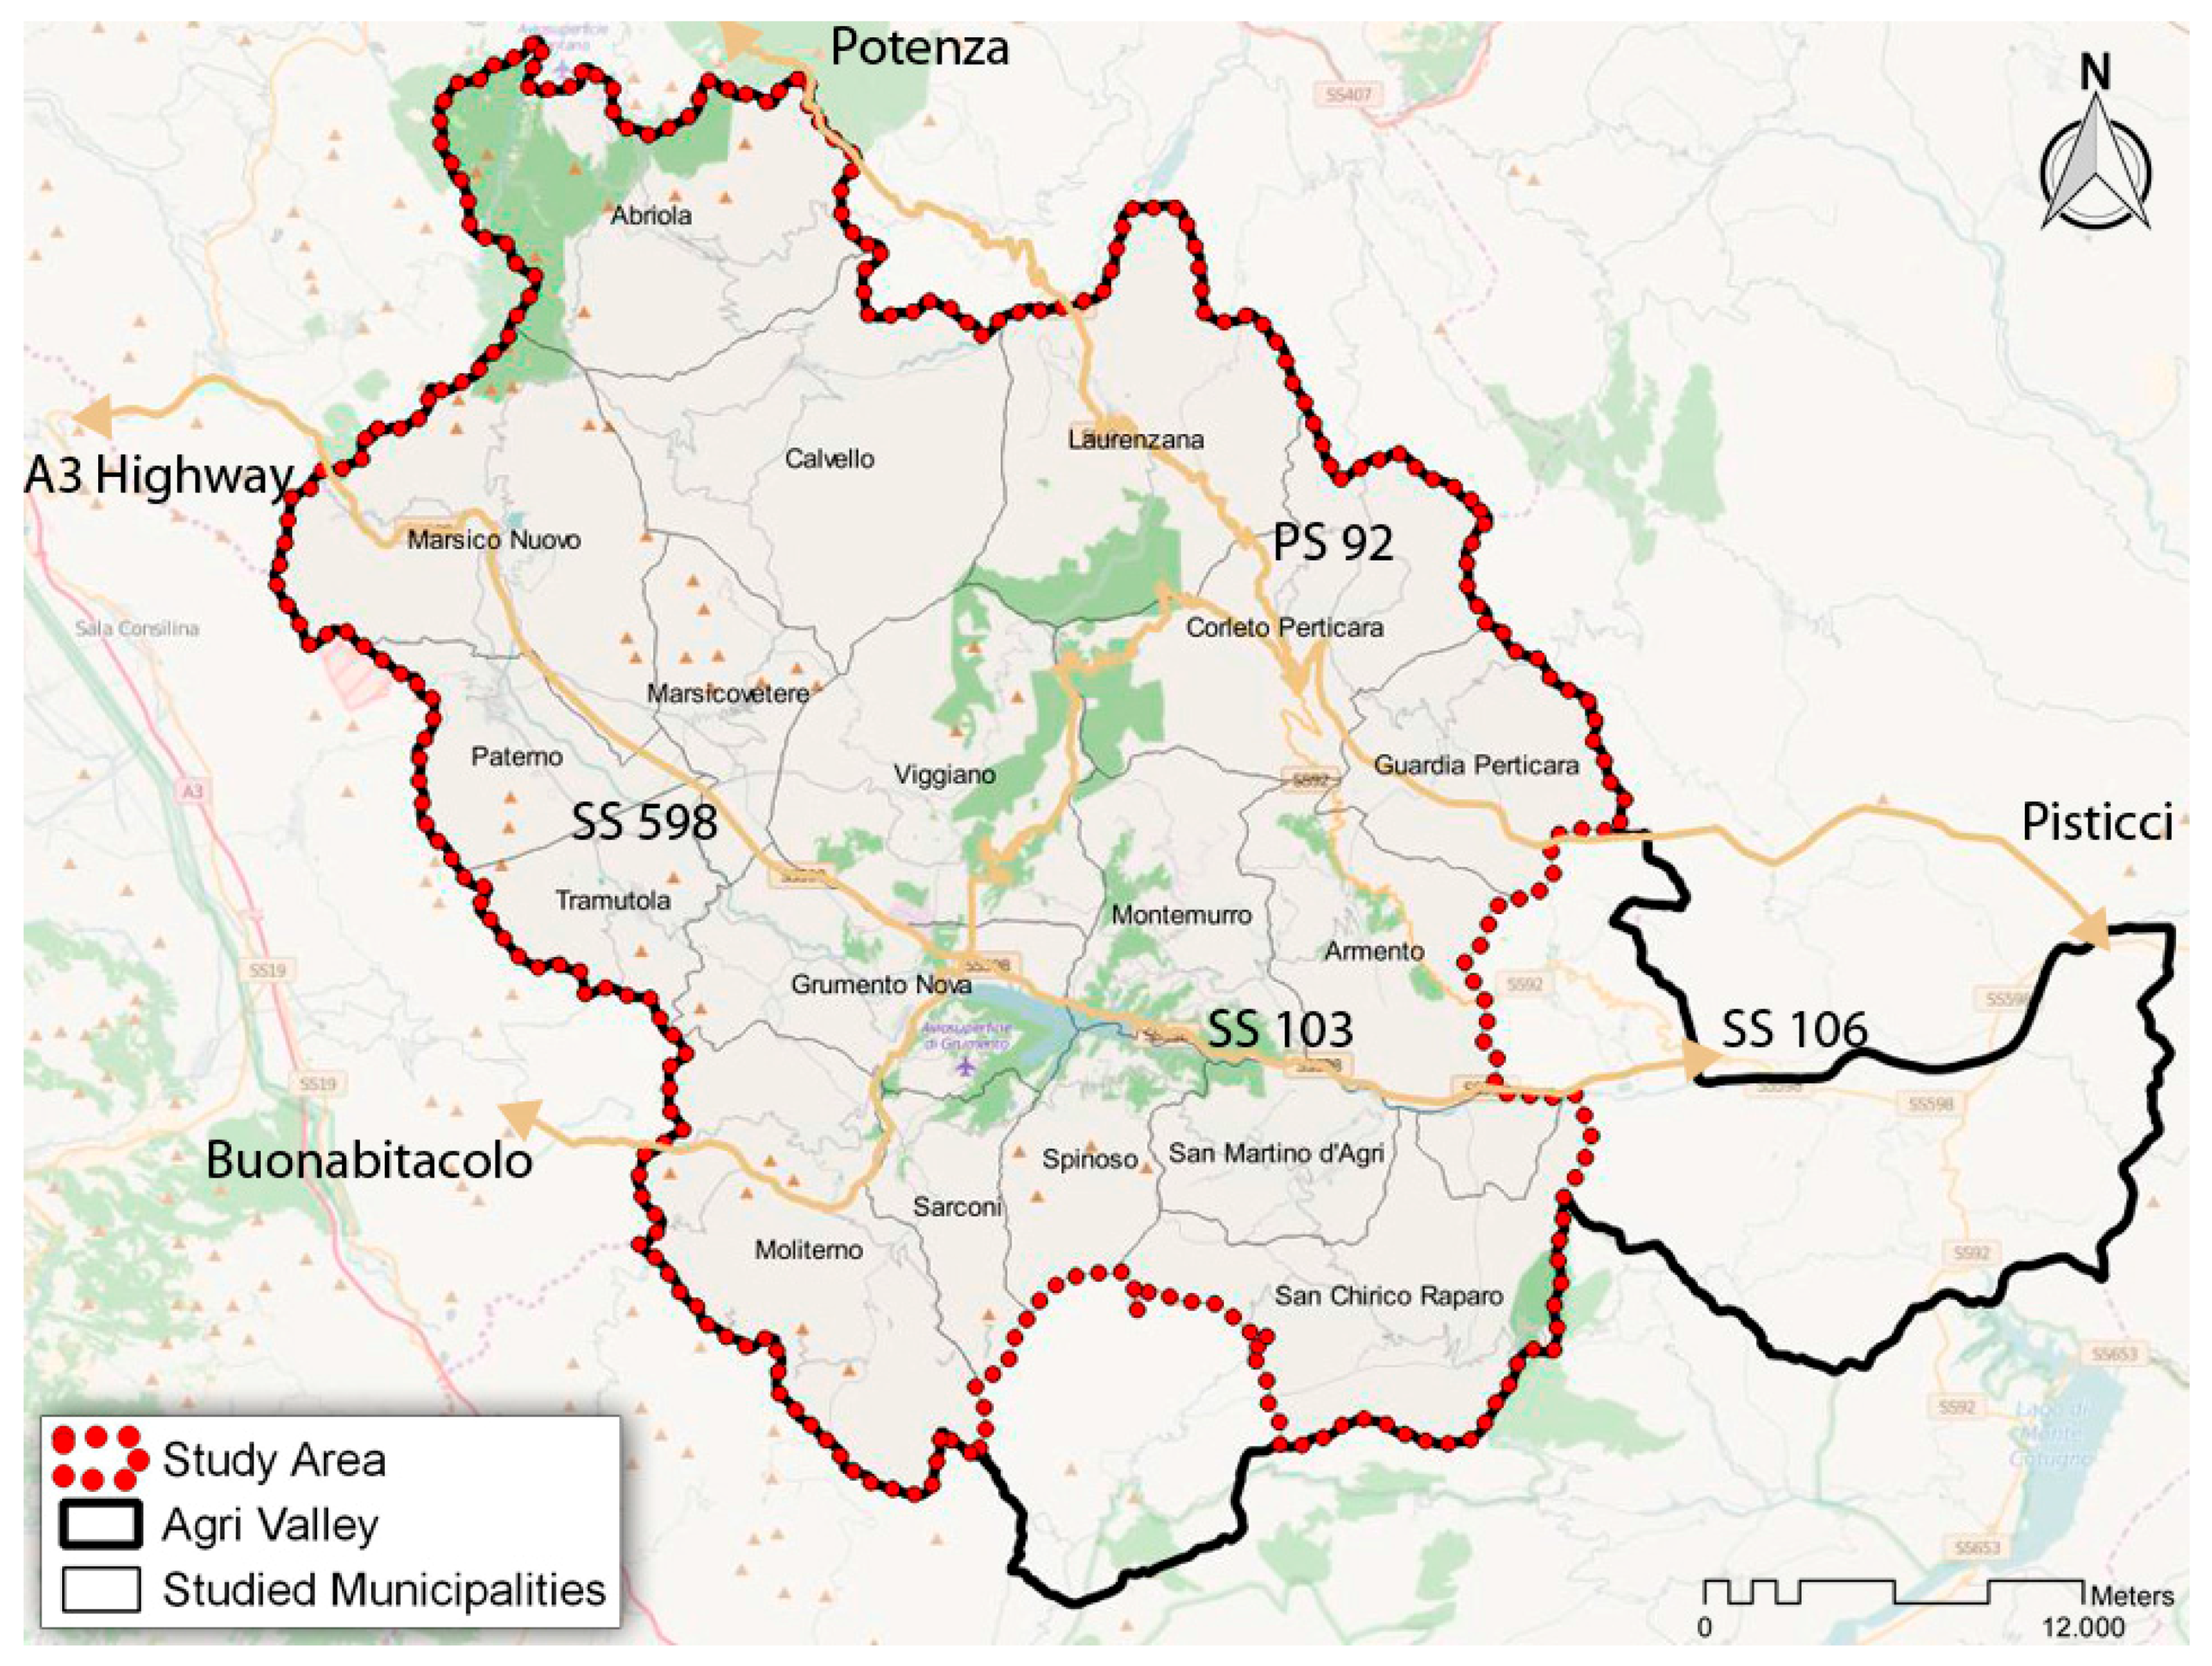
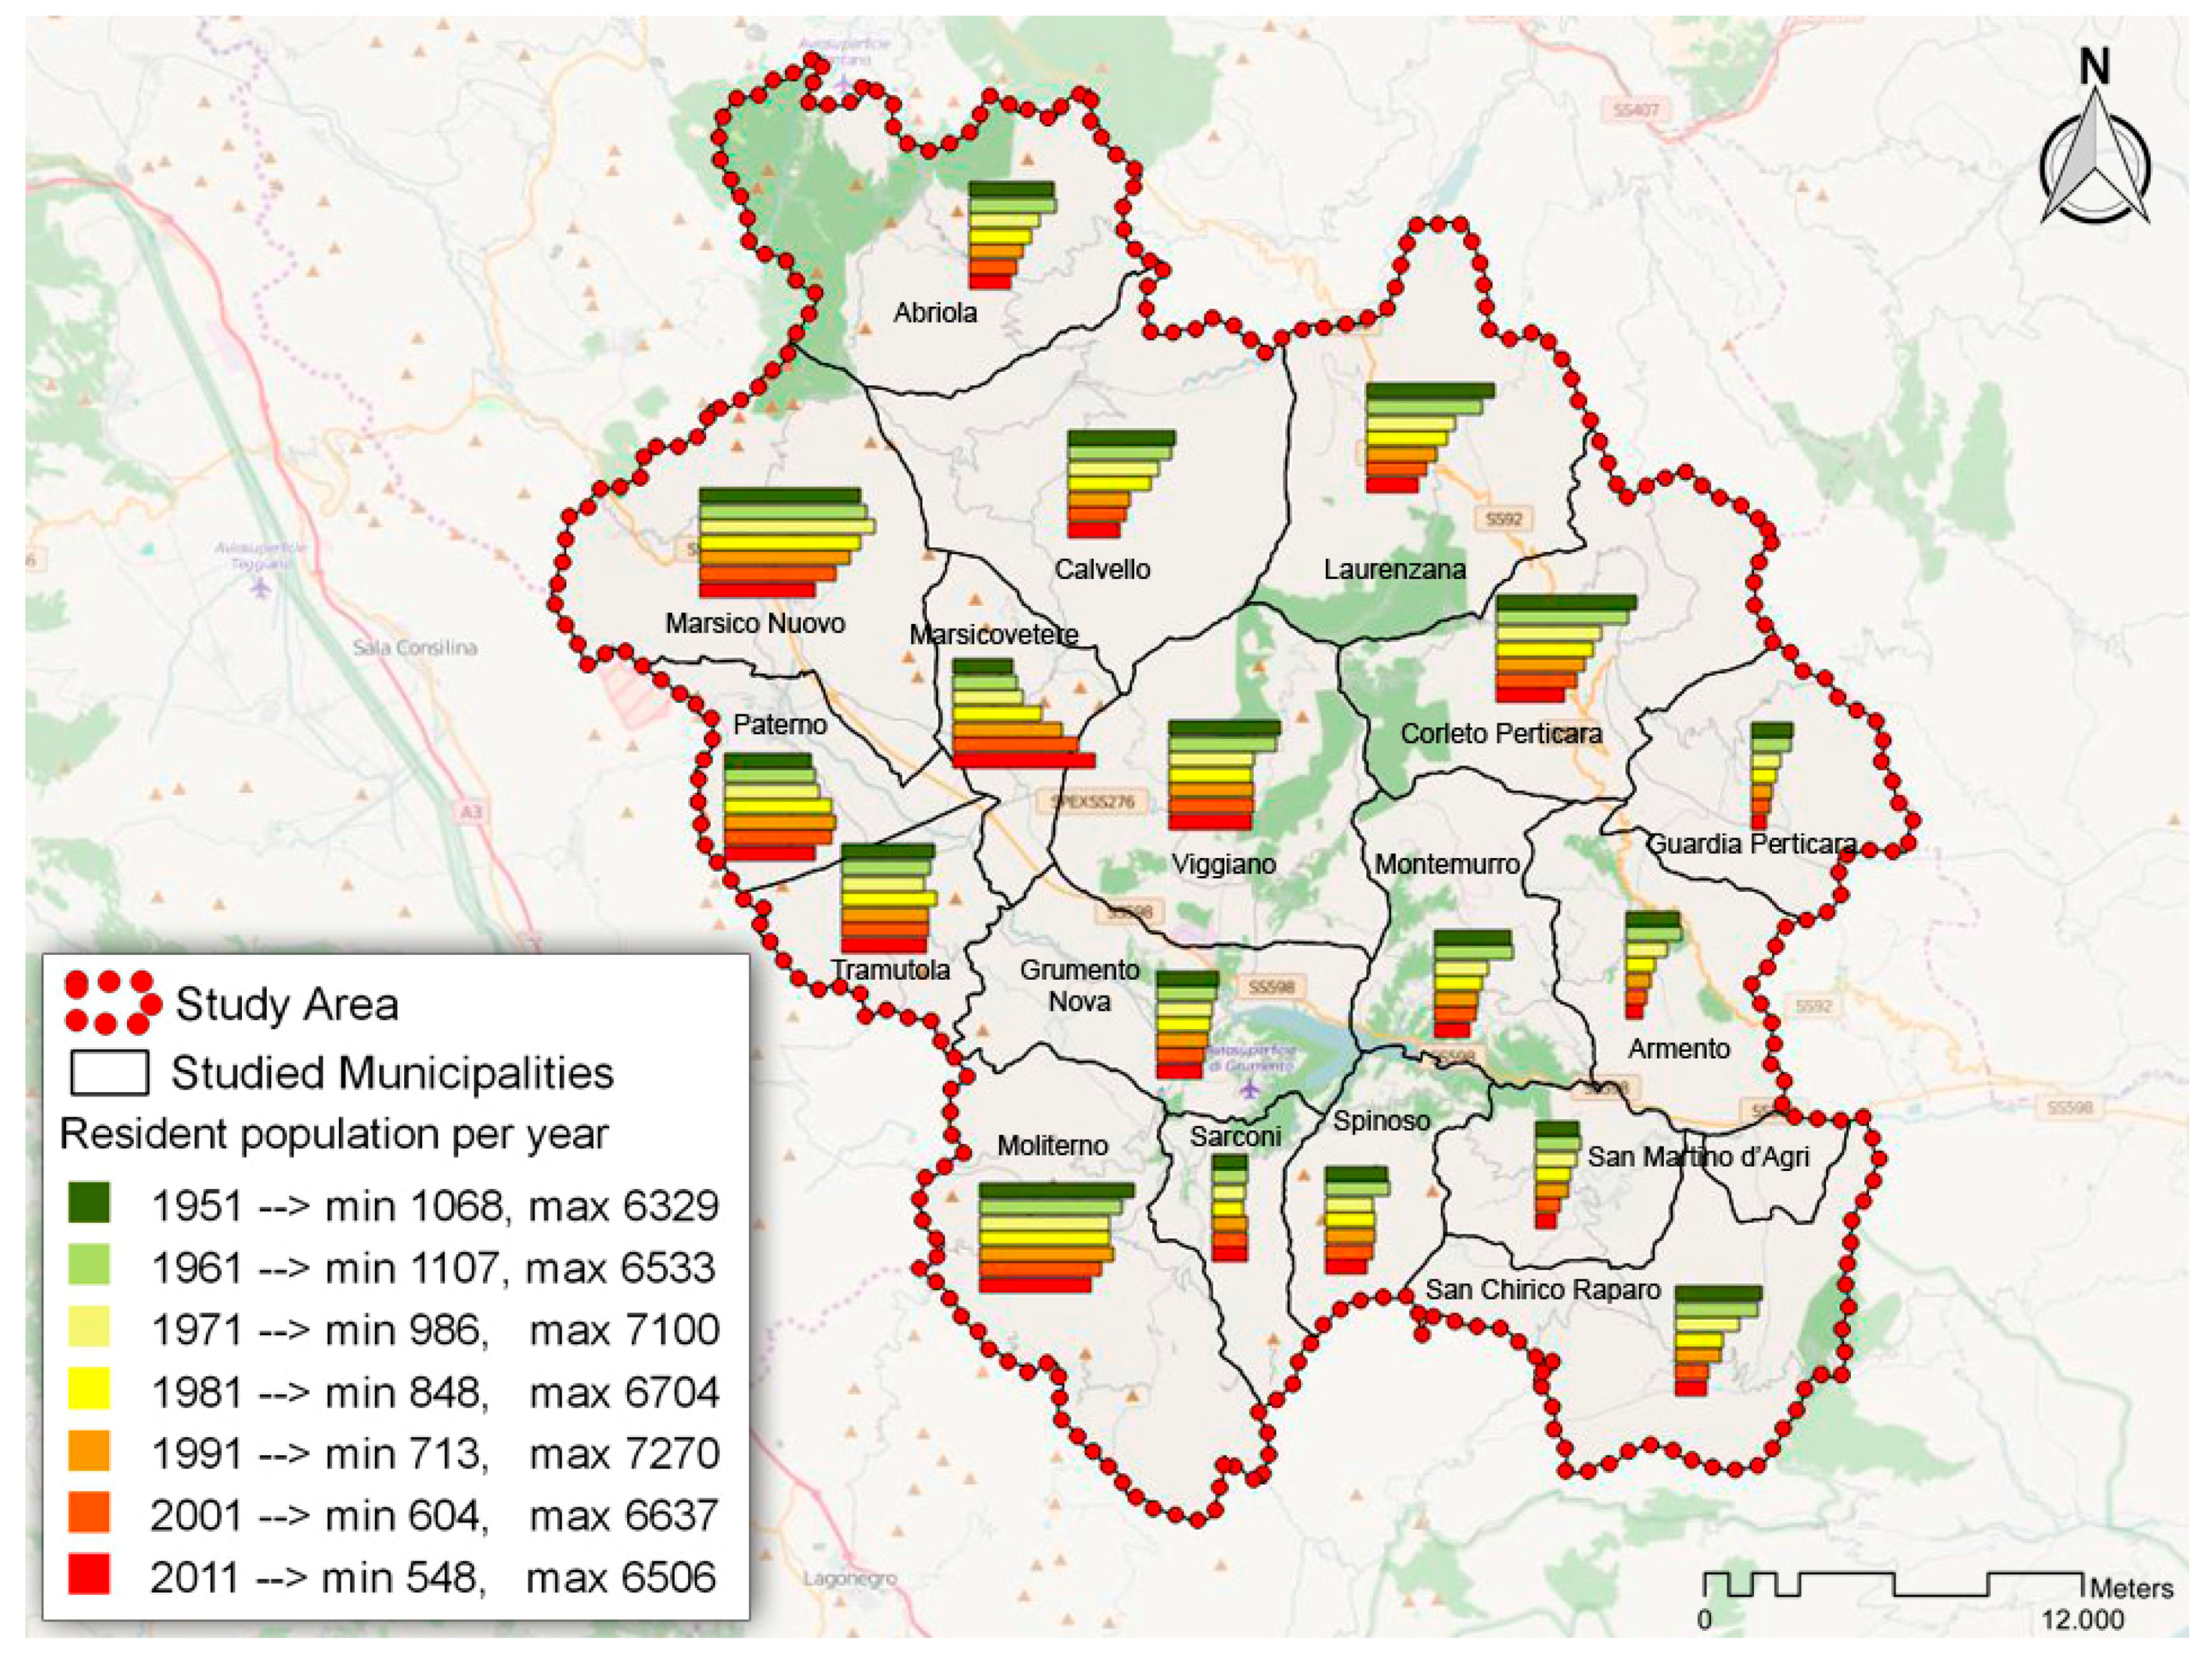
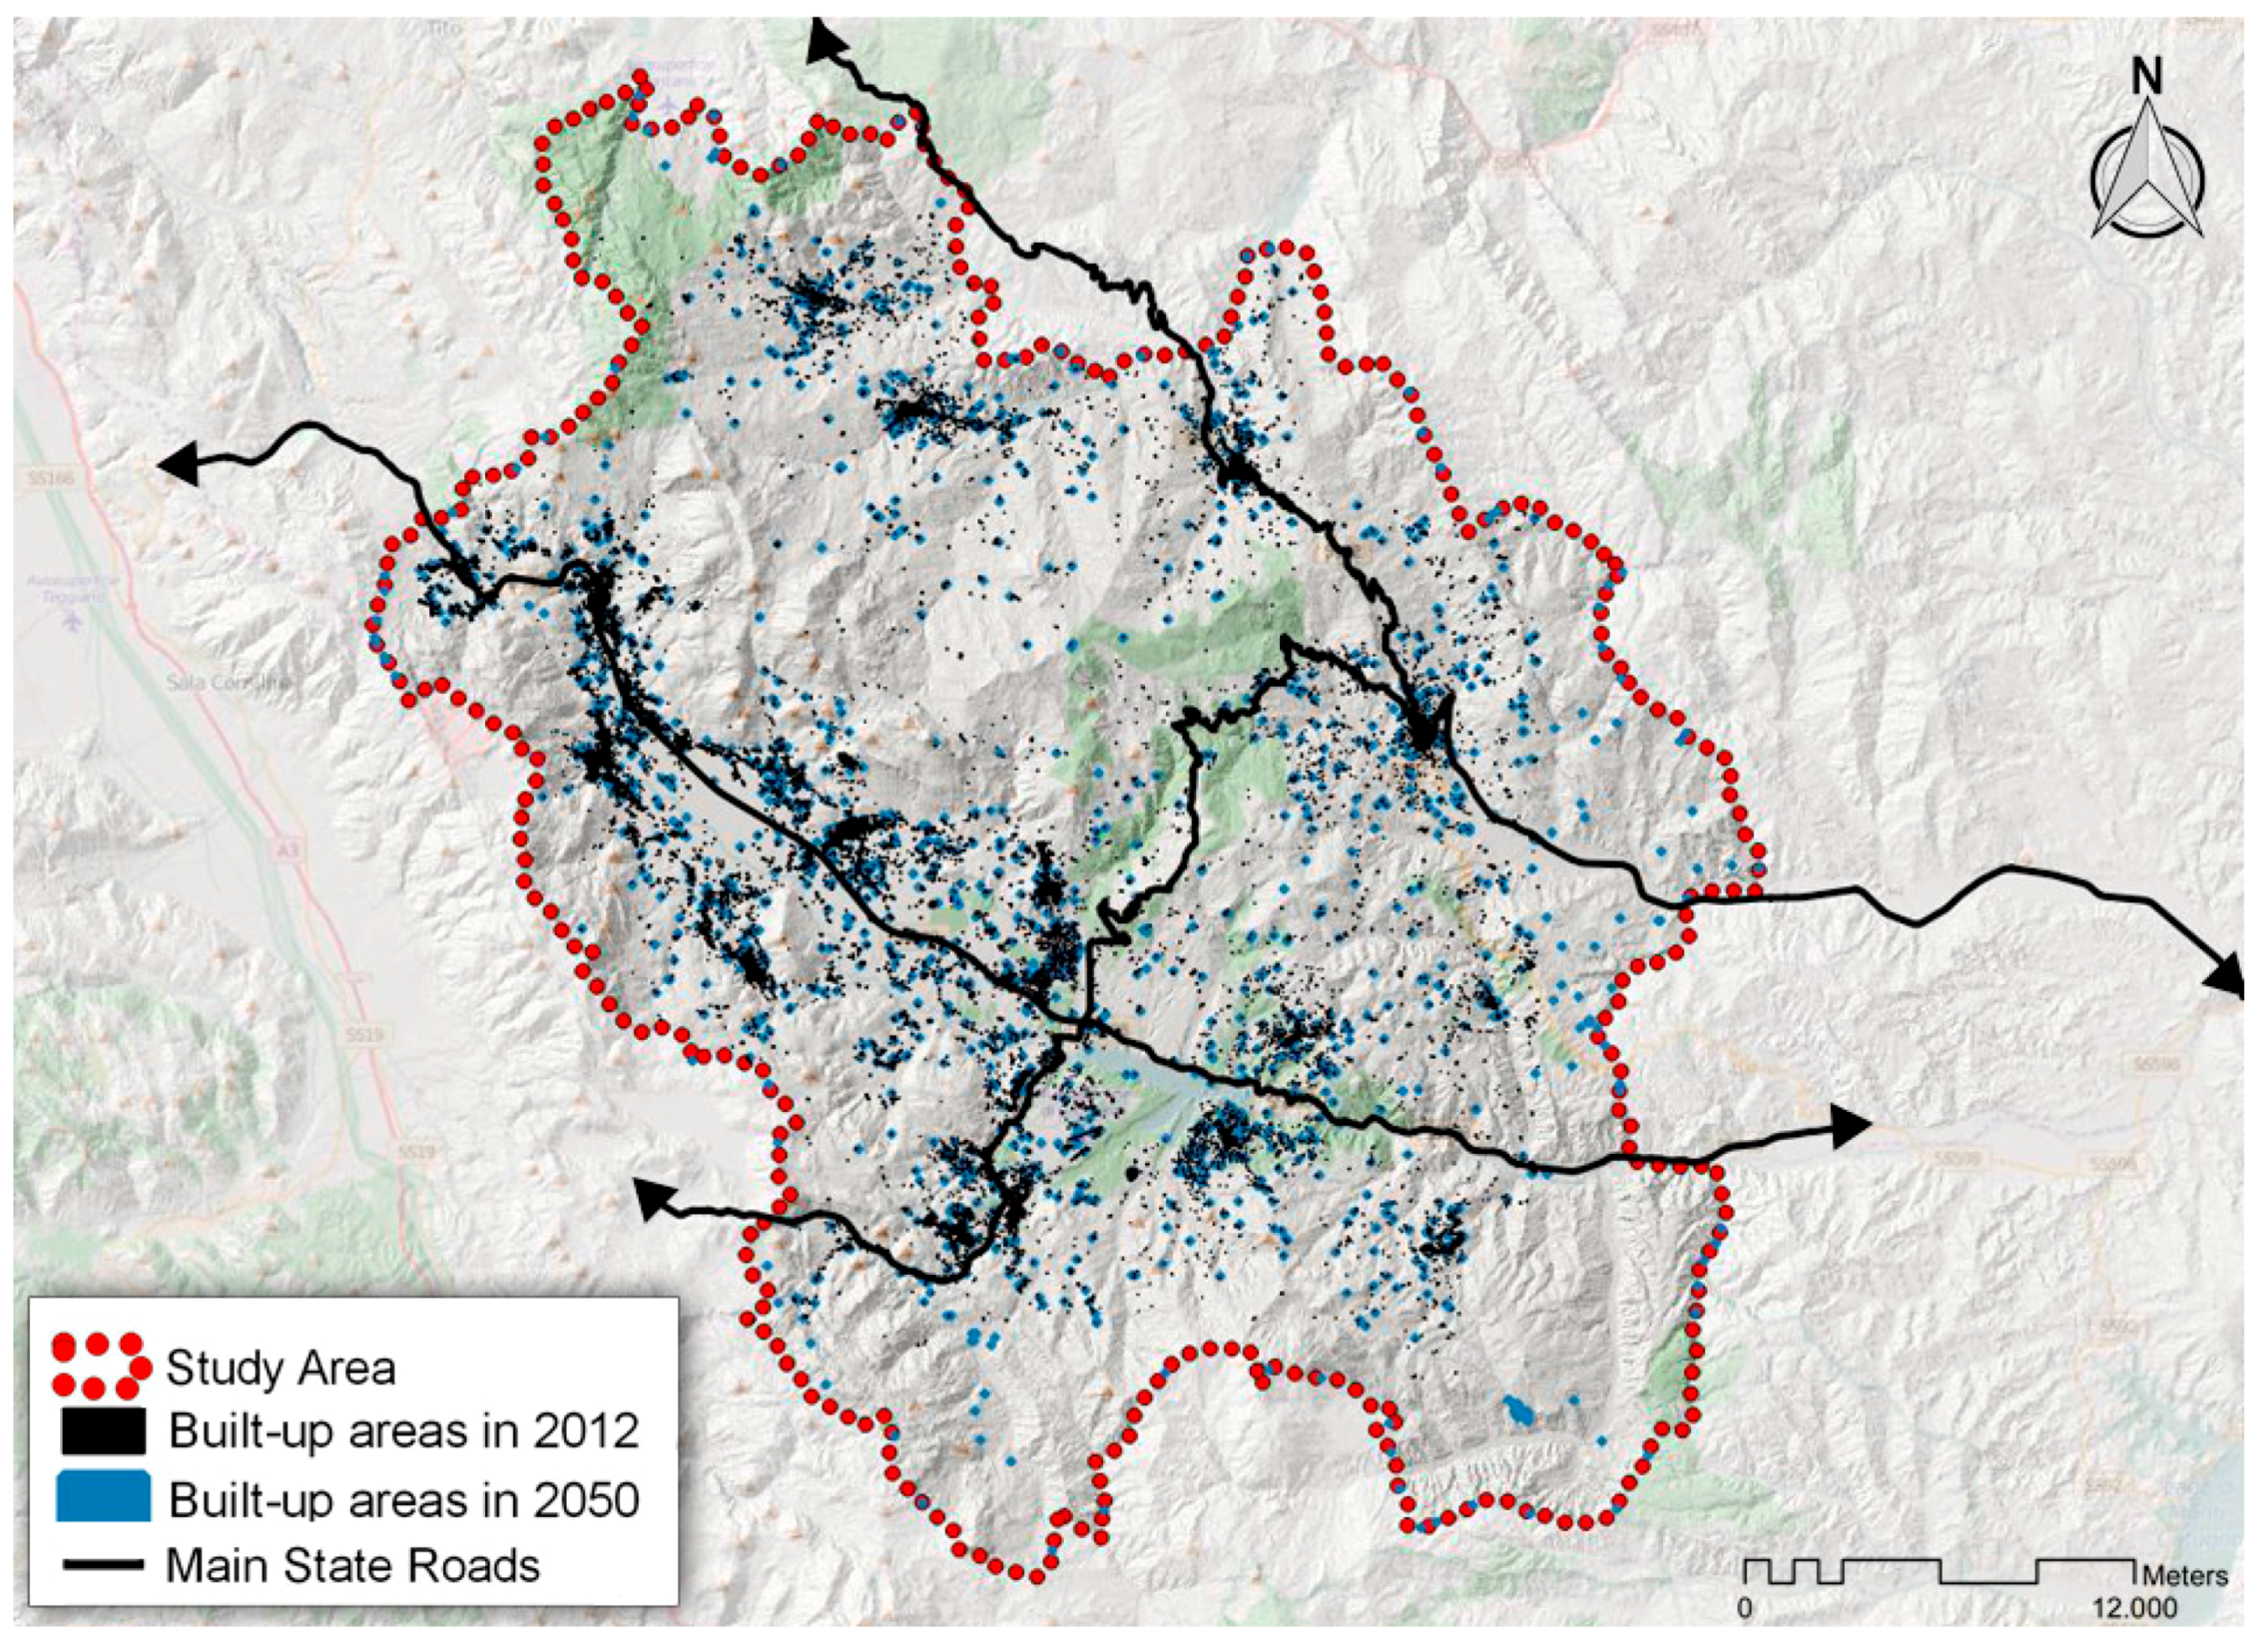
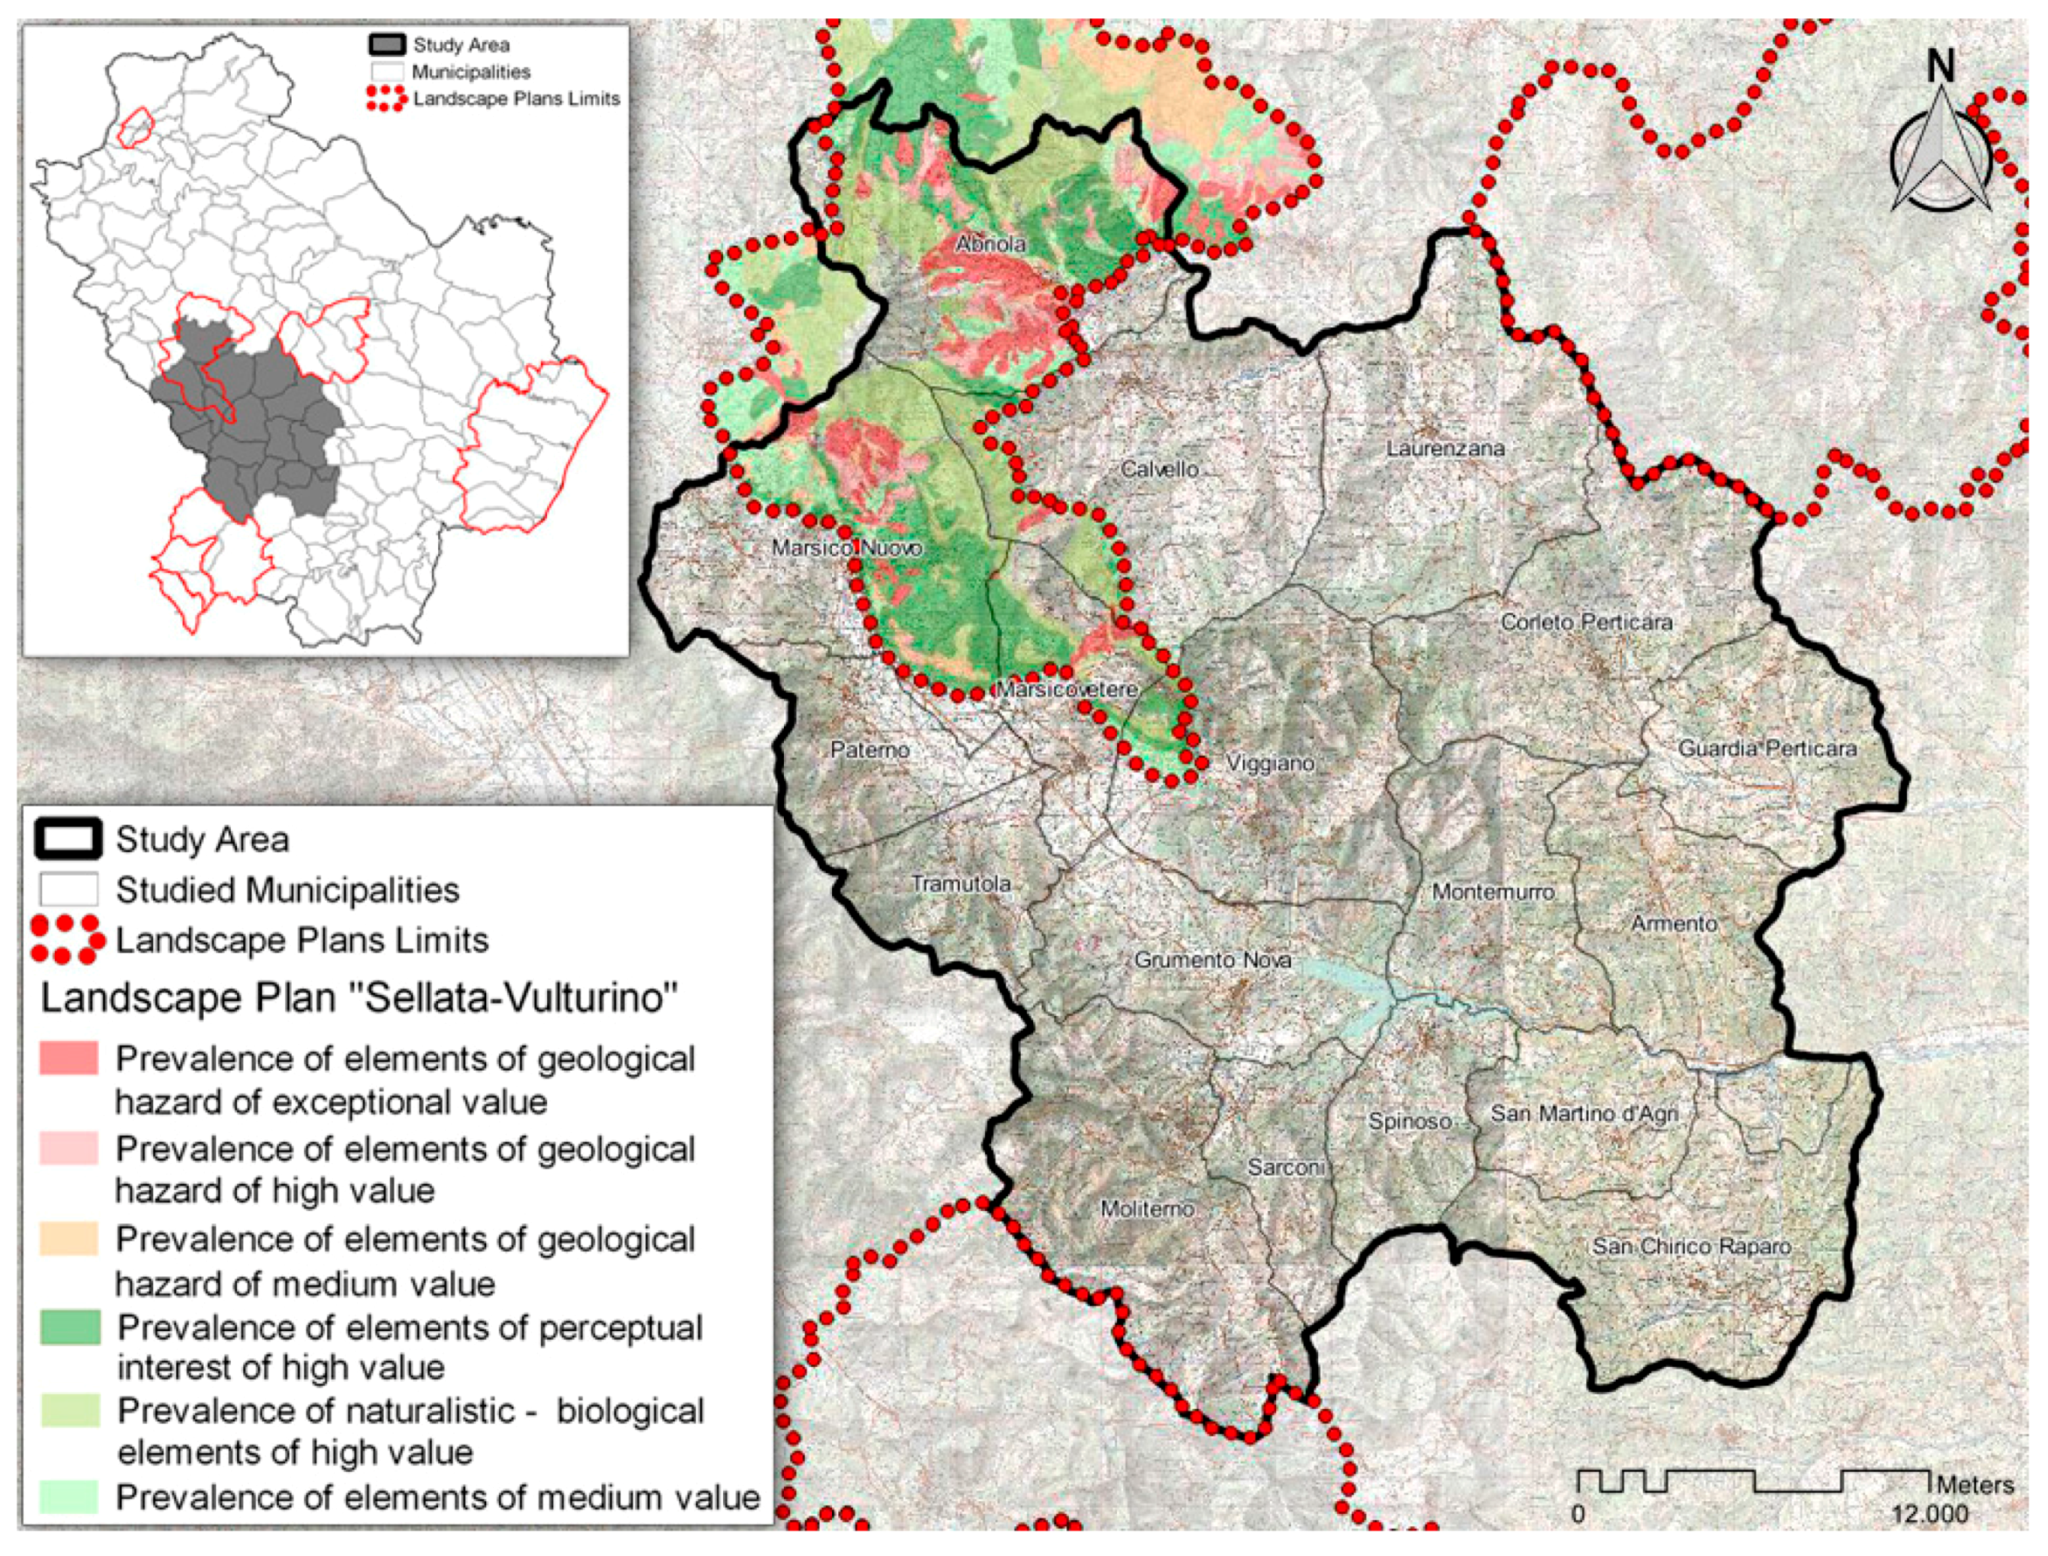
The methods employed in this study are primarily based on the use of historical land use data to derive time series of land use changes. These information strata have then been used to feed a CA model for urban growth simulation. Finally, urban expansion results have been compared to population data.

2.1. Study Area

The application has been developed in the Valley of Agri river (Figure 1); however, it was not possible to include all municipalities because of the lack of an exhaustive landuse vector cartography.
Thus, a homogenous morphological and socio-economic area comprising 18 municipalities (Figure 2) was considered (Abriola, Armento, Calvello, Corleto Perticara, Grumento Nova, Guardia Perticara, Laurenzana, Marsico Nuovo, Marsicovetere, Moliterno, Montemurro, Paterno, San Chirico Raparo, San Martino d'Agri, Sarconi, Spinoso, Tramutola and Viggiano). The municipalities analyzed are connected differently to the main road cutting through the valley, which is the main axis of road mobility.
This translates into a different evolution of the different urban centers. Municipalities such as Marsicovetere, Paterno, Tramutola and Marsico Nuovo, with good accessibility, show higher annual increase of built-up areas; the remaining municipalities, which have inadequate (or just sufficient) accessibility, have instead been characterized by a slow social and economic degradation (harsher in inner areas) that resulted in an increased pressure on better connected settlements.
When compared to the general socio-economic context of Basilicata region, the territory of the Agri Valley is characterized as a region with a high potential, but still facing a difficult development. Historically, the structure of the economic system of the Agri Valley is based on the agro-forestry sector. Actually, in 2012, farmland companies represented approximately 32% of the total, followed by commercial (25%) and tertiary (21%) sectors [17]. However, we have to note that these are usually small and medium size business companies, underlying that this sector, although being important, is still scarcely industrialized. Conversely, the industrial sector is strongly connected with mining and oil industries. Even if the number of companies was not large, the number of employees in 2012 was very high [18]. The demographic profile of the Agri Valley (Figure 3)—which for completeness is discussed here in its entirety—counts a resident population of 51,906 inhabitants, about 9% of the regional population. The population density, 34.5 inhabitants/ km2, is below the average parameters of Basilicata Region (57.3 inhabitants/km2). National Census data, analyzed starting from 1861, show, in most of the municipalities of the study area, a population decrease with a similar trend to most of the municipalities of Basilicata Region.
A strong contrast emerges when comparing this behavior with the trends surveyed for other administrative areas. Data referring to the whole Basilicata region and to the province of Potenza—although registering a negative balances that remained fairly constant from 1961—are characterized by an initial phase of growth between the beginning of the last century and the World War Two. Figure 3 highlights also that despite this period, the economy of the area was mainly based on agriculture, it is possible to register a small population growth differently from the remaining part of the Province.
The area is characterized by small Municipalities, just Marsicovetere has more than 5000 inhabitants with an evident increase of population from 2246 inhabitants in 1951 to 5341 in 2011. The municipalities of, Guardia Perticara, Armento, San Martino d’Agri with a population of less than 1000 units, are considered the more critical situations mainly due to the reduction of primary services. The remaining fifteen municipalities have a population of less than 2000 units. Among these municipalities, Viggiano, Tramutola and Sarconi seem to resist the abandonment of the population with a fairly stable demographic trend in recent censuses. (Figure 4).
This drop in the number of inhabitants living in the area corresponds to a steady increase in built-up areas. An analysis of the historical evolution of the various settlements in the area shows how they have taken even larger dimensions over the years (Figure 5).
The analysis of the evolution of the settlements (Figure 6) shows that the greater increase in urbanization was experienced in the area at the bottom of the valley rather than in mountain areas.
This trend is reasonably influenced by both orography and implementation of infrastructures occurred in the area (i.e., the presence of the State Road 598 that connects the Valley of Agri to the highway A3 “Salerno-Reggio Calabria”, and the State Road 106 “Jonica”). The settlement structure is divided into a polycentric network in which the cores of Marsicovetere and Sant'Arcangelo, one of the most important center of the Agri Valley outside to the study area, perform a polarizing function.
This topic marks a maintenance of the trend registered at the national scale, which shows a discrepancy between demand and supply of new housing, both in quantity and quality. The national population changes recorded a negative balance, with a decrease of the population. However, this tendency is reversed if you take into account migration: Italian population with foreign origins increased by 135% from 2001 to 2011. Italy has thus increased from about 57 million residents in 2001 to nearly 60 million in 2011, registering a total growth rate of 0.4% [19].
Moreover, in the decade 2001–2011 the number of legally separated and divorced people almost doubled, rising from 1,530,543 to 2,658,943. A slight increase is also given on widowers. These factors led to an increase in the number of families, an increase of 54% compared to 1971. At the same time, families tend to be smaller and smaller, with the average number of members passing by 3.3 people in 1971 to 2.4 of 2011. Analyzing these data concerning the number of families related to the number of new houses, it is clear how in Italy in 2011 the construction of 4.4 new homes and about 351 m2 of usable space in new residential buildings was authorized for every thousand families [20].
However, what influences the construction sectors not solely the real domestic demand, more than ever in trouble with the payment of loans and leases, but also by speculative processes that considers buildings a form of safe investment. This mechanism helped to create a paradox—also fueled by an ephemeral increase of real estate value—where investors increase their profit, while new houses continue to be unaffordable for the majority of the population, who really need them. The 2011 Census counted more than 7 million empty houses in Italy, an increase of 350% compared to the previous census in 2001. Essentially, 25% of the housing stock is unsold and 2.3 million families cannot afford a house. These phenomena are still present, although if with a lesser extent, in the context of the Agri Valley, where National Census data show that on average about 7% of the available housing stock is not occupied (Figure 7). Bearing in mind the strong trend of depopulation, urban growth in the Valley is therefore not caused by the presence of a real demand, but by the need to fuel the housing market, in order to limit the economical cost due to the reduction of agricultural production following the establishment of oil extraction facilities.

2.2. SLEUTH Model

The CA model used in this paper is SLEUTH; it is a widely applied predictive model able to produce spatially explicit forecasts of urban expansion and land cover transitions [21,22,23,24]. It has been applied for a wide variety of topics (from theory oriented application to empirical investigation of land use changes, from urban sprawl to biodiversity losses) [25,26], and in a range of very diverse areas, included some regions in south Italy [16,27,28]. It is based on the coupled functionalities of two computational CA models: the Urban Growth Model [29,30] and the Change Model of Land Use DeltaTron. SLEUTH, is a CA where urban growth is evaluated within a fictitious space identified by a two-dimensional grid. The model is a freeware that runs in a unix-like environment and can be downloaded for free [31], while spatial input data can be produced and tailored with any GIS software (in this specific case we used both QGis 2.12 and ArcGis 10.2). The rationale behind SLEUTH is that by investigating landcover (and urbanization) transition dynamics through time, it is possible to predict what dynamics will likely be predominant in each portion of the land according to its anthropo-physical properties for the future, using multiple regressions [26,32,33]. SLEUTH workflow is rather simple; it needs multiple input data for multiple time stamps in the past that must be spatially coherent, then by overlaying these maps it investigates the characterization of each landcover transition which occurred at any location within the region of interest, and then built-in growth cell dynamic rules regulate the behavior of each cell under specific neighborhood conditions so to simulate landuse dynamics and urbanization for the future. SLEUTH is the acronym for the input datasets the model needs, these are: Slope, Landcover/use, Urban, Transportation, and Hillshade. The Slope map is used as this is one of the main variables impeding urbanization, its threshold is context specific and can be derived by historical dynamic trend. Landuse or Landcover maps are needed because they define the classes, and consequently the land dynamics, the model aims at predicting; in fact, some landuse type are more prone to urbanization than other, while some landuse type are more prone to turn into something else. At least two landcover maps are needed to run the model. The Exclusion layer is a very practical map; this input data defines different levels of resistance to urbanization according to user-defined criteria; these can be physical, anthropogenic or a mix of both and their effectiveness is also calculated according to the occurrence of landuse transitions in the past. The Urban extent layer must be consistent with what is defined as urban within the Landcover maps. At least four time snapshots of the urban extent are needed for a robust prediction of urbanization pattern. Transportation is one of the main drivers of urbanization and landuse changes in general. In fact, very little landcover transitions happen naturally without the influence of man, and man moves on transport, thus land is more prone to change where man can arrive. Transportation maps may define not solely the location of the transportation network but also the intensity and the importance of each piece of the network. Weighting scheme usually respond to type, but also other measurements can be used (e.g., modes, fluxes, volumes, speed, size, etc.). Hillshade is a layer that is not used in calculations but serves as a context background to coherently portray output of urban expansion forecasts within the region of interest. The automatic process that SLEUTH features is controlled by five parameters: Diffusion, Breed, Spread, Slope, and Road-dependency.
Each of these parameters, both during the calibration and the simulation phases, is assigned a coefficient which regulates its influence on the urbanization process. Parameters are self-modifying, thus they change as prediction progresses. All five parameters affect one or more growth (land transition) rules that SLEUTH features: Spontaneous Growth, New Spreading Centre Growth, Edge Growth, Road-influenced Growth. The calibration phase is responsible for choosing the best set of coefficients in explaining land transitions and urbanization occurred in the past. For a more detailed description of the functioning of the rules featuring in SLEUTH the reading of the repository online is suggested at [34]; also a revision of some of the most important papers about the state of the art of SLEUTH calibration is encouraged.
During the execution of the model, particular attention should be given to the calibration phase. This phase allows to identify the correct value to be attributed to each coefficient so that it can accurately perform landuse transition and urban expansion, coherently to the trend observed in the past.
Calibration is extremely costly in terms of time and computational capabilities, given the high number of possible combinations among the five coefficients (1015 different sets).
The aim is to investigate which set better applies to the data and then use this coefficient to run the forecast. This procedure is best known as “Brute Force” calibration [31]. The scope is to assess which set of coefficients leads to results that outperform other alternatives in several statistics that are automatically compiled.
These statistics are 13 least squares regression metrics (Product, Compare, r2 population, Edge r2, R2 cluster, Lee Sale, Average Slope r2, % Urban, X_ r2, Y_ r2, and Radius), and each of them represents the goodness of fit of the coefficients in explaining the trend shown by input data [35,36].
In other words, each statistic represents the degree of congruence between the growth simulated by the model and the landuse evolution observed from time series of historical data. In our case study the mean to assess the best set of coefficients during the calibration process is the Optimum SLEUTH Metric method [37,38].
This procedure is meant to be applied to larger intervals of coefficients that are progressively narrowed according to OSM results.

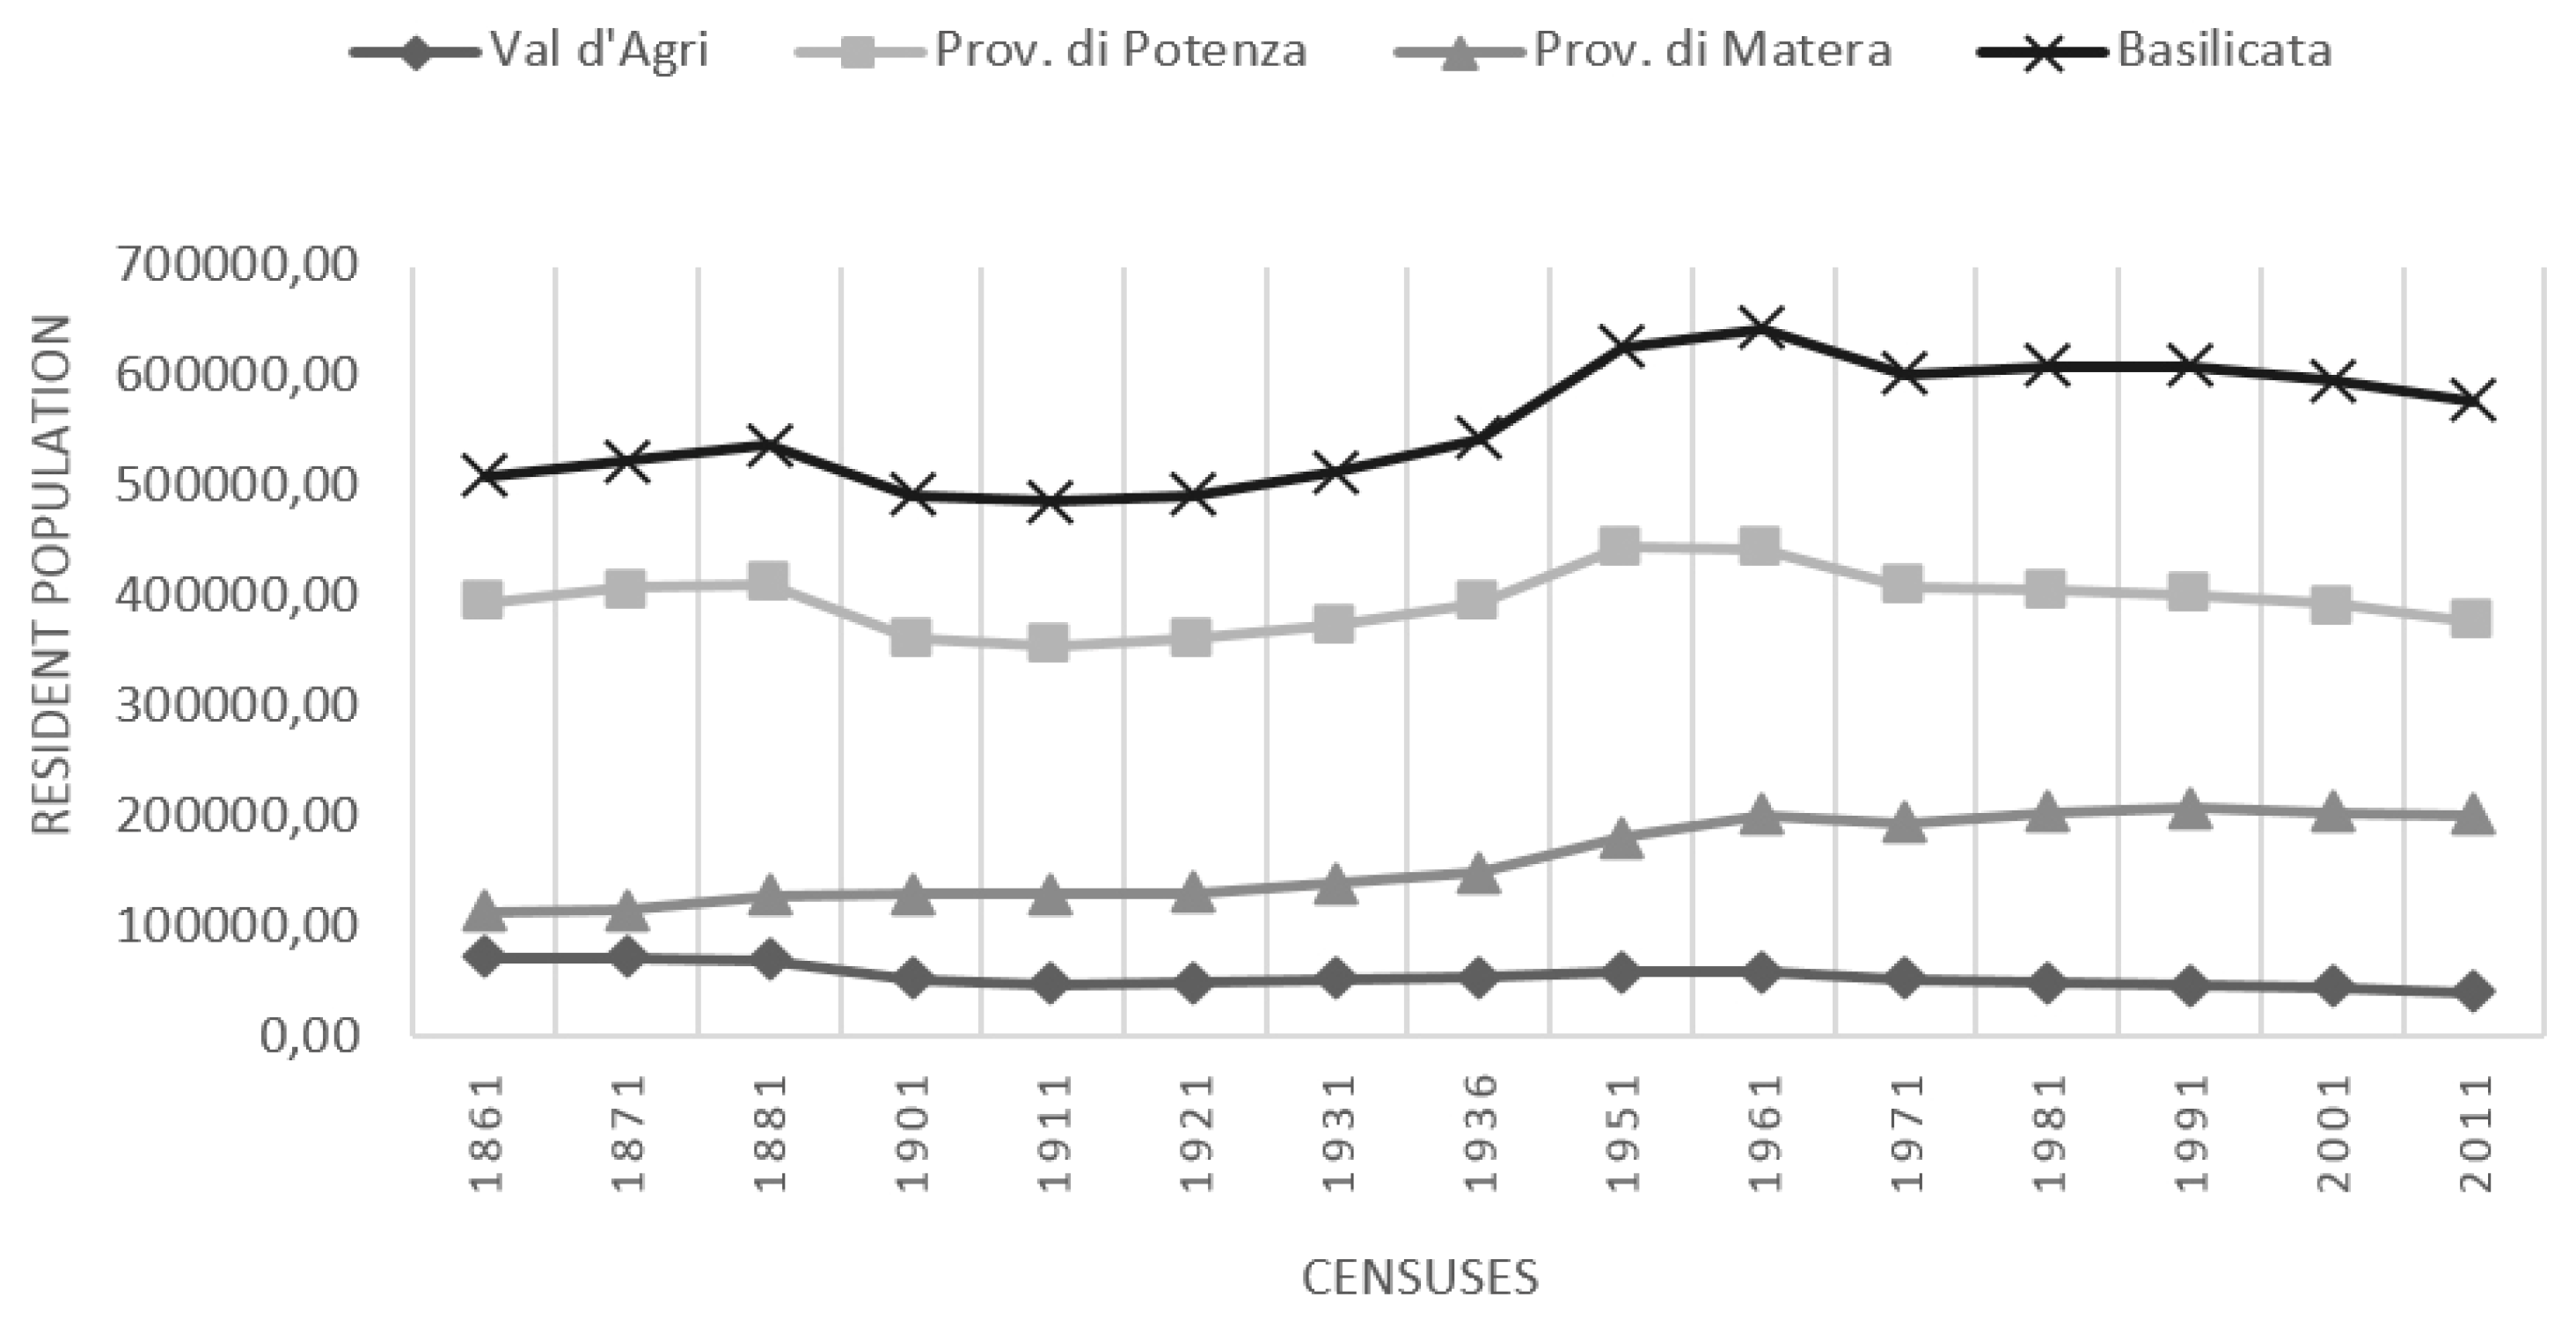
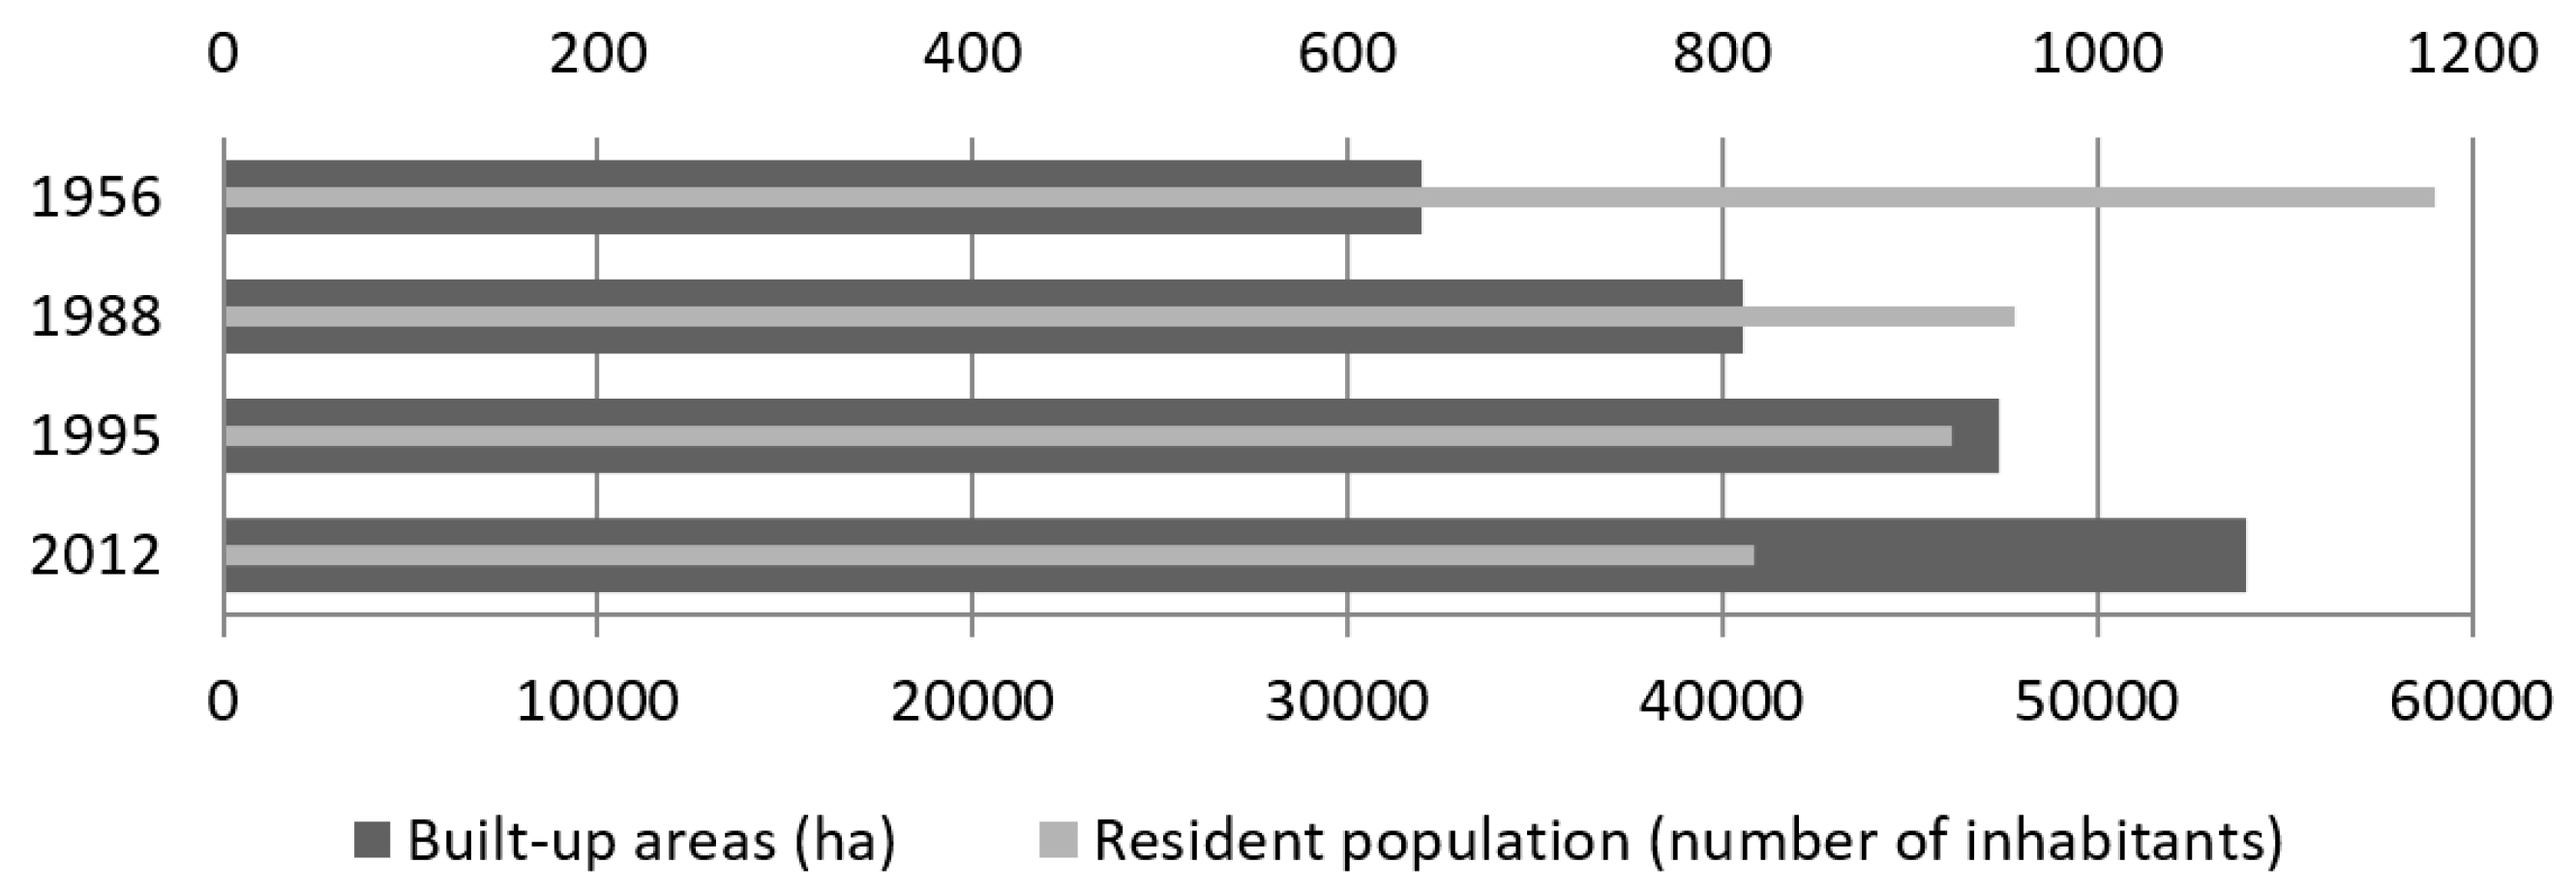
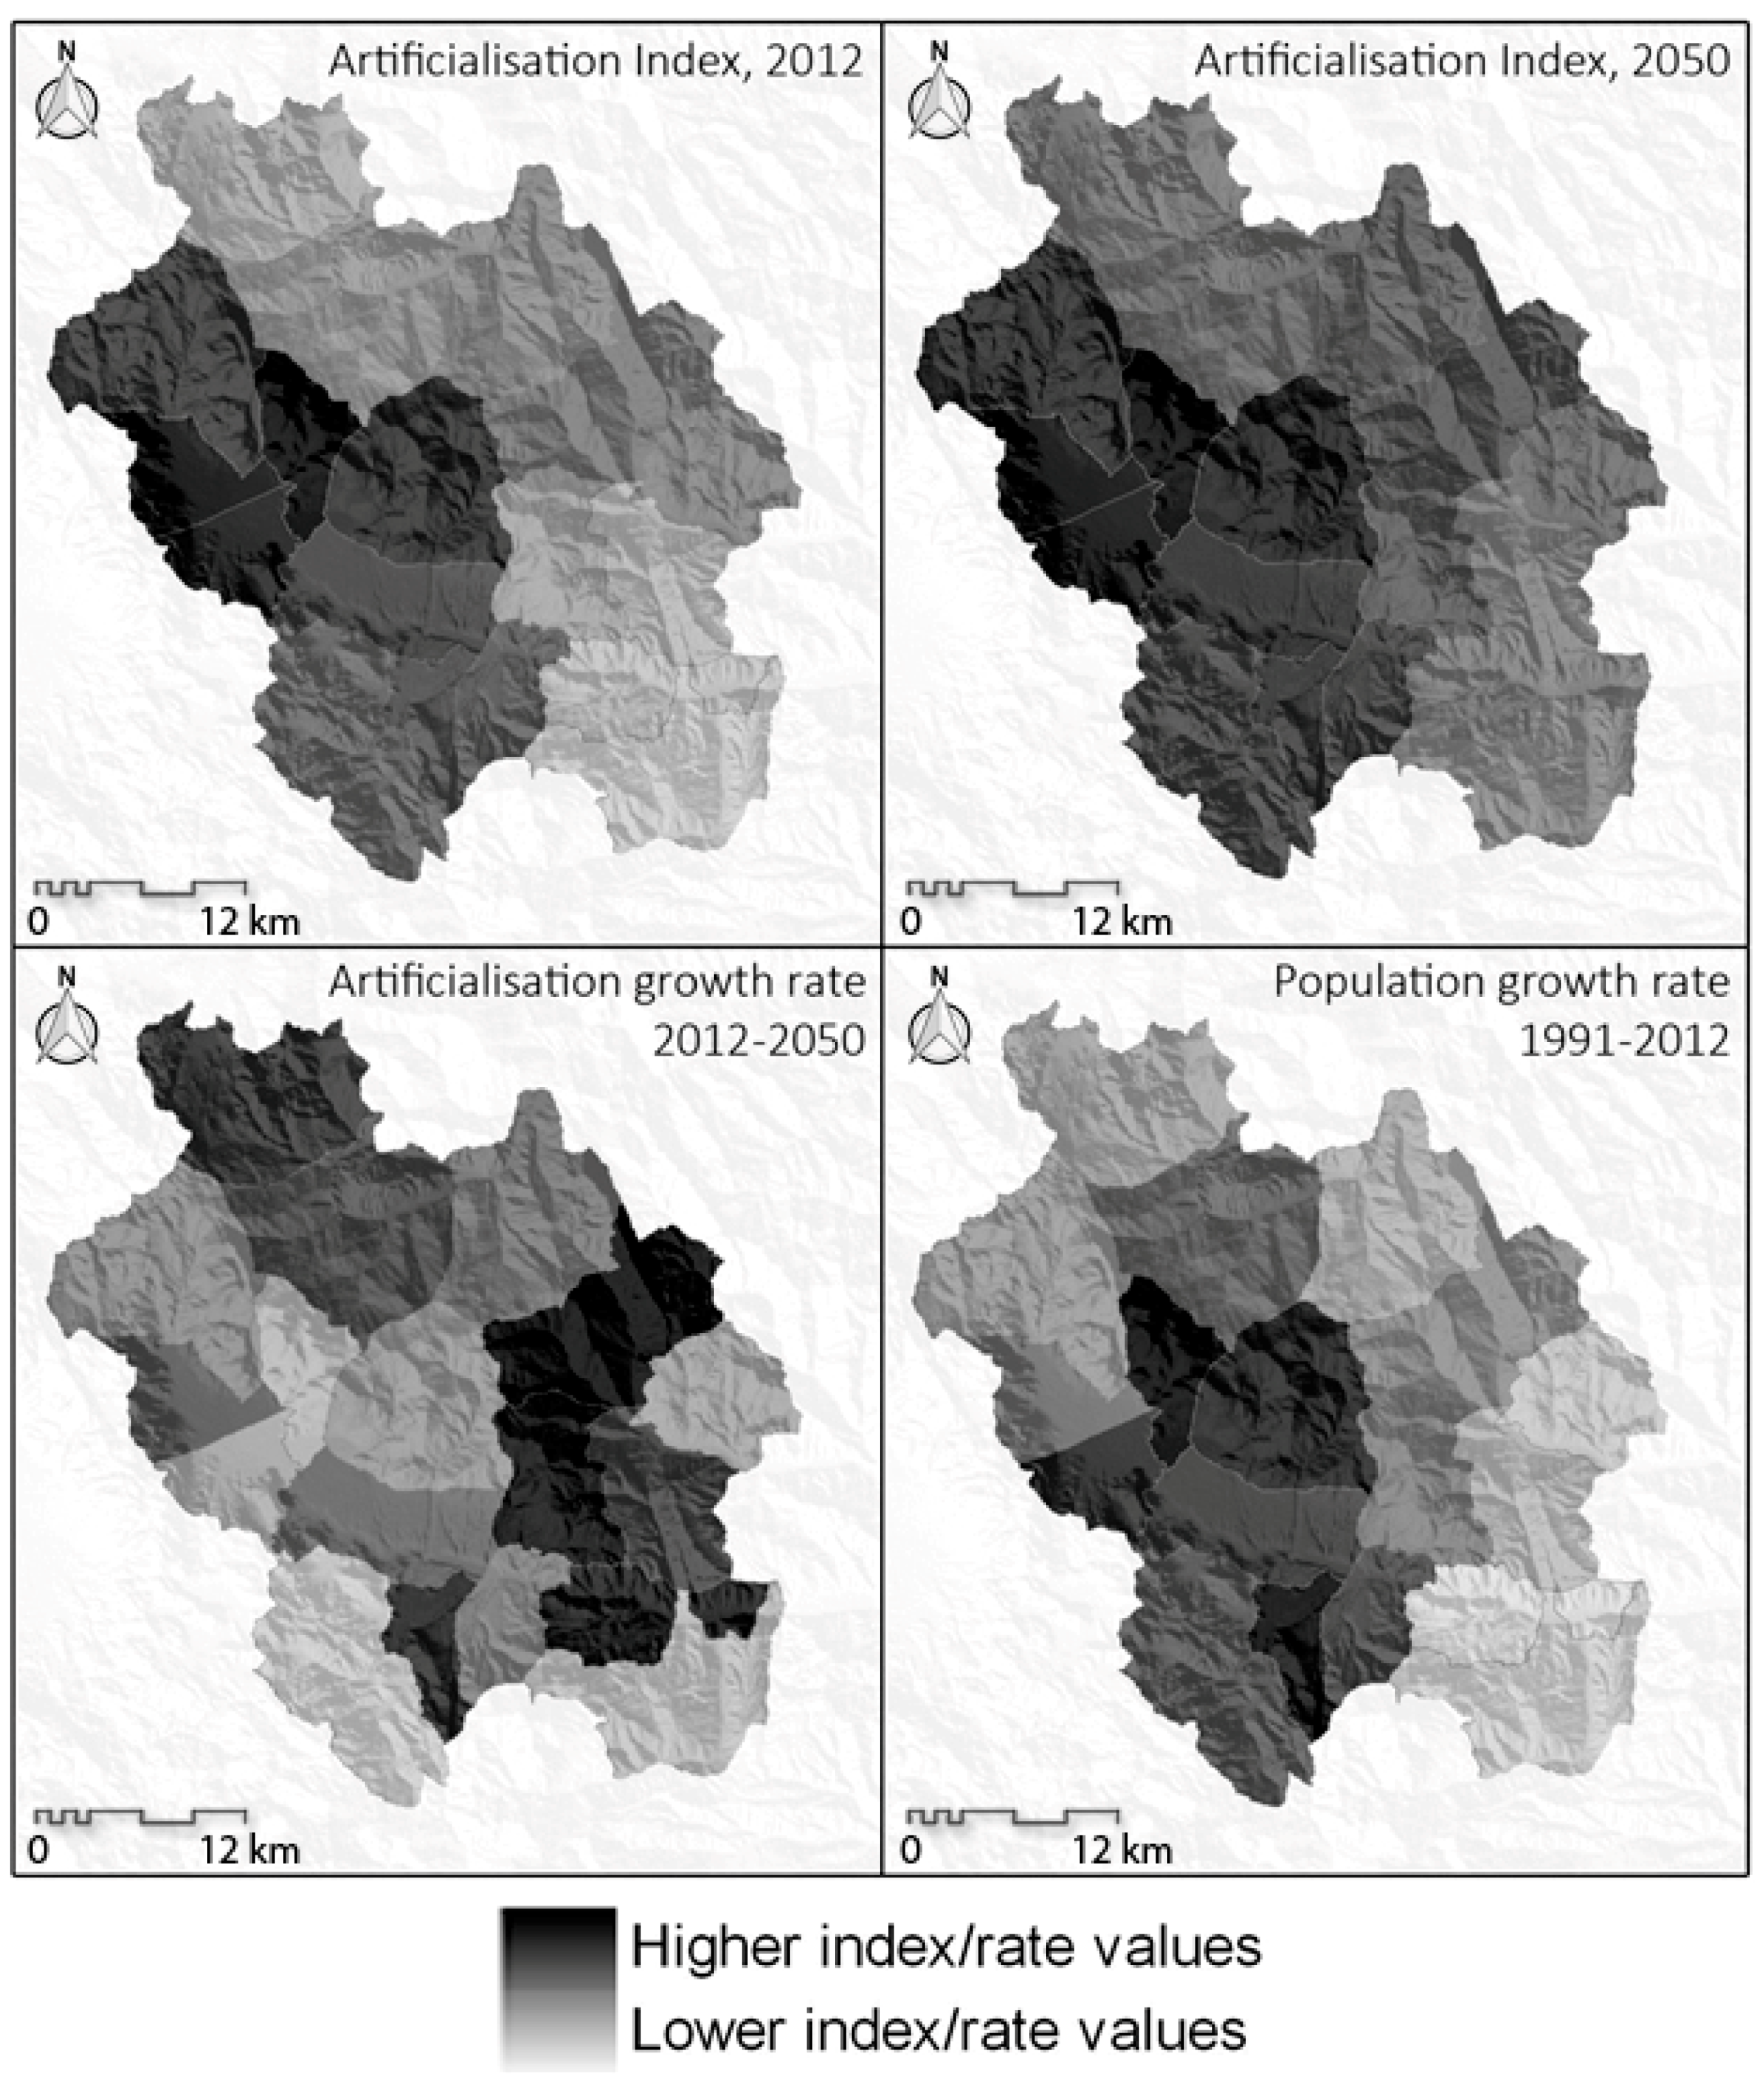
2.3. Artificialization Rate and Population Growth Rate

The literature suggests several methods for the evaluation of the spatial variations of the resident population and built-up areas within a territory [17]. This paper will use two indicators: the artificialization rate and population growth rate [39].
The index of artificialization is given by the ratio between the sum of artificial areas and the total area of the municipality Equation (1):
I n d e x   o f   a r t i f i c i a l i z a t i o n = a r t i f i c i a l   a r e a s   ( k m 2 ) m u c i p a l i t y   a r e a   ( k m 2 )
The rate is given by the difference between the extents of artificial areas at two different dates, normalized by the extent of the more recent date Equation (2):
A r t i f i c i a l i z a t i o n   r a t e =   a r t i f i c i a l   a r e a s   ( t 2 )   a r t i f i c i a l   a r e a s   ( t 1 )   a r t i f i c i a l   a r e a s   ( t 2 )
Population growth rate is calculated according to the following equation (ISTAT) Equation (3):
P o p u l a t i o n   g r o w t   r a t e =   p o p u l a t i o n   ( t 2 )   p o p u l a t i o n   ( t 1 )   p o p u l a t i o n   ( t 1 )

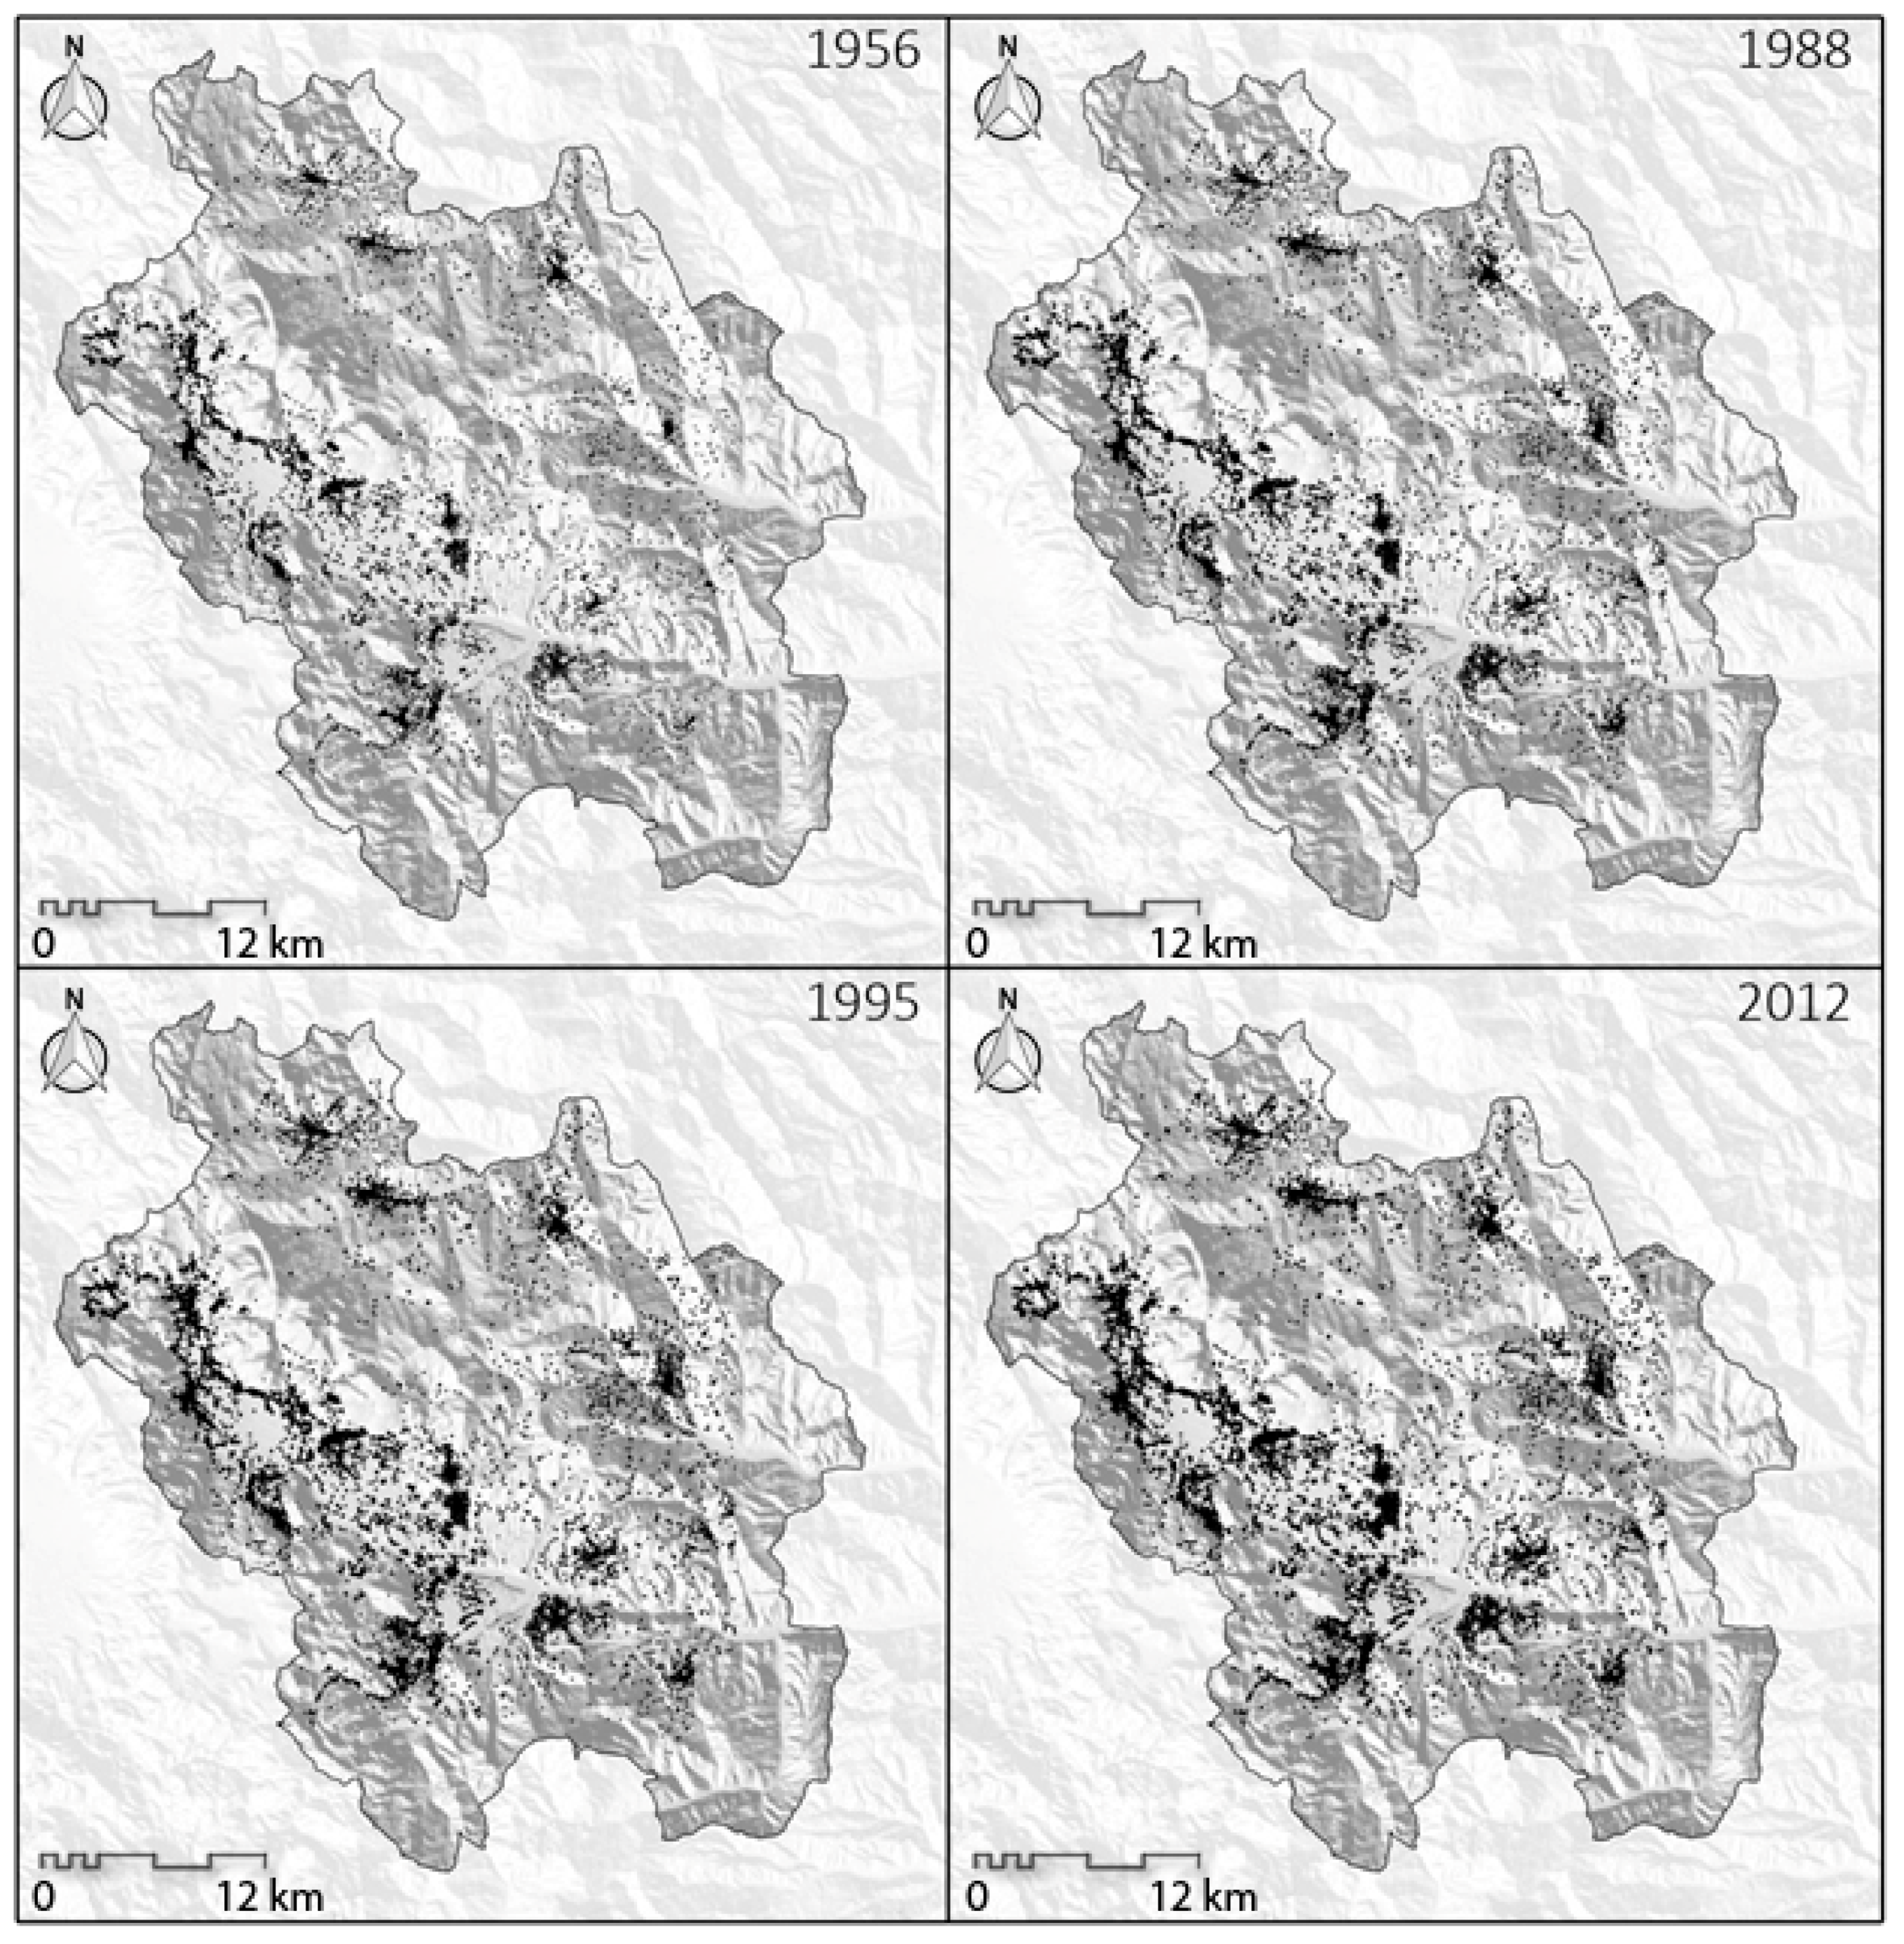
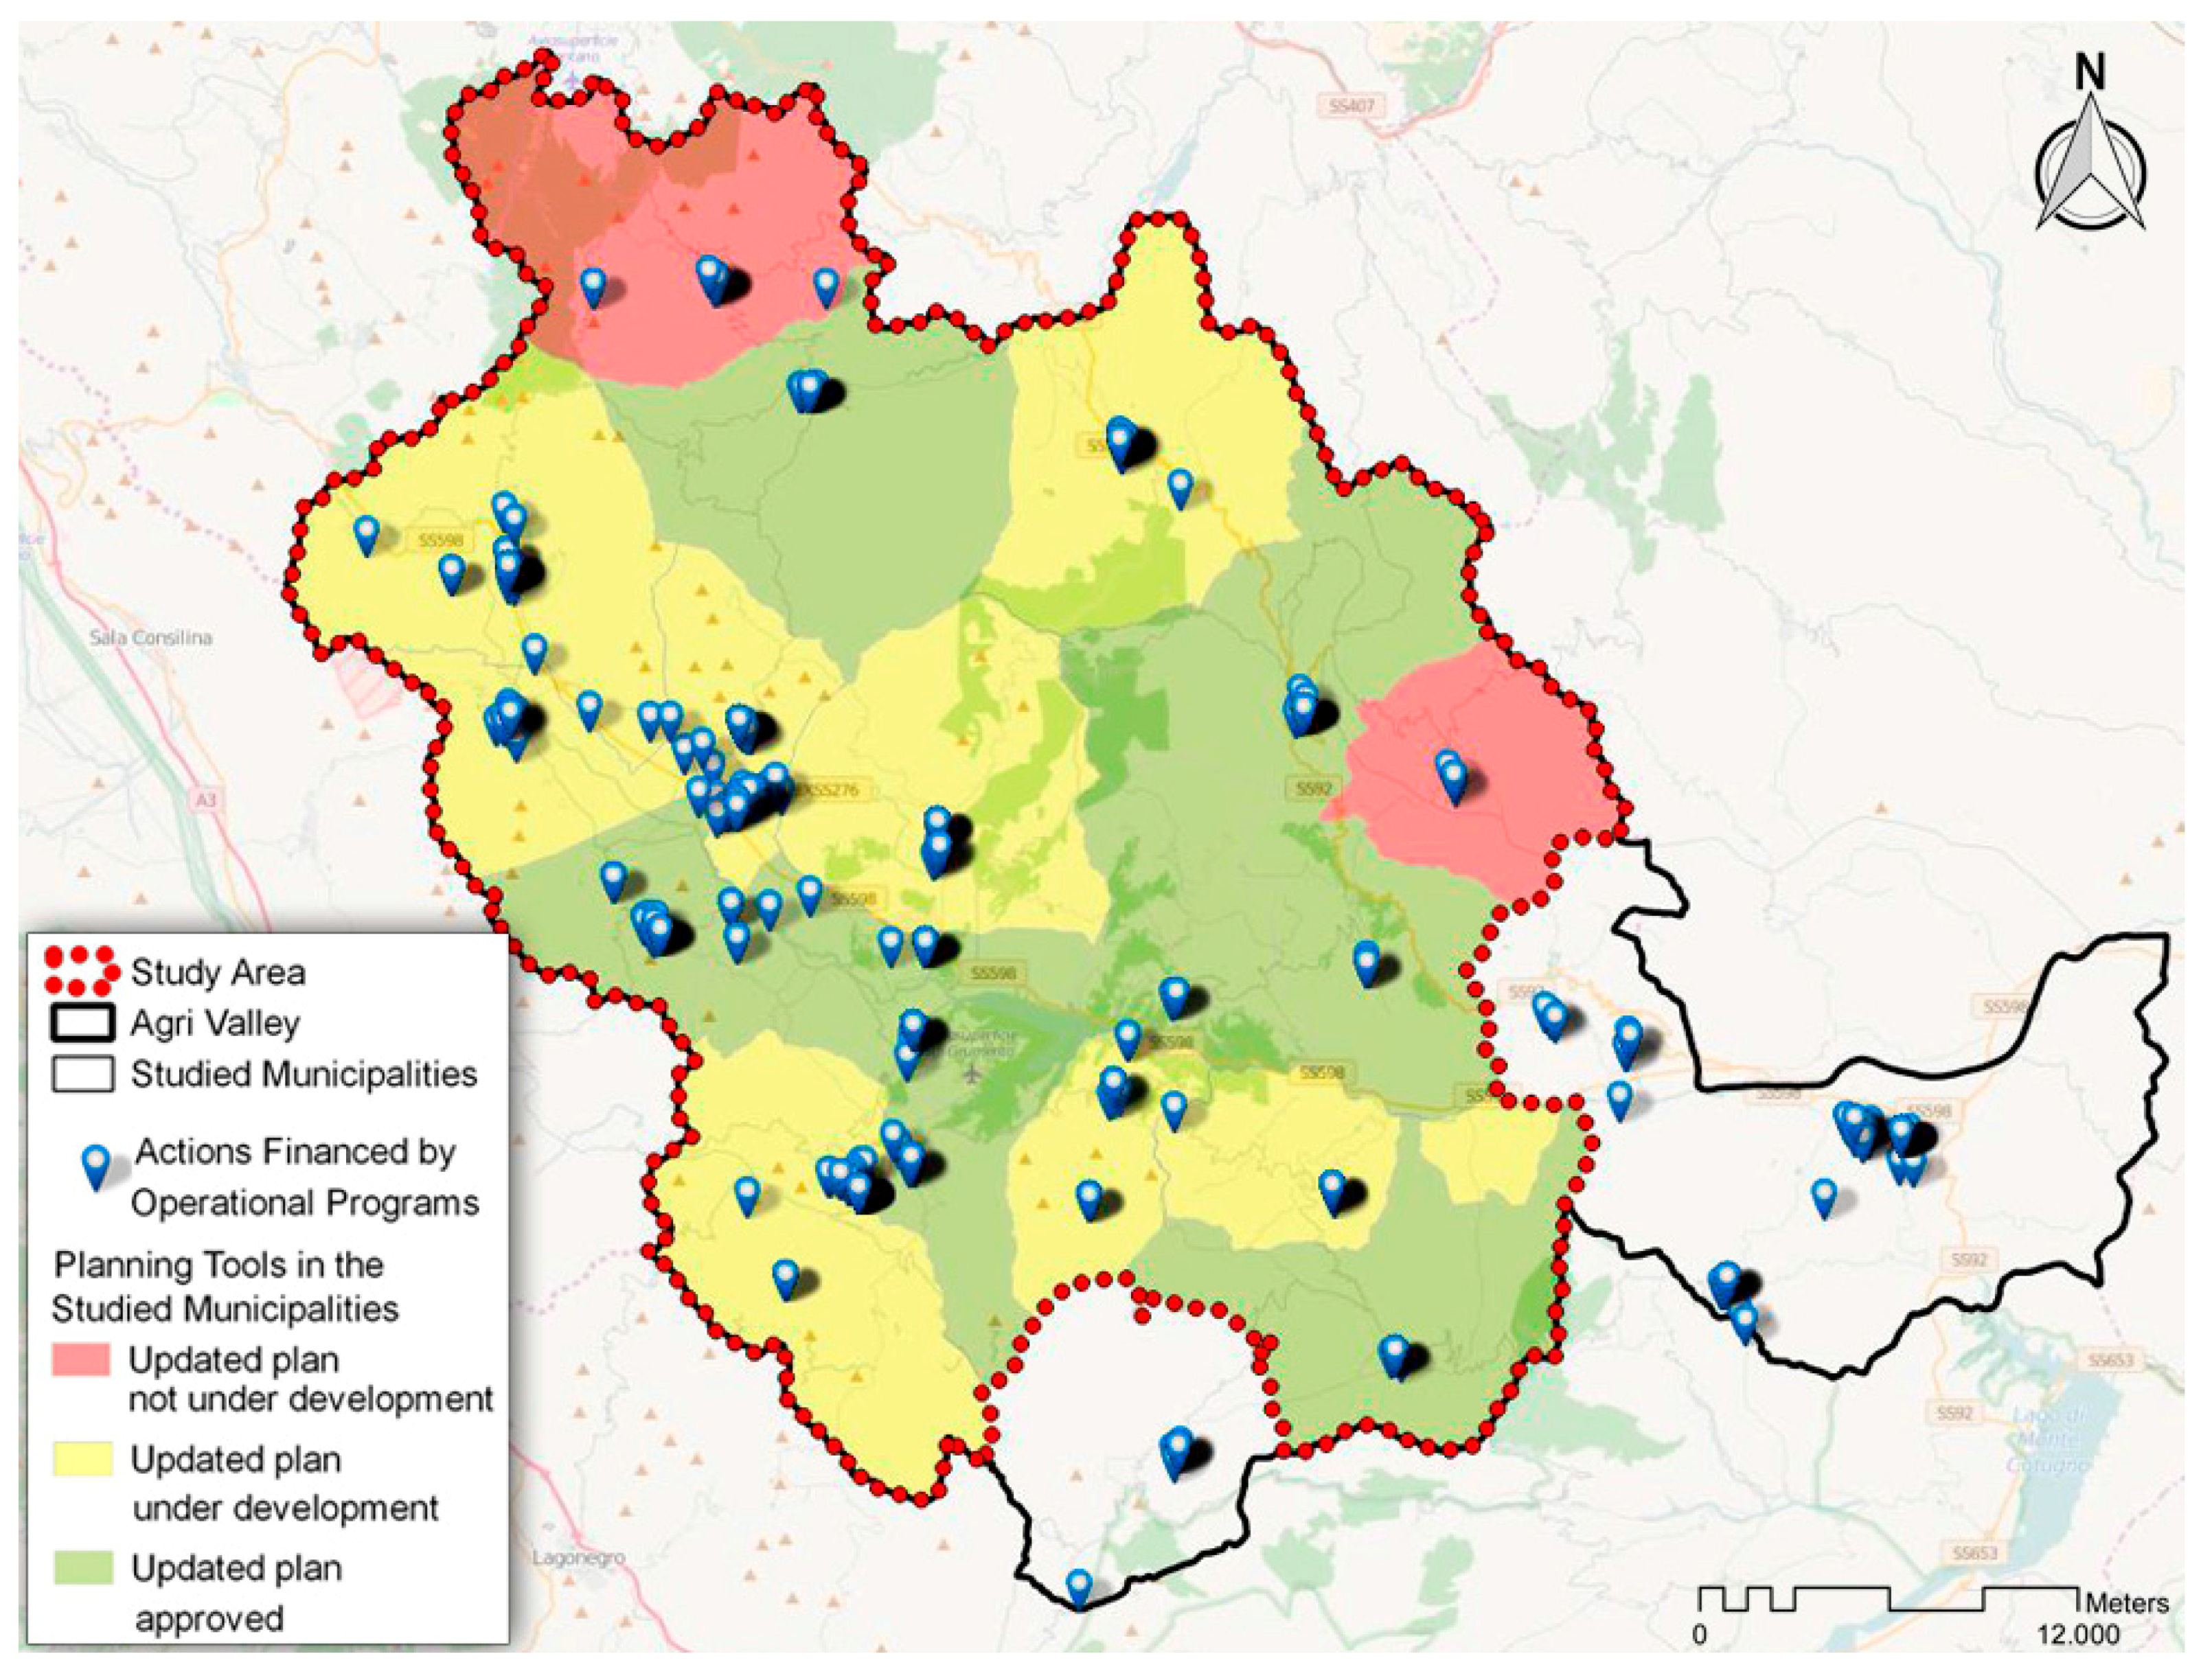
2.4. Materials and Data Preparation

As aforementioned, input data required for SLEUTH simulation are indicated by their own names as SLEUTH is the acronym for Slope, Land use, Exclusion, Urban, Transportation and Hillshade. These input data must be produced according to several criteria in order to be used by the model.
First, they must be GIF format grayscale images; the extent and spatial resolution of the area covered by each image must be identical. In this paper a spatial resolution of 30 m has been adopted in raster creation. The Slope layer identifies land steepness at each cell location and it is usually derived from Digital Terrain Models. Landuse is a key component to make full use of the potential of SLEUTH. The model requires at least two classified maps of land uses for two different dates. The Exclusion layer is critical to introduce restrictions that limit and hinder the simulation of urban growth. Usually it portrays those parts of the territory that are not available for built-up development, both from a purely physical point of view, and from a policy regulamentation perspective. In the first case we consider waterways and extremely steep areas. All areas with some sort of constraint to built-up expansion belong to the second case. The degree to which these two classes of exclusion resist to urbanization is not equal; in fact, while it is physically impossible to build on water bodies or steep surfaces, the same cannot be said for regulation-driven exclusion. Accordingly, different zones within the same exclusion layer may have different weights, indicating their ability to resist urbanization. Hence, this layer is used to test potential future policies scenarios into simulation. In our case study, cells were assigned four different discrete values to account for these different degrees of resistance to urbanization:
  • Value 100: areas a priori excluded from any sort of simulation, referred above as the first case in which land cannot be physically prone to urbanization; hence 100 represents the greatest resistance to artificial development.
  • Value 75 includes all areas on which some strict binding and severe planning regulation obstacle urbanization, i.e., areas identified by high and very high geological risk in the land use masterplan of Valley of Agri. Riverbanks with a cycle of 30 years were also assigned to this class, as defined by several land use planning masterplans in the years. Furthermore, all areas within a buffer zone of 150 meters from conservation sites and archaeological areas were included, too.
  • Value 50: only river banks with a return period of 200 years were included; Value 25 includes part of the areas labeled with medium and low geological risk in the regional land use masterplan and river banks with return period of 500 years.
Urban layer is of greater importance for the simulation. This is shown by the fact that such information stratum is needed for at least four different dates. The experience gained in the application of SLEUTH demonstrates that accuracy of a forecast is more accurate when both beginning and end date are not too far apart. Table 1 elicits the source used to develop the four urban strata utilized in the simulation (Figure 8).
In this case, the aim of the study is not solely to forecast urban growth pattern but more in general, to simulate artificial soils expansion as a consequence of natural soil consumption. Hence, input data labeled as urban, were prepared including all anthropogenic influences that resulted in land artificialization and soil impermeabilization; therefore, the label “urban” identifies more appropriately all sort of built up areas.
Transport layer contains the road infrastructure. Roads act as a strong catalyst for new settlements; this driver effect is the last growth type that SLEUTH simulates. This simulation step requires only one datum of road network as input. However, given its importance in driving urbanization it is possible to include roads strata for multiple dates.
Consequently, the level of detail necessary to output accurate results depends on the scale of analysis; in this case, we also included the capillary network of local roads.
Hillshade is an image used to give a morphological spatial context to the study area. It is a common function in many GIS software and it can be easily derived from a digital terrain model (DTM).
After data inputs have been coherently prepared, the next phase preceding the simulation is calibration. This is a delicate procedure that is responsible for testing and choosing the best set of coefficients to be used for the forecast. The more the calibration is done carefully, the more likely the simulation will output plausible results. This process consists in a series of steps requiring analysis supervision at the end of each step.
The calibration process requires that five coefficients controlling SLEUTH are investigated along the entire range of variability (from 0 to 100); the goal is to identify a single value for each of them that can better explain land cover changes and urban expansion occurred in the past. In this sense, the procedure trains the model to explain past changes by varying coefficients, and different combinations of coefficients result in different performances. Thus, the best set is then used to initialize the real simulation.
Simulation results were compared with data concerning the municipal urban planning tools available on the Spatial Data Infrastructure of the Basilicata Region [41] and with data regarding the loans stemming from European Funds. These were obtained by analysis based on data available on the Open Coesione Data Wharehouse [42].
The project Open Coesione was developed by the Italian Ministry for National Cohesion and provides a service of Open Data inherent cohesion policies with special regards towards urban and spatial planning. The service is primarily intended to improve the informed participation of citizens in policy-making and provides specific data regarding the projects financed in the programming period 2007–2013 at regional and national level through their Operational Programs. To date, the online platform of Open Coesione provides, among other, databases of the European Structural Funds 2007–2013 and the Cohesion Development Fund 2007/2013.
In this research a geolocation of the actions stored in the database Open Coesione was carried out, allowing to relate the investments made in the territory with urban growth (see Figure 12 in Section 3.2). In order the better assess these data a Kernel Density Estimation was performed [43,44]. Compared with the traditional density measure where the grids are classified according to the number of events contained in a single cell, this method has the peculiarity to emphasize the peaks of a distribution [45,46]. In particular, in the application (Section 3.2, Figure 12) each intervention has been considered as event and its funding as intensity of the phenomenon.

3. Results and Discussion

3.1. Model Calibration

Model calibration was executed as described in Section 2. In the case of the Agri Valley, the rather low values assumed by the diffusion coefficient and the breed coefficient breed show that urbanization in the area is little characterized by sprawling patterns and that the emergence of new sparse settlements is limited.
In addition, spread coefficient is not particularly high; however, this may indicate a fair chance of development in marginal areas of the settlements and a higher rate of expansion of the already existing settlements.
Finally, slope coefficients with their high value underline a strong urbanization constraint, due to the orographic complexity of the territory, while the average value of road gravity coefficient—which is higher than the other factors regulating urban growth—highlights the significant role that transport infrastructure has on the development of the area investigated (Table 2).

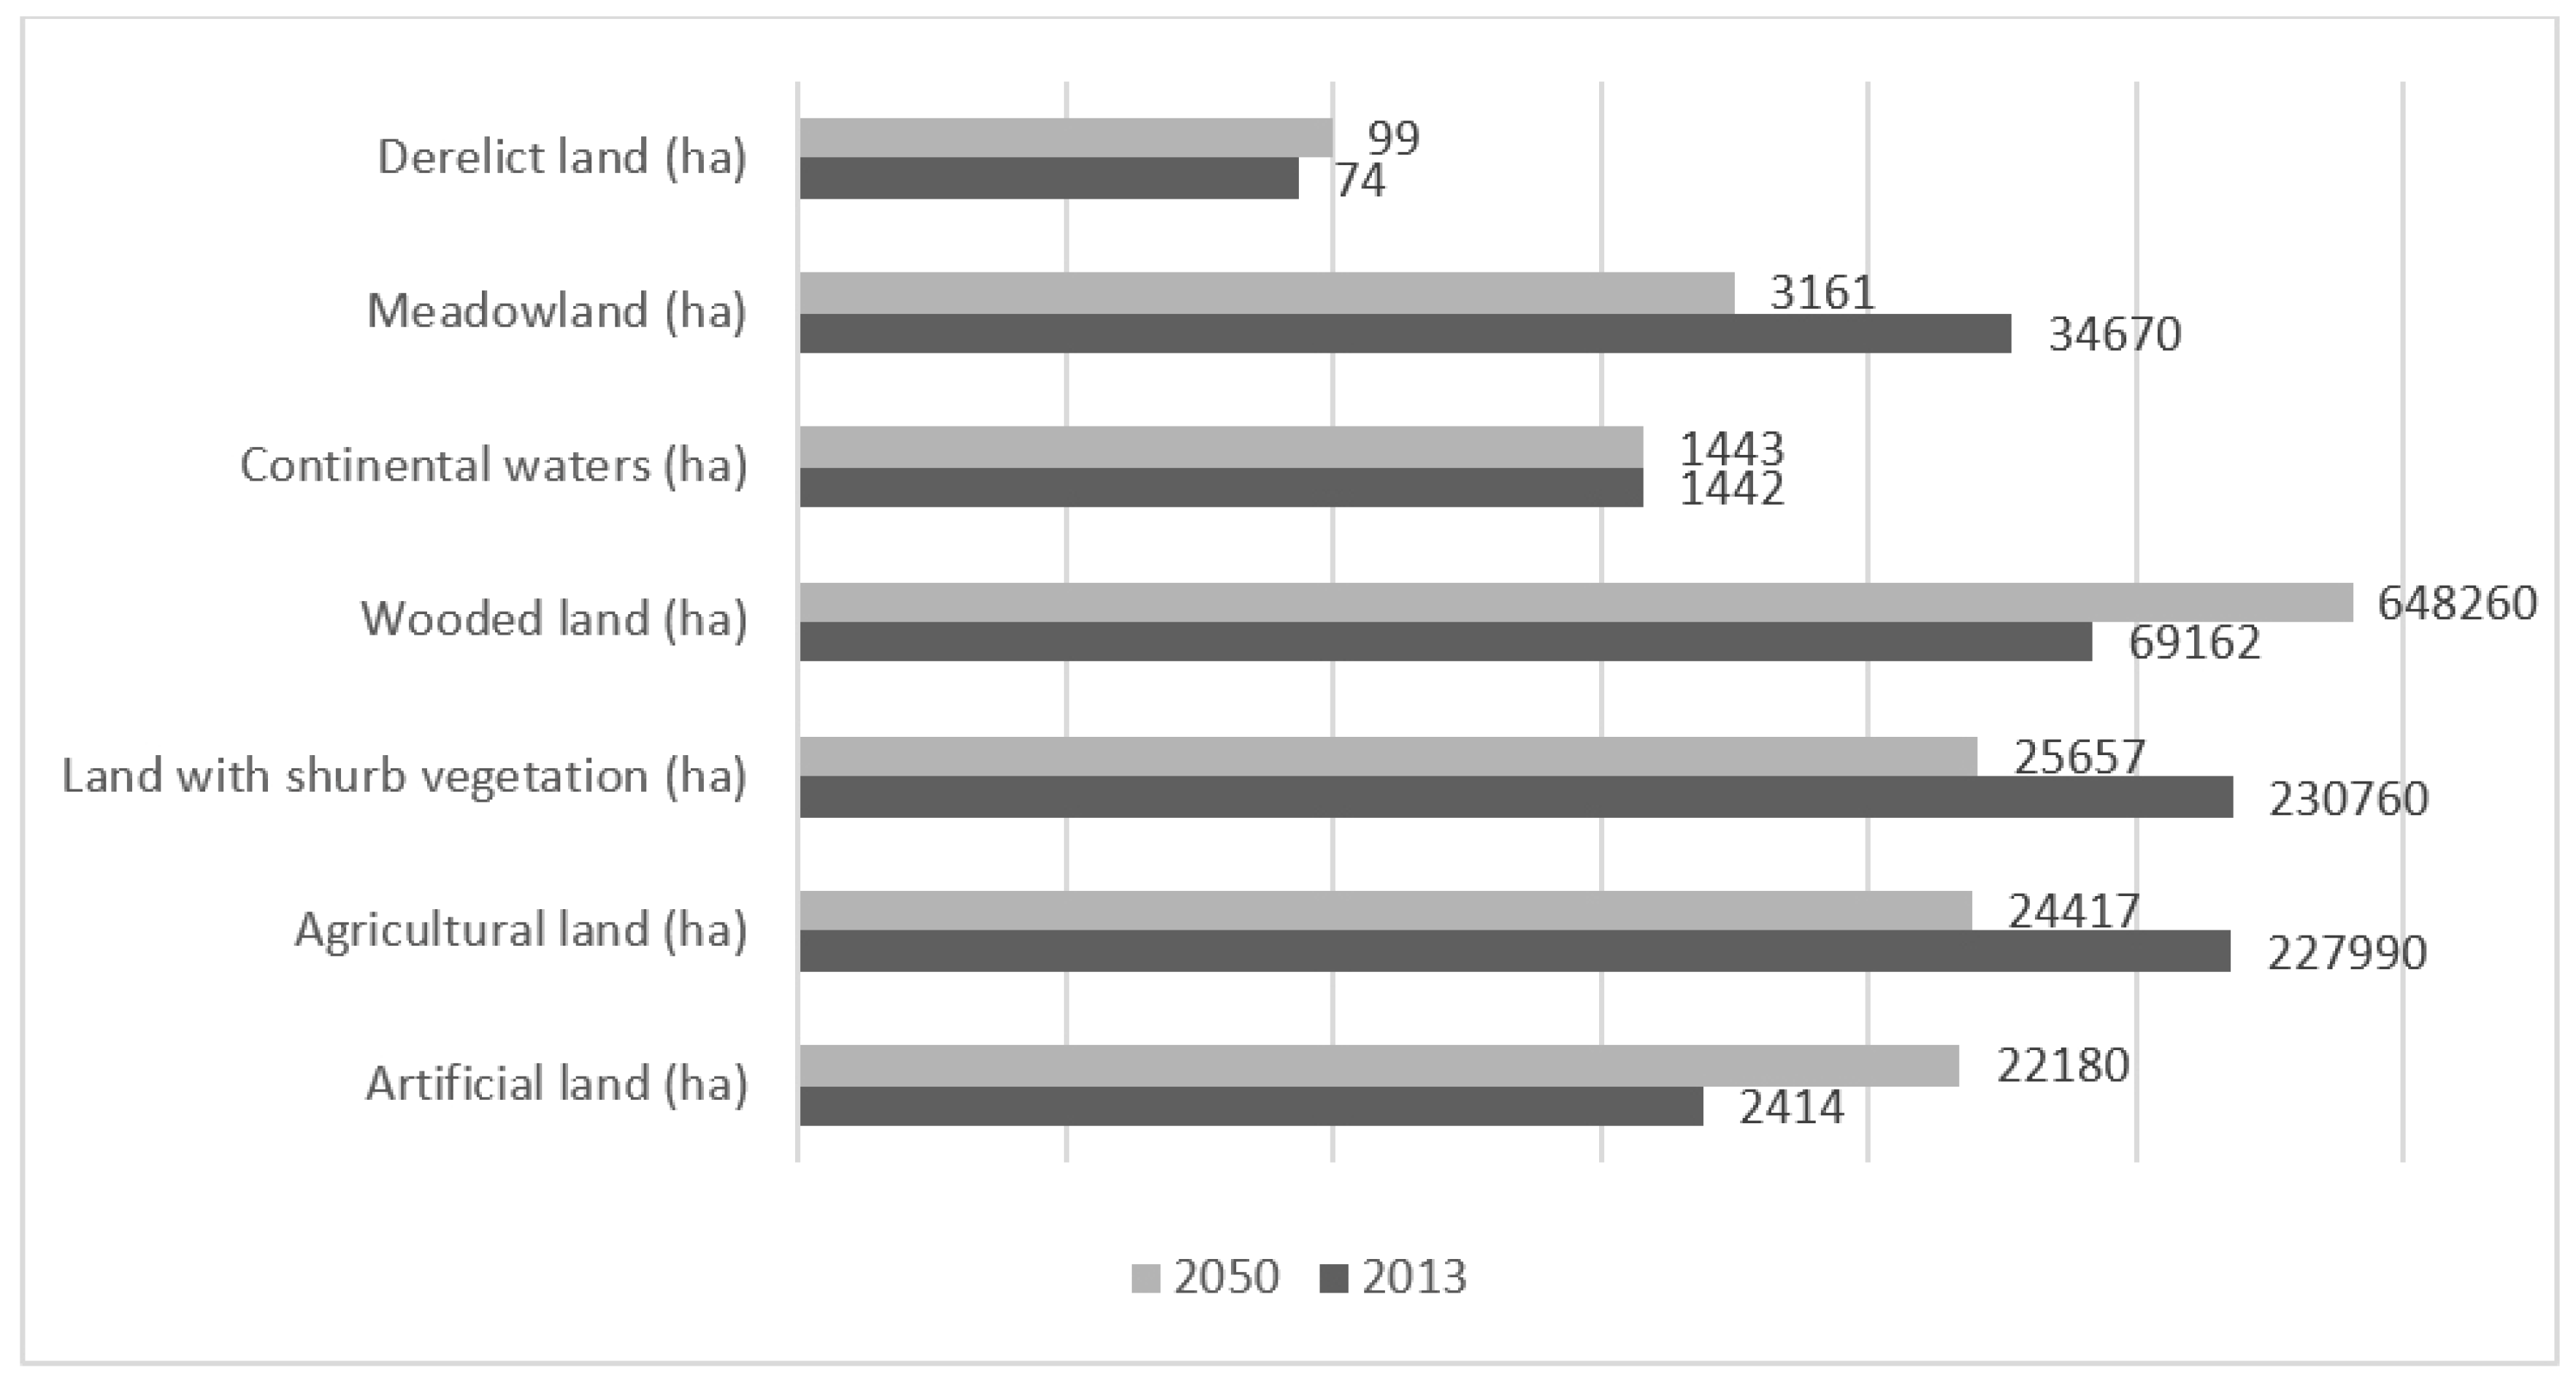
3.2. Simulation Results

Results of urban growth forecast up to 2050 confirm the evolution trend observed from past data for Valley of Agri (Figure 9).
The municipalities of Marsico and Viggiano are the ones that suffered the most anthropogenic pressure caused by oil and mining industry. Coherently, those municipalities are also the ones for which simulation resulted in the highest proportion of urbanization (Table 3).
Concerning the road infrastructure, it is possible to recognize three main road branches as main catalyzers of urban growth. On one side, State Road 589 and Province Road 92 cross the Valley of Agri almost on a straight diagonal from northwest to southeast, following the bottom of the valley. On the other side, the State Road 103 cuts through the southern part of the area along an orthogonal direction compared to the other two roads.
The expected growth of artificial areas appears more worrying when compared to data regarding population trends. In fact, the simulated expansion of artificial areas concerns all municipalities of the southern-east region, whereas population growth rate registered positive values only for two municipalities, Sarconi and Marsicotevere. The latter is also the only one to brake the 5000 inhabitant threshold in the whole region of interest. Minimum population growth rate values instead are correlated to the municipalities for which the lower rate of artificial areas expansion is simulated (Table 4).
The discrepancy between population and urbanization dynamics is a characteristic phenomenon that is peculiar of a national scale problem. This contradictory situation is one of the main issues that interest scientists and scholars conducting landuse and landcover change forecast in Italy [17,47,48,49]. We do not believe that this phenomenon is specific of the “Italian” case. However, only ad hoc regulation that envisions soil consumption as an extremely high environmental cost can efficiently recouple demand for houses to population growth, thus avoiding useless and harmful extra soil consumption. This plays a key role in determining both re-stabilization of the real estate market and the development of efficient countermeasures to prevent unjustified soil consumption.
The expansion of artificial areas resulted from the simulation happens to interest mainly agricultural areas. However, loss of agricultural land is not entirely the result of urban expansion but it also seems to be replaced by vegetated areas, thus resulting in an increase of the degree of naturalization (Figure 10). We suggest that such a result is due to numerous restrictive policies aimed at protecting the natural environment, which make it more difficult to convert natural and semi-natural into artificial land. All this information was conveyed in the simulation through the Exclusion layer, which prevents simulation of growth to happen from these areas but also from the surroundings.
Furthermore, results of the simulation underline two important issues that should be tackled in the future: first, such an impaired expansion of artificial areas must have several drivers that are responsible for it and thus should be previously addressed. Second, if the loss of agricultural areas on the one hand shows agro-industry weakness in facing urban expansion, on the other hand, it represents the loss of an asset difficult to be restored. Nevertheless, we suggest that both central and regional policies, which pursued and favored for a long time the exclusive development of mining and oil industry, appear disconnected with the context. In fact, the mining industry affects a small part on the development of the area, whereas it threats a fundamental asset of the real driving force of economic development of the region (agricultural production). Oil industry became a specialization sector for Agri Valley since 1990 when the first oil extraction concession (named “Grumento Nova”) were granted by the Italian Ministry of Industry. Until 2008, the mining activity had grown considerably and the ENI established in Val d'Agri its Southern District (DIME) for the management of research and exploration activities in the whole Southern Italy. As consequence (positive) of the development of oil extraction industry, a relevant additional economic resources where driven for local development. The total amount of royalties received by Regional and local Public Administration is about 585 M€ (until 2012). Such finances where managed at Regional and Municipal level in order to promote local development programs and actions. The Operative Program Val d’Agri represents the mainstream programming instrument promoting development strategies. While several interventions and project oriented to improve urban renovation and service supply for resident population, an effective impact on economic and productive sector in not clearly evident in the Agri Valley. Actual data concerning unemployment (14.7% in 2014), depopulation and aging population (aging population rate in Val d’Agri: 22.2 years) depict a critical situation defined by EU as “lagging region”.
Despite the direct impact of oil industry in terms of employment (311 employees ENI 143 of which are residents in Basilicata) and that of the oil industrial district (about 2400, 1000 of which are residents in Basilicata), the oil extraction industry did not influence strategic local development. Among direct causes, the relevant agro-environmental character of the area, considered also in terms of local identity, did not favor a process of innovation of local production towards the oil fields industries and facilities. Such evidence generated conflicts properly addressed by local “green” social movements against oil and shrinkage in agro-food industry based on several products quality certificates (e.g., Protected Geographical Indication, Protected Geographical Designation of Origin). The agri-food sector suffers a market’s suspicious of potential contamination due to oil extraction. The policy making actually doesn’t help to clarify the boundaries for oil extraction industry development and preservation rules for agro and environmental values in the area [50].
The research considers this lack of strategic view as a critical factor influencing negatively territorial planning practices and processes in terms of effective sustainable perspectives.
For each Municipality, the rate of population growth (Figure 11) was calculated considering National Census data of 1991 and 2012. Through the simulation result and the map of built-up areas of 2012 rate of artificialization and artificialization indexes for 2012 and 2050 were also defined.
The western part of the Valley appears to have both in 2012 and 2050 the higher Artificialization Index. In the same area it is also evaluable the biggest value of the Population growth rate. The simulation results showed a significant urban growth also in the eastern part of the Valley; this justifies the high values in area of the Artificialization growth rate. The highest values of the index of artificialization in the western area can be explained with the observation of the investments made through the European Fund developed using data from the project Open Coesione (Figure 12). These show that the majority of investments have occurred in the same part of the Valle affected by higher levels of soil consumption. Geolocating Open Coesione data, it was possible to calculate a kernel density [51], using as intensity the amount in euro of funding for each single action. The result shows that the Municipality affected by the higher density values are Marsiconuovo, Marsicovetere, Viggiano and Grumento Nova.
This trend to the use funds arising from Operational Programmes to realize infrastructural projects with high impact in terms of soil consumption is even more warring if the state of obsolescence of the municipal urban planning tools is considered. Most of the interventions have been financed within Municipalities which still own planning instruments made pursuant to the National Law 1150 of 1942 (with its subsequent amendments and additions), while only a few Municipalities in Agri Valley today are already equipped with updated urban planning tools pursuant to the latest regional Law 23 of 1999 (Figure 13). This disconnect between planning and Operational Program investments is on one side contributing in generating soil consumption, while on the other is helping to develop settlements through inhomogeneous, rough and low livable tissues. Most of the interventions, in fact, are realized in total absence of an overall strategic framework able to relate its investments on the territory with the real needs of the people living in it. Further development of this research will be aimed at developing parallel modeling using SLEUTH through different scenarios, with the purpose of defining the possible impacts in terms of urban growth made by different policies that can be defined during the update of planning instruments.
The analysis conducted in this paper shows the dramatic importance of the development of updated urban planning tools based on principles aimed at reducing soil consumption, which today is no longer justified by real demand for housing, the safeguarding of natural and environmental systems, and the sustainable development of local communities. Planning, de facto, plays an important role both in its ability to convey public investment, including those arising from Operational Programmes, both in protecting the soil resources that, for the reasons set out in this paper, must be considered as limited and therefore regarded as a common good [52]. It should however be stressed how Italian legal framework of urban planning considers it as a matter of competing interest between the state and regions. It is therefore crucial for regional and municipal planning instruments to be complemented by an update of the national legislation concerning planning, especially considering how the law still in force in dated 1942. A review of the contents of that law is therefore desirable, particularly to integrate regulations concerning landscape conservation and reduction of soil consumption not only in quantitative terms but also in qualitative ones, referring to the evidence that not all soils are characterized by the same degree of naturalness, or fertility and of agricultural productivity.
As previously anticipated, an important element for discussion that shall be taken into consideration regards the weakness of Landscape Planning in the area, which—if improved—could conversely play an important role in bridging and augmenting the coherence between Operational Programs and plans at the municipality level. Until 1985 the law on protection of natural beauties (1047/1939) was not much implemented. The Italian Law 431/1985 states that landscape is managed at regional level Some regions have approved Landscape Plans considering the whole territory; others have identified some areas of the region to be subjected to landscape planning. Basilicata Region was one of the first regions to implement Landscape plans, approved in 1990, unfortunately, the decision was to consider only six areas; thus, roughly the 19.1% of the region (Figure 14 top left corner). This choice was driven by the fear to impose too many constraints to the transformation of the territory. This approach has been a big limit of this experience because Law 431/1985 conferred a broader meaning to the concept of landscape. Landscape plan differs from other plans because it does not punctually define the programmed land use, but it defines the possible level of transformation. Consequently, a landscape plan should also analyze territorial areas characterized by a significant anthropic presence, considering the huge compatibility issues between the need of landscape protection and preservation and the multiple possibilities of anthropic use. The choice of considering in landscape plan only areas with elevated values of naturalness, on one side ignores areas with conflicts, totally managed by plans at municipality level, and on the other side in many cases it generates a sort of duplicate of the plans of regional and national parks. Figure 14 shows that the study area is only partially covered by the landscape plan of “Sellata-Vulturino” and another landscape plan “Gallipoli-Cognato” is immediately outside. The paradox is that a great part of municipalities is not included in landscape plans but it is inside the national park of “Appennino-Lucano”.
This poor interest for landscape planning by Basilicata Region has been confirmed when the Regional Law of Territorial Government (L.R.23\99) was implemented. One of the elements of this law is that it prescribed the elaboration of a regional map of soils, which was meant as a sort of landscape plan extended to the whole region. Through this tool the administration aimed at defining the possible levels of transformation for different areas. Unfortunately, seventeen years after the law’s approval the regional map of soils has not been yet realized. Comparing Figure 9 and Figure 14 it is evident much of the urban sprawl happens outside the area covered by the landscape plan of “Sellata-Vulturino”. In addition, a great part of the interventions defined by programming documents (Figure 12 and Figure 13) are concentrated outside the limit of “Sellata-Vulturino” landscape plan. This demonstrates that even an old landscape plan can have a certain level of effectiveness, and that a proper implementation of the Regional Law of Territorial Government could ensure a more sustainable development of the territory.

4. Conclusions

This paper proposes the use of the SLEUTH model to forecast and analyze the evolution of urban areas in a peculiar context at loco-regional scale. The case study focused on the Agri Valley, an area characterized by strong conflicts between the high landscape values and the presence of oil extraction facilities. The simulation results showed that the current trend of soil consumption is likely to continue in the coming decades. Moreover, it was possible to correlate the increase in built-up areas with the depopulation of the Valley, with the obsolescence of the urban planning tools and with the investments made within the area through European Structural Funds.
The results show the need for strong legislative action.
Only a series of laws aiming at limiting the extraction of oil and promoting a better use of other resources (e.g., water and agricultural land) can potentially lead to more stable and sustainable development.
The SLEUTH model has been extensively used in scientific research, applied in diverse regional contexts, and proved to represent an efficient, yet innovative, instrument of analysis for local/regional land use and urban planning. Its main strength consists in the fact that through forecast it enables the possibility to foresee the spatial effects of current business-as-usual trend and compare these with the potential effects coming from different planning scenarios conveyed by specific policies. However, although the SLEUTHing of the Agri Valley produced relevant results, it also suggests that further analysis is needed to overcome few limitations that pertains to the structure of SLEUTH. In particular, we refer to the fact that the model does not feature built-in modules to specifically introduce socio-economic or other variables, and this has to be done exclusively through the exclusion and infrastructure layers. Besides SLEUTH is mainly suitable for mimicking an expansion pattern of the urban form, which can follow either a sheer or almost flat curve. Thus, implying that SLEUTHing capabilities of forecasting urban shrinking and re-naturalization of sealed surfaces are limited. However, we can speculate that this does not relevantly cap SLEUTH potential for land-use planning; in fact, the complete reclamation of developed areas is seldom a spontaneous phenomenon, that usually occurs over a wider timespan than standard SLEUTHing forecasts.
Another important consideration is the possible use of SLEUTH model in planning processes. A lot of planning choices could be supported with the forecasting of urban sprawl. Landscape plans could benefit from this activity in two phases: during the plan implementation in order to understand the possible urban growth and for testing the effectiveness of several planning choices, analyzing possible future trends. In situations of high settlement pressure a high concentration of anthropization could occur on the border of high naturalness area. This trend could be highlighted using the SLEUTH model and also an excellent landscape plan not supported by this analysis may not be enough [53].

Acknowledgments

This research was supported through funding from the University of Basilicata entitled to Beniamino Murgante, and from the program “avvio alla ricerca” of the University of Rome La Sapienza awarded to Federico Martellozzo.

Author Contributions

All authors contributed equally to this work. In particular experiment design and writing of the manuscript was developed jointly by all authors. However, Federico Amato, Biagio Antonio Maimone and Gabriele Nolè performed the experiments, while Beniamino Murgante and Federico Martellozzo focused on the interpretation of results and on the elaboration of the discussion.

Conflicts of Interest

The authors declare that there aren’t conflicts of interest.

References

  1. United Nations. Transforming Our World: The 2030 Agenda for Sustainable Development. Seventieth Session, Agenda Items 15 and 116. 2015. Available online: http://www.un.org/ga/search/view_doc.asp?symbol=A/RES/70/1&Lang=E (accessed on 21 October 2015).
  2. Romano, B.; Zullo, F. Land urbanization in Central Italy: 50 years of evolution. J. Land Use Sci. 2012. [Google Scholar] [CrossRef]
  3. Romano, B.; Zullo, F. Models of urban land use in Europe: Assessment tools and criticalities. Int. J. Agric. Environ. Inf. Syst. 2013, 4, 80–97. [Google Scholar] [CrossRef]
  4. Martellozzo, F.; Ramankutty, N.; Hall, R.J.; Price, D.T.; Purdy, B.; Friedl, M.A. Urbanization and the loss of prime farmland: A case study in the Calgary–Edmonton corridor of Alberta. Reg. Environ. Chang. 2014, 15, 881–893. [Google Scholar] [CrossRef]
  5. Cerreta, M.; Poli, G. A Complex Values Map of Marginal Urban Landscapes: An Experiment in Naples (Italy). Int. J. Agric. Environ. Inf. Syst. (IJAEIS) 2013, 4, 41–62. [Google Scholar] [CrossRef]
  6. Grimmond, S. Urbanization and global environmental change: Local effects of urban warming. Geogr. J. 2007, 173, 83–88. [Google Scholar] [CrossRef]
  7. Taha, H. Urban climates and heat islands: Albedo, evapotranspiration, and anthropogenic heat. Energy Build. 1997, 25, 99–103. [Google Scholar] [CrossRef]
  8. Rizwan, A.M.; Dennis, L.Y.C.; Liu, C. A review on the generation, determination and mitigation of Urban Heat Island. J. Environ. Sci. 2008, 20, 120–128. [Google Scholar] [CrossRef]
  9. Fahrig, L. Effects of Habitat Fragmentation on Biodiversity. Annu. Rev. Ecol. Evolut. Syst. 2003, 34, 487–515. [Google Scholar] [CrossRef]
  10. Foley, J.A.; DeFries, R.; Asner, G.P.; Barford, C.; Bonan, G.; Carpenter, S.R.; Chapin, F.S.; Coe, M.T.; Daily, G.C.; Gibbs, H.K.; et al. Global Consequences of Land Use. Science 2005, 309, 570–574. [Google Scholar] [CrossRef] [PubMed]
  11. Council of Europe. “European Soil Charter”. Available online: https://wcd.coe.int/ViewDoc.jsp?id=654589 (accessed on 20 August 2015).
  12. Couclelis, H. Cellular worlds: A framework for modelling micro-macro dynamics. Environ. Plan. A 1985, 17, 585–596. [Google Scholar] [CrossRef]
  13. Von Neumann, J. Theory of Self-Producing Automata, Urban and Chicago; University of Illinois Press: Champaign, IL, USA, 1996. [Google Scholar]
  14. USGS. Project Gigalopolis: Urban and Land Cover Modelling. Available online: http://www.ncgia.ucsb.edu/projects/gig/ (accessed on 10 July 2015).
  15. Li, X.; Yeh, A.-G.O. Modelling sustainable urban development by the integration of constrained cellular automata and GIS. Int. J. Geogr. Inf. Sci. 2000, 14, 131–152. [Google Scholar] [CrossRef]
  16. Amato, F.; Pontrandolfi, P.; Murgante, B. Supporting planning activities with the assessment and the prediction of urban sprawl using spatio-temporal analysis. Ecol. Inf. 2015, 30, 365–378. [Google Scholar] [CrossRef]
  17. Kew, B.; Lee, B.D. Measuring Sprawl across the Urban Rural Continuum Using an Amalgamated Sprawl Index. Sustainability 2013, 5, 1806–1828. [Google Scholar] [CrossRef]
  18. Unioncamenre Basilicata Region, 2012, L’economia della Basilicata nel 2012. Available online: http://www.sistan.it/fileadmin/redazioni/basilicata/RAPPORTO_ECONOMIA_2012.pdf (accessed on 10 July 2015). (In Italian)
  19. ISTAT. “Noi Italia”. 2013. Available online: http://www.istat.it/en/files/2013/03/Noi-Italia-2013.pdf (accessed on 14 July 2015). (In Italian)
  20. ISTAT. “Le Problematiche Connesse al Consumo del Suolo”. 2012. Available online: http://www.istat.it/it/archivio/51331 (accessed on 14 July 2015). (In Italian)
  21. Chaudhuri, G.; Clarke, K.C. The SLEUTH Land Use Change Model: A Review. Int. J. Environ. Resour. Res. 2013, 1, 88–105. [Google Scholar]
  22. Clarke, K.C.; Gaydos, L.J. Loose-coupling a cellular automaton model and GIS: Long-term urban growth prediction for San Francisco and Washington/Baltimore. Int. J. Geogr. Inf. Sci. 1998, 12, 699–714. [Google Scholar] [CrossRef] [PubMed]
  23. Jantz, C.A.; Goetz, S.J.; Shelley, M.K. Using the SLEUTH urban growth model to simulate the impacts of future policy scenarios on urban land use in the Baltimore—Washington metropolitan area. Environ. Plan. B 2003, 31, 251–271. [Google Scholar] [CrossRef]
  24. Caglioni, M.; Pelizzoni, M.; Rabino, G.A. Urban Sprawl: A case study for project gigalopolis using SLEUTH model, Lecture Notes in Computer Science. In Proceedings of the 7th International Conference on Cellular Automata for Research and Industry, Perpignan, France, 20–23 September 2006; Volume 4173.
  25. Martellozzo, F. Forecasting high correlation transition of agricultural landscapes into urban areas. Diachronic case study in north-eastern Italy. IJAEIS Anal. Model. Vis. Spat. Environ. Data 2012, 3, 22–34. [Google Scholar]
  26. Cogan, C.B.; Davis, F.W.; Clarke, K.C. Application of Urban Growth Models and Wildlife Habitat Models to Assess Biodiversity Losses; United States Geogolical Survey: Reston, VA, USA, 2001.
  27. Amato, F.; Pontrandolfi, P.; Murgante, B. Using Spatiotemporal Analysis in Urban Sprawl Assessment and Prediction. Comput. Sci. 2014, 8580, 758–773. [Google Scholar]
  28. Amato, F.; Martellozzo, F.; Murgante, B.; Nolè, G. A Quantitative Prediction of Soil Consumption in Southern Italy. Chapter: Computational Science and Its Applications—ICCSA. Comput. Sci. 2015, 9157, 798–812. [Google Scholar]
  29. Clarke, K.C.; Hoppens, S.; Gaydos, L. A self-modifying cellular automaton model of historical urbanization in the San Francisco Bay area. Environ. Plan. B Plan. Des. 1997, 24, 247–261. [Google Scholar] [CrossRef]
  30. Project Gigalopolis; SLEUTH. Available online: http://www.ncgia.ucsb.edu/projects/gig/Dnload/download.htm (assessed on 1 January 2015).
  31. Dietzel, C.; Clarke, K.C. Toward Optimal Calibration of the SLEUTH Land Use Change Model. Trans. GIS 2007, 11, 29–45. [Google Scholar] [CrossRef]
  32. Martellozzo, F.; Clarke, K.C. Urban Sprawl and the Quantification of Spatial Dispersion. In Geographic Information Analysis for Sustainable Development and Economic Planning; Borruso, G., Bertazzon, S., Favretto, A., Murgante, B., Torre, C.M., Eds.; IGI Global: Hershey, PA, USA, 2013; pp. 129–142. [Google Scholar]
  33. Silva, E.A.; Clarke, K.C. Calibration of the SLEUTH Urban Growth Model for Lisbon and Porto, Portugal. Comput. Environ. Urban Syst. 2002, 26, 525–552. [Google Scholar] [CrossRef]
  34. Project Gigalopolis. Available online: http://www.ncgia.ucsb.edu/projects/gig/About/about.html (assessed on 1 January 2015).
  35. KantaKumar, L.; Sawant, N.; Kumar, S. Forecasting urban growth based on GIS, RS and SLEUTH model in Pune metropolitan area. Int. J. Geomat. Geosci. 2011, 2, 568–579. [Google Scholar]
  36. Bihamta, N.; Soffianian, A.; Fakheran, S.; Gholamalifard, M. Using the SLEUTH Urban Growth Model to Simulate Future Urban Expansion of the Isfahan Metropolitan Area, Iran. J. Indian Soc. Remote Sens. 2014. [Google Scholar] [CrossRef]
  37. Dietzel, C.; Clarke, K.C. Spatial Differences in Multi-Resolution Urban Automata Modeling. Trans. GIS 2004, 8, 497–492. [Google Scholar] [CrossRef]
  38. Martellozzo, F.; Clarke, K.C. Measuring urban sprawl, coalescence, and dispersal: A case study of Pordenone, Italy. Environ. Plan. B 2011, 38, 1085–1104. [Google Scholar] [CrossRef]
  39. Balena, P.; Sannicandro, V.; Torre, C.M. A Multicriteria Approach for the Assessment of Soil Consumption. Comput. Sci. 2014, 8581, 446–458. [Google Scholar]
  40. Italian National Cartographic Geoportal. Available online: http://www.pcn.minambiente.it (assessed on 1 January 2015).
  41. Basilicata Region, Regional Spatial Data Infrastructure. Available online: http://rsdi.regione.basilicata.it (assessed on 1 January 2015).
  42. Development and Economic Cohesion Department, OpenCoesione data. Available online: http://www.opencoesione.gov.it (assessed on 1 January 2015).
  43. Silverman, B.W. Density Estimation for Statistics and Data Analysis. Monographs on Statistics and Applied Probability; Chapman and Hall: London, UK, 1986. [Google Scholar]
  44. Bailey, T.C.; Gatrell, A.C. Interactive Spatial Data Analysis. In Longman Higher Education, Harlow; Pearson Education: Upper Saddle River, NJ, USA, 1995. [Google Scholar]
  45. Borruso, G. Network Density Estimation: Analysis of Point Patterns Over a Network. In ICCSA 2005. LNCS; Gervasi, O., Gavrilova, M.L., Kumar, V., Laganá, A., Lee, H.P., Mun, Y., Taniar, D., Tan, C.J.K., Eds.; Springer: Heidelberg, Germany, 2005; Volume 3482, pp. 126–132. [Google Scholar]
  46. Diggle, P.J. A Kernel Method for Smoothing Point Process Data. Applied Statistics. J. R. Stat. Soc. Ser. C 1985, 153, 349–362. [Google Scholar] [CrossRef]
  47. Balena, P.; Sannicandro, V.; Torre, C.M. Spatial Analysis of Soil Consumption as Support to Transfer Development Rights Mechanisms. Comput. Sci. 2013, 7974, 587–599. [Google Scholar]
  48. Amato, F.; Pontrandolfi, P.; Murgante, B. Modelli di analisi e Previsione Spazio-Temporali per la Valutazione del consumo di suolo ed Implicazioni nelle Politiche Urbanistiche”, Urbanistica Informazioni, Anno XXXXI, Settembre–Ottobre 2014, Sessione 7. INU Edizioni 2014, 257, 6–10. (In Italian) [Google Scholar]
  49. Nolè, G.; Murgante, B.; Calamita, G.; Lanorte, A.; Lasaponara, R. Evaluation of Urban Sprawl from space using open source technologies. Ecol. Inf. 2014. [Google Scholar] [CrossRef]
  50. ENI. ENI in Basilicata, Local Report; ENI: Rome, Italy, 2012. [Google Scholar]
  51. Danese, M.; Lazzari, M.; Murgante, B. Kernel Denisty Estimation for a Geostatistical Approach in Seismic Risk Analysis: The Case Study of Potenza Hilltop Town (Southern Italy). Comput. Sci. 2008, 5072, 415–429. [Google Scholar]
  52. Karlen, D.L.; Rice, C.W. Soil Degradation: will Humankind Ever Learn? Sustainability 2015, 7, 12490–12501. [Google Scholar] [CrossRef]
  53. Amato, F.; Martellozzo, F.; Nolè, G.; Murgante, B. Preserving cultural heritage by supporting landscape planning with quantitative predictions of soil consumption. J. Cult. Herit. 2016, in press. [Google Scholar]
Figure 1. The image shows the position of the Basilicata Region in Italy; on top-right the Agri Valley is shown in dark grey, while the red perimeter shows the studied Municipalities.
Sustainability 08 00297 g001
Figure 2. The Study Area with its main mobility infrastructures.
Sustainability 08 00297 g002
Figure 3. Resident population in Valley of Agri, Provinces of Potenza and Matera and Basilicata Region.
Sustainability 08 00297 g003
Figure 4. Resident population in Study Area Municipalities.
Sustainability 08 00297 g004
Figure 5. Resident population and built-up areas in the Study Area.
Sustainability 08 00297 g005
Figure 6. Settlement evolution in the Valley of Agri.
Sustainability 08 00297 g006
Figure 7. Total buildings, occupied buildings and unoccupied buildings in the Municipalities of the Agri Valley.
Sustainability 08 00297 g007
Figure 8. Landscape constraint due to the Italian National Law 2004/42 in the Valley of Agri.
Sustainability 08 00297 g008
Figure 9. Simulation of the settlement evolution in the Valley of Agri up to 2050.
Sustainability 08 00297 g009
Figure 10. Landuse classes comparison between 2013 and 2050.
Sustainability 08 00297 g010
Figure 11. Maps of the: Index of artificialization in 2012 (upper left), Index of artificialization in 2012 (upper right), Rate of artificialization between 2012–2050 (lower left), growth rate of population between 1991 and 2012. Black is equal to max. value, light grey to min. value.
Sustainability 08 00297 g011
Figure 12. Geolocation of actions financed by Operational Programs and Kernel Density Estimation considering as intensity the economic value of funding.
Sustainability 08 00297 g012
Figure 13. Geolocation of actions financed by Operational Programs and state of urban planning tools within the studied Municipalities.
Sustainability 08 00297 g013
Figure 14. The Landscape plan of “Sellata-Vulturino” covers only the the northern part of the study area and only 19% of Basilicata Region is covered by Landscape plan (top left corner).
Sustainability 08 00297 g014
Table 1. Sources of the data used to derive built-up areas maps for the Valley of Agri.
DateSource
1956WMS GIS services from the National Geoportal [40]
1988WMS GIS services from the National Geoportal [40]
1995Regional Vector Cartography WMS GIS service from Regional Geoportal [41]
2012WMS GIS services from the National Geoportal and (partially) 2012 ortophoto [40]
Table 2. Calibration coefficients evolution from coarse to final and corresponding and statistics describing the goodness of fit of each set.
CoarseFineFinal
Diffusion201717
Breed 146
Spread11513
Slope1009092
Road Gravity906554
Compare0.9460.9870.989
r2 population0.9850.9920.996
Edge r20.9760.9870.992
R2 cluster0.9860.9900.987
Lee Sale0.4840.4730.508
Average slope r20.9890.9920.995
% Urban0.9850.9920.996
X_r20.9180.9150.947
Y_r20.9370.9420.975
Radius0.9880.9940.998
Table 3. Forecast of artificial areas expansion for the municipalities most interested by oil and mining industry.
Artificial Land 2012 (ha)Artificial Land 2050 (ha)
Marsico Nuovo301341
Marsicovetere224240
Viggiano287315
Table 4. Increase of artificial areas by municipality.
Population Growth Rate (1991–2012)Artificial Land 2012 (ha)Artificial Land 2020 (ha)Artificial Land 2030 (ha)Artificial Land 2040 (ha)Artificial Land 2050 (ha)
Abriola−0.1317580818385
Armento−0.1513841434447
Calvello−0.11793100102103105
Corleto Perticara−0.136112121123126129
Grumento Nova−0.073186200207214225
Guardia Perticara−0.2343942444853
Laurenzana−0.1368893949596
Marsico Nuovo−0.151301315321330341
Marsicovetere−0.135224230232235240
Moliterno−0.089161167168168169
Montemurro−0.1565458596061
San Chirico Raparo−0.1423636.53737.538
San Martino d’Agri−0.10939404141,542
Sarconi−0.1488689919394
Spinoso0.0088993939393
Tramutola−0.125143149152156159
Viggiano−0.029287299304309315
Paterno−0.026186196204214228

