Article

Spatiotemporal Changes in Rural Settlement Land and Rural Population in the Middle Basin of the Heihe River, China

1
College of Earth Environmental Science, Lanzhou University, Lanzhou 730000, China
2
College of Civil Engineering and Architecture, Southwest University of Science and Technology, Mianyang 621010, China
*
Author to whom correspondence should be addressed.
Sustainability 2016, 8(7), 614; https://doi.org/10.3390/su8070614
Submission received: 18 March 2016 / Revised: 22 June 2016 / Accepted: 28 June 2016 / Published: 29 June 2016

Abstract

:
Understanding the relationship between the spatiotemporal expansion of rural settlement land and the variation of rural population is the foundation of rational and specific planning for sustainable development. Based on the integration of Landsat TM, ETM+, and OLI images and demographic data, using mathematical models, landscape indexes, and a decoupling model, the spatiotemporal changes of the rural settlement land area and its decoupling relationship with the rural registered population were analyzed for the middle basin of the Heihe River in China. During the period 1986–2014, the following changes occurred: (1) The study area experienced increases of 124.94%, 55.16%, and 1.56% in rural settlement land area, number of patches, and rural registered population, respectively; (2) Edge-expansion, dispersion, and urban encroachment were the dominant patterns of dynamic changes in the studied rural settlement land. Among these, edge-expansion was the most prevalent development pattern; it contributed more than half of the total increase in the number of patches and the total area growth; (3) The annual growth rate of the rural registered population increased from 0.7% in 1986–2002 to −0.5% in 2002–2014. By that time the rural settlement land area had undergone a gentle increase from 3.4% to 3.6%. Generally, the rural registered population and rural settlement land has experienced a shift from weakly decoupled in 1986–2009 to strongly decoupled in 2009–2014; (4) From 1986 to 2014, rural urbanization and modernization were the main causes that led to the decline in the rural registered population; however, economic growth promoted the expansion of rural settlement land during this same period. We believe that with the rapid development of urbanization, the decoupling relationship between the rural settlement land area and the reduction in the rural registered population cannot be completely reversed in the short term. It is recommended that the government should enhance the role of planning rural settlement land during the process of urbanization.

1. Introduction

The policies enacted with the Chinese Economic Reform have led to rapid urbanization. The accompanying socioeconomic transformation has resulted in a concomitant decrease in the rural registered population (RRP) since 1996 [1,2]. Despite this decrease, as the main type of area in which the rural population to lives and works, rural settlement land (RSL) has undergone continual expansion. According to the National New Urbanization plan (2014–2020) of the State Council of China, during 2000–2011, the RSL area increased by 20,300 km², while the rural registered population (RRP) simultaneously decreased by 1.33 billion [3]. No coordinated development pattern for the co-evaluation of population and settlement land in rural areas has appeared, which directly impacts the extensiveness of rural land utilization [4]. As reported by the Xinhua news agency, there were nearly 100 million acres (66,700 km2) of uninhabited RSL (more than 1/18 of the country’s cropland) in China’s rural areas in 2014 [5]. Thus, the problem of detecting and understanding spatiotemporal changes in RSL as well as the relationship between the RSL area and the RRP has attracted scientific attention in recent years [1,6].
In this context, the term “rural settlement land” refers to villages, in other words, dwellings and associated facilities, which usually include homesteads, room for livestock (e.g., pigsties, sheepfolds, stables, and cowsheds), warehouses, farm machinery storage sheds, land for other infrastructure, and land for public facilities as well as surrounding land, such as village roads and squares in rural areas [1,4,7,8]. In China, RSL is the second most prevalent type of land use in rural areas after cropland [9,10]. However, considering China’s enormous rural population and the scarcity of cropland per capita, any rural land that is used for settlements is likely to come at the expense of cropland. Therefore, RSL is recognized as a key threat to the region’s food security [11,12,13]. In addition, with rapid urbanization and industrialization, many rural labourers have left the rural areas, attracted to jobs in the cities either temporarily or seasonally. However, their permanent homes usually remain in rural areas. Moreover, as their incomes rise, farmers have been actively building new houses and greatly expanding RSL areas. The migration of the rural population to the cities has left many dwellings in the inner village areas seasonally or permanently unoccupied. This process has been the cause of several peculiar and unique changes in the relationship between the RSL and the RRP, and it also strongly affects rural sustainable development [2,14]. In this context, an ability to quantitatively describe the relationship between the RSL and the RRP is essential for understanding their changing relationship.
A particularly useful way to examine this relationship is by viewing it within the framework of decoupling [15]. In the context of the variation relationship between the RRP and the RSL area, coupling is defined as synchronous change, whereas decoupling is defined as desynchronous change. For example, in the early phases of urbanization, the growth of the rural population led to the expansion of rural settlements; consequently, the RRP and the RSL area exhibited a coupling relationship. However, as urbanization has continued, the rural population has grown only sluggishly or has fallen. At the same time, the RSL area has continued to expand, causing the relationship between the RRP and the RSL area to become decoupled.
The study of the changes in RSL has a long history that has focused predominantly on the size, pattern, and spatial distribution [6,12,16,17] of rural land consolidation [18,19,20] as well as sustainable management [21,22]. Recent studies have highlighted the driving forces behind rural settlement dynamics and have found that the distances to cities, roads, and water bodies as well as various terrain features have led to changes in the spatiotemporal distribution of RSL [2,21,22,23,24,25,26,27,28]. However, little attention has been paid to the relationship between the spatiotemporal variations of RSL and RRP over an extended time scale. In fact, for a long time, it was generally believed that RSL expansion was caused by rural population growth. In addition, although some research has been conducted on the coupling relationship between RSL and the RRP [17], analysis of the driving factors has been performed primarily at the national scale rather than at the watershed scale, especially in rural areas with oases.
In China, although oases occupy only 4%–5% of the total area of arid China, more than 90% of the population and 95% of the social wealth in these areas are concentrated within the oases [29,30]. To investigate the dynamic evolution pattern of the RSL area and its decoupling relationship with the RRP in areas with oases, this article considers an oasis in the middle basin of the Heihe River as a study area and reports the use of Landsat TM, ETM+, and OLI images and socioeconomic and demographic data from the years 1986, 1996, 2002, 2009, and 2014 to analyse the process of the changing landscape of RSL. A decoupling model was used to analyse the relationship between the RSL area and the RRP and the driving factors of change from 1986 to 2104. Specifically, our objectives were to (i) detect and explore trends in the patterns of spatial change RSL using quantitative models and landscape indexes; (ii) reveal the decoupling relationship between RSL and the RRP; and (iii) discuss which factors drive the changes in the RSL area and the RRP.

2. Study Area and Data Sources
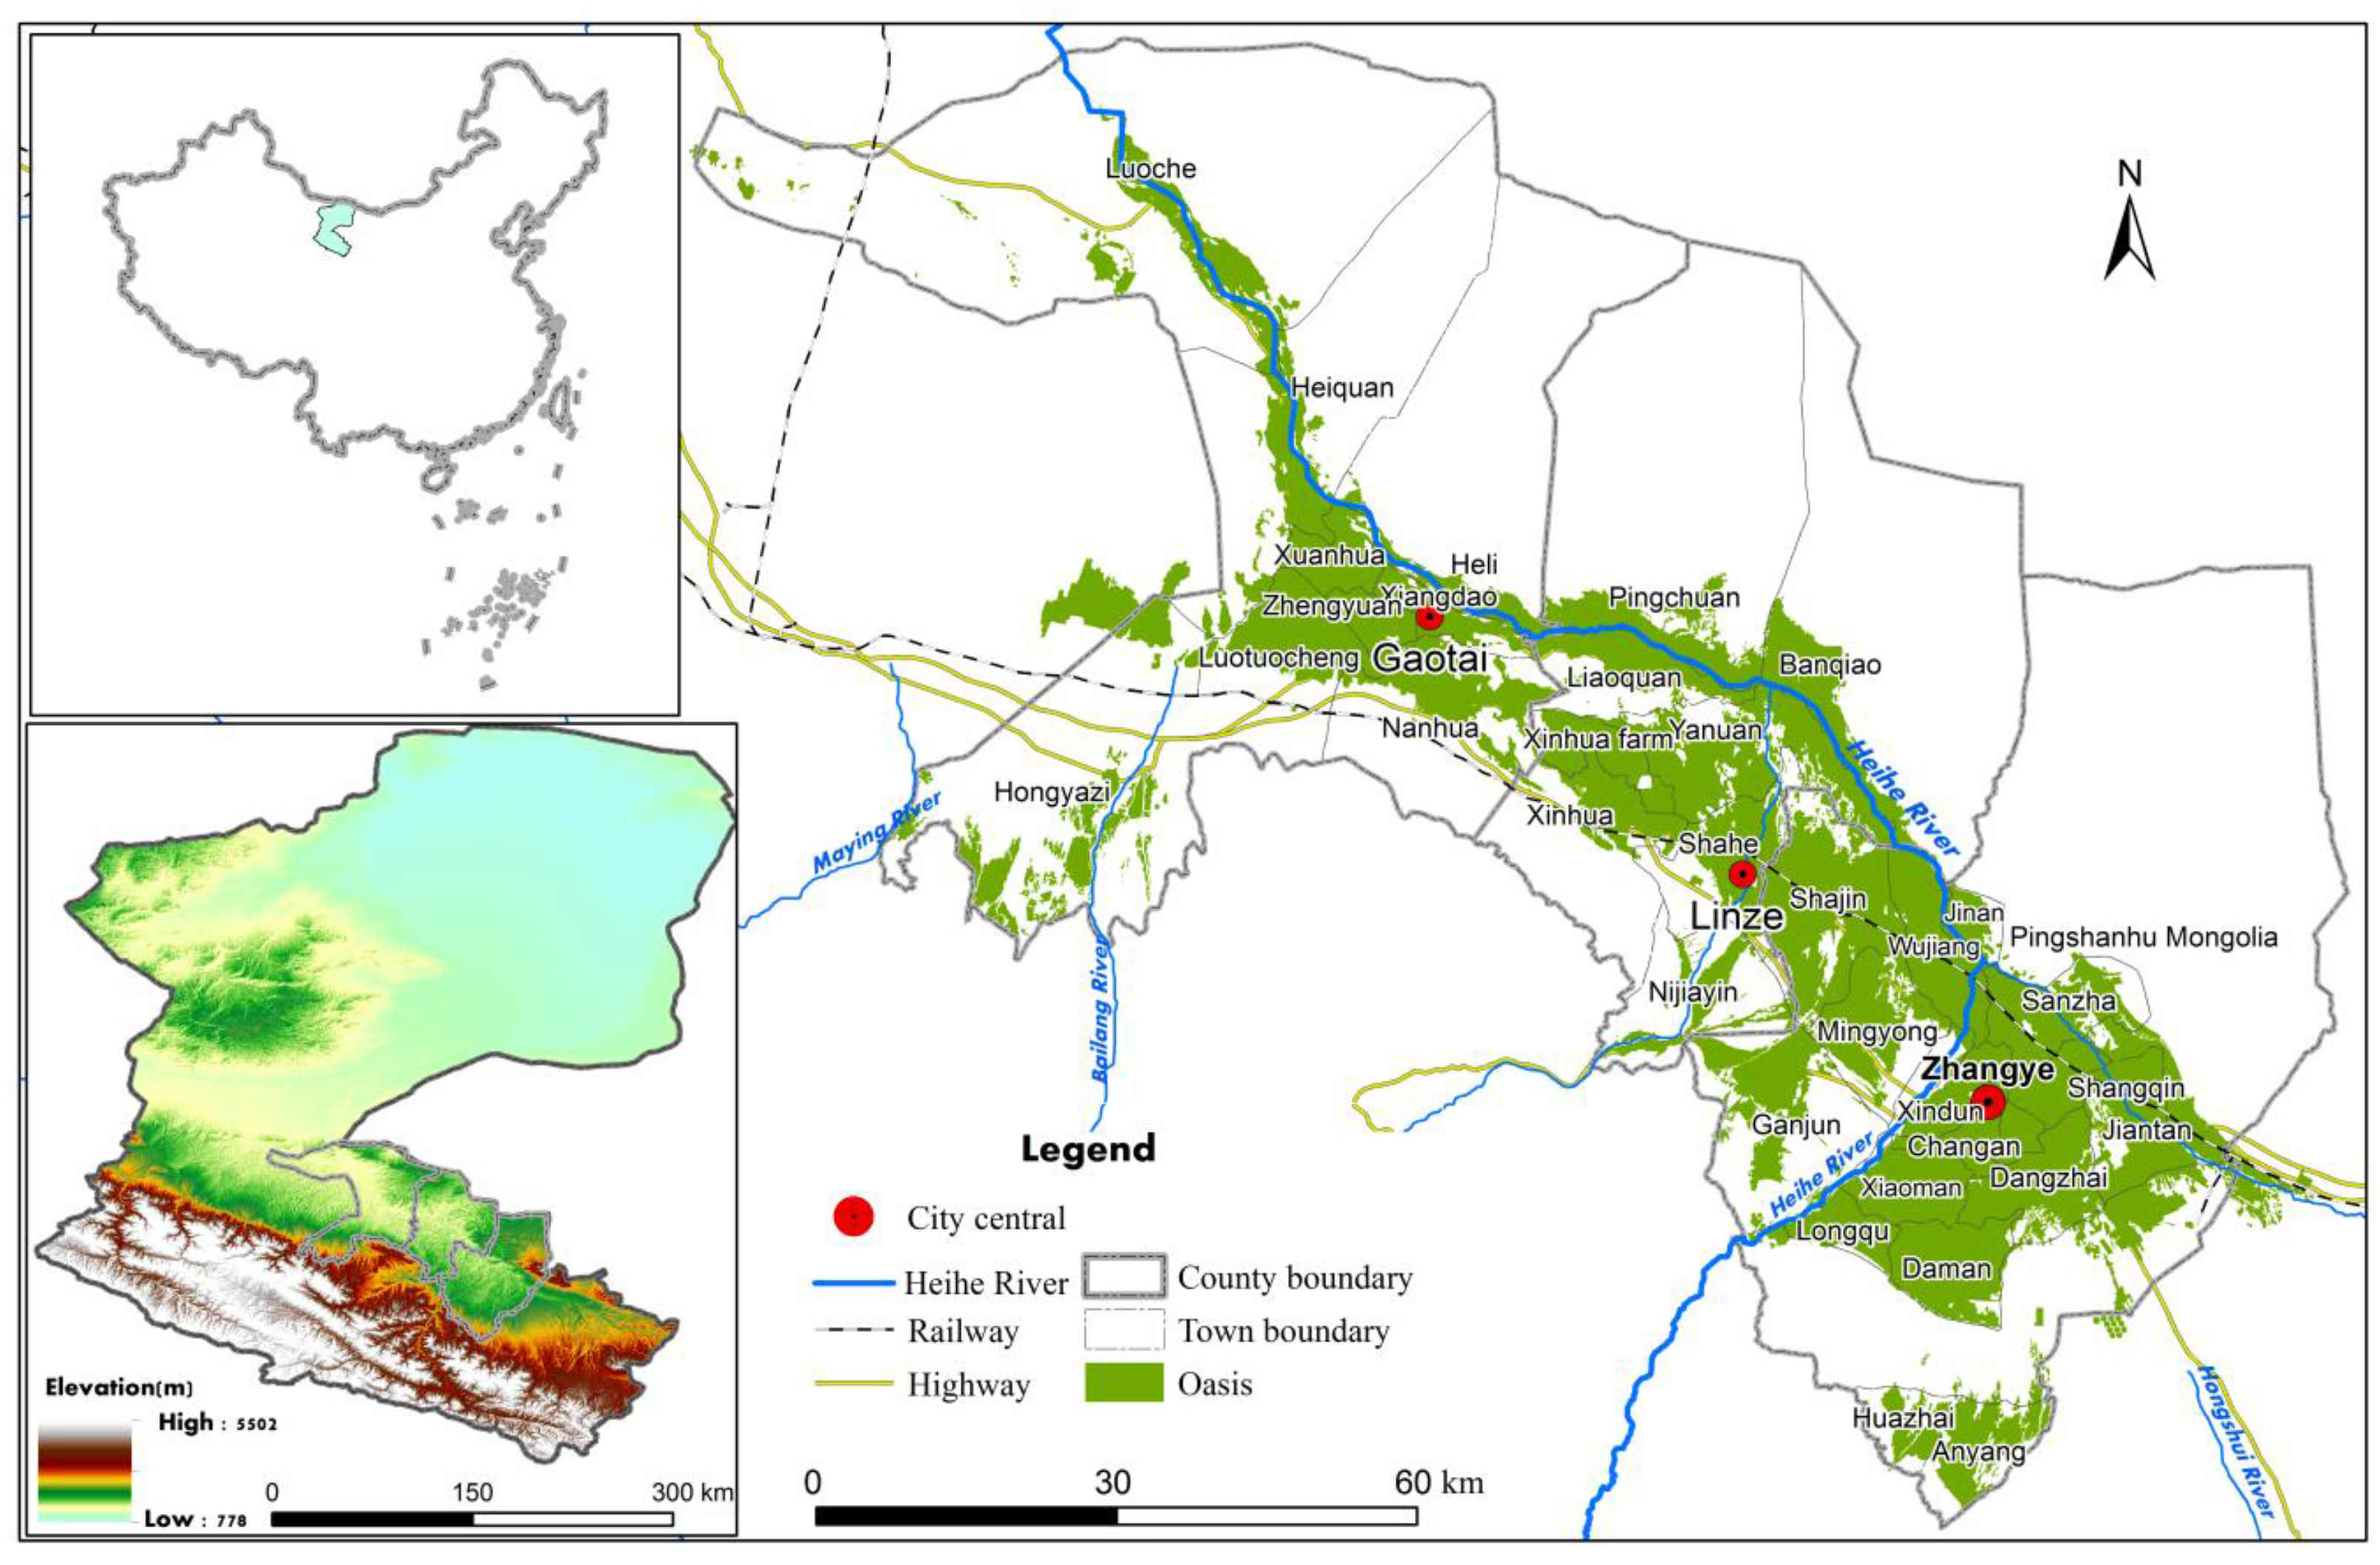
2.1. Study Area

The study area is located in the middle basin of the Heihe River, Gansu Province, which lies in the arid climate zone of Northwest China, between 98°57′–100°52′E and 38°32′–39°42′N. The study area encompasses Ganzhou, Linze, and Gaotai and has a total area of 10,500 km2 (Figure 1). The mean annual precipitation in the area is 62–156 mm, and the annual evaporation is 1000–2000 mm. The Heihe River is the only surface runoff. From south to north, the topographic features successively consist of the piedmont alluvial fan, the corridor plain, and the Gobi desert. The oases are mainly distributed within the corridor plain. They account for 26.07% of the entire study area and 38% of the oasis area of the entire Heihe River basin. In 2014, RSL accounted for approximately 5.89% of the total oasis area (according to the results of this paper), whereas the 2014 population in the study area was 791,800, corresponding to approximately 42% of the total population of the Heihe River basin. The urban population was 326,200 and the RRP was 465,600, thus accounting for approximately 61.43% of the total population. Farmers’ net income per capita amounted to approximately $1341.00—considerably higher than the average ($776.41) for Gansu Province [20].

2.2. Data Sources

We acquired remote images from the USGS Landsat archive, and Landsat TM, ETM+, and OLI (WRS path 133, row 033, and path 134, row 33) were the primary data sources. These images were acquired from the years of 1986 to 2014 in five time steps (1986, 1996, 2002, 2009, and 2014; see Table 1). The image data were selected from among relatively cloud-free scenes (cloud cover <10%) acquired between June and September. For improved work efficiency and accuracy, we cropped the images at the boundaries of the three studied counties. We also acquired a topographic map at the 1:50,000 scale that was produced in 1989 from the Gansu Province Department of Land and Resources. Other map data used in this study included high-resolution historical maps from 2002, 2009, and 2014 provided by Google Earth. These topographic maps and high-definition images were used to verify and improve the accuracy of the Landsat images. Social and economic statistics from 1986 to 2014 were collected from the Zhangye Bureau of Statistics.

3. Methods

To explore the temporal and spatial distribution characteristics of RSL and its evolutionary relationship with the rural population, we first needed to extracted the RSL date from the remotely sensed data (in Section 3.1), and then, by applying GIS spatial analysis, using a kernel density analysis model to reveal the trends of the RSL distribution in time and space (in Section 3.2), we used landscape indexes to quantitatively describe the changes in area, shape, and proximity of the RSL (in Section 3.3). However, these landscape indexes exhibit considerable spatial heterogeneity; therefore, to clearly describe the differences, we used a buffer analysis method to draw landscape index curves from high-density areas of the RSL distribution to remote mountainous areas (in Section 3.4). Finally, a decoupling model was applied to reveal the relationship between the expansion of RSL and the change in the RRP (in Section 3.5).

3.1. Rural Settlement Land Interpretation Method

We used an object-based classification method based on the ENVI 5.1 software (developed by the visual information solutions exelis company, Boulder, CO, USA) to extract the information of RSL from the Landsat images [27]. Before interpretation, geometric and FLAASH (Fast Line-of-sight Atmospheric Analysis of Spectral Hypercubes) atmospheric correction were applied. The Root Mean Square Error (RMSE) of geometric rectification was less than 0.5 pixels [27,30]. Because this research focused on the spatiotemporal distribution of RSL, after image segmentation, the land use types was divided into six classes: rural settlement, oasis (including cropland, forest, and grassland), urban built-up area, water body, and road/desert [31,32,33,34]. For improved the accuracy, using the topographic map and the high-resolution historical maps obtained from Google Earth as reference data, an artificially interactive interpretation was implemented to revise the results. In addition, based on the RSL definition given above, patches with an area of greater than 2700 m2 that were selected as settlement layers were edited and compiled into vector maps by means of attribute selection from the interpretation results (patches with an area of less than 2700 m2 may consist of 1–2 rural homesteads and some ancillary facilities, but these were considered to have not yet reached the level of rural settlements). Finally, through a random sampling method, a number of random points corresponding to 10% of the total number of patches (approximately 400 patches) were acquired to verify the accuracy of the interpretation against the high-resolution images provided by Google Earth for 2014. The verification indicated an overall accuracy greater than 90%.

3.2. Detection Method for the Spatial Clustering of Rural Settlement Land

We used the Kernel Density Estimation (KDE) method to detect the spatial clustering trends of RSL. KDE models have been used to represent and analyse the spatial trends of landscape features as well as their potential ecological interactions or their influences on the surrounding landscape [35]. Before the spatial clustering analysis, we transformed the polygons into points to act as input data for the KDE model. Then, KDE was used to produce smoothed surfaces by applying a moving window superimposed on a grid. The density of the studied variables was estimated at each window location according to the kernel function shown in Equation (1):
f ( x , y ) = 1 n h d i = 1 n K ( x - y h ) ,
where f(x, y) is the estimated density value at the position (x, y), the units are km2, n is the number of RSL patches, h is a bandwidth or smoothing parameter, K is the kernel function, and d is the distance from x to y.

3.3. Quantitative Methods of Studying Landscape Changes in Rural Settlement Land

A landscape pattern index is both a highly concentrated form of landscape pattern representation and a simple quantitative index that reflects the structure and spatial allocation of a landscape [36]. For this study, we selected seven indexes represent the RSL landscape patterns in terms of area, density, and shape (see Table 2). Then, we used Patch Analysis 5.0 software (Centre for Northern Forest Ecosystem Research, Ontario Ministry of Natural Resources: Thunder Bay, ON, Canada) (downloadable from http://www.cnfer.on.ca/SEP/patchanalyst/Patch5_1_Install.htm), which is an extension of ESRI’s ArcMap 10.2 (ESRI: Redlands, CA, USA) for calculation of the landscape indexes.

3.4. Detection Method for the Spatial Heterogeneity of Rural Settlement Land

To explore the characteristics of the expansion of RSL, we chose the patch density (PD), mean shape index (MSI), and Euclidean nearest-neighbour (MNN) indexes from Table 2. These indexes can represent the basic changes in the RSL landscape characteristics of area, shape, and proximity. Then, we applied ring-based analysis [37] to reveal the characteristics of RSL landscape variations from the city centres outwards. Before performing the ring-based analysis, we chose the centre points of Zhangye, Linze, and Gaotai as the starting points for the analysis and created 2-km buffers in an increasing stepwise manner. Each city was partitioned into a series of 2-km rings extending outward from the center, except for a few townships that were separate from the main RSL.

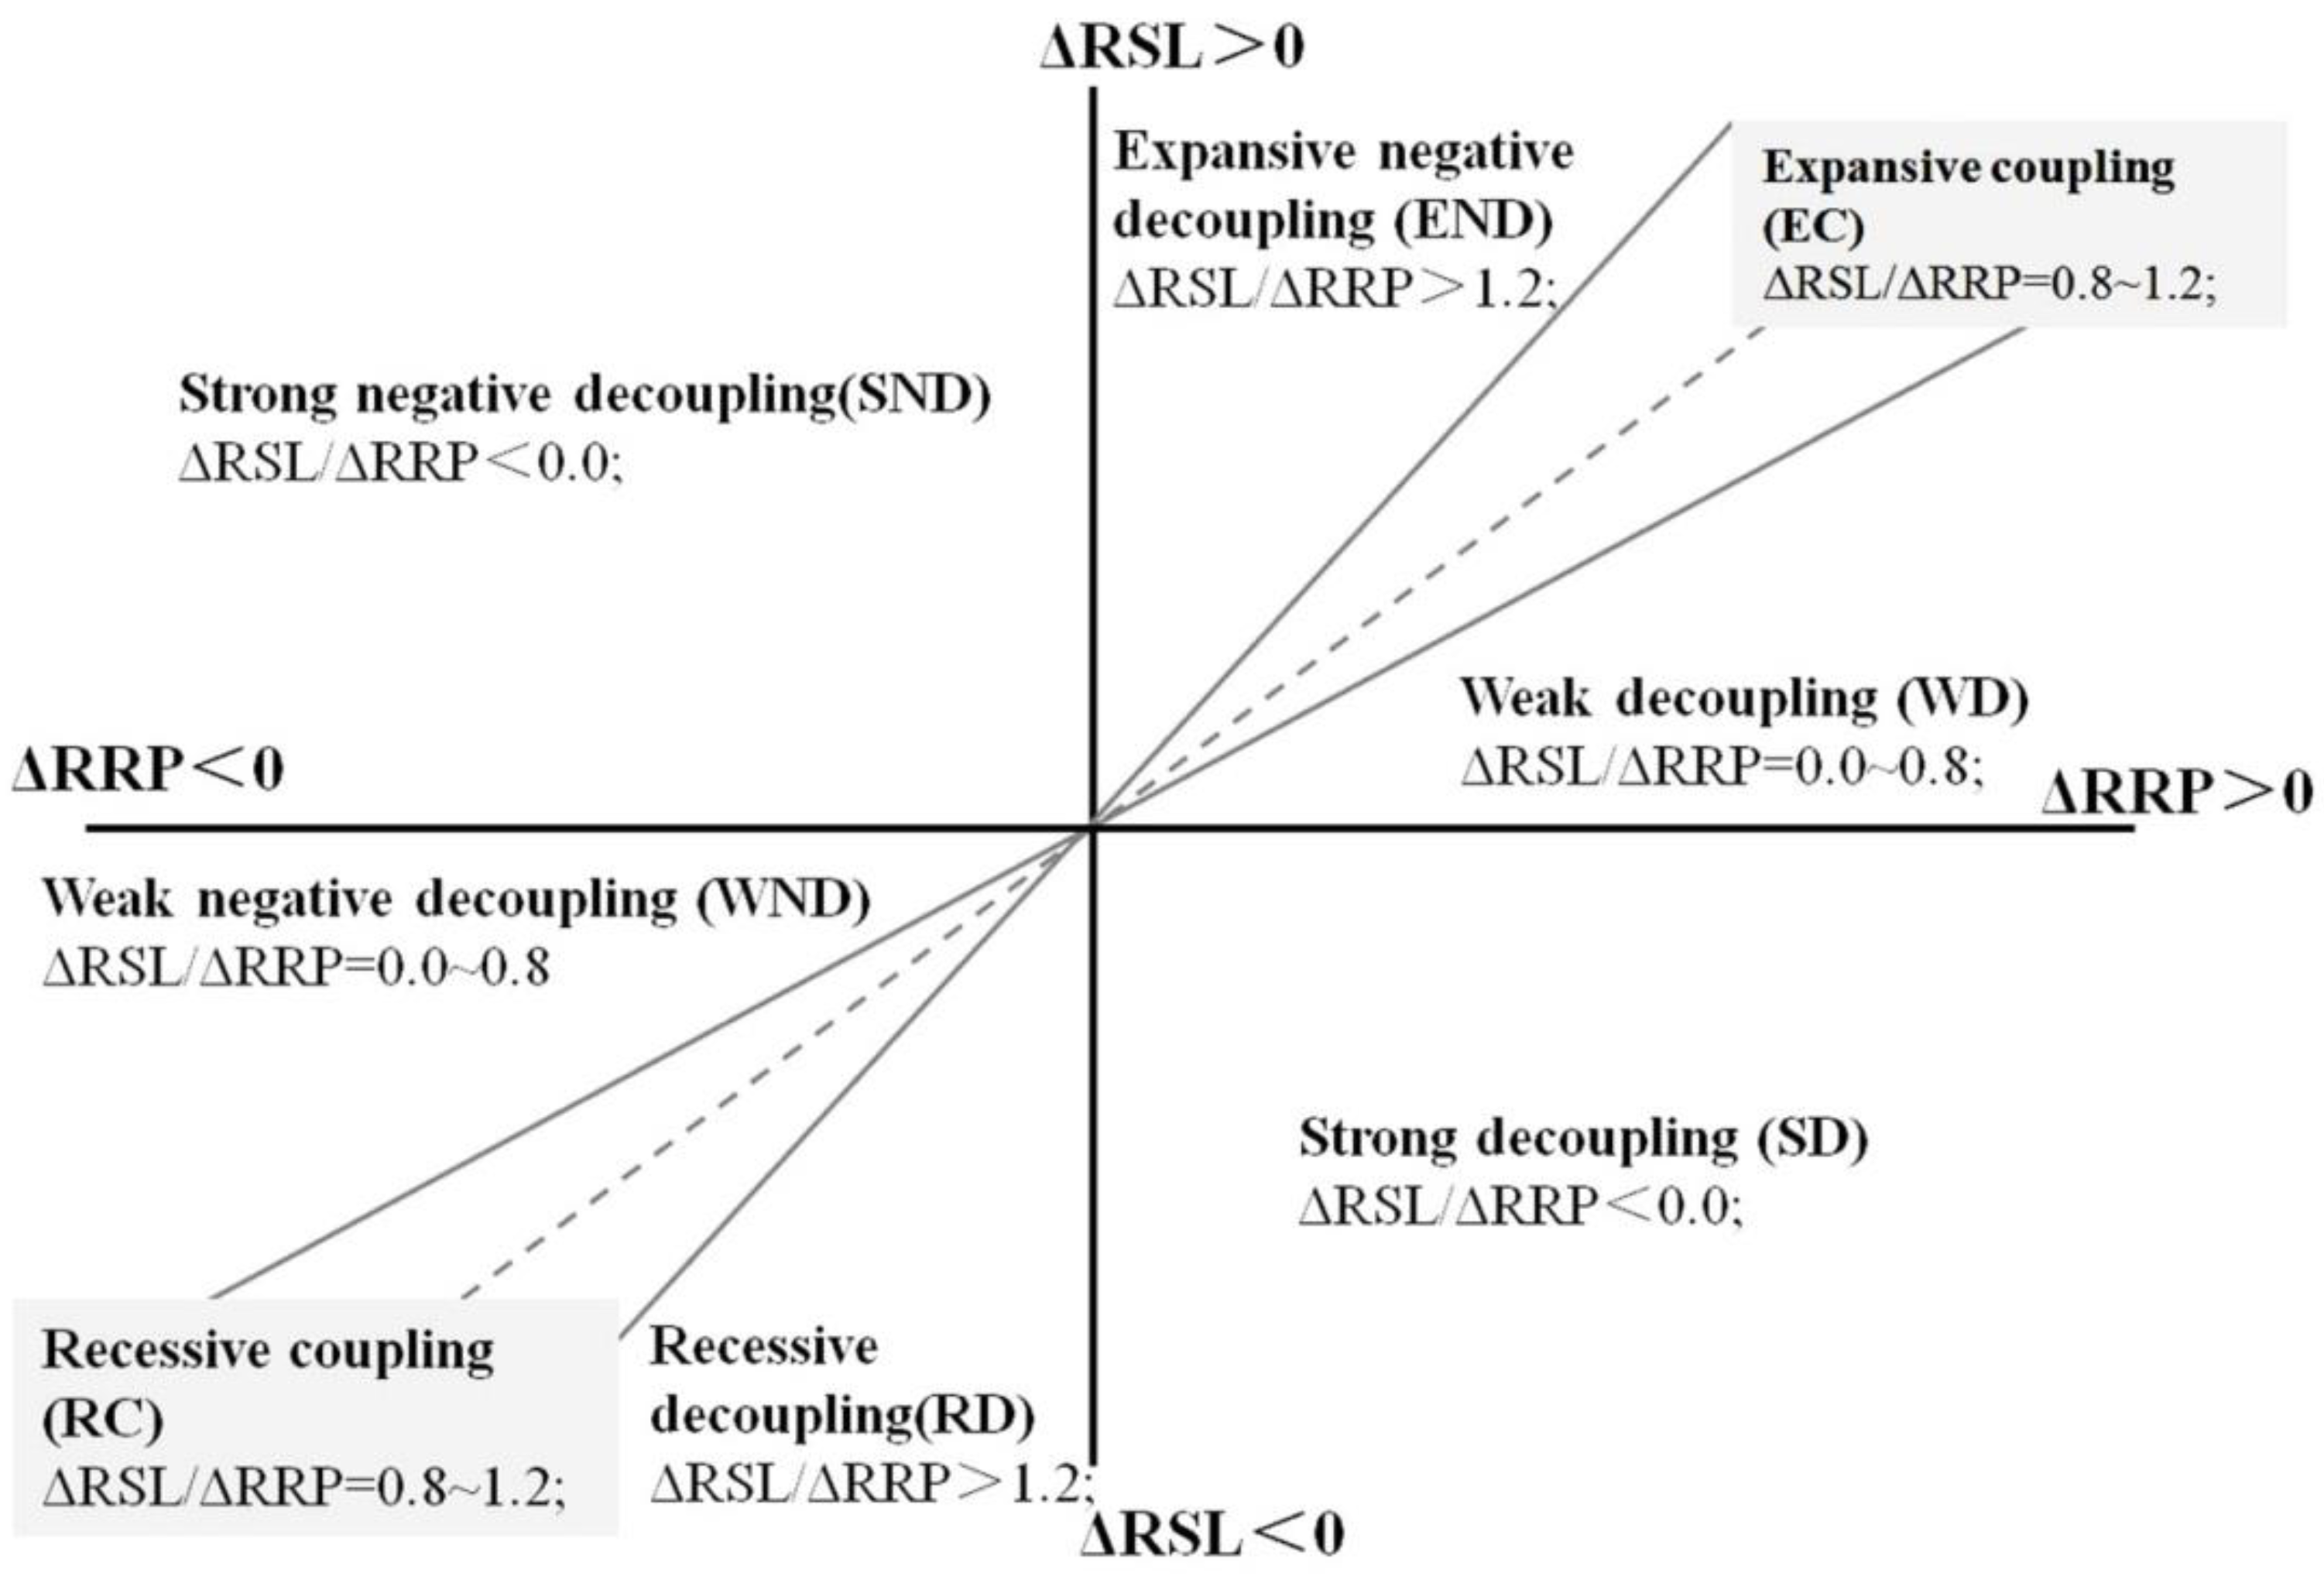
3.5. Methods of Decoupling Analysis of the Relationship between the Rural Settlement Land Area and the Rural Registered Population

To assess the relationship between the RSL and RRP, we used Tapio’s model [1,15], which can be expressed in terms of elasticity values as shown in Equation (2):
β n + 1 = R S L n + 1 - R S L n R S L n R R P n + 1 - R R P n R R P n .
In Equation (2), RSLn+1 and RSLn are the RSL areas in year n + 1 and year n, respectively, and RRPn+1 and RRPn are the RRP numbers for year n + 1 and year n, respectively.
According to Tapio’s model, eight logical possibilities can be distinguished, any of which might potentially describe the decoupling states between the RSL area and the RRP (Figure 2). The growth rate of the RSL area and the change in the RRP can exhibit a coupling, decoupling, or negative decoupling relationship. Decoupling can be further divided into three subcategories. In the first subcategory, weak decoupling, the RSL area and the RRP both increase (and 0 < β < 0.8). The second subcategory, strong decoupling, occurs when the RRP grows while the RSL area decreases (and β < 0). Finally, the third subcategory, recessive decoupling, occurs when the RRP and the RSL area both decrease (and β > 1.2). Similarly, negative decoupling includes three subcategories. In expansive negative decoupling, the RRP and RSLA both increase (and β > 1.2); in strong negative decoupling, the RRP decreases and RSL increases (and β < 0); and in weak negative decoupling, both variables are decreasing (and 0 < β < 0.8). To avoid overinterpreting slight changes as significant, a ±20% variation of the elasticity values near 1.0 is here still regarded as coupling for this study. Thus, coupling is defined as the elasticity values where 0.8 < β < 1.2.

4. Results

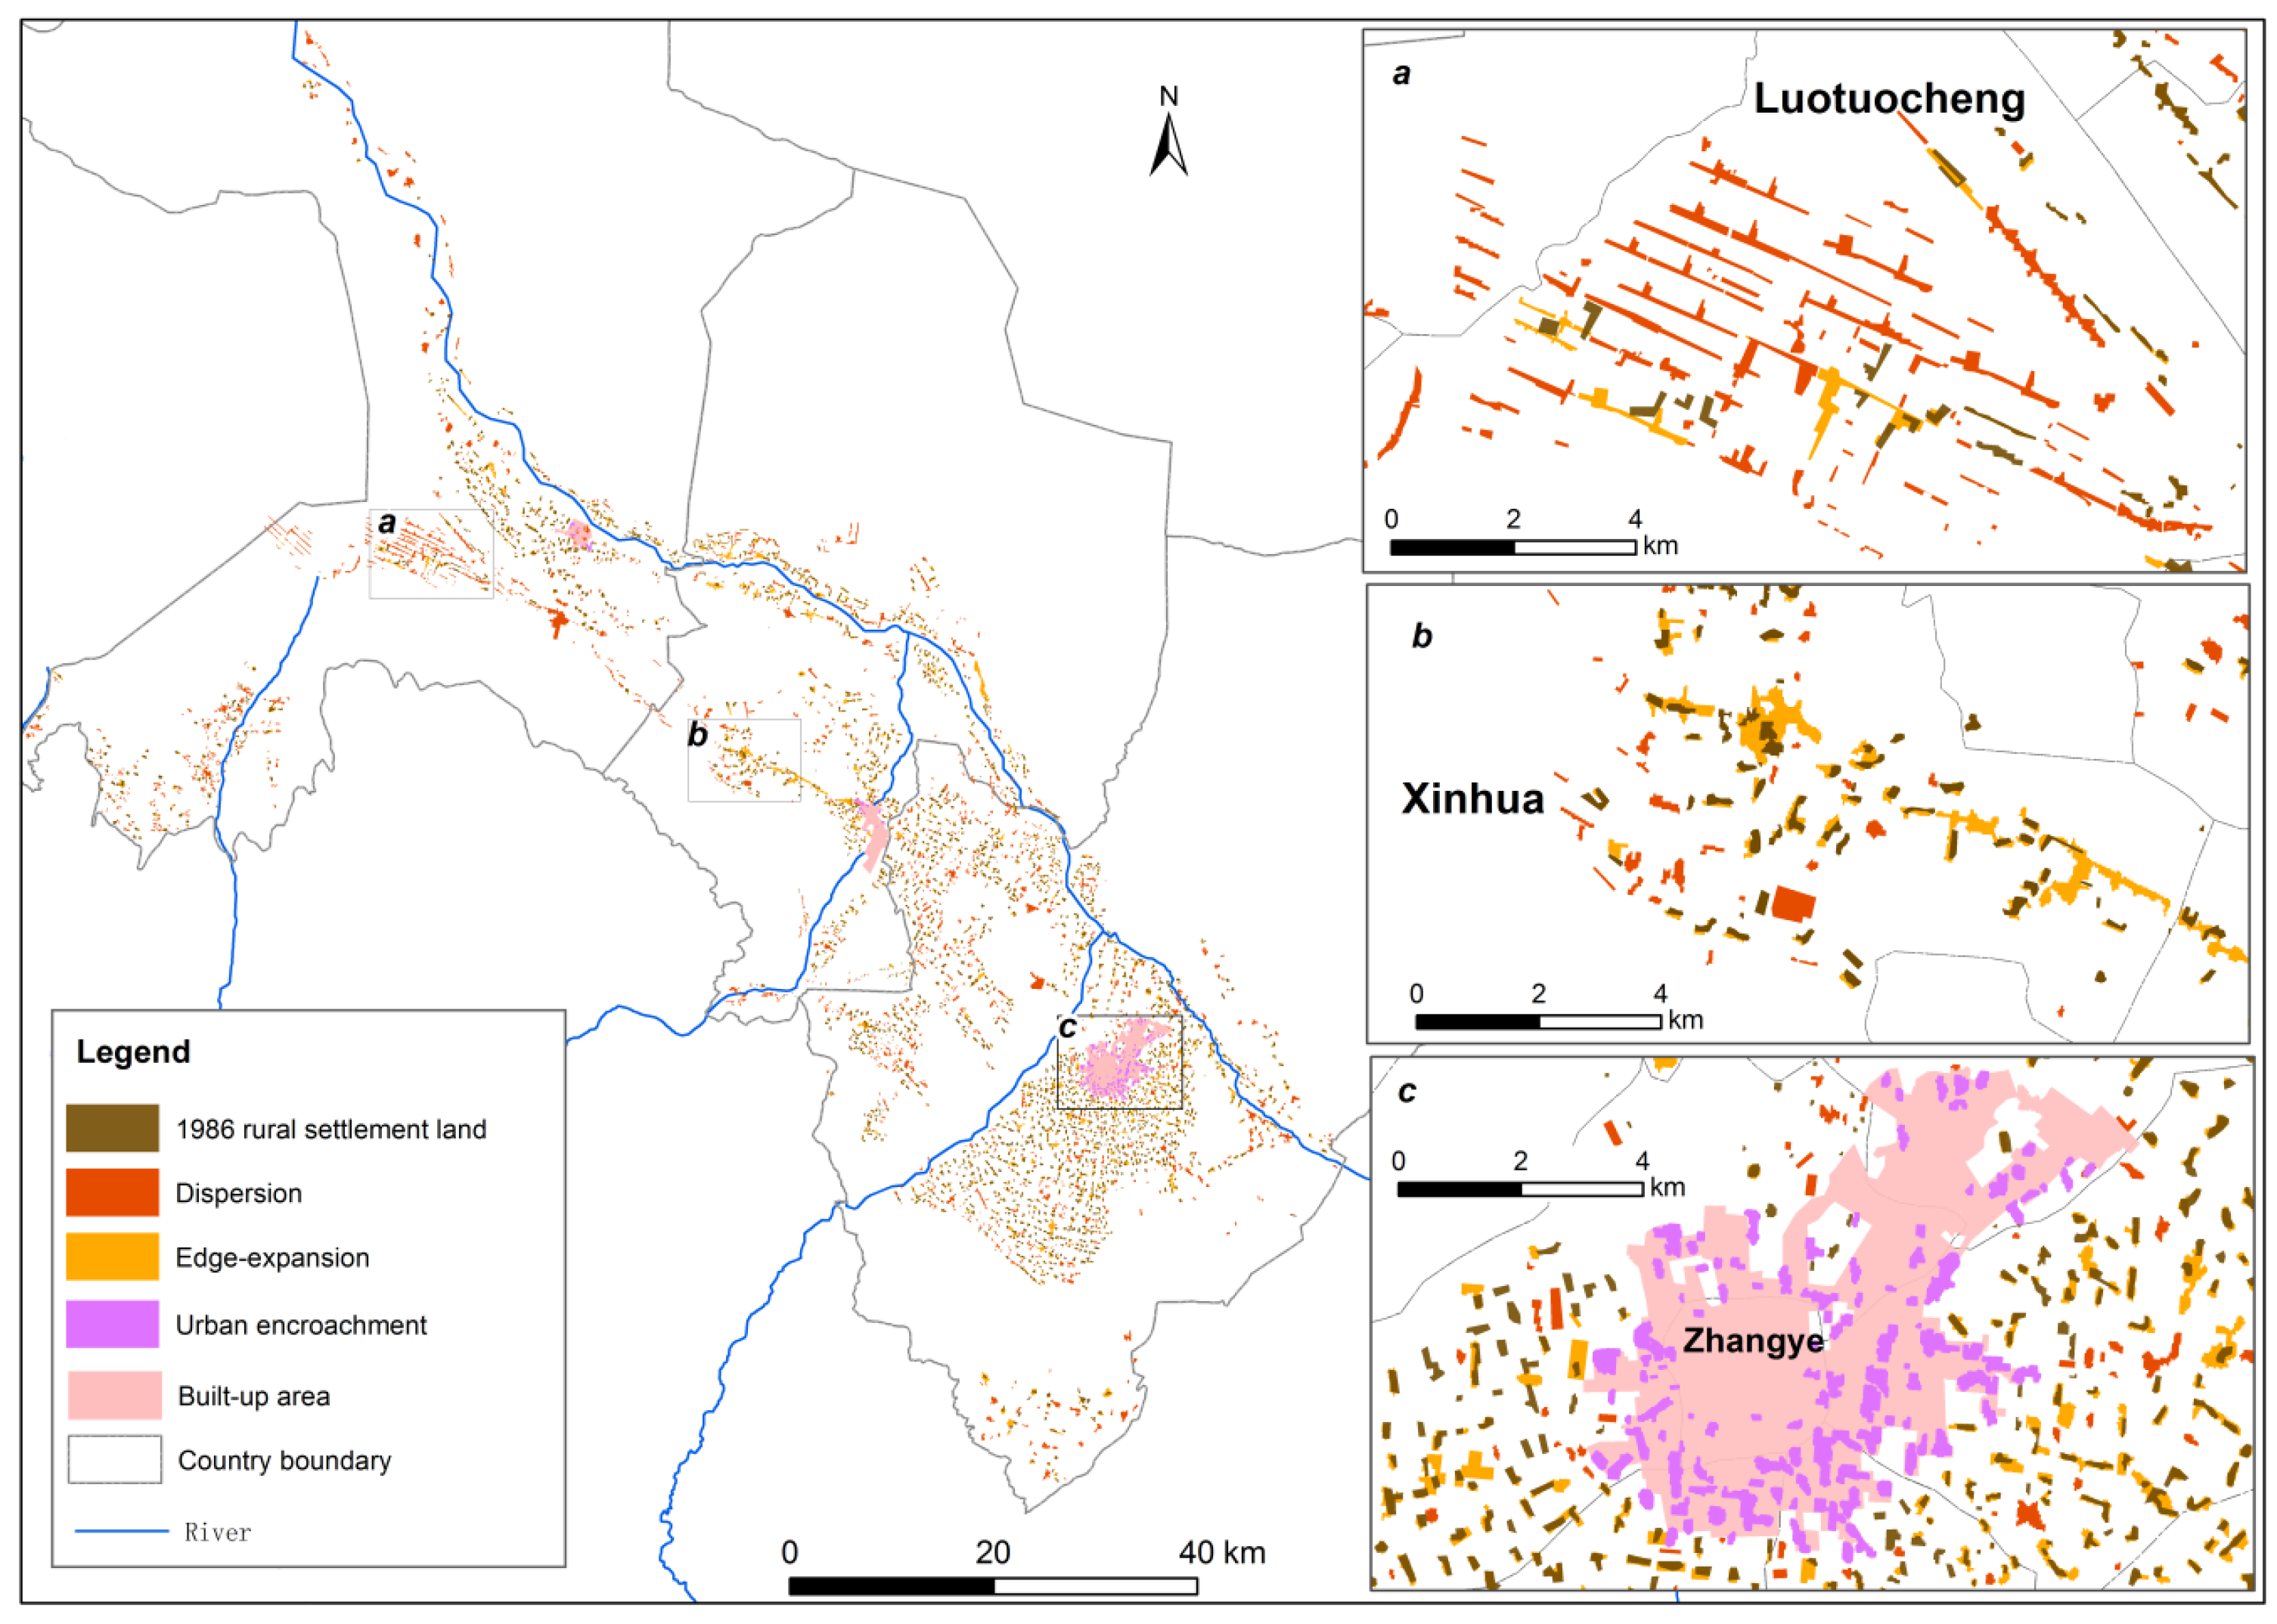
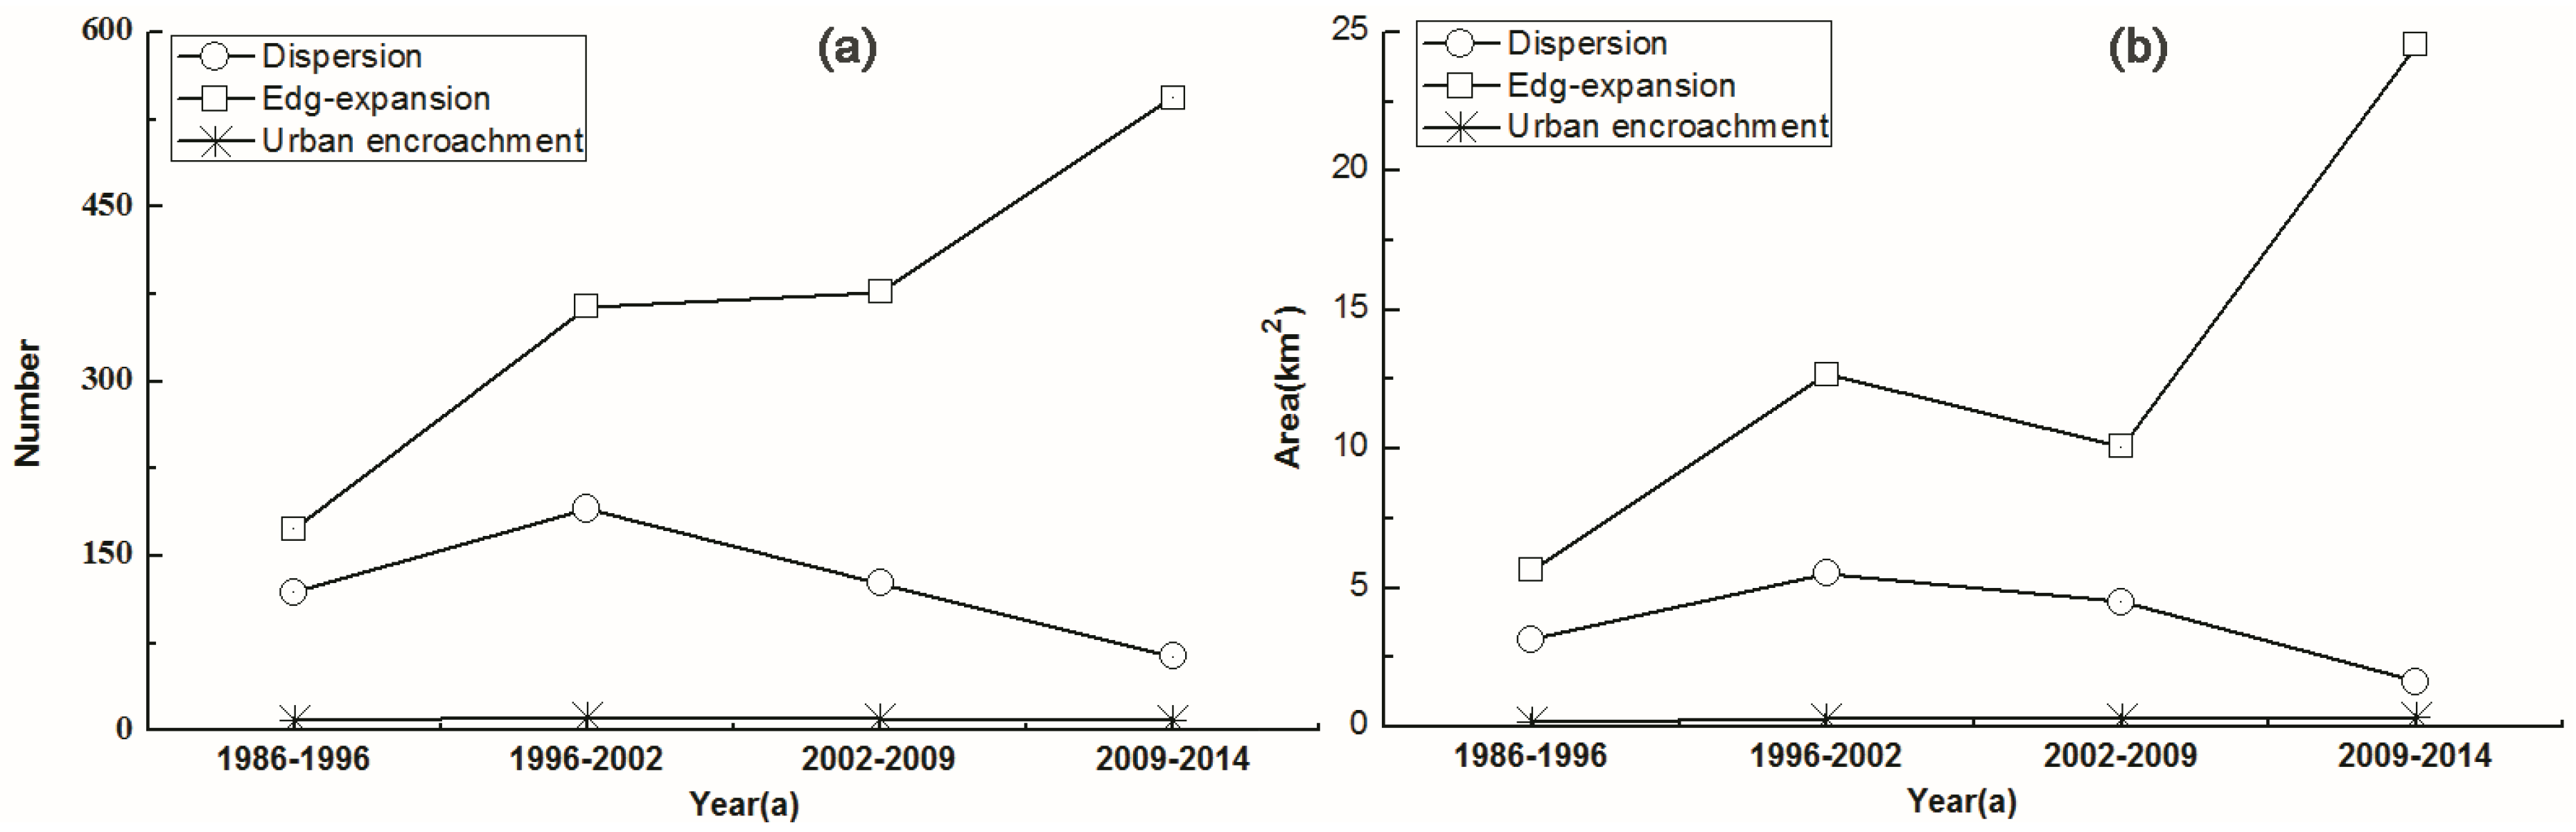
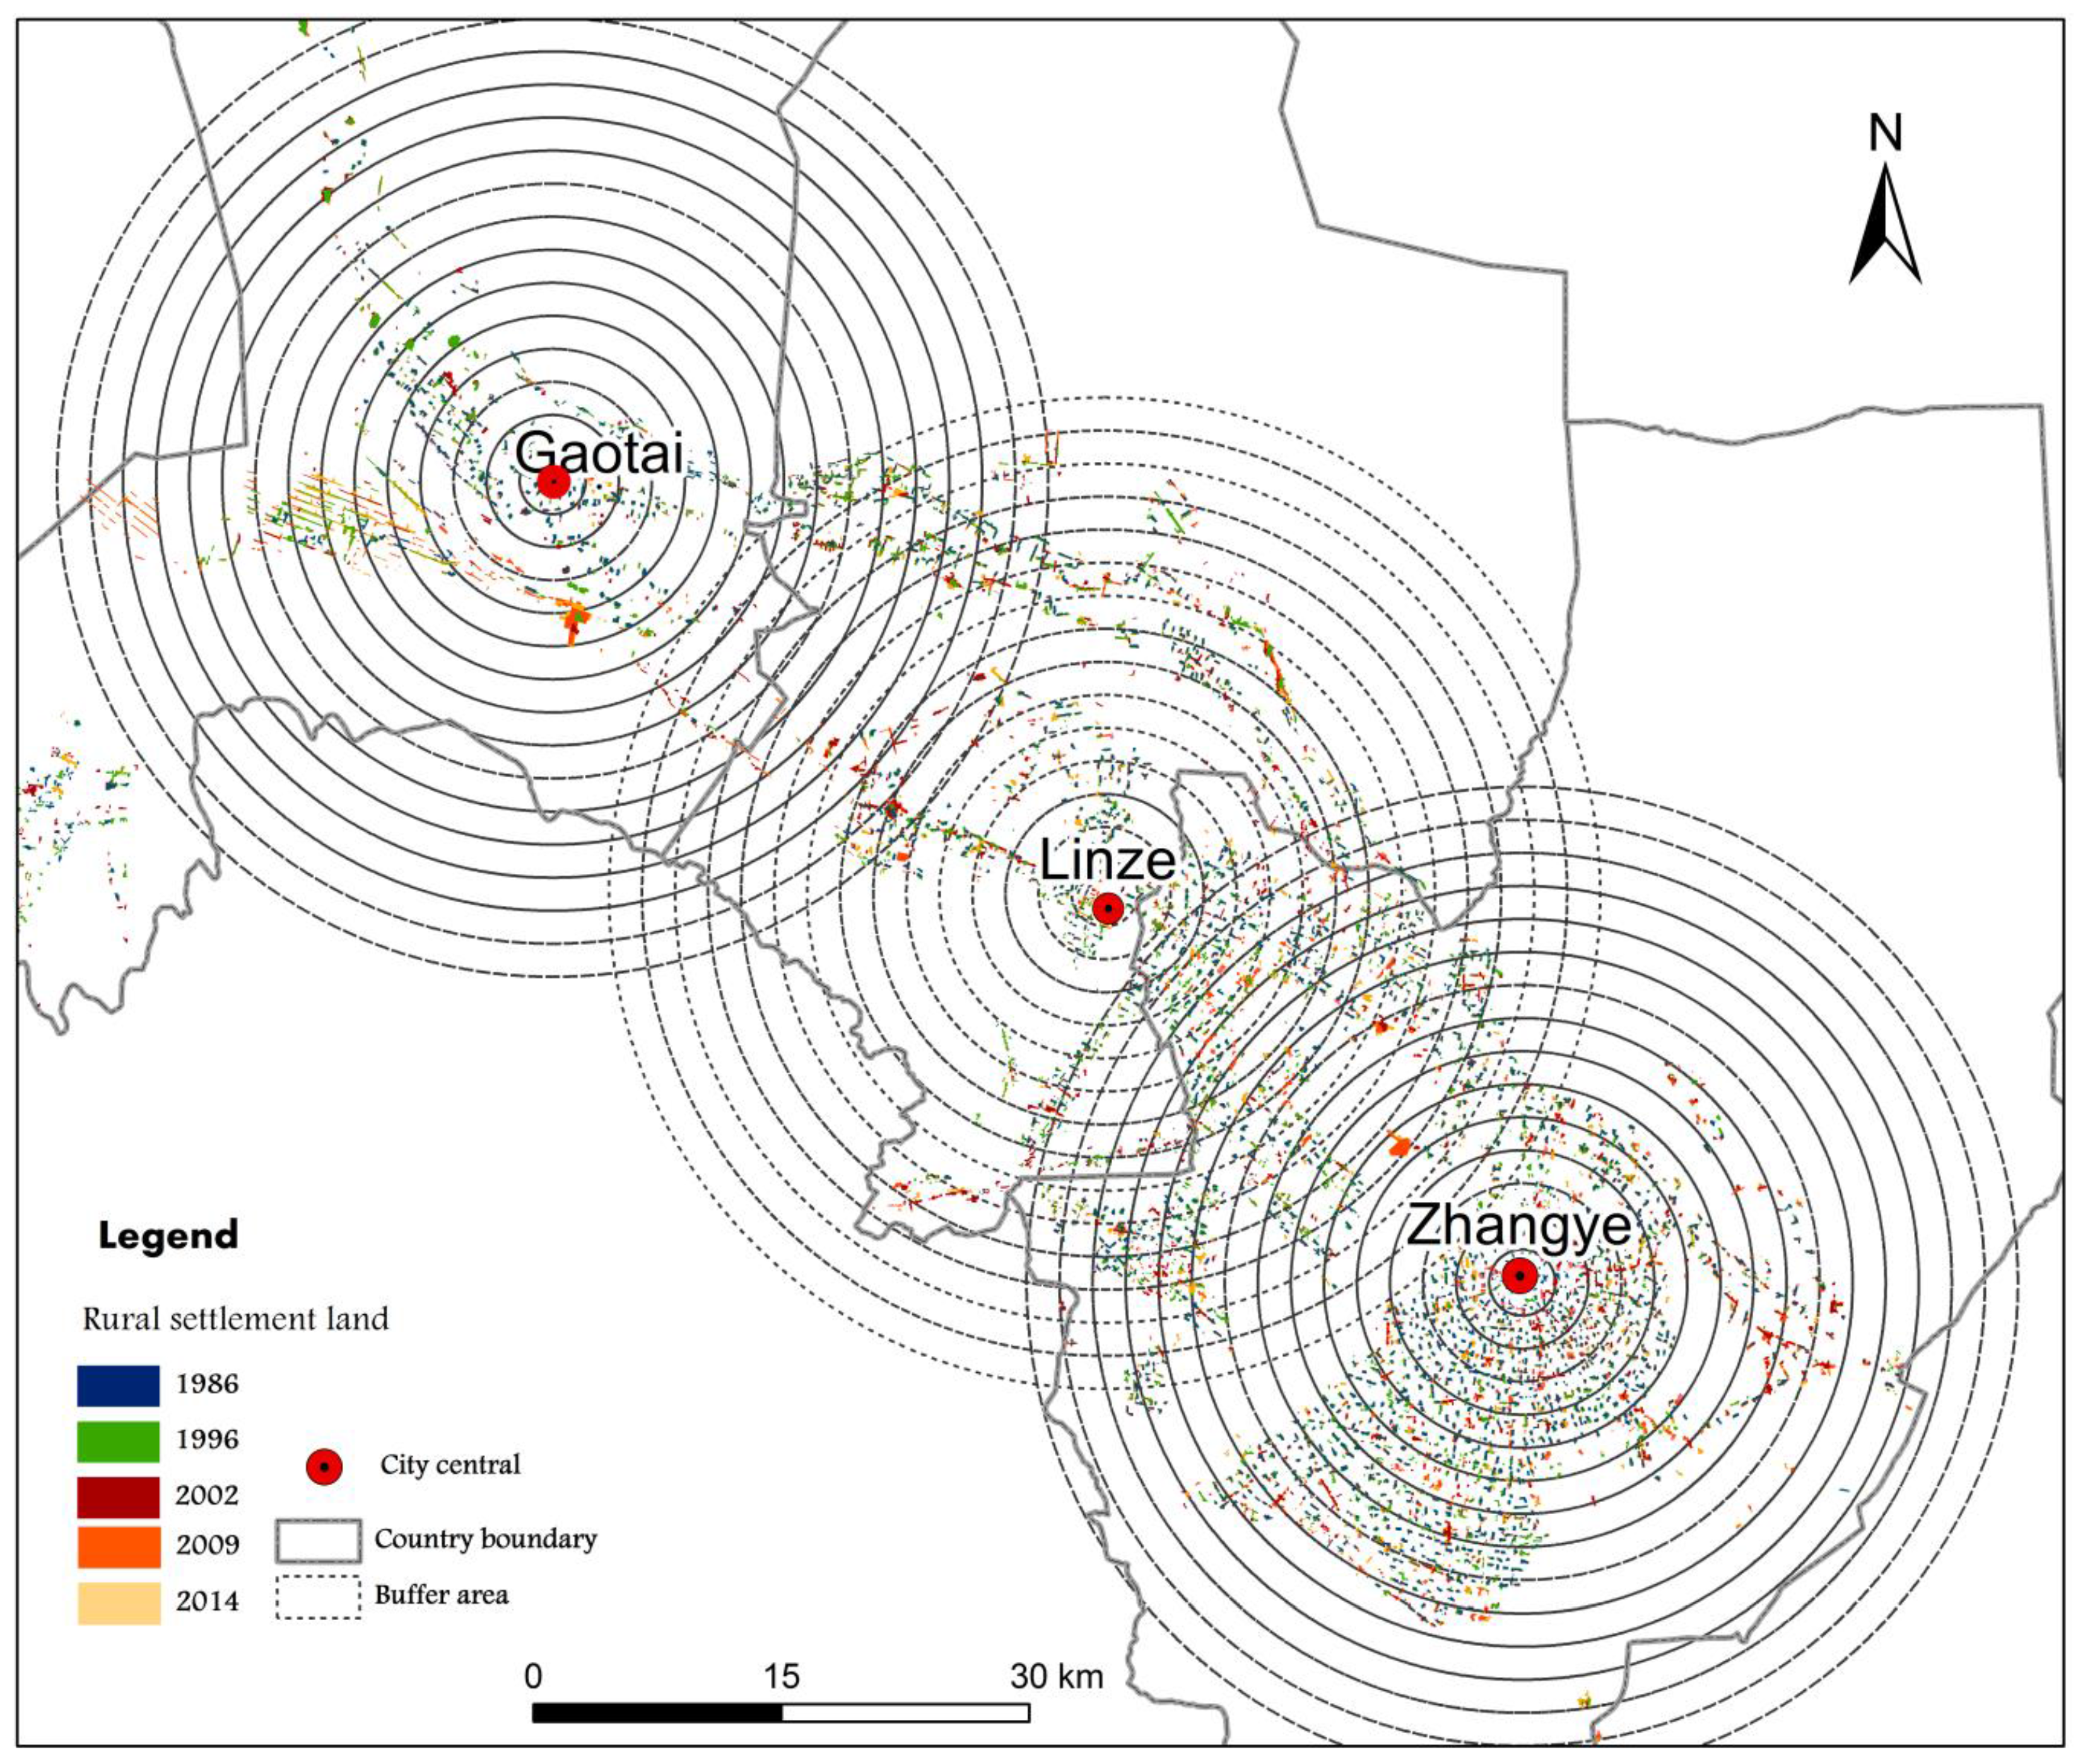
4.1. The Patterns of Dynamic Change in Rural Settlement Land

From 1986 to 2014, the majority of the RSL was located in the corridor plain area, approximately centred on the three cities. The remaining RSL patches were predominantly located near the rivers (the main branches of the Heihe, Liyuan, and Bailiang Rivers) and major roads, with a smaller portion on the piedmont alluvial fan of the southern and western region of the study area (Figure 3).
Using the spatial join tool of ArcGIS, three patterns of change—edge expansion, dispersion, and urban encroachment—were identified. These led to the dynamic changes in the RSL distribution shown in Figure 4. From 1986 to 2014, as summarized in Table 3, the edge expansion pattern contributed 2061 (56.90%) of the RSL patches and 90.65 km2 (55.76%) of the total RSL area. The dispersion pattern led to increases of 1635 (43.04%) and 68.50 km2 (44.24%) of the RSL patches and the total RSL area, respectively. Finally, urban sprawl encroached on 290 (5.33%) of the RSL patches and 8.48 km2 (7.85%) of the total RSL area.
In addition, Figure 4 presents the curves of the annual changes in the number (Figure 4a) and area (Figure 4b) of RSL patches for the three different modes of change. The pattern of dispersion shows a shift in trend circa 2002 in both the number and area of RSL patches. As Figure 4 shows, before 2002, the annual rates of change in number and area associated with the dispersion pattern were rising, whereas they showed a downward trend after 2002. By contrast, the edge expansion pattern showed a continuously increasing trend, with some fluctuations, during the four periods from 1986 to 2014. Because the proportion of urban encroachment was small, the corresponding average annual rate of change was not significant in any study period.

4.2. The Clustering Trend of Rural Settlement Land

As shown in Figure 5, the RSL patches were clustered close to the urban region of Zhangye in 1986 but expanded to the peripheral regions of the urban areas and along both sides of the rivers and roads from 1996 to 2004. Ultimately, all of the RSL patches had clustered, forming four clustered districts: Zhangye, Linze, Gaotai, and near both sides of the Heihe and Bailiang Rivers. The RSL density showed a significant decrease from the surroundings of the cities to remote villages, gradually forming a hollow in 2014, as observed in Figure 5. In general, RSL initially developed near urban areas and along the rivers and, then extended to peripheral regions and along the main roads.

4.3. The Landscape Change of Rural Settlement Land

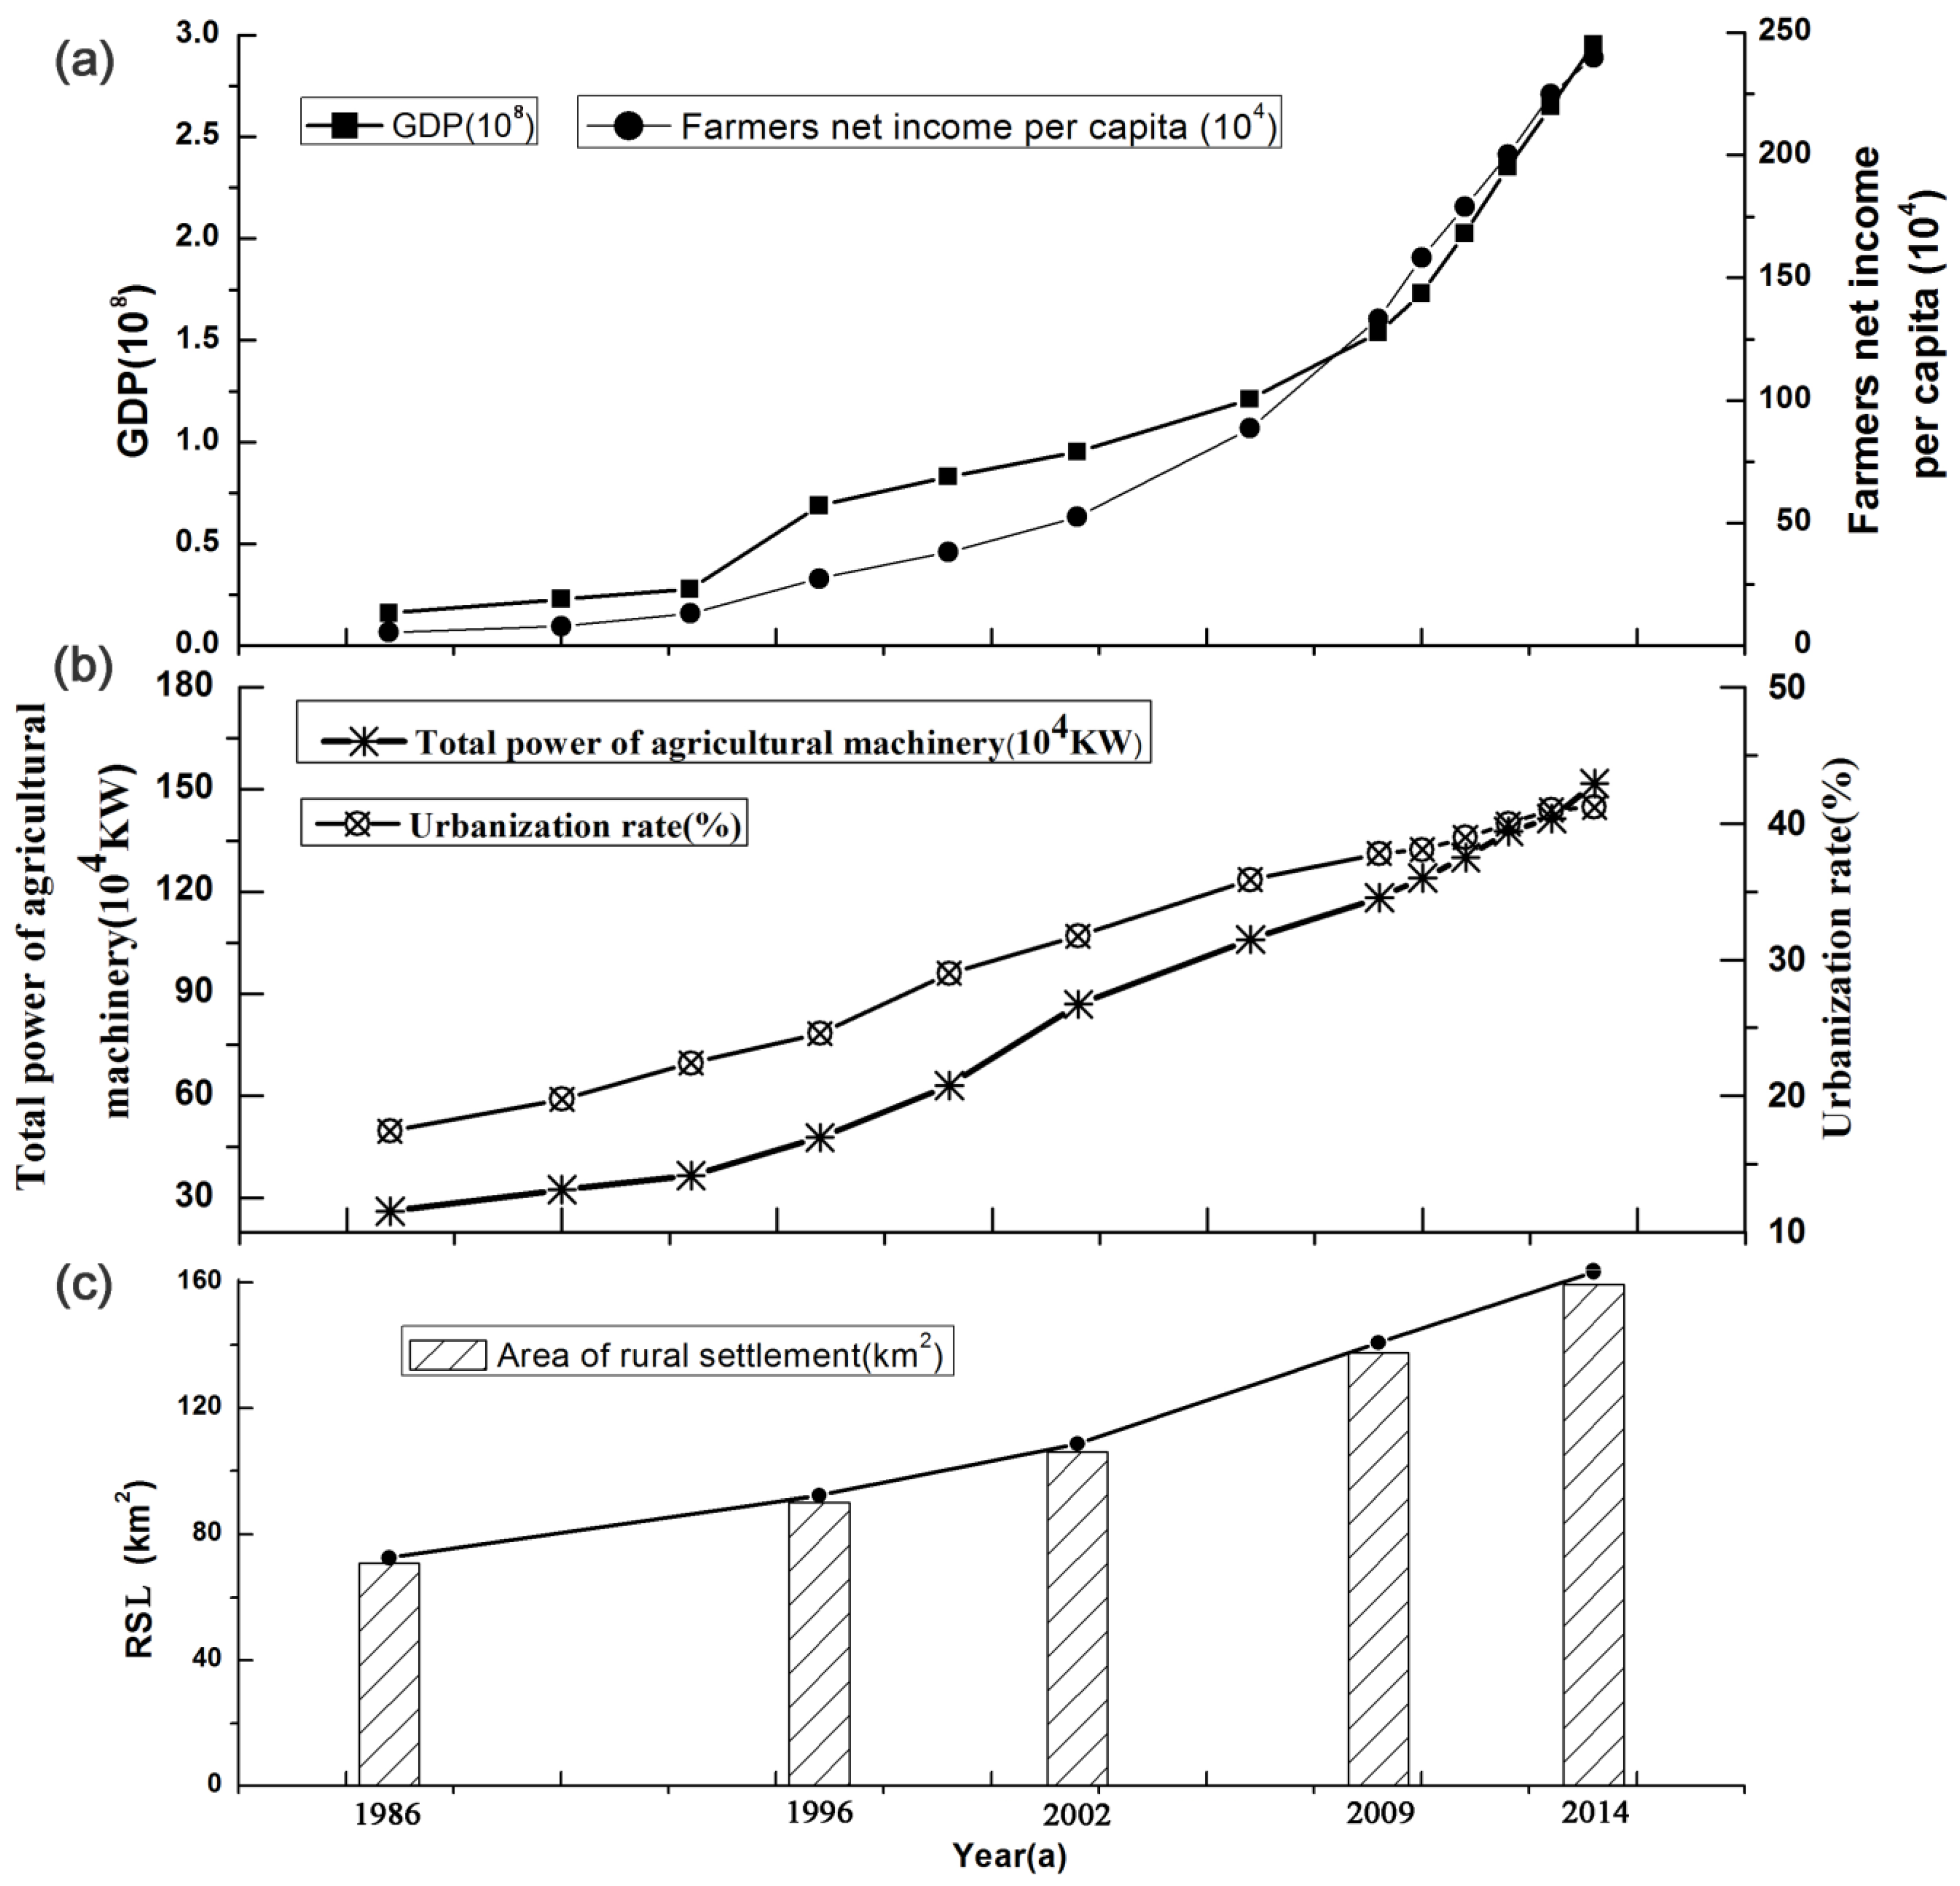
4.3.1. Overall Change Characteristics

As shown in Table 4, the RSL landscape indexes in the study area showed significant changes from 1986 to 2014. In particular, the patch area increased considerably, the total area and the patch size standard deviation (PSSD) increased by 122.03%, and 225.15%, respectively. The total number of patches (N), the mean patch size (MPS) and the MSI increased by 55.16%, 52.81%, and 19.49%, respectively. Meanwhile, the PD and MNN indexes decreased by 33.33% and 32.32%, respectively.
Because of the differences in the RSL expansion patterns among different periods, the changes in patch area and number were asynchronous from 1986 to 2014. As Table 4 shows, the total area increased by 122.03%, whereas the number of patches increased by only 55.16%. In addition, the PSSD and MPS also significantly increased, as mentioned above; however, the PD decreased from 0.36 to 0.24 from 1986 to 2014. Thus, these observations indicate that the edge expansion mode was the main driver of the increase in the RSL area during 1986–2014.
Additionally, the decrease in the PD also reflects that the fragmentation of the RSL gradually decreased from 1986 to 2014. The MSI increased from 1.18 to 1.41 between 1986 and 2014, indicating a shift in the RSL patch shape towards long, rectangular bands. The MNN decreased from 263 m to 178 m, revealing that the edge-to-edge distances between RSL patches were becoming shorter; in other words, the RSL distribution in the study area was becoming more clustered.

4.3.2. Spatial Heterogeneity from the Urban Central Outward

Using the method described in Section 3.4, we established the concentric circular partitions shown in Figure 6, and then selected the RSL distributions in 1986, 2002 and 2014 for the calculation of the PD, MSI and MNN indexes for different concentric ring partitions. Overall, the ring-based analysis revealed the greatest differences in the RSL landscape indexes moving from the city centers outwards. In the upper part of Figure 7, the PD shows an obvious declining trend with increasing distance between the concentric circles and the urban centre of the three major cities at the three time points. Among the three cities, the PD of Zhangye decreased most sharply in the 2–6 km range because Zhangye is the largest city in the region and urban sprawl encroached upon some of the RSL patches. Furthermore, the PD series presented in Figure 7 shows that in the range between 6–16 km, the spatial influence of Zhangye over the RSL was higher than that of Linze or Gaotai.
The middle part of Figure 7 shows that the MSI increased slightly in all three regions from 1986 to 2014. Specifically, the MSI of Gaotai showed an obvious shift in the 14–22 km range. This occurred primarily because the shape of the RSL patches is more complex than those of patches of other land types in this range; for example, the most obvious patches around Luotuocheng are long, rectangular bands of RSL (Figure 3a). In addition, the MSI of Linze exhibited more complexity than those of Zhangye and Gaotai in the 2–14 km range in 2014, whereas the MSI of Gaotai was more complex in the 12–30 km range.
As shown in the bottom part of Figure 7, the MNN decreased smoothly in all three regions during 1986–2014. Taking the 2014 MNN presented values in Figure 7 as an example, the maximum was 189.65 m for Zhangye, whereas the corresponding values were 172.39 m and 132.05 m for Linze and Gaotai, respectively.

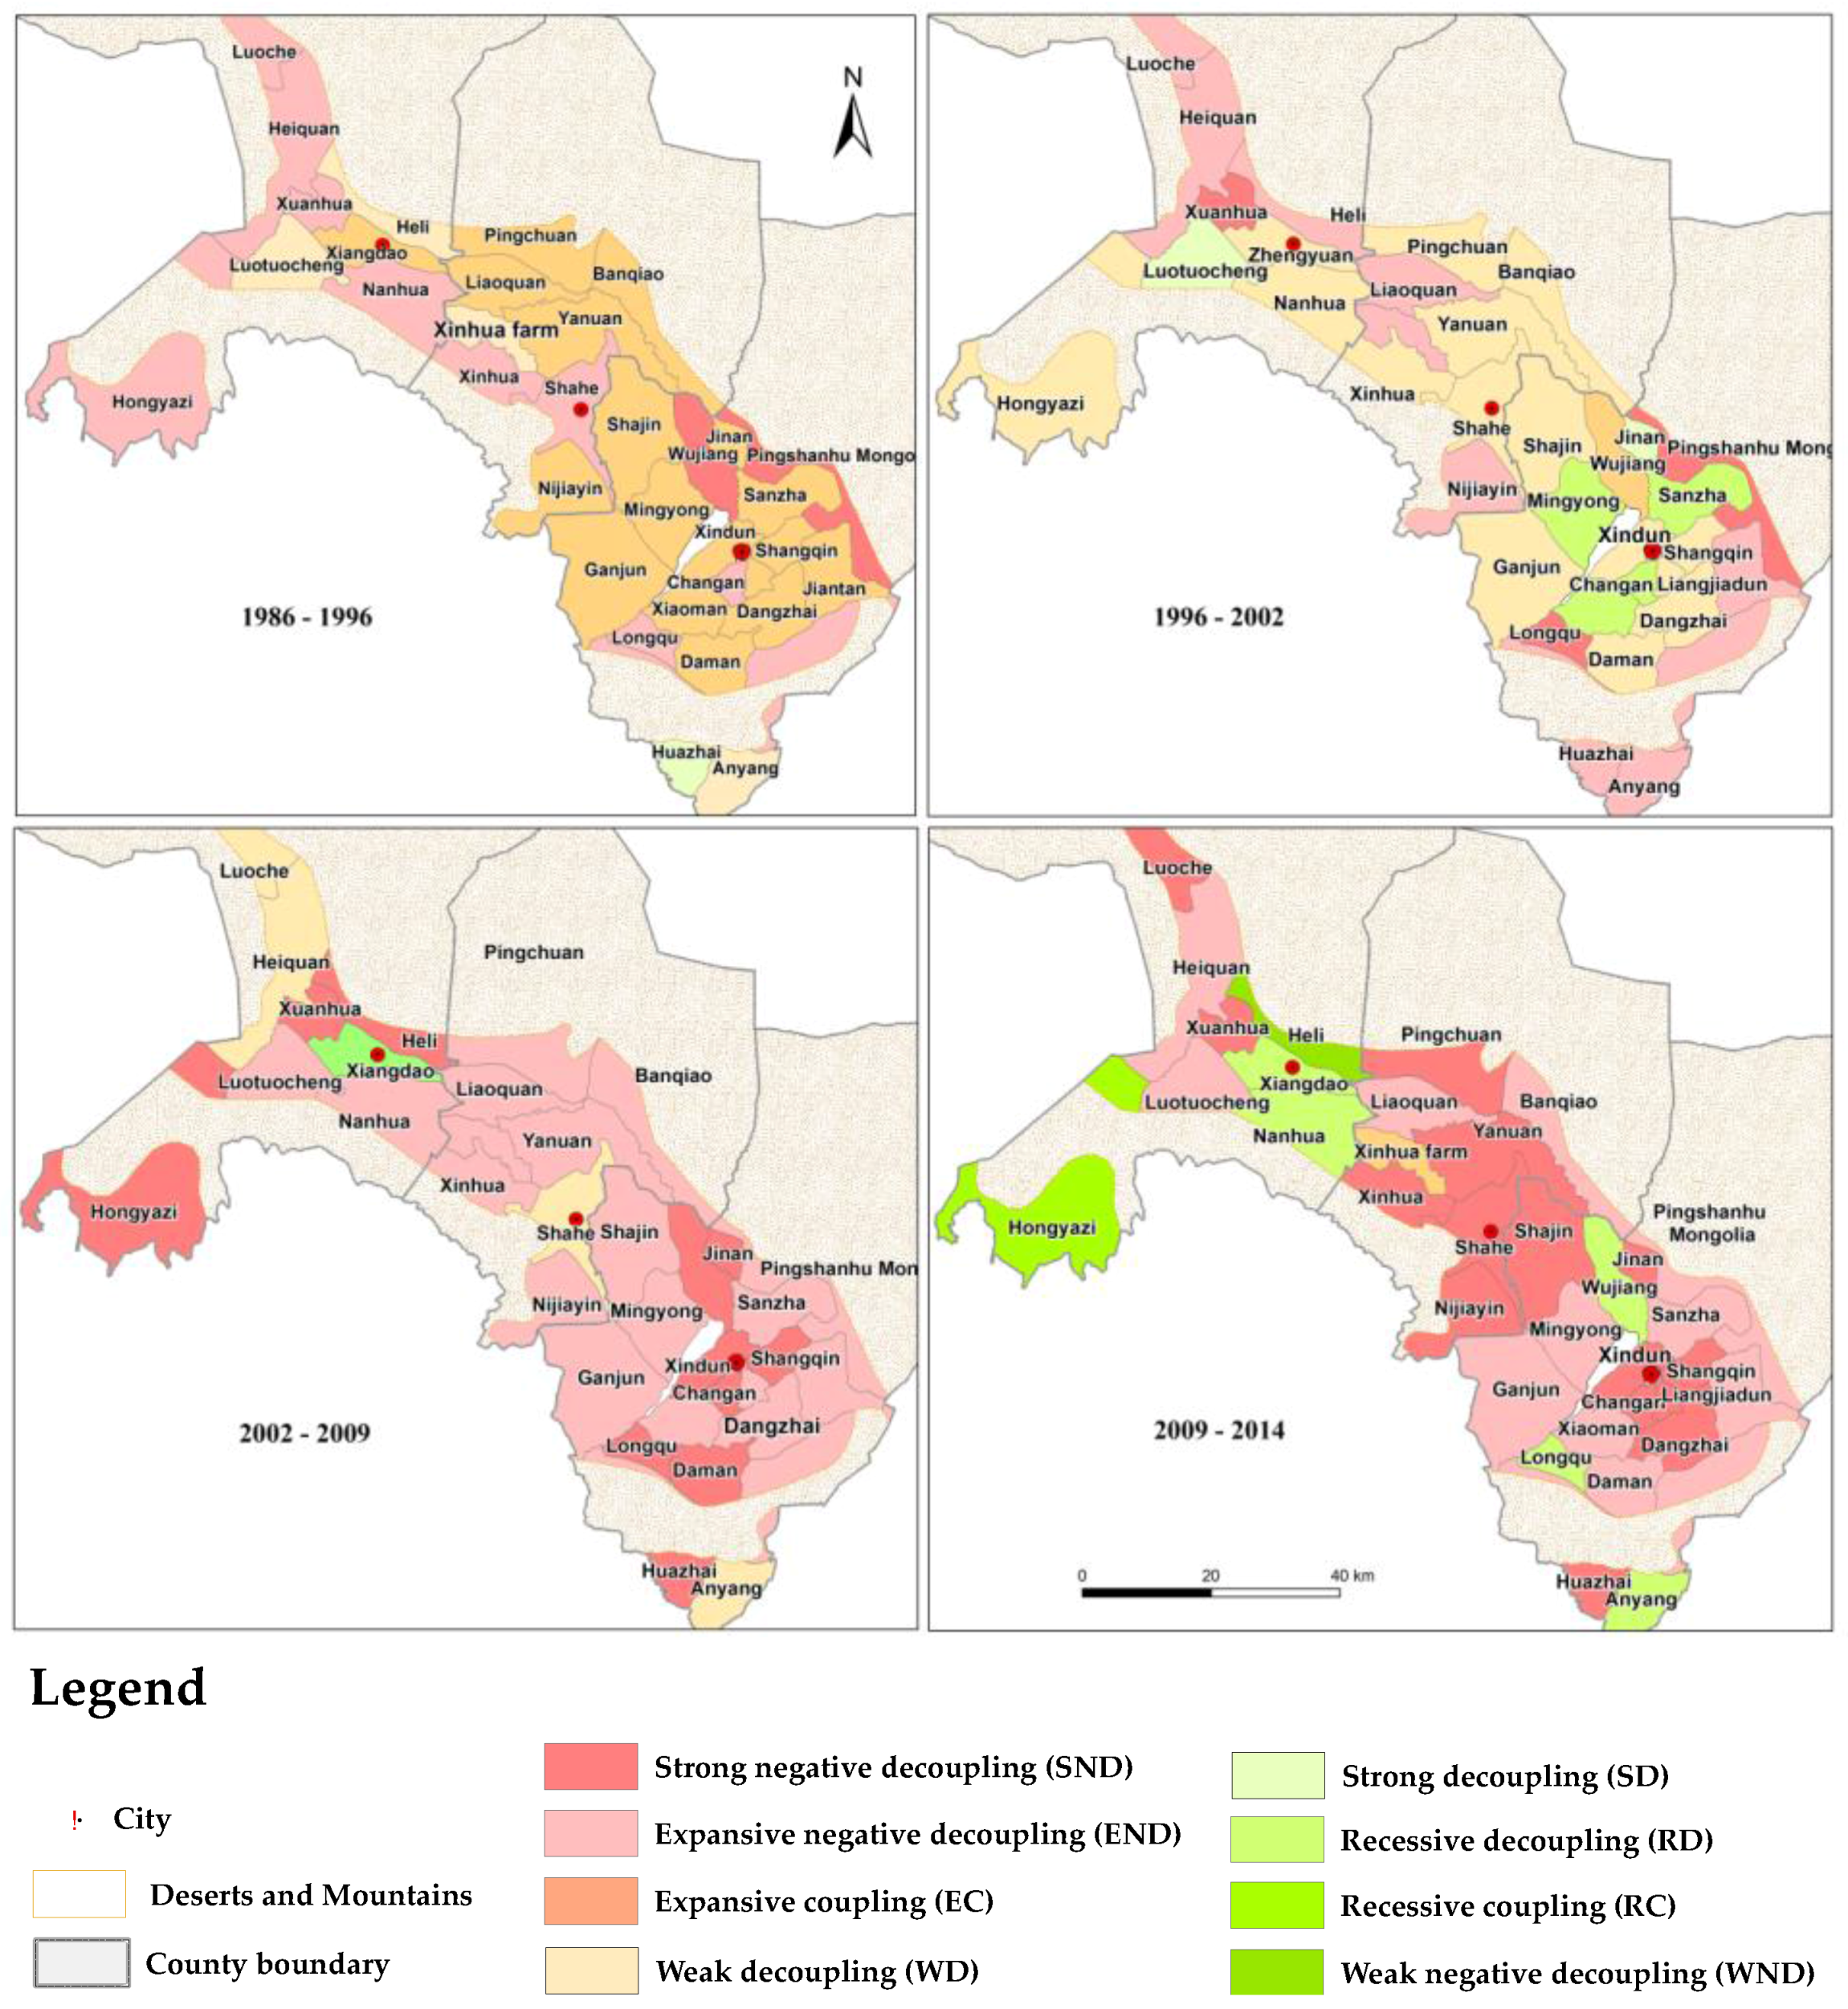
4.4. Spatiotemporal Decoupling between the Rural Settlement Land Area and the Rural Registered Population

From 1986 to 2014, as shown in Figure 8, the total RSL area experienced continual growth. By contrast, the RRP trend underwent a radical change starting circa 2001. During 1986–2014, the total RSL area increased by 122.5%, whereas the RRP increased by 9.1% before 2001, but decreased by 6.9% after 2001. Consequently, the per capita RRP of the RSL decreased from 159.78 m2 in 1986 to 147.52 m2 in 1996 and, subsequently, increased dramatically from 182.78 m2 in 2002 to 277.86 m2 in 2014. During 1986–2002, the annual growth rates of the RRP and the RSL area were 0.7% and 3.4%, respectively, whereas the annual growth rates of the RRP and the RSL area were −0.5% and 3.6%, respectively, from 2002 to 2014. In contrast to the synchronous growth of the RSL and the RRP during 1986–1996, there was negative growth in the RRP from 2002 to 2014 (Figure 8).
Therefore, the relationship between the RRP and the RSL area was weakly decoupled with an elasticity of 1.9 during 1986–1996, whereas it was strongly decoupled with an elasticity of 6.3 from 1996 to 2002. Moreover, a negative decoupling has been observed since 2002, with an elasticity of −5.9 from 2002 to 2009 and −31.2 from 2009 to 2014.
Based on the changes of elasticity of the RSL area and the RRP, as shown in Figure 9, most townships (91% of all 34 townships in the study area; see Figure 8) were in states of expansive coupling (EC), expansive negative decoupling (END), or weak decoupling (WD) during 1986–1996. However, starting at the beginning of 1996, the elastic coefficient (β) of the relationship between the RRP and the RSL area decreased from 6.3 (1996–2002) to −31.2 (2009–2014). The number of townships in the EC state decreased dramatically, whereas the number of townships in the SND state (e.g., Heli, Liaoquan, Nijiaying, and Jiantan) significantly increased. According to the elastic coefficients, the prevalence of SND increased from 6% (1986–1996) to 32% (2002–2009) and then to 44% (2009–2014). During the same periods, the prevalence of EC diminished from 53% (1986–1996) to 12% (2002–2009), and, ultimately, to 3% (2009–2014). The townships where these changes were most significant were mainly those closest to the urban areas: Changan, Liangjiadun, Shangqin, and Daman near Zhangye; Shahe, Shajin, and Yanuan near Linze; and Zhengyuan and Xuahua near Gaotai City.
In addition, recessive coupling (RC), recessive decoupling (RD) and weak negative decoupling (WND) showed slight growth from 1996 to 2014, as seen in Figure 9. For example, during 2009–2014, Hongyazi township, which is farthest away from the Gaotai, entered the RC state; Anyang, Liaoquan, Wujiang, and Xiangdao entered the RD state, and Heli entered the WND state during 2009–2014. These findings indicate that both the RSL area and the RRP exhibited decreasing trends in these townships during 2009–2014.
Overall, from 1986 to 2014, the relationship between the RSL area and the RRP experienced a shift from WD to SND, particularly in the main townships around the cities and along the rivers and roads.

5. Discussion

5.1. Spatiotemporal Variations in Rural Settlement Land Expansion

This study reveals that both the RSL area and RRP experienced significant and complex changes during the period 1986–2014. Over the past 28 years, the RSL area has continuously expanded, whereas the RRP initially increased and subsequently decreased. This result is similar to the research results obtained for Beijing [38]; however, the reasons for the growth in RSL area varied from 1986 to 2014, as indicated by the different patterns of change in the RSL. In this study, dispersion was the dominant pattern of RSL area growth before 2001, but after 2001, the pattern of edge expansion gradually became the dominant pattern of RSL area growth. Moreover, the RSL patches tended to be simple and regular, and the degrees of dispersion and RSL fragmentation decreased over time. Meanwhile, the edge-to-edge distance decreased significantly over time as the spatial RSL distribution became more concentrated in the study area.
Several authors have revealed the characteristics of dynamic change in RSL at the national [32], provincial [12,39], and county [27] levels, and even at smaller scales [25]. By considering patterns of dynamic change in three dimensions, this study analysed the spatial clustering trends and landscape changes of RSL from 1986 to 2014, thereby providing more detailed information and showing that the observed spatiotemporal variations in RSL expansion arose for the following reasons: At the considered time scale, the pattern of edge expansion was the major driver of the increase in the total RSL area. Moreover, the strength of the edge expansion pattern increased from 1986 to 2014. Meanwhile, the dispersion pattern was the second greatest contributor to the increase in the total RSL area, but its influence decreased year by year. At the considered spatial scale, the spatial heterogeneity of the RSL is mainly reflected in the observed spatial clustering and the changes in the landscape indexes from the city centres outwards.

5.2. The Influence of Urbanization on Rural Settlement Land and the Rural Registered Population

Given the points discussed above, it can be noticed that with the rapid development of the region, the relationship between RSL and RRP is closely associated with social and economic development, i.e., rates of urbanization as well as economic growth. Unfortunately, due to the limitations of accessing data at the village or township scale, four indices (Figure 10) representing different dimensions of regional development were selected to analyze the influence on RSL and RRP. Among these indices, GDP and farmers’ net income per capita (Figure 10a) represented regional economic development, while the total power of agricultural machinery and the urbanization rate represented regional agricultural modernization and urbanization (Figure 10b).
On the whole, the trends of growth in the regional economy, agricultural modernization, and urbanization are consistent with the RSL expansion trend. Economic growth is one of the main drivers of the expansion of both urban and rural construction land [14,26,40]. As their incomes rise, farmers have been actively building new houses, thereby greatly expanding areas of RSL. Consequently, housing consumption has ranked second in the total consumption of rural residents in China for a long time. In our study area, housing consumption has accounted for more than 16% of the total consumption since 1986 [41,42,43]. From 1986 to 2014, farmers’ per capita net income rose from 527 to 9854 yuan; the annual growth rate was approximately 13.14%, which is far greater than the annual RSL area growth rate of 4.36%. At the same time, the GDP increased from 534 billion to 23,979 billion yuan; its average annual growth rate was approximately 16%, although that rate has slightly reduced (to between 12% and 7%) in recent years (Figure 10). Therefore, economic development may be one the primary reasons for the expansion of RSL in the study area.
The combination of urbanization and the increased use of agricultural machinery tend to result in the transfer of rural labour to cities. The total power of agricultural machinery (TPAM) has become an important tool for measuring regional innovation in agricultural science and technology [44,45,46]. As the TPAM grows, rural labourers are increasingly displaced, eventually becoming migrant workers in cities. To a certain extent, the modernization of agriculture has reduced the number of agricultural employees. Similarly, the process of urbanization has resulted in a dwindling farming population. For example, during 2009–2014, the RRP decreased by 0.22%, while the RSL area increased by 3.16%. This change induced a strong negative decoupling between RSL and RRP. Therefore, although economic growth has promoted the expansion of RSL, urbanization and the increased use of agricultural machinery have reduced the RRP. As society has developed, these driving factors together have strengthened the decoupling relationship between the RRP and the RSL area.
However, we should recognize that driving factors are very complex interactive processes. In fact, because of the interactive influences of the various natural conditions and human activities involved and the limitations of the data available in our study area, it was difficult to compile a complete list all of factors that have influenced the changes in the RSL area and the RRP during the different periods and at different locations. In addition, the decoupling model used in this paper is merely a simple quantitative model. In future research, it may prove more appropriate to use survey data to analyse the various driving factors and mechanisms affecting the relationship between the RSL area and the RRP.

5.3. Policy and Planning Implications

Since the enactment of the policies of the Chinese Economic Reform, research and planning for rural areas have been given less attention compared with urban research [6]. Our study found that the land area per capita in RSL regions increased from 125.57 m2 in 1986 to 258.89 m2 in 2014. This considerably exceeded the 150 m2 standard promoted by the Chinese government [47]. In addition, we found that the pattern of dispersion of RSL has been on the wane in recent years, whereas the edge expansion pattern has gradually become the main driver of growth in the RSL area. Thus, it is imperative to control area growth by imposing strict limits on the boundary expansions of rural settlements. For example, the traditional one-floor house with one courtyard has long been prevalent in China because of its low building costs, but building multi-floor rural houses would be an effective way to ameliorate this problem. Furthermore, some scholars have recognized that rural land could improve the distribution of RSL in China [48].

6. Conclusions

This study showed that the relationship between the growth in land rural settlement and the rural population in the middle basin of the Heihe River in China over a long-term period was not synchronous. The results of the study provide valuable information for officials, planners, and developers who must make decisions regarding the potential effects of the settlement and development of oasis land related issues of development and ecological safety.
In this study, we found that RSL expansion initially occurred close to urban centres, water bodies, and roads and then extended to peripheral regions. Some of the RSL around the urban fringes was eroded by urban sprawl during the study period. Regarding the spatiotemporal expansion of RSL, the pattern of edge expansion accounted for the most significant growth in the total area, the number of patches, and the annual rate of increase; the dispersion pattern was the second most important factor in the expansion in RSL, but the associated annual rate of increase decreased year by year. The shape of the RSL patches tended to be simple and regular, and their spatial distribution became more concentrated over time.
This study is the first to investigate the characteristics of the spatiotemporal variation of RSL landscape indexes (density, shape, and proximity) from urban centres outwards. Various marked differences in landscape changes at the spatial and temporal levels have had a profound influence on the landscape patterns of rural settlement, as reflected by the observed changes in the patch areas, shapes, and concentrations of RSL. The trends of RSL area growth and changes in the RRP were roughly synchronous in the earliest years considered in this study, but they diverged as the RRP began to decrease. Consequently, the relationship between the RSL and the RRP experienced a shift from being slightly coupled to being strongly decoupled between 1986 and 2014.
As urbanization, agricultural mechanization, and rural infrastructure construction have accelerated, an increasing number of farmers have migrated from rural to urban areas, especially rural residents of working age, leaving behind communities of elderly people and children and thus forming what are called “empty villages” or “hollowed villages” [2,49]. Moreover, as rural infrastructure further increases, rural construction land—including RSL—will continue to expand. Thus, the trend of decoupling between the RSL and the RRP is expected to persist the short term. Therefore, it will be particularly important to perform scientific and rational planning and to make management decisions based on a thorough understanding of the laws governing the dynamic changes in RSL and the RRP.

Acknowledgments

The work was supported by the National Natural Science Foundation of China (41471163), and the Fundamental Research Funds for the Central Universities in China, Lanzhou University (lzujbky-2016-242). We gratefully acknowledge Miss Tao Pu, a Ph.D. employed at the Cold and Arid Regions Environmental and Engineering Research Institute, Chinese Academy of Sciences, Lanzhou, China; Stephen, from Northern Ireland, who is employed by the School of Civil Engineering and Architecture of Southwest University of Science and Technology, China; and Degui Liu, who assisted in improving the English writing of this manuscript. Finally, we would like to thank the anonymous reviewers and the editor for their helpful comments, which improved the manuscript substantially.

Author Contributions

Yaowen Xie conceived and designed the experiments; Qi Cao provided and prepared some of the data; Manjiang Shi performed the experiments and wrote the paper.

Conflicts of Interest

The authors declare no conflict of interest.

References

  1. Song, W.; Liu, M. Assessment of decoupling between rural settlement area and rural population in China. Land Use Policy 2014, 39, 331–341. [Google Scholar] [CrossRef]
  2. Liu, Y.; Liu, Y.; Chen, Y.; Long, H. The process and driving forces of rural hollowing in China under rapid urbanization. J. Geogr. Sci. 2010, 20, 876–888. [Google Scholar] [CrossRef]
  3. Xinhua News Agency, B., March 16. National New Urbanization Plan (2015–2020). Available online: http://www.gov.cn/zhengce/2014-03/16/content_2640075.htm (accessed on 3 March 2016). (In Chinese)
  4. Li, Y.; Liu, Y.; Long, H. Spatio-temporal analysis of population and residential land change in rural China. J. Nat. Resour. 2010, 25, 1629–1638. (In Chinese) [Google Scholar]
  5. Xinhua News Agency, B., March 16. China’s Village Vacant Area of over 100 Million Acres. Available online: http://news.xinhuanet.com/fortune/2012-09/10/c_123693204.htm (accessed on 3 March 2016). (In Chinese)
  6. Zhou, G.; He, Y.; Tang, C.; Yu, T.; Xiao, G.; Zhong, T. Dynamic mechanism and present situation of rural settlement evolution in China. J. Geogr. Sci. 2013, 23, 513–524. [Google Scholar] [CrossRef]
  7. Long, H.; Li, Y.; Liu, Y.; Woods, M.; Zou, J. Accelerated restructuring in rural China fueled by ‘increasing vs. Decreasing balance’ land-use policy for dealing with hollowed villages. Land Use Policy 2012, 29, 11–22. [Google Scholar] [CrossRef]
  8. Long, H.; Heilig, G.K.; Li, X.; Zhang, M. Socio-economic development and land-use change: Analysis of rural housing land transition in the transect of the Yangtse river, China. Land Use Policy 2007, 24, 141–153. [Google Scholar] [CrossRef]
  9. Lin, G.C.S.; Ho, S.P.S. China’s land resources and land-use change: Insights from the 1996 land survey. Land Use Policy 2003, 20, 87–107. [Google Scholar] [CrossRef]
  10. Long, H.; Tang, G.; Li, X.; Heilig, G.K. Socio-economic driving forces of land-use change in Kunshan, the Yangtze river delta economic area of China. J. Environ. Manag. 2007, 83, 351–364. [Google Scholar] [CrossRef] [PubMed]
  11. Su, S.; Zhang, Q.; Zhang, Z.; Zhi, J.; Wu, J. Rural settlement expansion and paddy soil loss across an ex-urbanizing watershed in eastern coastal China during market transition. Reg. Environ. Chang. 2010, 11, 651–662. [Google Scholar] [CrossRef]
  12. Long, H.; Liu, Y.; Wu, X.; Dong, G. Spatio-temporal dynamic patterns of farmland and rural settlements in su–xi–chang region: Implications for building a new countryside in coastal China. Land Use Policy 2009, 26, 322–333. [Google Scholar] [CrossRef]
  13. Huang, B.; Zhang, L.; Wu, B. Spatiotemporal analysis of rural–urban land conversion. Int. J. Geogr. Inf. Sci. 2009, 23, 379–398. [Google Scholar] [CrossRef]
  14. Wang, Y.; Liu, Y.; Li, Y.; Li, T. The spatio-temporal patterns of urban–rural development transformation in China since 1990. Habitat Int. 2016, 53, 178–187. [Google Scholar] [CrossRef]
  15. Tapio, P. Towards a theory of decoupling: Degrees of decoupling in the eu and the case of road traffic in finland between 1970 and 2001. Transp. Policy 2005, 12, 137–151. [Google Scholar] [CrossRef]
  16. Tian, G.; Qiao, Z.; Gao, X. Rural settlement land dynamic modes and policy implications in Beijing metropolitan region, China. Habitat Int. 2014, 44, 237–246. [Google Scholar] [CrossRef]
  17. Sevenant, M.; Antrop, M. Settlement models, land use and visibility in rural landscapes: Two case studies in Greece. Landsc. Urban Plann. 2007, 80, 362–374. [Google Scholar] [CrossRef]
  18. Hosseini, S.B.; Faizi, M.; Norouzian-Maleki, S.; Karimi Azari, A.R. Impact evaluation of rural development plans for renovating and retrofitting of rural settlements. Environ. Earth Sci. 2011, 73, 3033–3042. [Google Scholar] [CrossRef]
  19. Li, Y.; Liu, Y.; Long, H.; Cui, W. Community-based rural residential land consolidation and allocation can help to revitalize hollowed villages in traditional agricultural areas of China: Evidence from dancheng county, Henan province. Land Use Policy 2014, 39, 188–198. [Google Scholar] [CrossRef]
  20. Crecente, R.; Alvarez, C.; Fra, U. Economic, social and environmental impact of land consolidation in galicia. Land Use policy 2002, 19, 135–147. [Google Scholar] [CrossRef]
  21. Feng, Z.; Yang, Y.; Zhang, D.; Tang, Y. Natural environment suitability for human settlements in China based on gis. J. Geogr. Sci. 2009, 19, 437–446. [Google Scholar] [CrossRef]
  22. Chen, M.; Ye, C. Differences in pattern and driving forces between urban and rural settlements in the coastal region of Ningbo, China. Sustainability 2014, 6, 1848–1867. [Google Scholar] [CrossRef]
  23. Pribadi, D.O.; Pauleit, S. The dynamics of peri-urban agriculture during rapid urbanization of Jabodetabek metropolitan area. Land Use Policy 2015, 48, 13–24. [Google Scholar] [CrossRef]
  24. Hao, H.; Zhang, J.; Li, X.; Zhang, H.; Zhang, Q. Impact of livelihood diversification of rural households on their ecological footprint in agro-pastoral areas of northern China. J. Arid Land 2015, 7, 653–664. [Google Scholar] [CrossRef]
  25. Alkan, H. Negative impact of rural settlements on natural resources in the protected areas: Kovada lake national park, Turkey. J. Environ. Biol. 2009, 30, 363–372. [Google Scholar] [PubMed]
  26. Liu, Y.; Lu, S.; Chen, Y. Spatio-temporal change of urban–rural equalized development patterns in China and its driving factors. J. Rural Stud. 2013, 32, 320–330. [Google Scholar] [CrossRef]
  27. Dong, G.; Xu, E.; Zhang, H. Spatiotemporal variation of driving forces for settlement expansion in different types of counties. Sustainability 2015. [Google Scholar] [CrossRef]
  28. Lu, L.; Cheng, G.; Li, X. Landscape change in middle Heihe river basin. China J. Appl. Ecol. 2001, 12, 68–74. [Google Scholar]
  29. Wang, T. Research progress and trend of desertification in arid area. China Desert 2009, 29, 1–9. [Google Scholar]
  30. Xie, Y.; Gong, J.; Sun, P.; Gou, X. Oasis dynamics change and its influence on landscape pattern on jinta oasis in arid China from 1963a to 2010a: Integration of multi-source satellite images. Int. J. Appl. Earth Obs. Geoinf. 2014, 33, 181–191. [Google Scholar] [CrossRef]
  31. Liu, J.; Liu, M.; Tian, H.; Zhuang, D.; Zhang, Z.; Zhang, W.; Tang, X.; Deng, X. Spatial and temporal patterns of China’s cropland during 1990–2000: An analysis based on Landsat TM data. Remote Sens. Environ. 2005, 98, 442–456. [Google Scholar] [CrossRef]
  32. Liu, J.; Liu, M.; Zhuang, D.; Zhang, Z.; Deng, X. Study on spatial pattern of land-use change in China during 1995–2000. Sci. China Ser. D Earth Sci. 2003, 46, 373–384. [Google Scholar]
  33. Liu, J.; Tian, H.; Liu, M.; Zhuang, D.; Melillo, J.M.; Zhang, Z. China’s changing landscape during the 1990s: Large-scale land transformations estimated with satellite data. Geophys. Res. Lett. 2005, 32, 1–5. [Google Scholar] [CrossRef]
  34. Luo, H.; Li, L.; Zhu, H.; Kuai, X.; Zhang, Z.; Liu, Y. Land cover extraction from high resolution zy-3 satellite imagery using ontology-based method. ISPRS Int. J. Geo Inf. 2016, 5, 1–16. [Google Scholar] [CrossRef]
  35. Wang, F. Quantitative Methods and Applications in Gis; The Commercial Press: Shanghai, China, 2006; pp. 31–37. [Google Scholar]
  36. Wu, K.; Zhang, H. Land use dynamics, built-up land expansion patterns, and driving forces analysis of the fast-growing Hangzhou metropolitan area, eastern China (1978–2008). Appl. Geogr. 2012, 34, 137–145. [Google Scholar] [CrossRef]
  37. Jiao, L. Urban land density function: A new method to characterize urban expansion. Landsc. Urban Plan. 2015, 139, 26–39. [Google Scholar] [CrossRef]
  38. Tian, G.; Qiao, Z.; Gao, X. Rural settlement land dynamic modes and policy implications in Beijing metropolitan region, China. Habitat Int. 2014, 44, 237–246. [Google Scholar] [CrossRef]
  39. Xu, Y.; Pu, L.; Zhang, L. Spatial pattern and the process of settlement expansion in Jiangsu province from 1980 to 2010, eastern China. Sustainability 2014, 6, 8180–8194. [Google Scholar] [CrossRef]
  40. Liu, J.; Zhan, J.; Deng, X. Spatio-temporal patterns and driving forces of urban land expansion in China during the economic reform era. Ambio 2005, 34, 450–455. [Google Scholar] [CrossRef] [PubMed]
  41. Ma, G.; Li, J. Analysis of the consumption structure of rural residents in Hexi area. Soc. Sci. Rev. 2006, 21, 30–37. (In Chinese) [Google Scholar]
  42. Qin, W. Analysis on the Consumption Structure of Rural Residents in China. Master’s Thesis, Hebei University, Baoding, China, 2006. [Google Scholar]
  43. Wen, T.; Meng, Z. Research on the evolution of the consumption structure of rural residents in China. Agric. Tech. Econ. 2012, 7, 4–14(In. (In Chinese) [Google Scholar]
  44. Helbich, M.; Leitner, M. Spatial analysis of the urban-to-rural migration determinants in the viennese metropolitan area. A transition from suburbia to post suburbia? Appl. Spat. Anal. Policy 2009, 2, 237–260. [Google Scholar] [CrossRef]
  45. Ai, H. Study on prediction of the total power of agricultural machinery based on fuzzy bp network. In Proceedings of the 2015 Chinese Intelligent Automation Conference; Deng, Z., Li, H., Eds.; Springer: Heidelberg/Berlin, Germany, 2015; pp. 551–558. [Google Scholar]
  46. Zhu, R.; Huang, Y.; Yang, X. Method for estimating total power of agricultural machinery based on mixed grey neural network. Trans. CSAE 2006, 22, 107–110. (In Chinese) [Google Scholar]
  47. Village Planning Standard (GB 50188-93): Qinhuangdao Planning. Available online: http://www.qhdgh.gov.cn/ghj/front/822411712.htm (accessed on 3 March 2016). (In Chinese)
  48. Zhu, X.; Chen, Y.; Liu, Y.; Zhang, J. Technique and method of rural land consolidation potential investigation and assessment: A case study of Yucheng city, Shandong province. Acta Geogr. Sin. 2010, 65, 736–744. (In Chinese) [Google Scholar]
  49. Chen, Y.; Sun, H.; Liu, Y. Reconstruction models of hollowed villages in key agricultural regions of China. Acta Geogr. Sin. 2010, 65, 727–735. (In Chinese) [Google Scholar]
Figure 1. Location of the study area in the Heihe River Basin of Northwest China.
Sustainability 08 00614 g001
Figure 2. The decoupling model between rural settlement land (RSL) area and the rural registered population (RRP).
Sustainability 08 00614 g002
Figure 3. The patterns of dynamic change in the RSL distribution from 1986 to 2014.
Sustainability 08 00614 g003
Figure 4. The curves of the annual changes in the (a) number and (b) area of RSL patches under different dynamic patterns from 1986 to 2014.
Sustainability 08 00614 g004
Figure 5. The spatial clustering trends of RSL from 1986 to 2014.
Sustainability 08 00614 g005
Figure 6. The concentric ring partitioning of Zhangye, Linze, and Gaotai in the study area.
Sustainability 08 00614 g006
Figure 7. Spatial heterogeneity of the RSL landscape indexes from urban centres outwards.
Sustainability 08 00614 g007
Figure 8. The changes in the RSL area and the RRP from 1986 to 2014.
Sustainability 08 00614 g008
Figure 9. States of decoupling between the RSL area and the RRP during 1986–2014.
Sustainability 08 00614 g009
Figure 10. The changes in (a) economic factors; (b) rural modernization and urbanization, and (c) RSL area in the study area during 1986–2014.
Sustainability 08 00614 g010
Table 1. Dataset used for this paper.
Remote Sensed DataPath/RowCloud CoverDateReference DataYear
Landsat 5 TM133/033.0%1986/6/09Topographic map1986
134/033.1%1986/8/03
Landsat 5 TM133/033.0%1997/8/26
134/033.0%1997/8/1
Landsat 7 ETM+133/033.5%2002/6/13Google Earth2002 (covered part of the study area)
134/033.3%2002/11/11
Landsat 5 TM133/033.0%2009/8/11Google Earth2009 (covered part of the study area)
134/033.0%2009/7/17
Landsat 8 OLI133/033.8%2014/7/15Google Earth2014 (covered all of the study area)
134/033.2%2014/6/6
Table 2. The landscape indexes for RSL in the study.
IndexDescription
Number N = i = 1 n n i ; where N is the total number of RSL patches and ni is the ith patch.
Total areaUnit: 106 m2. A = i = 1 n a i ; where A is total RSL area and ai is the area of ith RSL patch.
Mean Patch size (MPS) Unit: m2. M P S = i = 1 n a i n ; where MPS is mean RSL patch size and ai and n have the same meanings given above.
Patch Size Standard Deviation (PSSD)Unit: m2. S D = i = 1 n [ a i ( i = 1 n a i / n ) ] 2 n ; where SD is standard deviation of the RSL patch size and ai and n is the same meanings given above.
Patch density (PD)Unit: 1/m2 × 104. P D   = n i / A ×   1 0 4 ; where PD is RSL patch density and ni and A have the same meanings given above.
Mean Shaper index (MSI) M S I = 0.25 P / A ; where P and A are the patch perimeter and patch area, respectively. With a square as the standard, if MSI = 1, then the RSL patch shape is close to being square or circular (MSI = 0.88), if MSI > 1, then the RSL patch shape is close to oval or rectangular.
Euclidian mean nearest neighbor distance (MNN)Unit: m. M N N = i = 1 n h i n ; where hi is distance from patch i to nearest neighboring patch of the same class, based on patch edge-to-edge distance.
Table 3. The summary of the number and area variations of the RSL caused by three patterns of dynamic change in the RSL distribution from 1986 to 2014.
Dynamic PatternNumberAnnualPercentage/%Area/km2Annual/km2Percentage/%
Dispersion163512544.2468.50 3.7043.04
Edge-expansion206137555.7690.65 12.9556.96
Urban encroachment290107.858.48 0.295.33
Table 4. Values of the landscape indexes for RSL from 1986 to 2014.
Year19861996200220092014
Number23823023339736013696
Total area/106 m271.6890.10111.08 137.46159.15
MPS/m227,682.2728,205.7631,209.8238,040.3942,300.04
PSSD/m222,331.9627,256.1637,372.7154,719.2772,613.34
PD/1/m2 × 1040.360.340.310.260.24
MSI1.181.231.291.381.41
MNN/m263234212184178

