
Influence of Urbanization Factors on Surface Urban Heat Island Intensity: A Comparison of Countries at Different Developmental Phases


Abstract
:1. Introduction
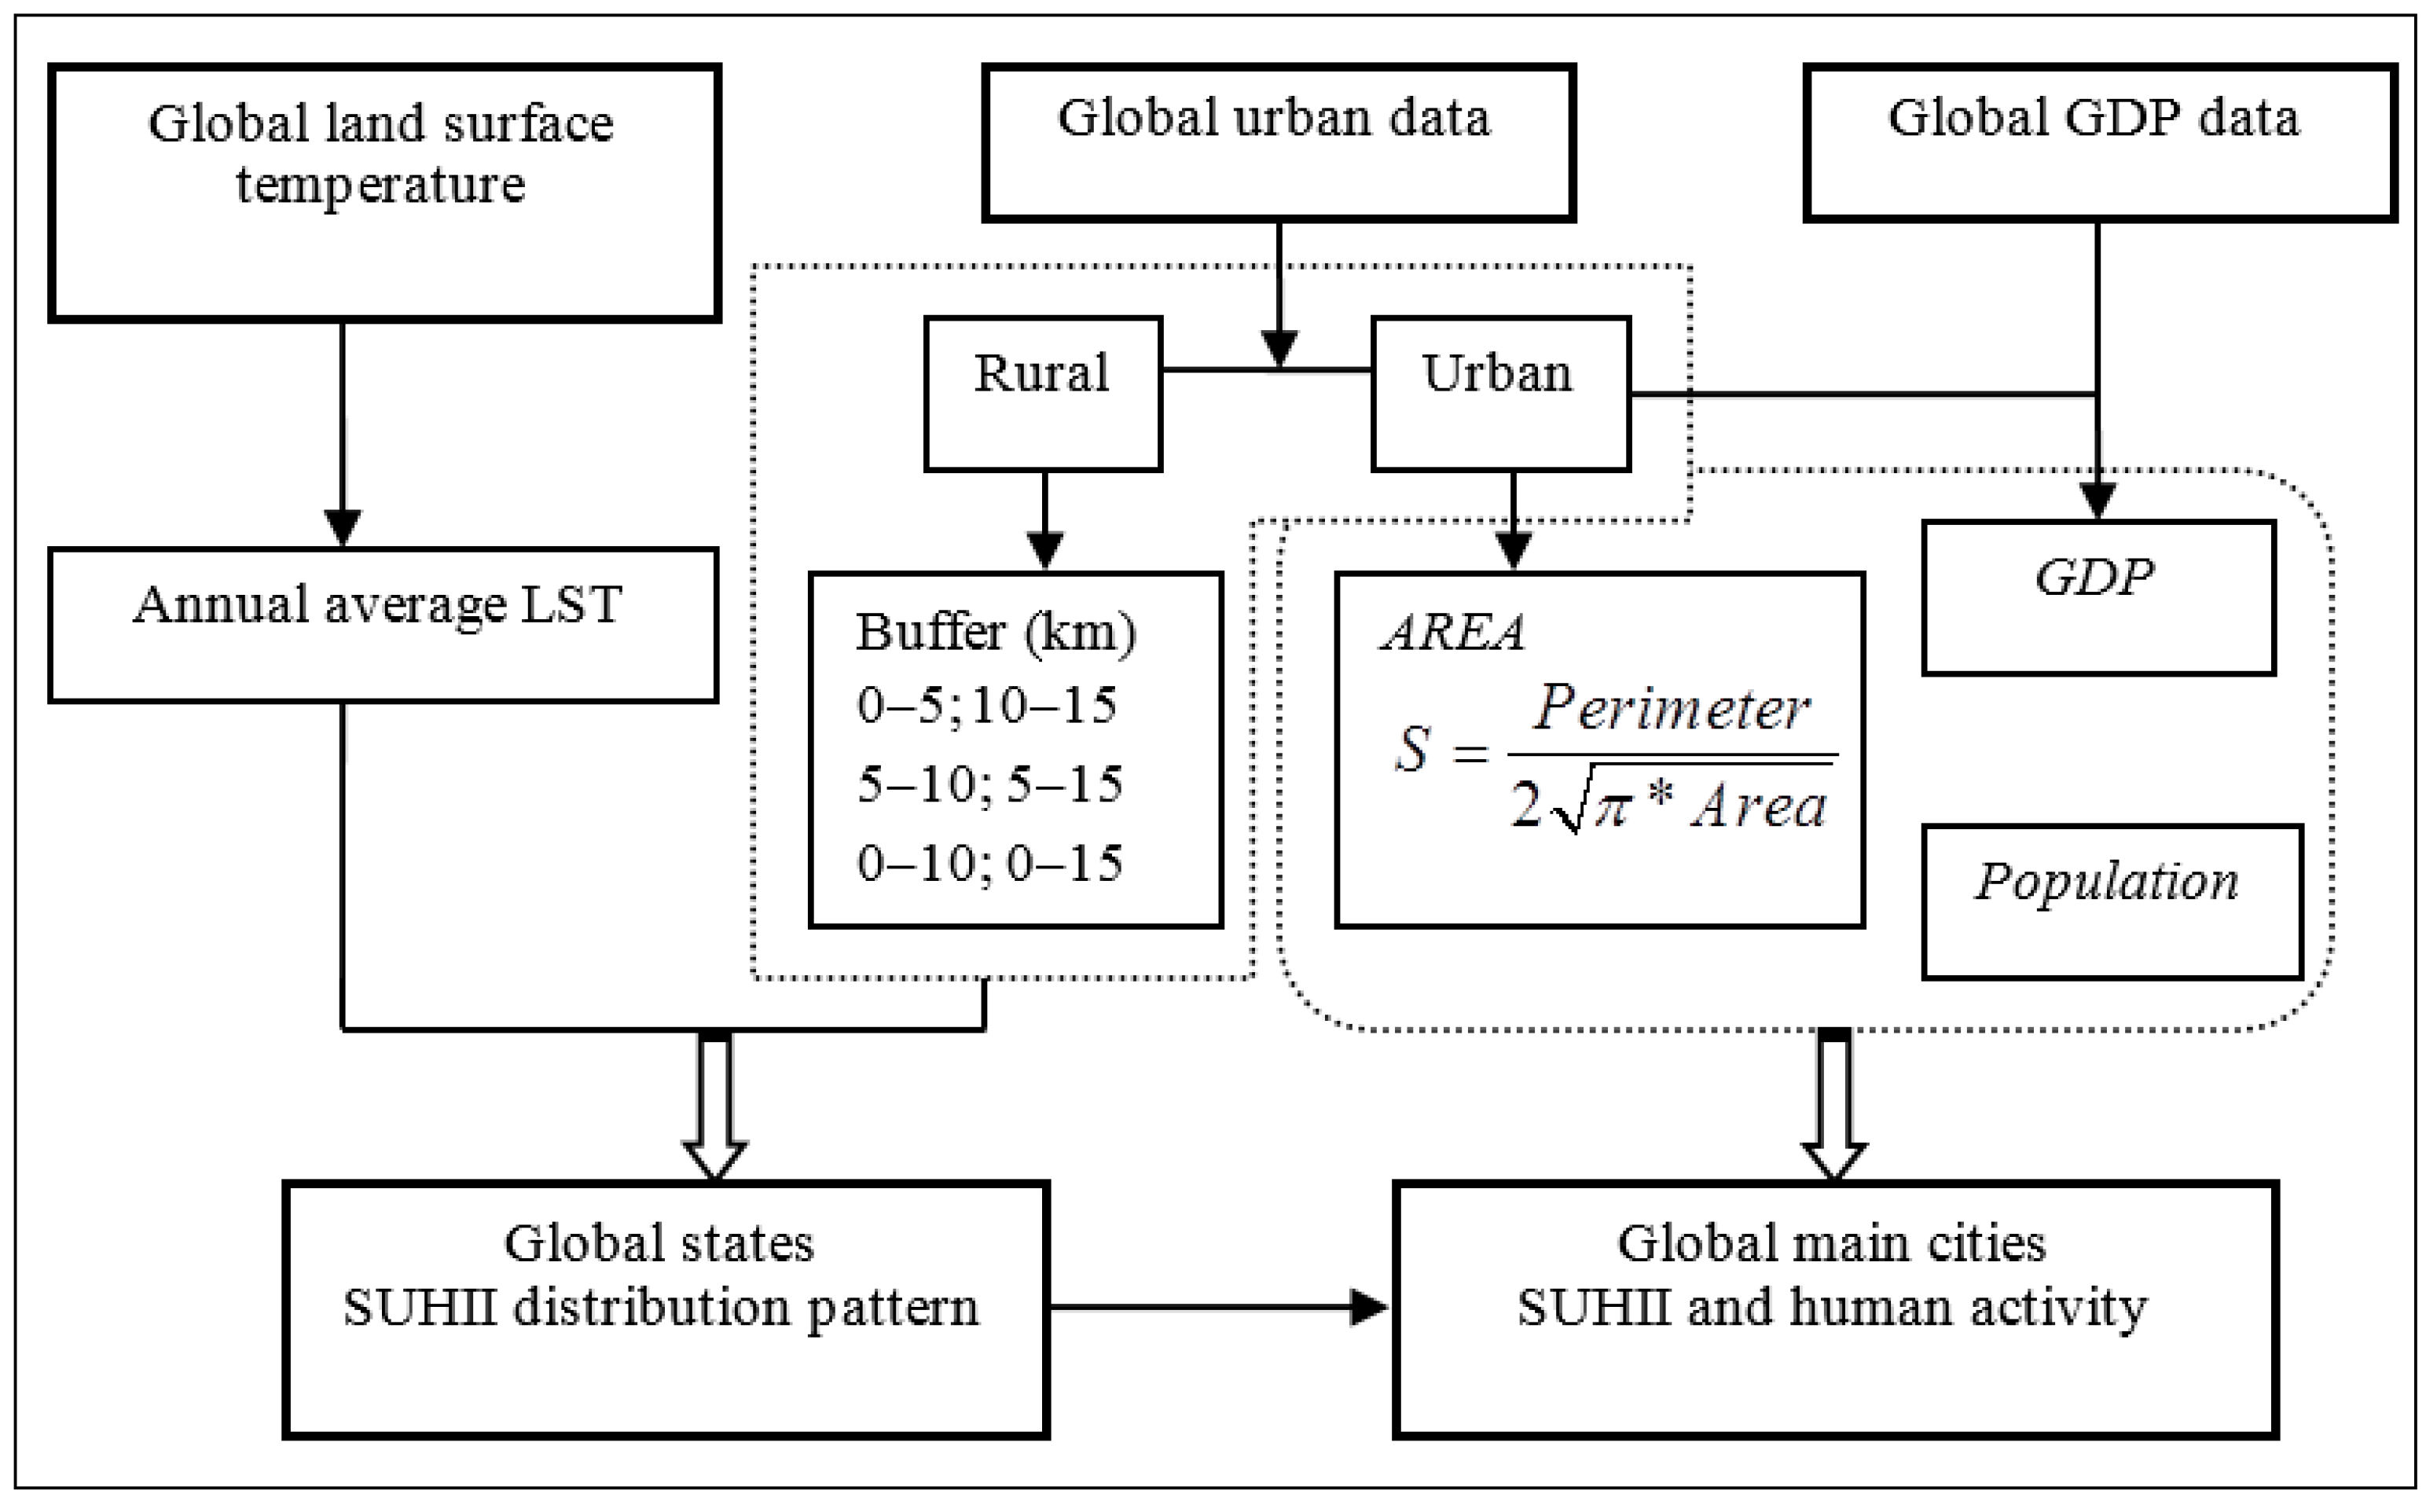
2. Data and Methods
3. Results and Analysis
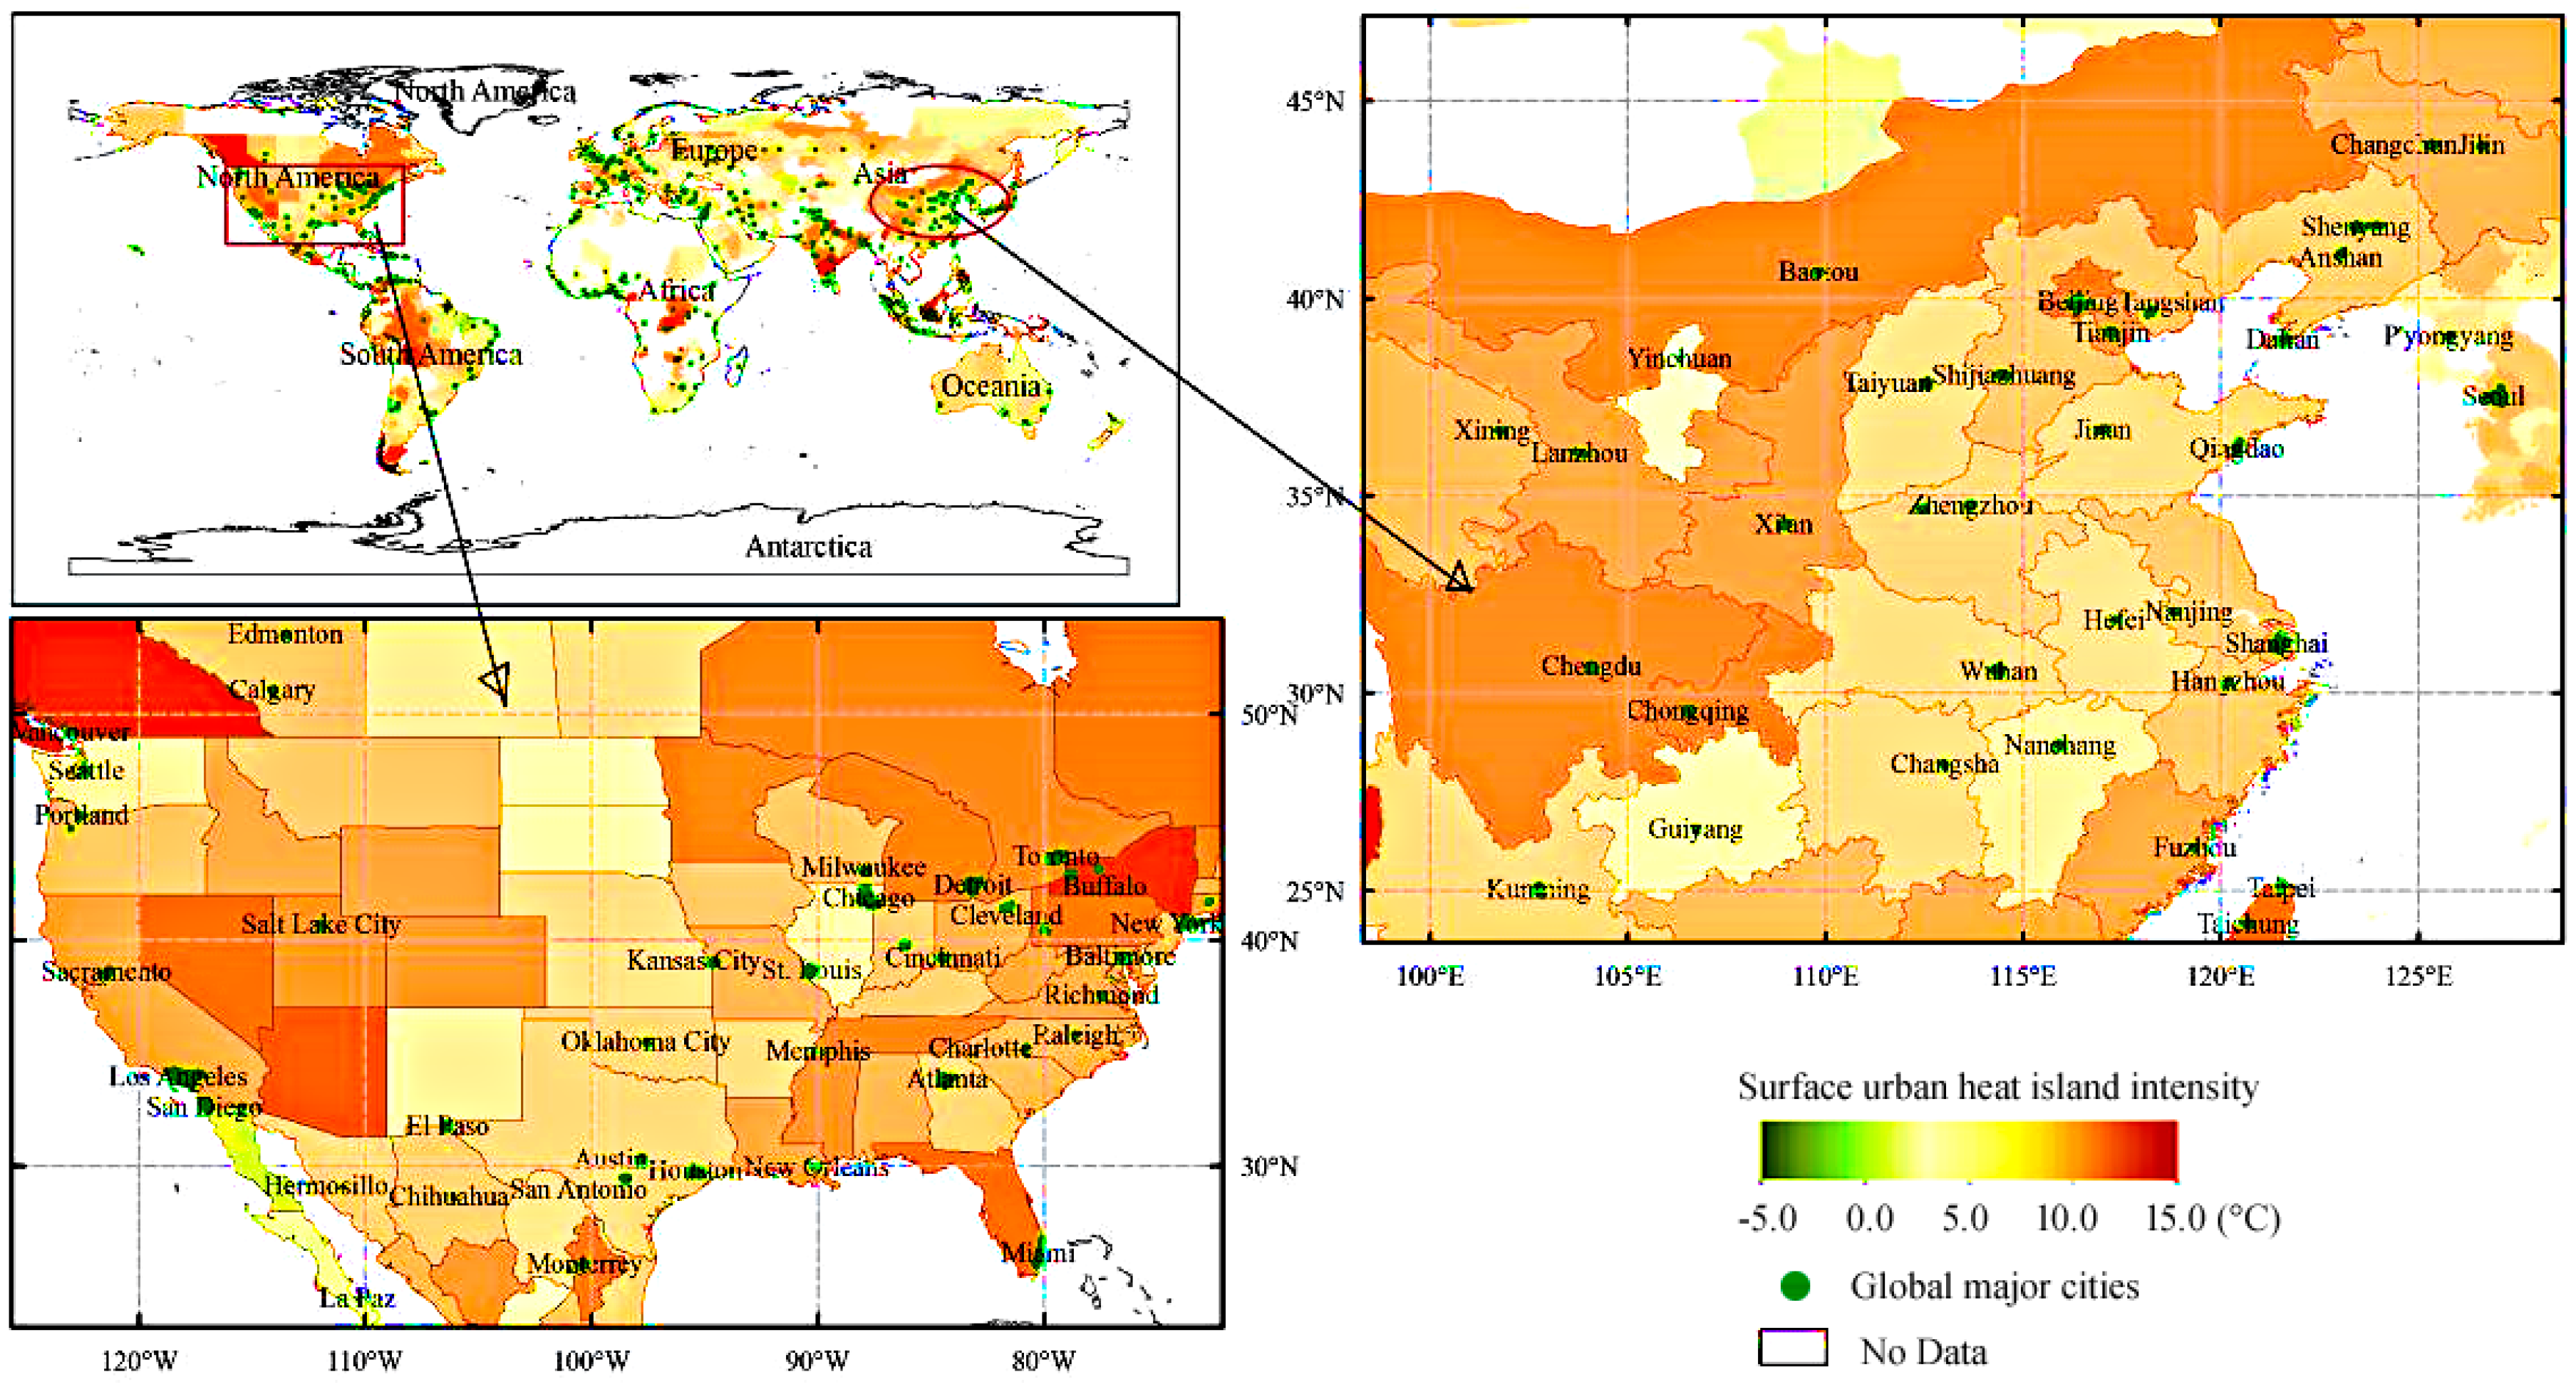
3.1. The Distribution Pattern of the SUHII
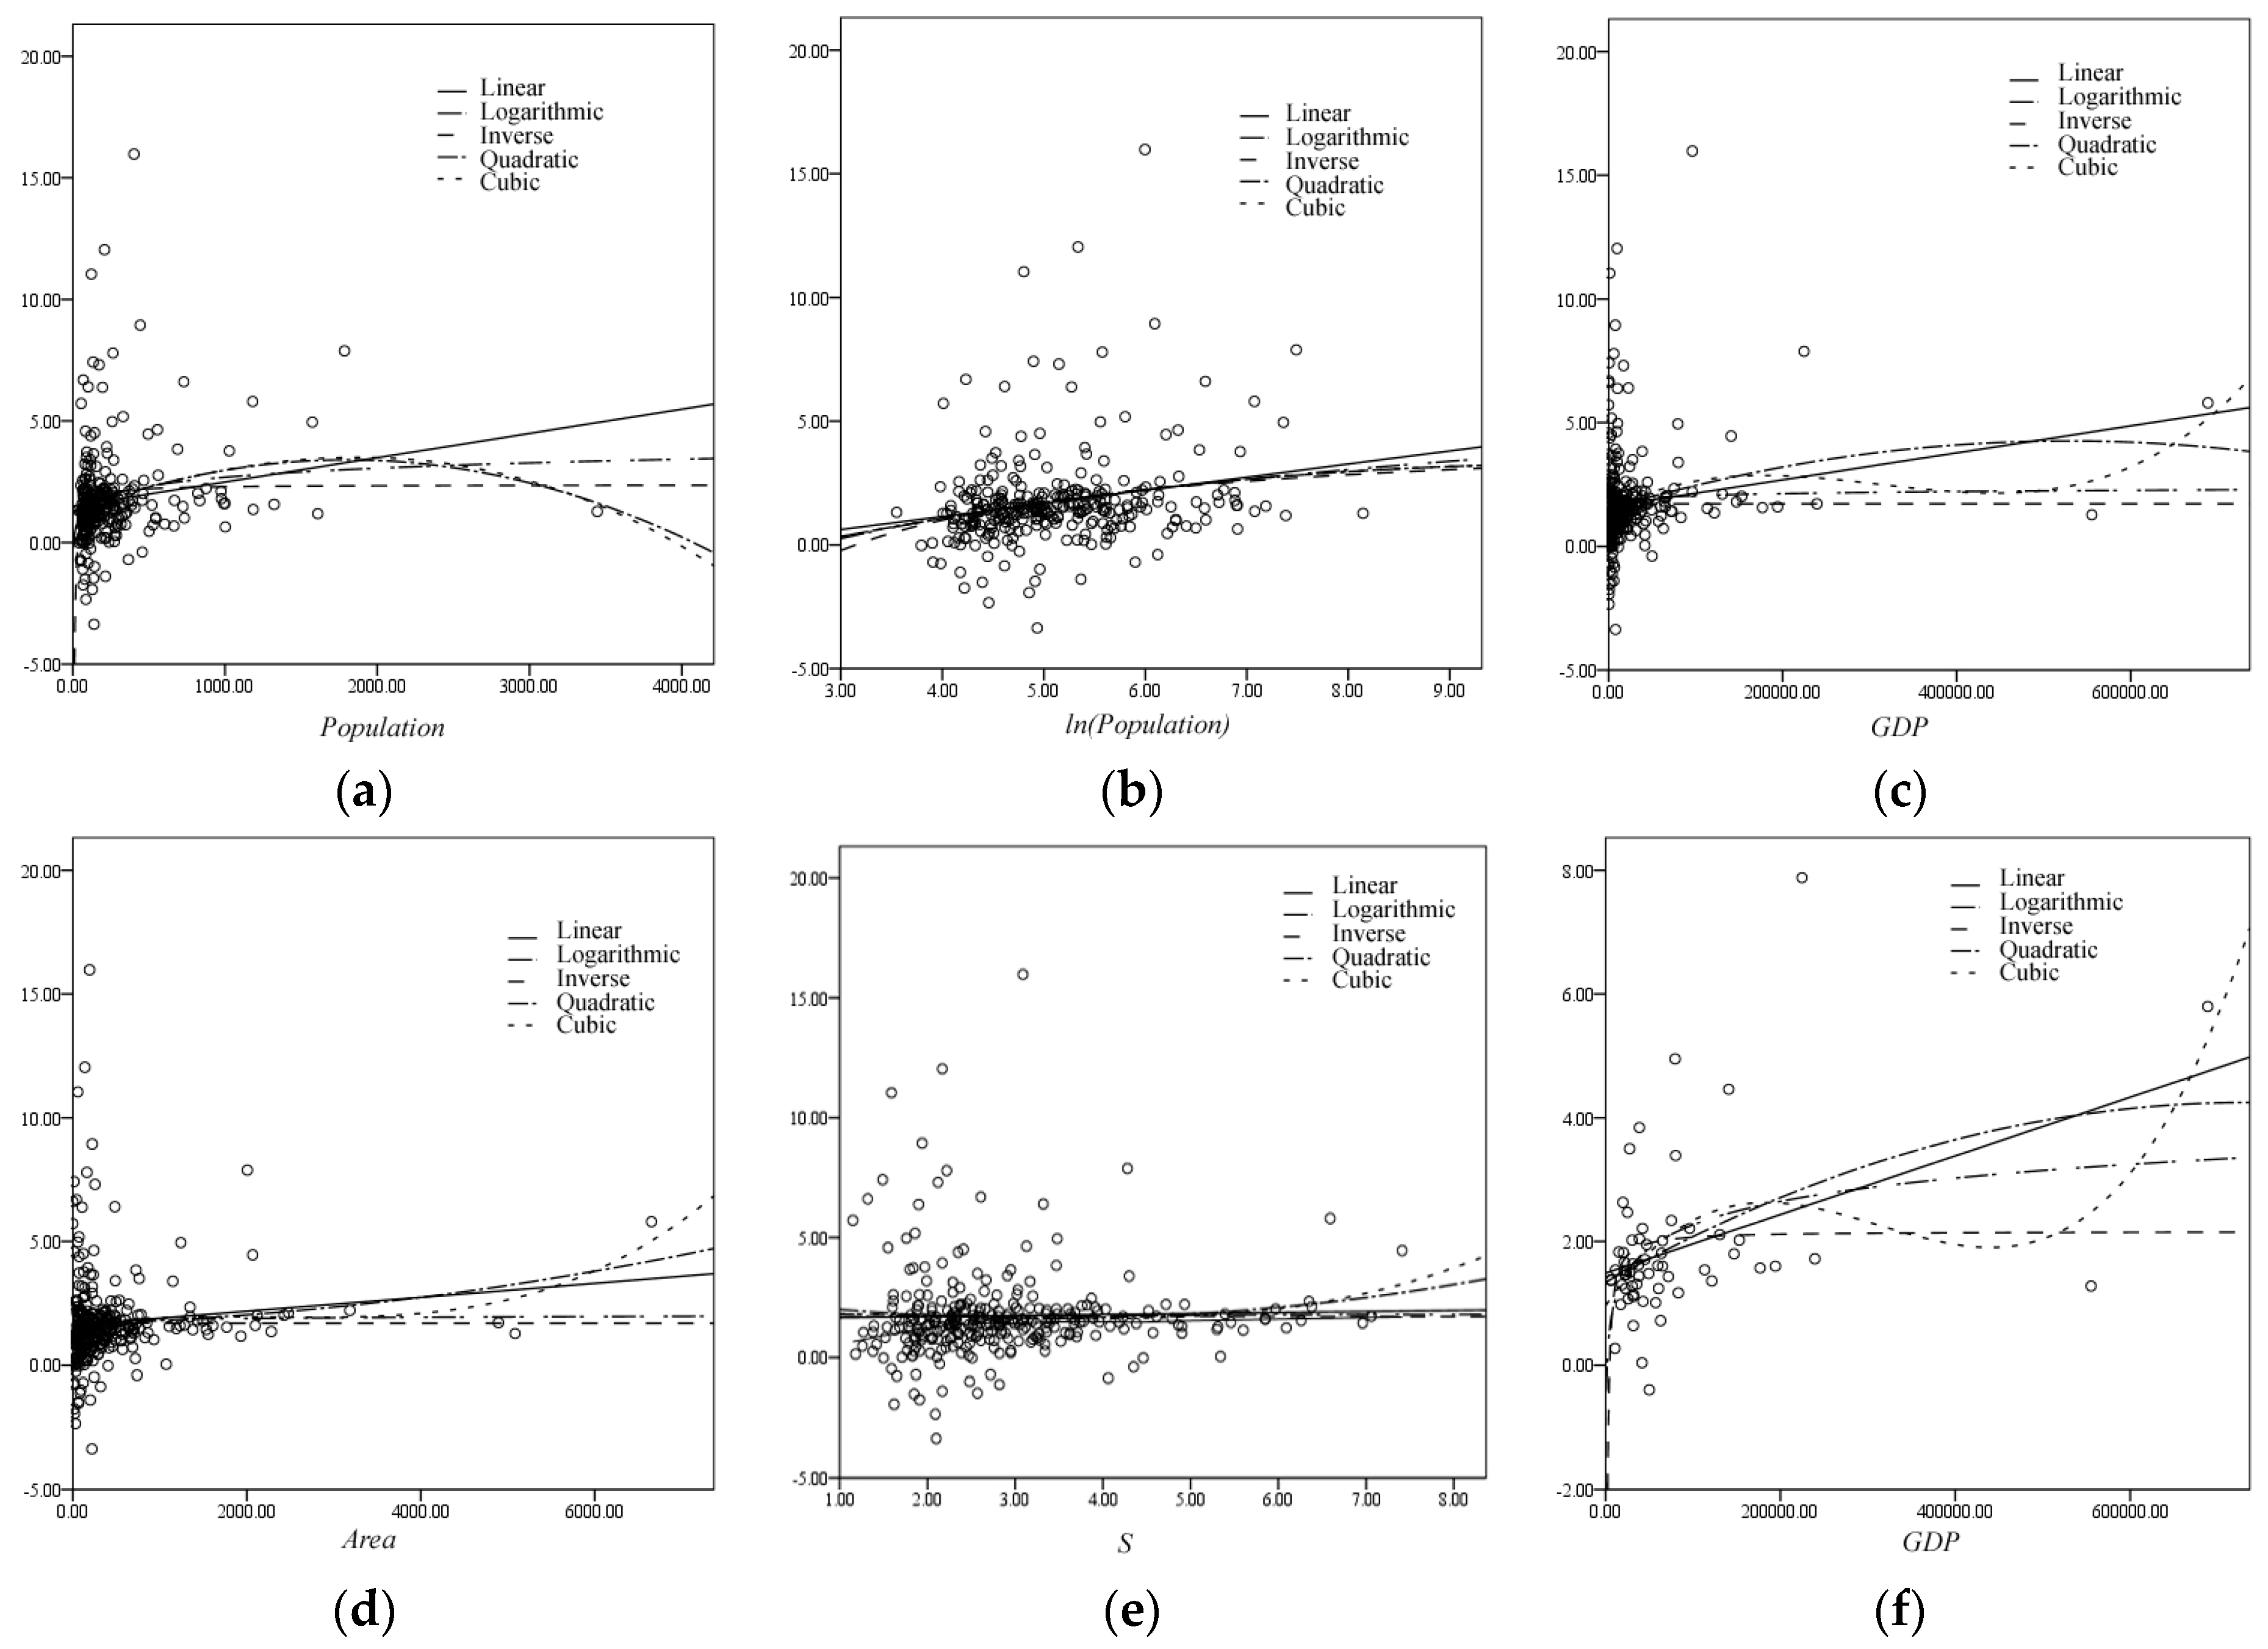
3.2. The Analysis of Global Cities
3.3. Comparison Analysis on China and the United States
4. Discussion
4.1. The Importance of Uniform Analysis Scale
4.2. Various Urbanization Factors among Countries at Different Developmental Stages
5. Conclusions
Acknowledgments
Author Contributions
Conflicts of Interest
References
- Schneider, A.; Friedl, M.A.; Potere, D. A new map of global urban extent from MODIS satellite data. Environ. Res. Lett. 2009, 4, 1–11. [Google Scholar] [CrossRef]
- Cui, Y.P.; Liu, J.Y.; Hu, Y.F.; Wang, J.B.; Kuang, W.H. Modeling the radiation balance of different urban underlying surfaces. Chin. Sci. Bull. 2012, 57, 1046–1054. [Google Scholar] [CrossRef]
- Seto, K.C.; Reenberg, A.; Boone, C.G.; Fragkias, M.; Haase, D.; Langanke, T.; Marcotullio, P.; Munroe, D.K.; Olah, B.; Simon, D. Urban land teleconnections and sustainability. Proc. Natl. Acad. Sci. USA 2012, 109, 7687–7692. [Google Scholar] [CrossRef] [PubMed]
- Zhao, S.Q.; Liu, S.G.; Zhou, D.C. Prevalent vegetation growth enhancement in urban environment. Proc. Natl. Acad. Sci. USA 2016, 113, 6313–6318. [Google Scholar] [CrossRef] [PubMed]
- Liu, J.Y.; Zhan, J.Y.; Deng, X.Z. Spatio-temporal patterns and driving forces of urban land expansion in China during the economic reform era. Ambio Chin. 2005, 34, 444–449. [Google Scholar] [CrossRef]
- Myint, S.W.; Zheng, B.J.; Talen, E.; Fan, C.; Kaplan, S.; Middel, A.; Smith, M.J.; Huang, H.P.; Brazel, A.J. Does the spatial arrangement of urban landscape matter? Examples of urban warming and cooling in Phoenix and Las Vegas. Ecosyst. Health Sust. 2015, 1, 1–15. [Google Scholar] [CrossRef]
- Alavipanah, S.; Wegmann, M.; Qureshi, S.; Weng, Q.; Koellner, T. The role of vegetation in mitigating urban land surface temperatures: A case study of munich, germany during the warm season. Sustainability 2015, 7, 4689–4706. [Google Scholar] [CrossRef]
- Zhou, L.M.; Dickinson, R.E.; Tian, Y.H.; Fang, J.Y.; Li, Q.X.; Kaufmann, R.K.; Tucker, C.J.; Myneni, R.B. Evidence for a significant urbanization effect on climate in China. Proc. Natl. Acad. Sci. USA 2004, 101, 9540. [Google Scholar] [CrossRef] [PubMed]
- Pickett, S.T.A.; Cadenasso, M.L.; Grove, J.M.; Nilon, C.H.; Pouyat, R.V.; Zipperer, W.C.; Costanza, R. Urban ecological systems: Linking terrestrial ecological, physical, and socioeconomic components of metropolitan areas. Annu. Rev. Ecol. Syst. 2001, 32, 127–157. [Google Scholar] [CrossRef]
- Kellerman, A.; Krakover, S. Multi-sectoral urban growth in space and time: An empirical approach. Reg. Stud. 1986, 20, 117–129. [Google Scholar] [CrossRef] [PubMed]
- Oke, T.R. City size and the urban heat island. Atmos. Environ. 1973, 7, 769–779. [Google Scholar] [CrossRef]
- Jones, P.D.; Groisman, P.Y.; Coughlan, M.; Plummer, N.; Wang, W.C.; Karl, T.R. Assessment of urbanization effects in time series of surface air temperature over land. Nature 1990, 347, 169–172. [Google Scholar] [CrossRef]
- Bottyán, Z.; Unger, J. A multiple linear statistical model for estimating the mean maximum urban heat island. Theor. Appl. Climatol. 2003, 75, 233–243. [Google Scholar]
- Gusso, A.; Cafruni, C.; Bordin, F.; Veronez, M.R.; Lenz, L.; Crija, S. Multi-temporal patterns of urban heat island as response to economic growth management. Sustainability 2015, 7, 3129–3145. [Google Scholar] [CrossRef]
- Weng, Q.H.; Lu, D.S.; Schubring, J. Estimation of land surface temperature-vegetation abundance relationship for urban heat island studies. Remote Sens. Environ. 2004, 89, 467–483. [Google Scholar] [CrossRef]
- Yuan, F.; Bauer, M.E. Comparison of impervious surface area and normalized difference vegetation index as indicators of surface urban heat island effects in Landsat imagery. Remote Sens. Environ. 2007, 106, 375–386. [Google Scholar] [CrossRef]
- Cao, X.; Onishi, A.; Chen, J.; Imura, H. Quantifying the cool island intensity of urban parks using ASTER and IKONOS data. Landsc. Urban Plan. 2010, 96, 224–231. [Google Scholar] [CrossRef]
- Essa, W.; van der Kwast, J.; Verbeiren, B.; Batelaan, O. Downscaling of thermal images over urban areas using the land surface temperature–impervious percentage relationship. Int. J. Appl. Earth Obs. Geoinform. 2013, 23, 95–108. [Google Scholar] [CrossRef]
- Li, J.; Song, C.; Cao, L.; Zhu, F.; Meng, X.; Wu, J. Impacts of landscape structure on surface urban heat islands: A case study of Shanghai, China. Remote Sens. Environ. 2011, 115, 3249–3263. [Google Scholar] [CrossRef]
- Zhou, W.; Huang, G.; Cadenasso, M.L. Does spatial configuration matter? Understanding the effects of land cover pattern on land surface temperature in urban landscapes. Landscape Urban Plan. 2011, 102, 54–63. [Google Scholar] [CrossRef]
- Zhou, W.; Qian, Y.; Li, X.; Li, W.; Han, L. Relationships between land cover and the surface urban heat island: Seasonal variability and effects of spatial and thematic resolution of land cover data on predicting land surface temperatures. Landsc. Ecol. 2014, 29, 153–167. [Google Scholar] [CrossRef]
- Hunga, T.; Uchihama, D.; Ochi, S.; Yasuoka, Y. Assessment with satellite data of the urban heat island effects in Asian mega cities. Int. J. Appl. Earth Obs. Geoinform. 2006, 8, 34–48. [Google Scholar]
- Nobis, M.P.; Jaeger, J.A.G.; Zimmermann, N.E. Neophyte species richness at the landscape scale under urban sprawl and climate warming. Divers. Distrib. 2009, 15, 928–939. [Google Scholar] [CrossRef]
- Wessels, K.J.; Prince, S.D.; Malherbe, J.; Small, J.; Frost, P.E.; VanZyl, D. Can human-induced land degradation be distinguished from the effects of rainfall variability? A case study in South Africa. J. Arid Environ. 2007, 68, 271–297. [Google Scholar] [CrossRef]
- Deng, X.Z.; Huang, J.K.; Lin, Y.Z.; Shi, Q.L. Interactions between climate, socioeconomics, and land dynamics in Qinghai province, China: A LUCD model-based numerical experiment. Adv. Meteorol. 2013, 297926, 1–9. [Google Scholar] [CrossRef]
- Jin, M.; Dickinson, R.E.; Zhang, D. The footprint of urban areas on global climate as characterized by MODIS. J. Clim. 2005, 18, 1551–1565. [Google Scholar] [CrossRef]
- Peng, S.; Piao, S.; Ciais, P.; Friedlingstein, P.; Ottle, C.; Bréon, F.M.; Nan, H.; Zhou, L.; Myneni, R.B. Surface urban heat island across 419 global big cities. Environ. Sci. Technol. 2012, 46, 696–703. [Google Scholar] [CrossRef] [PubMed]
- Clinton, N.; Gong, P. MODIS detected surface urban heat islands and sinks: Global locations and controls. Remote Sens. Environ. 2013, 134, 294–304. [Google Scholar] [CrossRef]
- Easterling, D.R.; Horton, B.; Jones, P.D.; Peterson, T.C.; Karl, T.R.; Parker, D.E.; Salinger, J.M.; Razuvayev, V.; Plummer, N.; Jamason, P.; et al. Maximum and minimum temperature trends for the globe. Science 1997, 277, 364–367. [Google Scholar] [CrossRef]
- Gallo, K.P.; Owen, T.W. Satellite-Based Adjustments for the Urban Heat Island Temperature Bias. J. Appl. Meteor. 1999, 38, 806–813. [Google Scholar] [CrossRef]
- Hansen, J.; Ruedy, R.; Sato, M.; Imhoff, M.; Lawrence, W.; Easterling, D.; Peterson, T.; Karl, T. A closer look at United States and global surface temperature change. J. Geophys. Res. 2001, 106, 23947–23963. [Google Scholar] [CrossRef]
- Deng, X.Z.; Zhao, C.H.; Lin, Y.Z.; Zhang, T.; Qu, Y.; Zhang, F.; Wang, Z.; Wu, F. Downscaling the Impacts of Large-Scale LUCC on Surface Temperature along with IPCC RCPs: A Global Perspective. Energies 2014, 7, 2720–2739. [Google Scholar] [CrossRef]
- Wan, Z.; Zhang, Y.; Zhang, Q.; Li, Z.L. Quality assessment and validation of the MODIS global land surface temperature. Int. J. Remote Sens. 2004, 25, 261–274. [Google Scholar] [CrossRef]
- Ghosh, T.; Powell, R.L.; Elvidge, C.D.; Anderson, S. Shedding Light on the Global Distribution of Economic Activity. Open Geophys. J. 2010, 3, 147–160. [Google Scholar]
- United Nations; Department of Economic and Social Affairs; Population Division. World Urbanization Prospects: The 2014 Revision, Highlights (ST/ESA/SER.A/352); United Nations: New York, NY, USA, 2014. [Google Scholar]
- Cui, Y.P.; Qin, Y.C. The spatial distribution of global urban heat island intensity and the influence of urban sprawl. In Proceedings of the 2013 21st International Conference on Geoinformatics, Kaifeng, China, 20–22 June 2013.
- Wang, J.K.; Wang, K.C.; Wang, P.C. Urban Heat (or Cool) Island over Beijing from MODIS Land Surface Temperature. J. Remote Sens. 2007, 11, 330–339. [Google Scholar]
- Chen, J.; Ban, Y.F.; Li, S.N. China: Open access to Earth land-cover map. Nature 2014, 514, 434. [Google Scholar]
- Elvidge, C.D.; Tuttle, B.T.; Sutton, P.C.; Baugh, K.E.; Howard, A.T.; Milesi, C.; Bhaduri, B.L.; Nemani, R. Global Distribution and Density of Constructed Impervious Surfaces. Sensors 2007, 7, 1962–1979. [Google Scholar] [CrossRef]
- Liu, Z.F.; He, C.Y.; Zhou, Y.Y.; Wu, J.G. How much of the world’s land has been urbanized, really? A hierarchical framework for avoiding confusion. Landsc. Ecol. 2014, 29, 763–771. [Google Scholar] [CrossRef]
- Ridd, M.K. Exploring a V-I-S (Vegetation-impervious surface-soil) model for urban ecosystem analysis through remote sensing: Comparative anatomy for cities. Int. J. Remote Sens. 1995, 16, 2165–2185. [Google Scholar] [CrossRef]
- Weng, Q. Remote sensing of impervious surfaces in the urban areas: Requirements, methods, and trends. Remote Sens. Environ. 2012, 117, 34–49. [Google Scholar] [CrossRef]
- Grover, A.; Singh, R.B. Analysis of urban heat island (UHI) in relation to normalized difference vegetation index (NDVI): A comparative study of Delhi and Mumbai. Environments 2015, 2, 125–138. [Google Scholar] [CrossRef]
- Wong, P.P.; Lai, P.; Low, C.; Chen, S.; Hart, M. The impact of environmental and human factors on urban heat and microclimate variability. Build. Environ. 2016, 95, 199–208. [Google Scholar] [CrossRef]
- Gallo, K.P.; Owen, T.W.; Easterling, D.R.; Jamason, P.F. Temperature trends of the US historical climatology network based on satellite-designated land use/land cover. J. Clim. 1999, 12, 1344–1348. [Google Scholar] [CrossRef]
- Griggs, D.J.; Noguer, M. Climate change 2001: The scientic basis. Contribution of working group I to the third assessment report of the Intergovernmental Panel on Climate Change. Weather 2002, 57, 267–269. [Google Scholar] [CrossRef]
- Li, Q.; Zhang, H.; Liu, X.; Huang, J. Urban heat island effect on annual mean temperature during the last 50 years in China. Theor. Appl. Climatol. 2004, 79, 165–174. [Google Scholar] [CrossRef]
- Xie, Z.Q.; Du, Y.; Zeng, Y.; Shi, Y.F.; Wu, J.G. Impact of urbanization on temperature change in the Yangtze River delta. J. Geogr. Sci. 2007, 62, 717–727. [Google Scholar]
- Shao, Q.Q.; Sun, C.Y.; Liu, J.Y.; Tao, F.L. Impact of urban expansion on meteorological observation data and overestimation to regional air temperature in China. J. Geogr. Sci. 2009, 64, 1292–1302. [Google Scholar] [CrossRef]
- Kolokotroni, M.; Giridharan, R. Urban heat island intensity in London: An investigation of the impact of physical characteristics on changes in outdoor air temperature during summer. Sol. Energy 2008, 82, 986–998. [Google Scholar] [CrossRef]
- Yokobori, T.; Ohta, S. Effect of land cover on air temperature involved in the development of an intra-urban heat island. Clim. Res. 2009, 39, 61–73. [Google Scholar] [CrossRef]
- Durbin, J.; Koopman, S.J. Time Series Analysis by State Space Methods; Oxford University Press: Oxford, UK, 2012. [Google Scholar]
- Blois, J.L.; Williams, J.W.; Fitzpatrick, M.C.; Jackson, S.T.; Ferrier, S. Space can substitute for time in predicting climate-change effects on biodiversity. Proc. Natl. Acad. Sci. USA 2013, 110, 9374–9379. [Google Scholar] [CrossRef] [PubMed]
- Zhao, S.Q.; Zhou, D.C.; Zhu, C.; Sun, Y.; Wu, W.J.; Liu, S.G. Spatial and temporal dimensions of urban expansion in China. Environ. Sci. Technol. 2015, 49, 9600–9609. [Google Scholar] [CrossRef] [PubMed]


| SUHII (Sig.) | Global Cities (n = 296) | Major Cities 1 (n = 62) | China 1 (n = 18) | USA 1 (n = 29) | ||||
|---|---|---|---|---|---|---|---|---|
| r | Sig. | r | Sig. | r | Sig. | r | Sig. | |
| Population | 0.164 | 0.002 | 0.324 | 0.005 | 0.668 | 0.001 | 0.681 | 0.000 |
| GDP | 0.168 | 0.002 | 0.418 | 0.000 | 0.557 | 0.008 | 0.758 | 0.000 |
| Area | 0.103 | 0.039 | 0.349 | 0.003 | 0.579 | 0.006 | 0.650 | 0.000 |
| S | 0.025 | 0.337 | 0.138 | 0.142 | 0.350 | 0.077 | 0.454 | 0.007 |
| China | USA | |||||
|---|---|---|---|---|---|---|
| Unstandardized Coefficients (B) | Standardized Coefficients (Beta) | Sig. | Unstandardized Coefficients (B) | Standardized Coefficients (Beta) | Sig. | |
| Constant | 1.391 | 6.427 | 1.257 | 0.031 | ||
| Area | 0.0001 | 0.208 | 0.869 | −0.0003 | −0.427 | 0.438 |
| S | −0.027 | −0.081 | 0.806 | 0.128 | 0.170 | 0.485 |
| Population | 0.001 | 1.715 | 0.042 | −0.0003 | −0.061 | 0.931 |
| GDP | −5.758 × 10⁻⁶ | −1.244 | 0.326 | 9.151 × 10⁻⁶ | 1.110 | 0.014 |
© 2016 by the authors; licensee MDPI, Basel, Switzerland. This article is an open access article distributed under the terms and conditions of the Creative Commons Attribution (CC-BY) license (http://creativecommons.org/licenses/by/4.0/).
Share and Cite
Cui, Y.; Xu, X.; Dong, J.; Qin, Y. Influence of Urbanization Factors on Surface Urban Heat Island Intensity: A Comparison of Countries at Different Developmental Phases. Sustainability 2016, 8, 706. https://doi.org/10.3390/su8080706
Cui Y, Xu X, Dong J, Qin Y. Influence of Urbanization Factors on Surface Urban Heat Island Intensity: A Comparison of Countries at Different Developmental Phases. Sustainability. 2016; 8(8):706. https://doi.org/10.3390/su8080706
Chicago/Turabian StyleCui, Yaoping, Xinliang Xu, Jinwei Dong, and Yaochen Qin. 2016. "Influence of Urbanization Factors on Surface Urban Heat Island Intensity: A Comparison of Countries at Different Developmental Phases" Sustainability 8, no. 8: 706. https://doi.org/10.3390/su8080706