1. Introduction
Energy-related CO
2 emissions account for 91% of the global anthropogenic CO
2 emissions [
1,
2]. Urban areas take up 3% of the Earth’s land surface, but sustain over 50% of the world’s population (which will sustainably grow to 66% by 2050) [
3] and 75% of energy-related CO
2 emissions [
4]. Thus, it seems extremely significant and urgent to constantly improve the accuracy of estimating energy consumption and related CO
2 emissions in urban areas.
This research constructs a 1 km × 1 km high resolution Shanghai energy consumption and carbon emission spatial grid data product, based on the previous greenhouse gas emission inventory compilation, mainly aiming at probing into the scientific interests and policy implications for establishing high-resolution energy and carbon emission data system in megacities [
4]. On the one hand, high-resolution energy-related CO
2 emission grid data constitute a priori information for scientifically estimating carbon fluxes in a certain area, and thus plays an important role in the accuracy of carbon flux estimation [
5]. Currently, there are many studies in the international community trying to analyze and simulate carbon cycle at global and regional scales, however, given that the global carbon cycle is easily influenced by the source and sink of carbon emissions from marine, terrestrial and other earth’s ecosystems, the work of measurement, reporting and verifying (MRV) of true emissions is very difficult [
6]. Carbon cycle study at a smaller scale (urban scale) may be easier to reveal the correlation between anthropogenic carbon emissions and the climate change [
7]. Urban areas constitute the most concentrated area for anthropogenic CO
2 emissions. So, estimating carbon fluxes in urban areas can minimize the effects of the source and sink of carbon emissions in the Earth’s ecosystems on the regional carbon cycle. On the other hand, urban areas are the leaders and drivers in human society to reduce anthropogenic CO
2 emissions [
8]. Now many cities have made energy-saving and emission-reducing policies, such as establishing the C40 cities climate leadership group to promote CO
2 emission reduction in urban areas [
9]. Among the others, how to scientifically and independently evaluate the effects of policies on emission-reducing becomes the most important challenge for policy-makers [
6]. Therefore, it is of great significance to provide more detailed urban carbon emission data with independent MRV process, for those policy makers to evaluate the carbon emission reductions resulted from policy implementation.
Now there are plenty of researches trying to establish high-resolution carbon emission data on the scale of urban level [
10]. A typical example is the Hestia Project conducted in the US, which aims at quantifying energy-related CO
2 emissions at the building and street scales [
11]. Currently, high-resolution carbon emission data have been established in four cities, namely Indianapolis, IN [
7], Los Angeles, CA [
12], Salt Lake City, UT [
5] and Baltimore, MD. Other cities, like Paris, France, have established high-resolution CO
2 emission data [
13]. Such studies indicate that regional CO
2 emission concentration trends can be more accurately predicted, by combining the bottom-up high-resolution energy-related CO
2 data with atmospheric retrieval method.
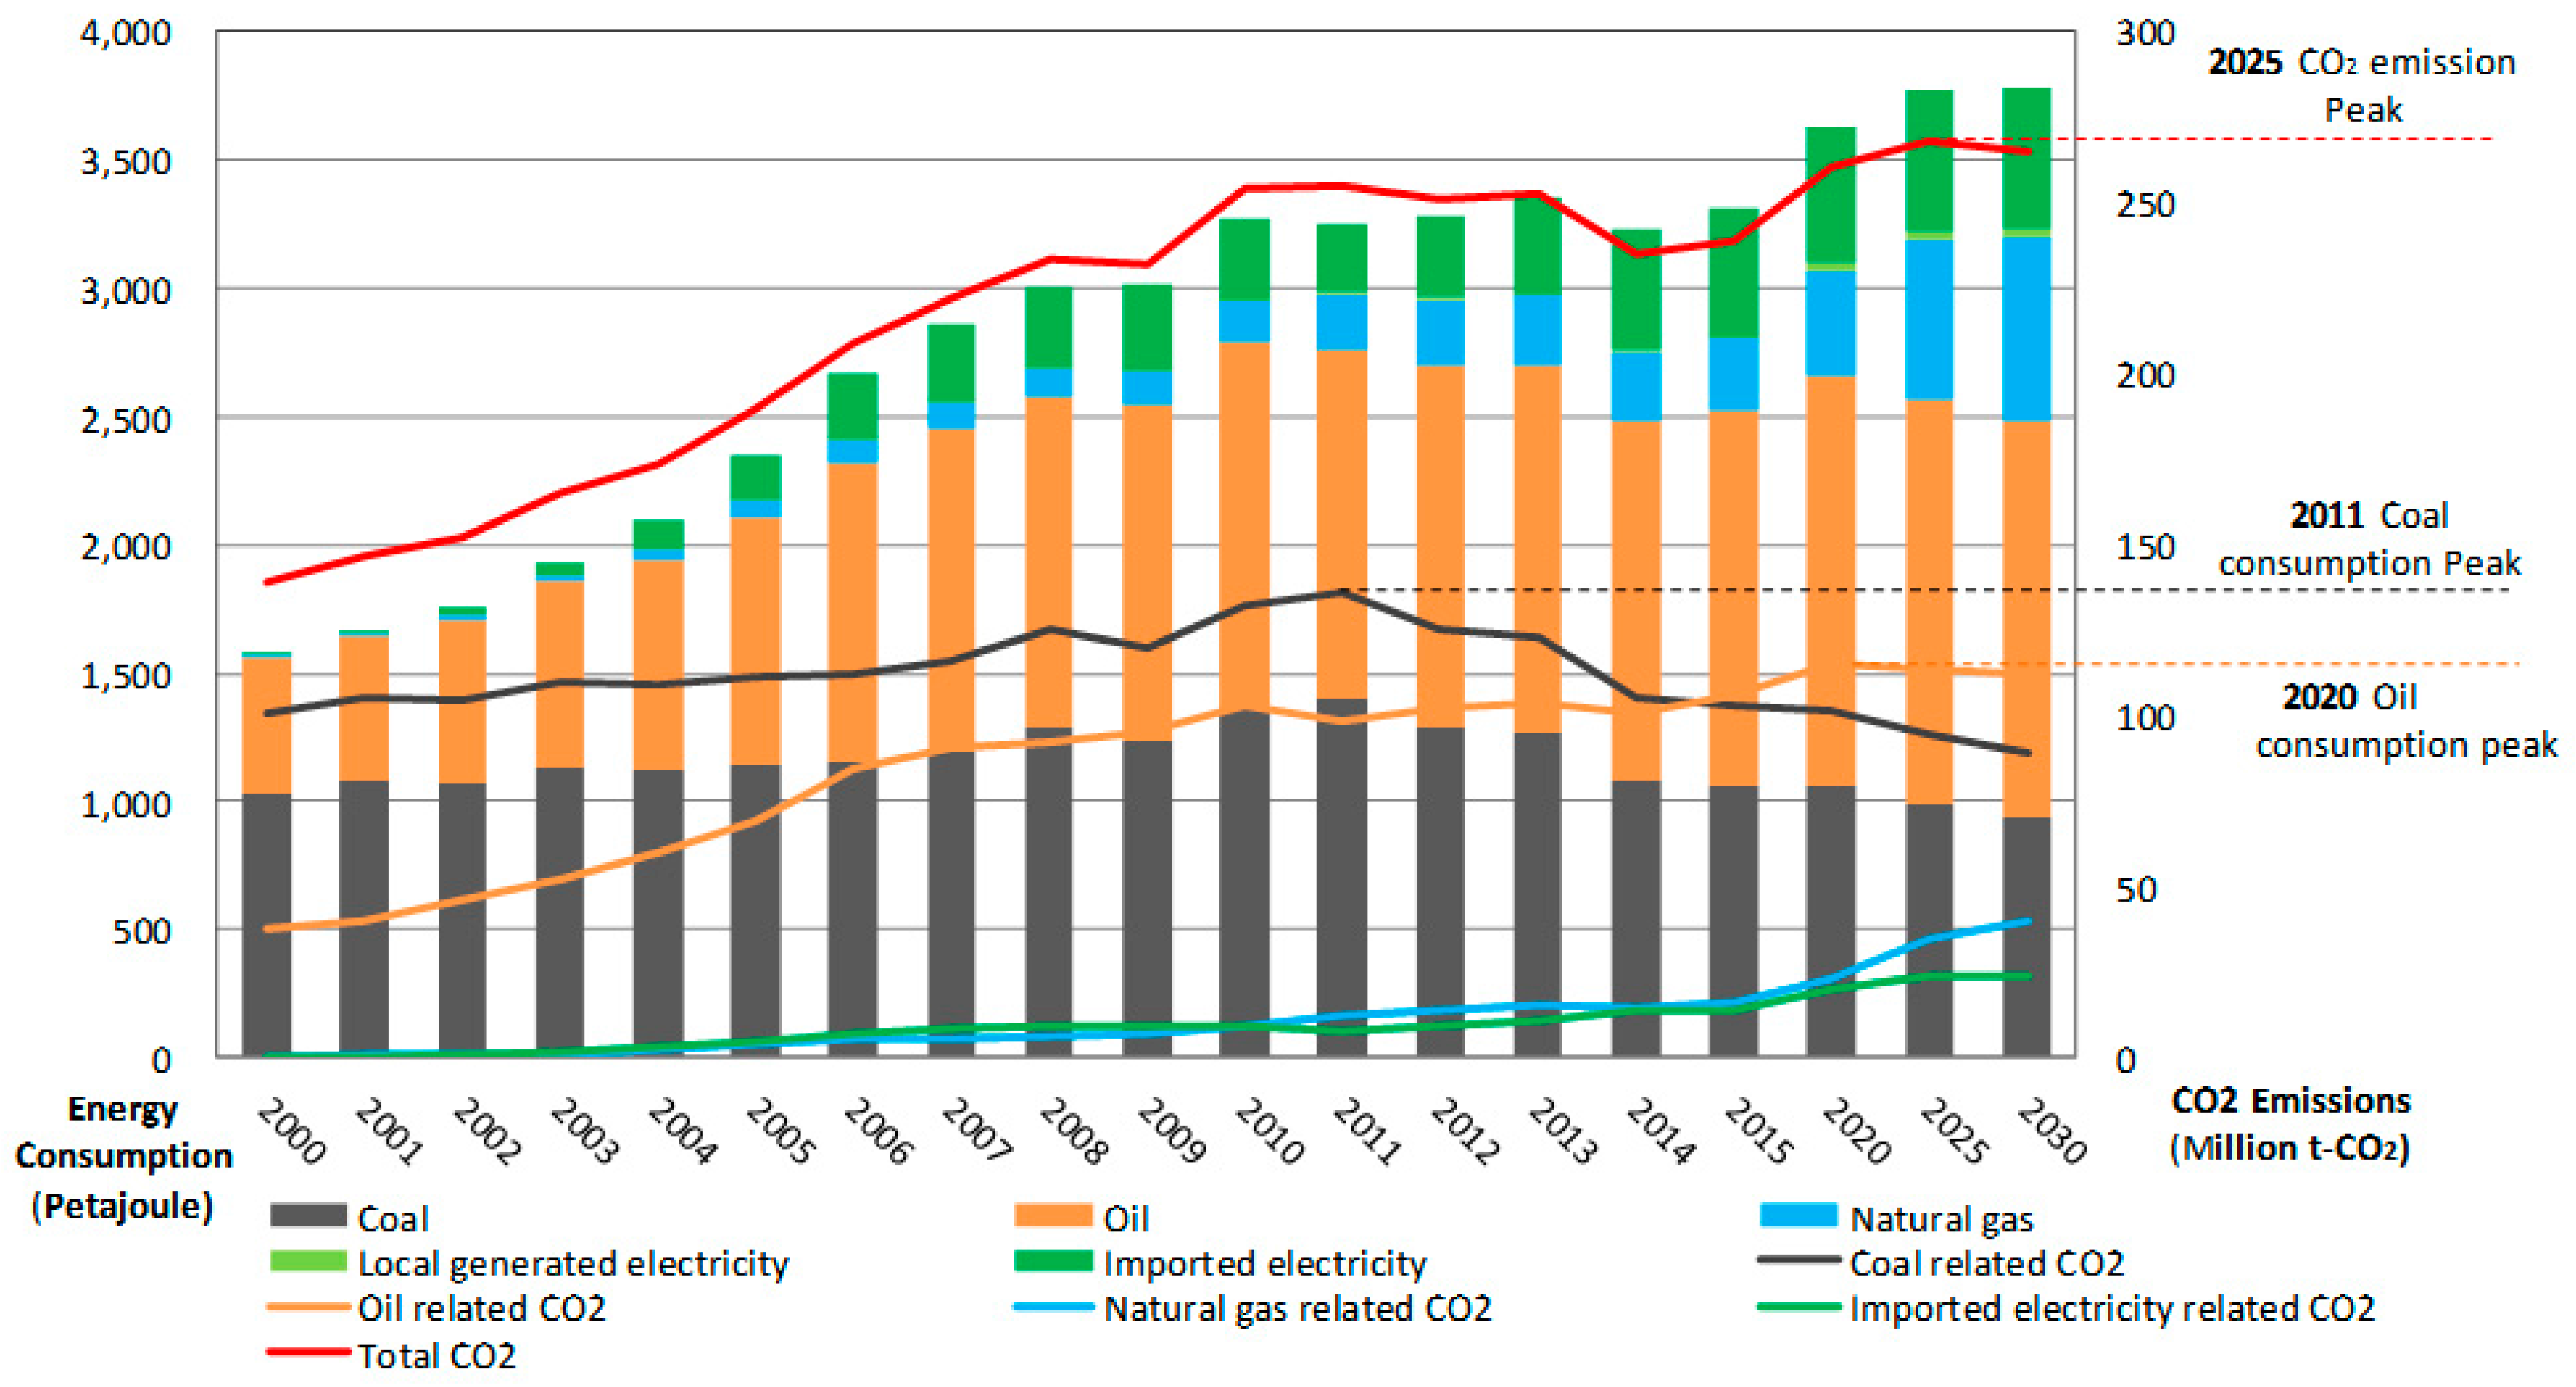
After a rapid rise in 2000–2010 with an annual average growth rate (AAGR) of 7.6%, the total Shanghai energy consumption entered a stationary phase, with AAGR of 0.3% in 2010–2015. But AAGR by energy type in the same period presents comparatively obvious distinctions, e.g., petroleum 0.5%, natural gas 11.8%, imported electricity 9.8%, and primary electricity 27.7%. As for coal consumption, it peaked in 2011 at 61.42 million tons (Mt) and dropped to 47.28 Mt in 2015, with AAGR −4.9% in the five years. Thereafter, Shanghai energy consumption and carbon emissions step into a controllable stage. In order to enhance the comparability and make policy performance clear, we take 2010 as the benchmark year and initial year, and construct a 1 km × 1 km Shanghai energy consumption and carbon emission spatial grid database.
Many researchers have studied Shanghai energy-related CO
2 emissions issues from various perspectives [
14,
15,
16], but most of these studies estimate the energy-related CO
2 emissions based on energy statistic data, which are too ambiguous and lack any spatial information. Cai et al. established high-resolution spatial distribution data of Shanghai CO
2 emissions based on the general pollutant investigation data [
17]. However, considering that the energy data contained in the general pollutant investigation are rather limited, and population distribution data are widely used as a proxy system to disaggregate emissions, the spatial distribution status of Shanghai energy-related CO
2 emissions thus cannot be well reflected.
This research selects Shanghai as a case study mainly for four reasons. First, Shanghai constitutes one of the uppermost megacities, occupying 6340 square kilometers and accommodating 24.26 million populations (in 2015), with great influence and representativeness. Second, compared to the frequently questioned national energy statistic data [
18,
19,
20,
21,
22], Shanghai energy statistic data are deemed to have better continuity, accuracy and transparency, which guarantees the higher data quality when taking Shanghai as an analysis case for energy and carbon emission spatial configuration in megacities. Third, Shanghai intends to build into a global city and specifically put forward its goal for carbon emissions control in the Shanghai City Master Plan (2016–2040) [
23], in which carbon emissions of the whole city and per capita will peak around 2025 and then total carbon emission will mitigate around 15% compared to the peak by 2040. Under such circumstance, high-resolution carbon emission data facilitates policy makers to set targeted energy-reducing policies. Last, China is now establishing a space-air-ground integrative monitor system for CO
2 concentration [
24]. Combining high-resolution energy-related CO
2 emission data with the atmospheric transmission mode and satellite monitoring data constitutes a key method of verifying CO
2 flux in the future. While high-resolution CO
2 emission data constitutes key a priori information for a space-air-ground CO
2 monitor system.
This paper includes the following three parts. The first part is about research method and data gridding, briefing the estimation method for energy-related CO2 emission and the basic data source, systematically elaborating the gridding method for 2010 Shanghai energy consumption and carbon emission data as well as the achievement. The second part analyzes Shanghai energy consumption and CO2 emission spatial configuration, by energy type, by usage type, and by facilities. The last part is to pointedly propose the policy suggestions and solutions, and to prospect the priorities and output during the next step work.
4. Conclusions and Policy Suggestions
Cities are the most concentrated areas for human manufacturing and living, as well as for energy consumption and anthropogenic CO2 emissions. It will enhance the focalization of energy-saving and emission-reducing in entire society by locating urban anthropogenic CO2 emission sources scientifically. This research constructs a Shanghai 1 km × 1 km high resolution energy consumption and carbon emissions spatial grid data product via a “bottom-up” approach for the year of 2010, based on the detailed energy data, population distribution data and GDP data. Such gridded data can reveal the spatial configuration of Shanghai energy consumption and carbon emission by usage type and energy type, and provide decision-making basis and data foundation so as to estimate Shanghai energy-related CO2 emission more accurately and to set out a reasonable plan of urban sustainable development. The conclusions of this research are listed as below:
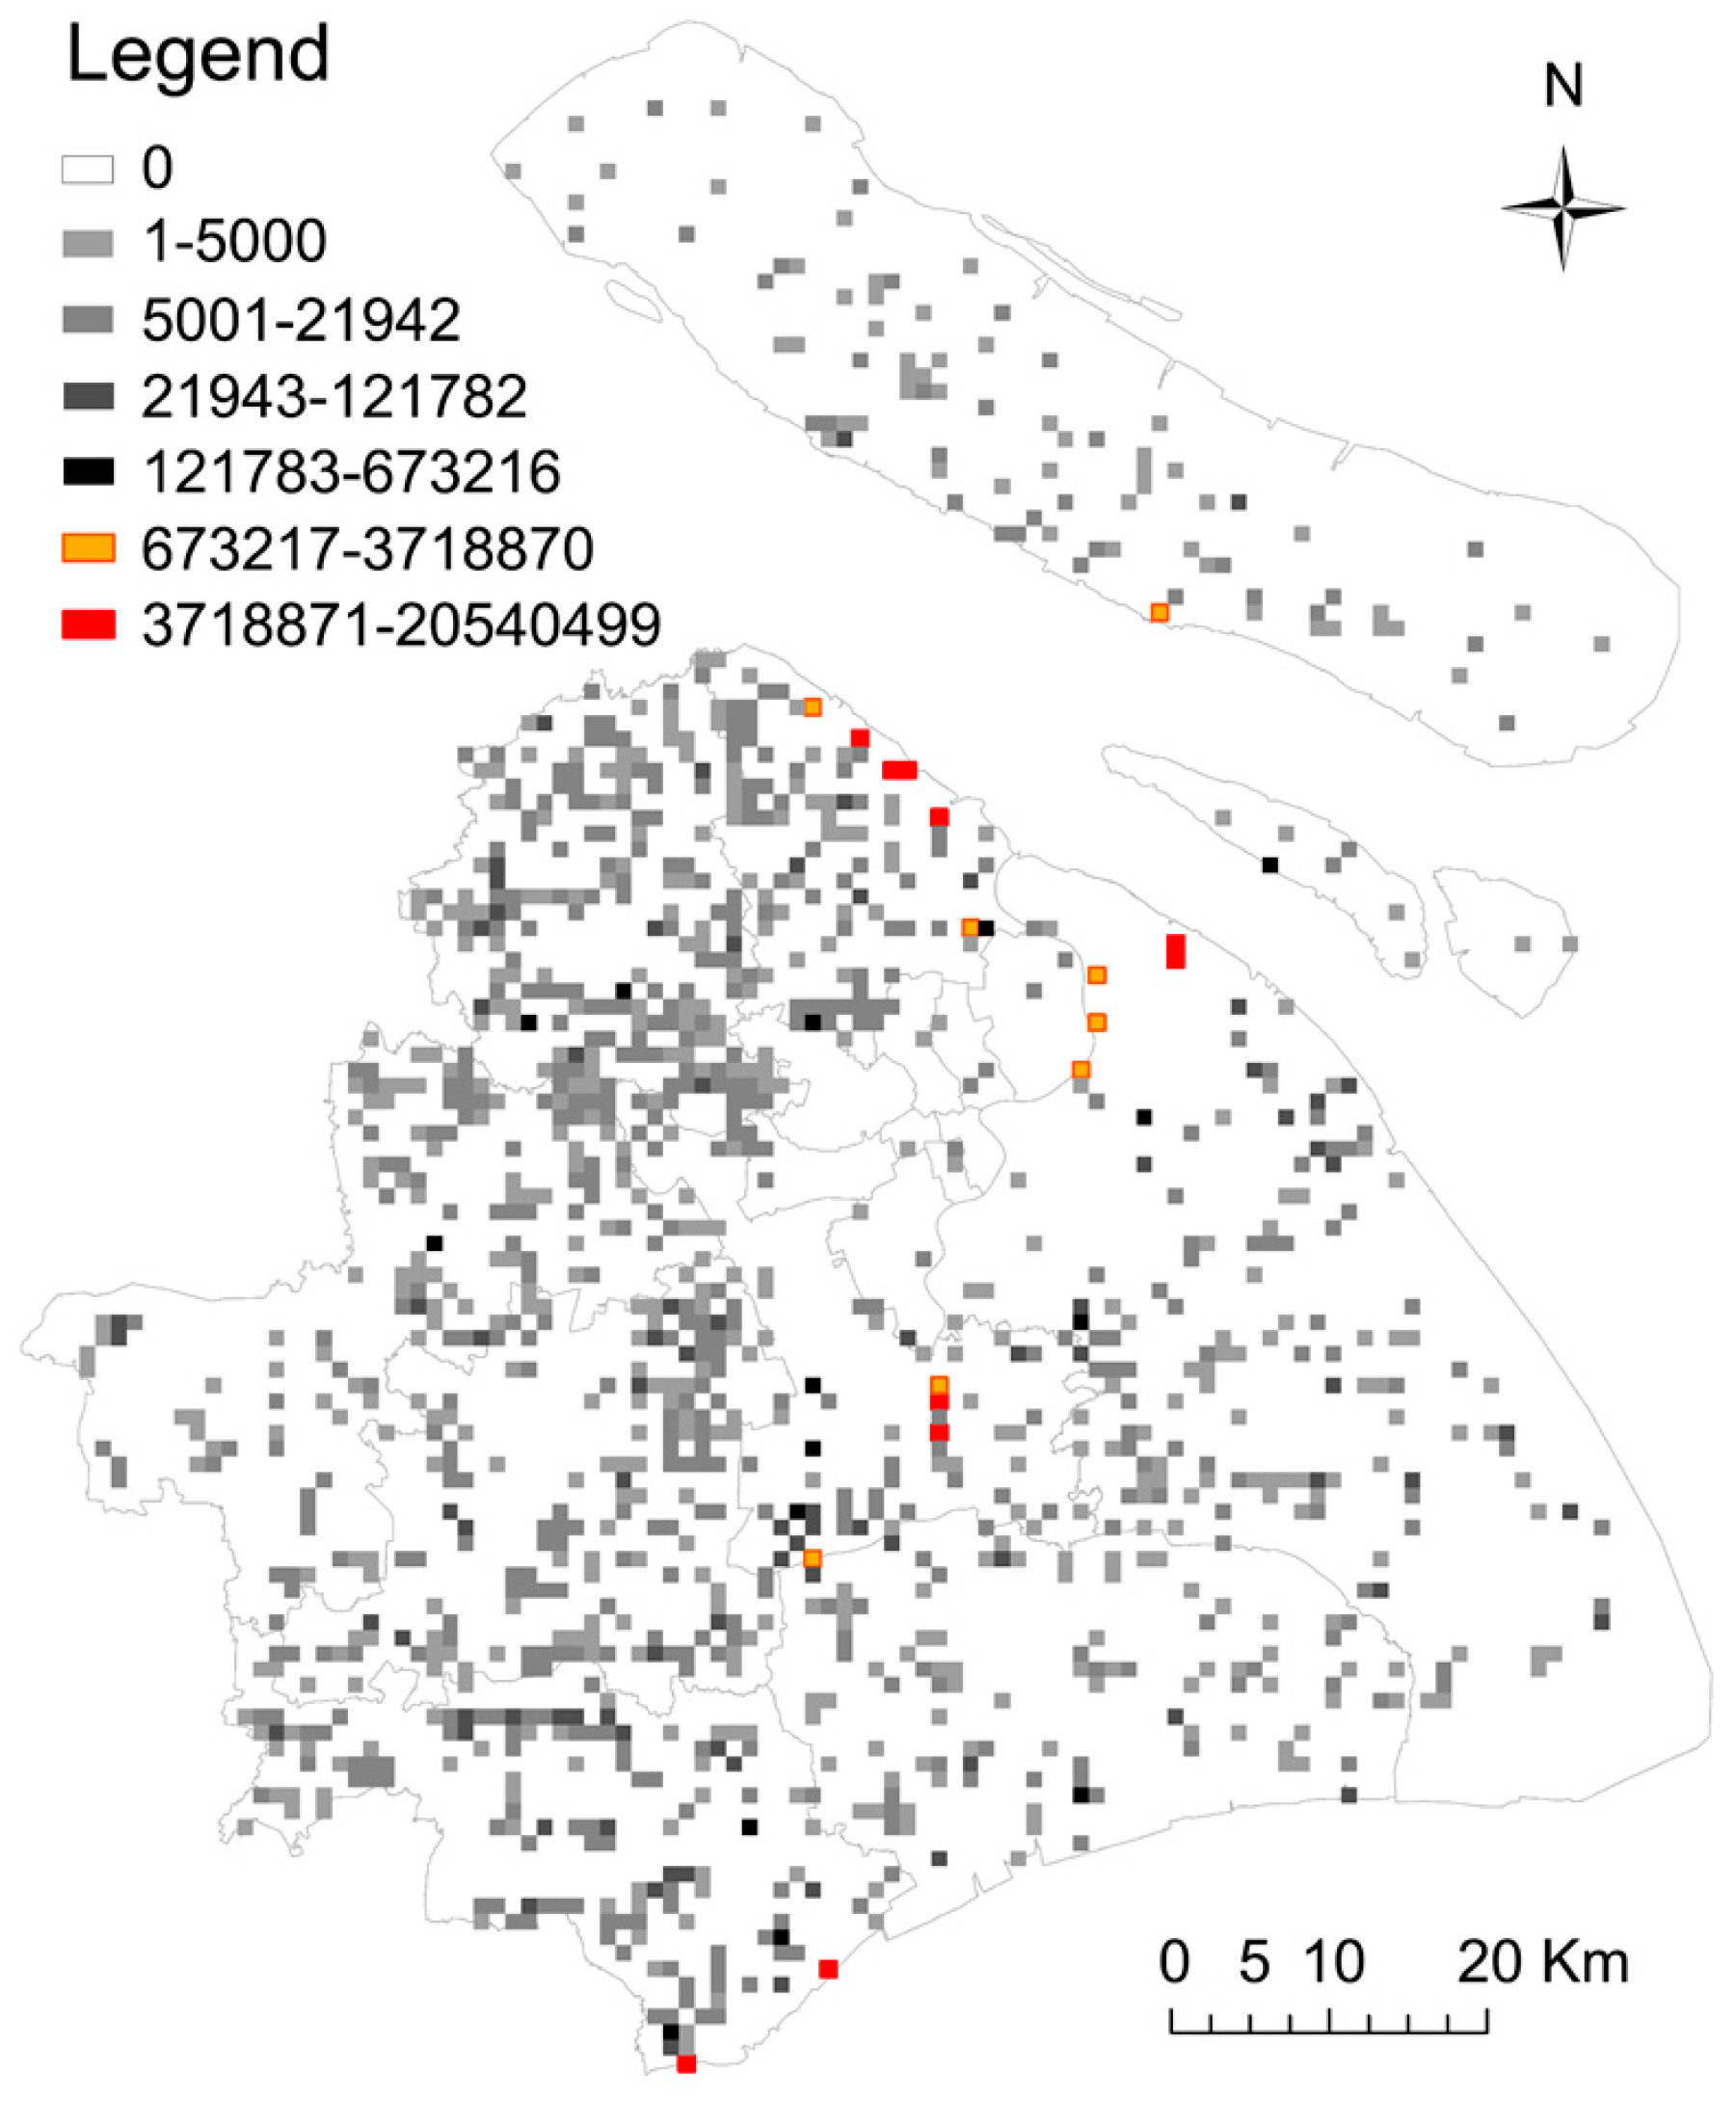
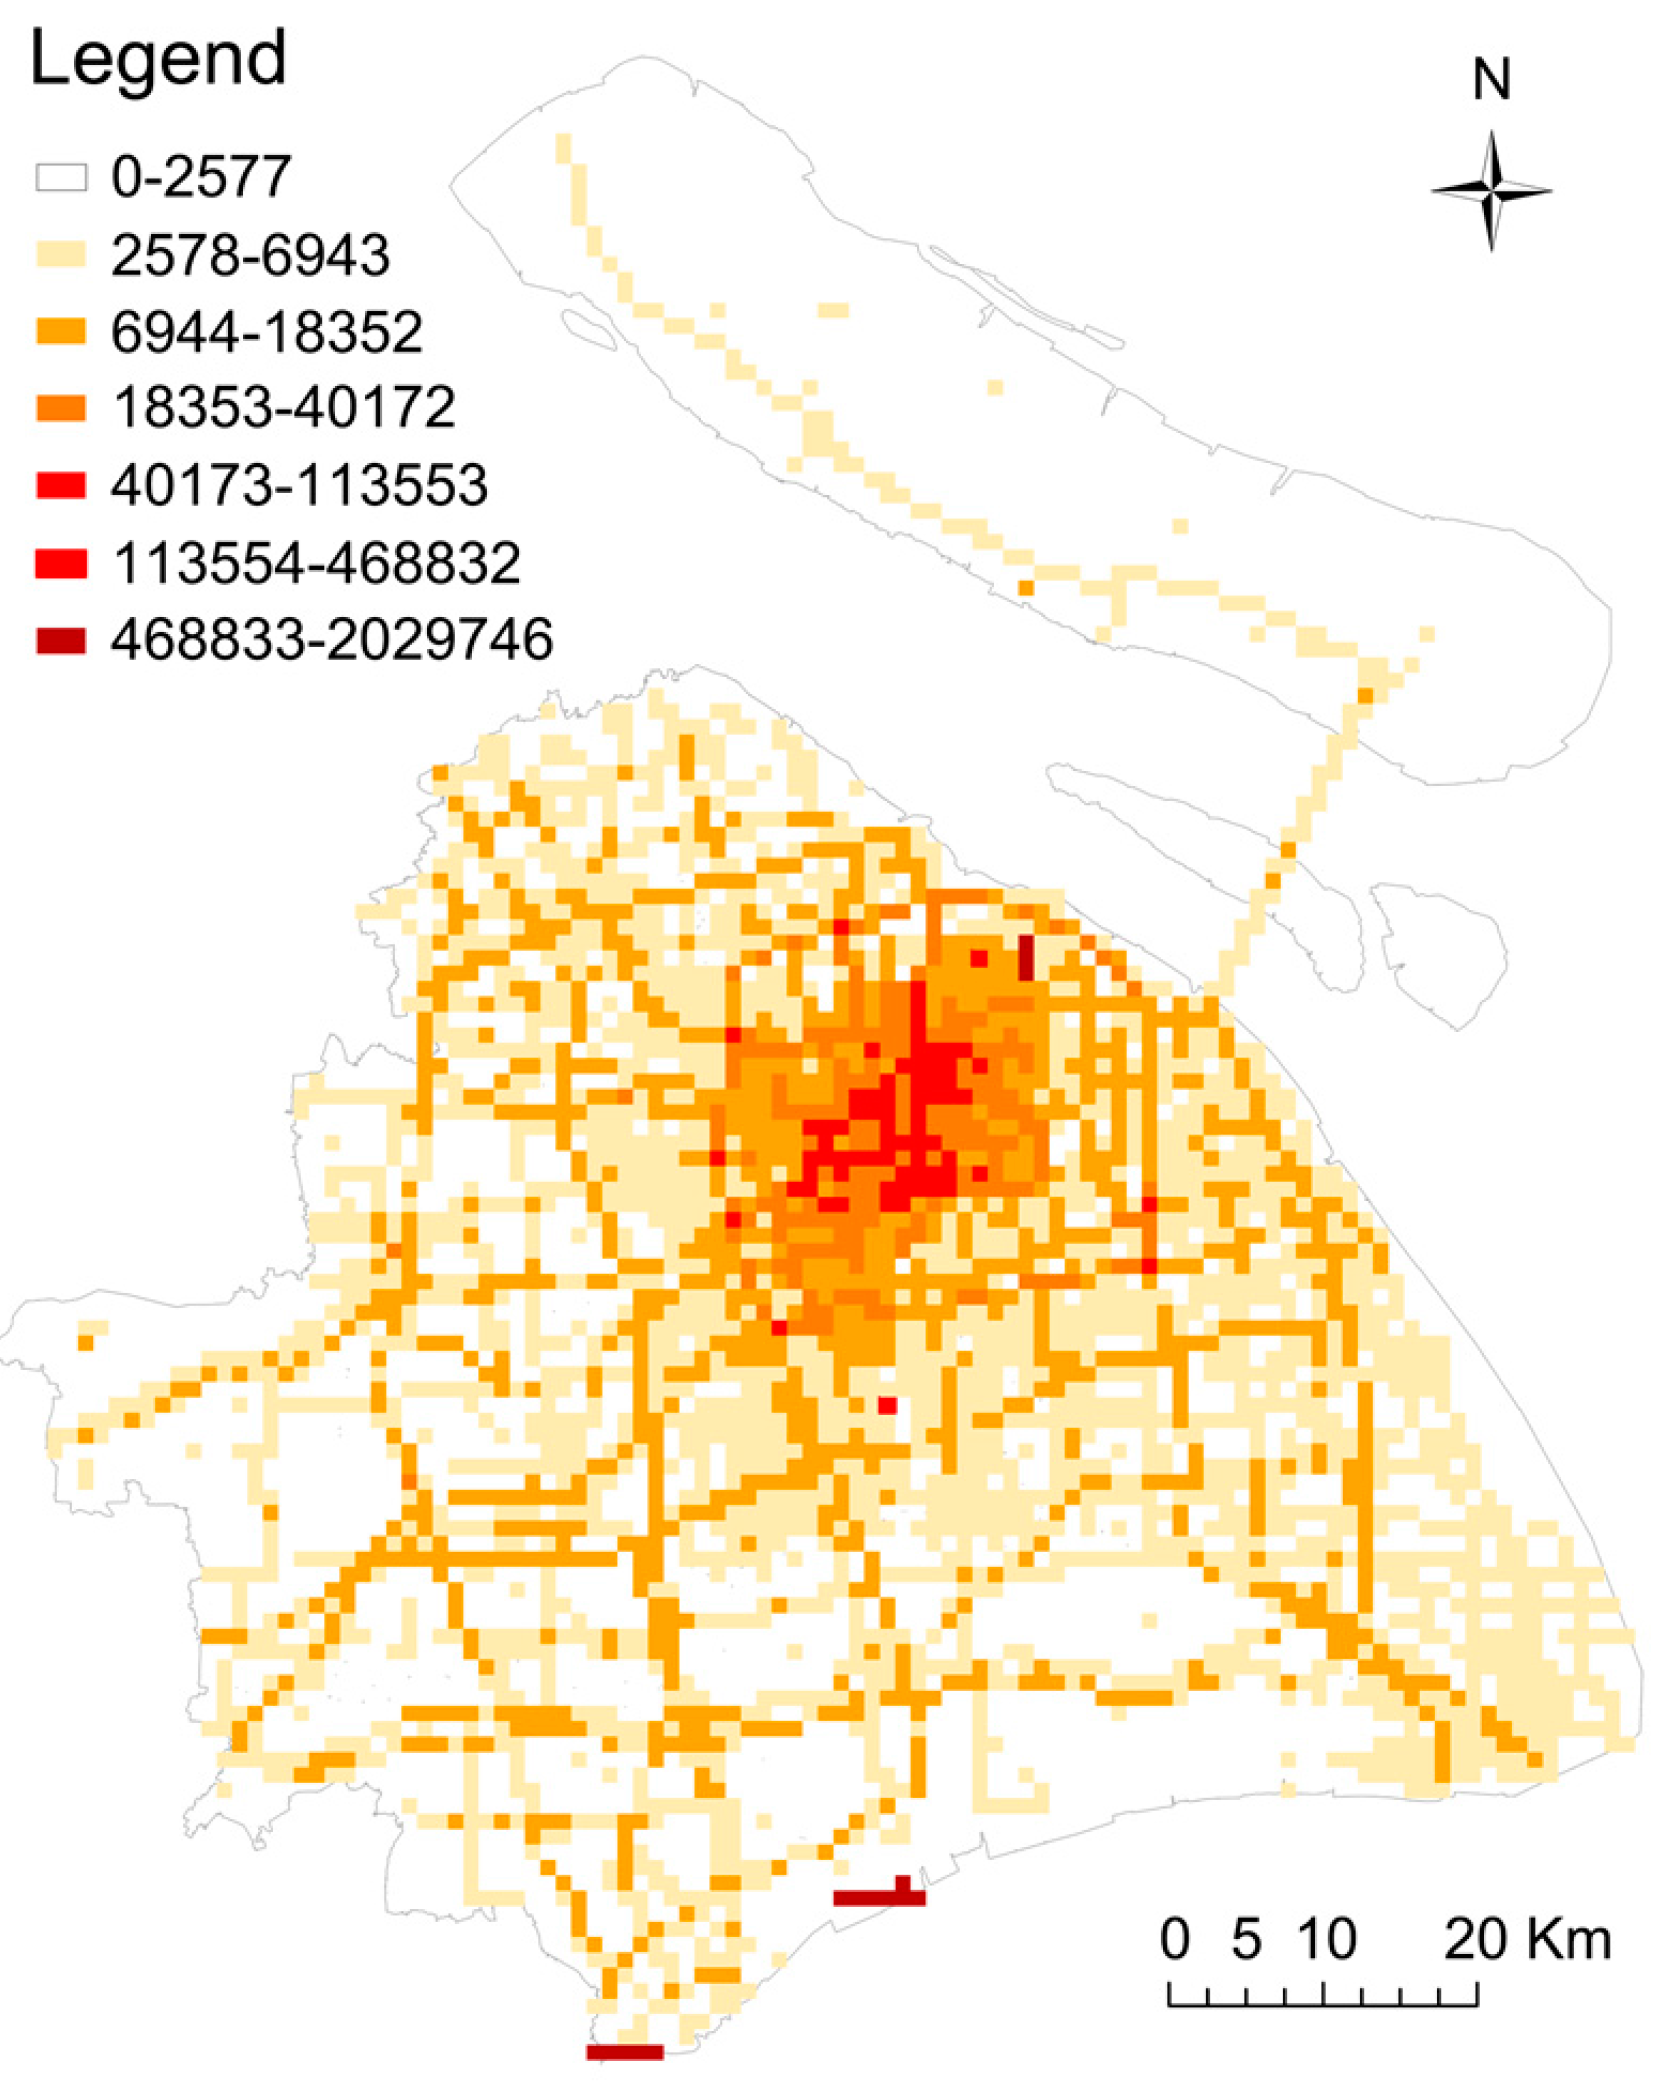
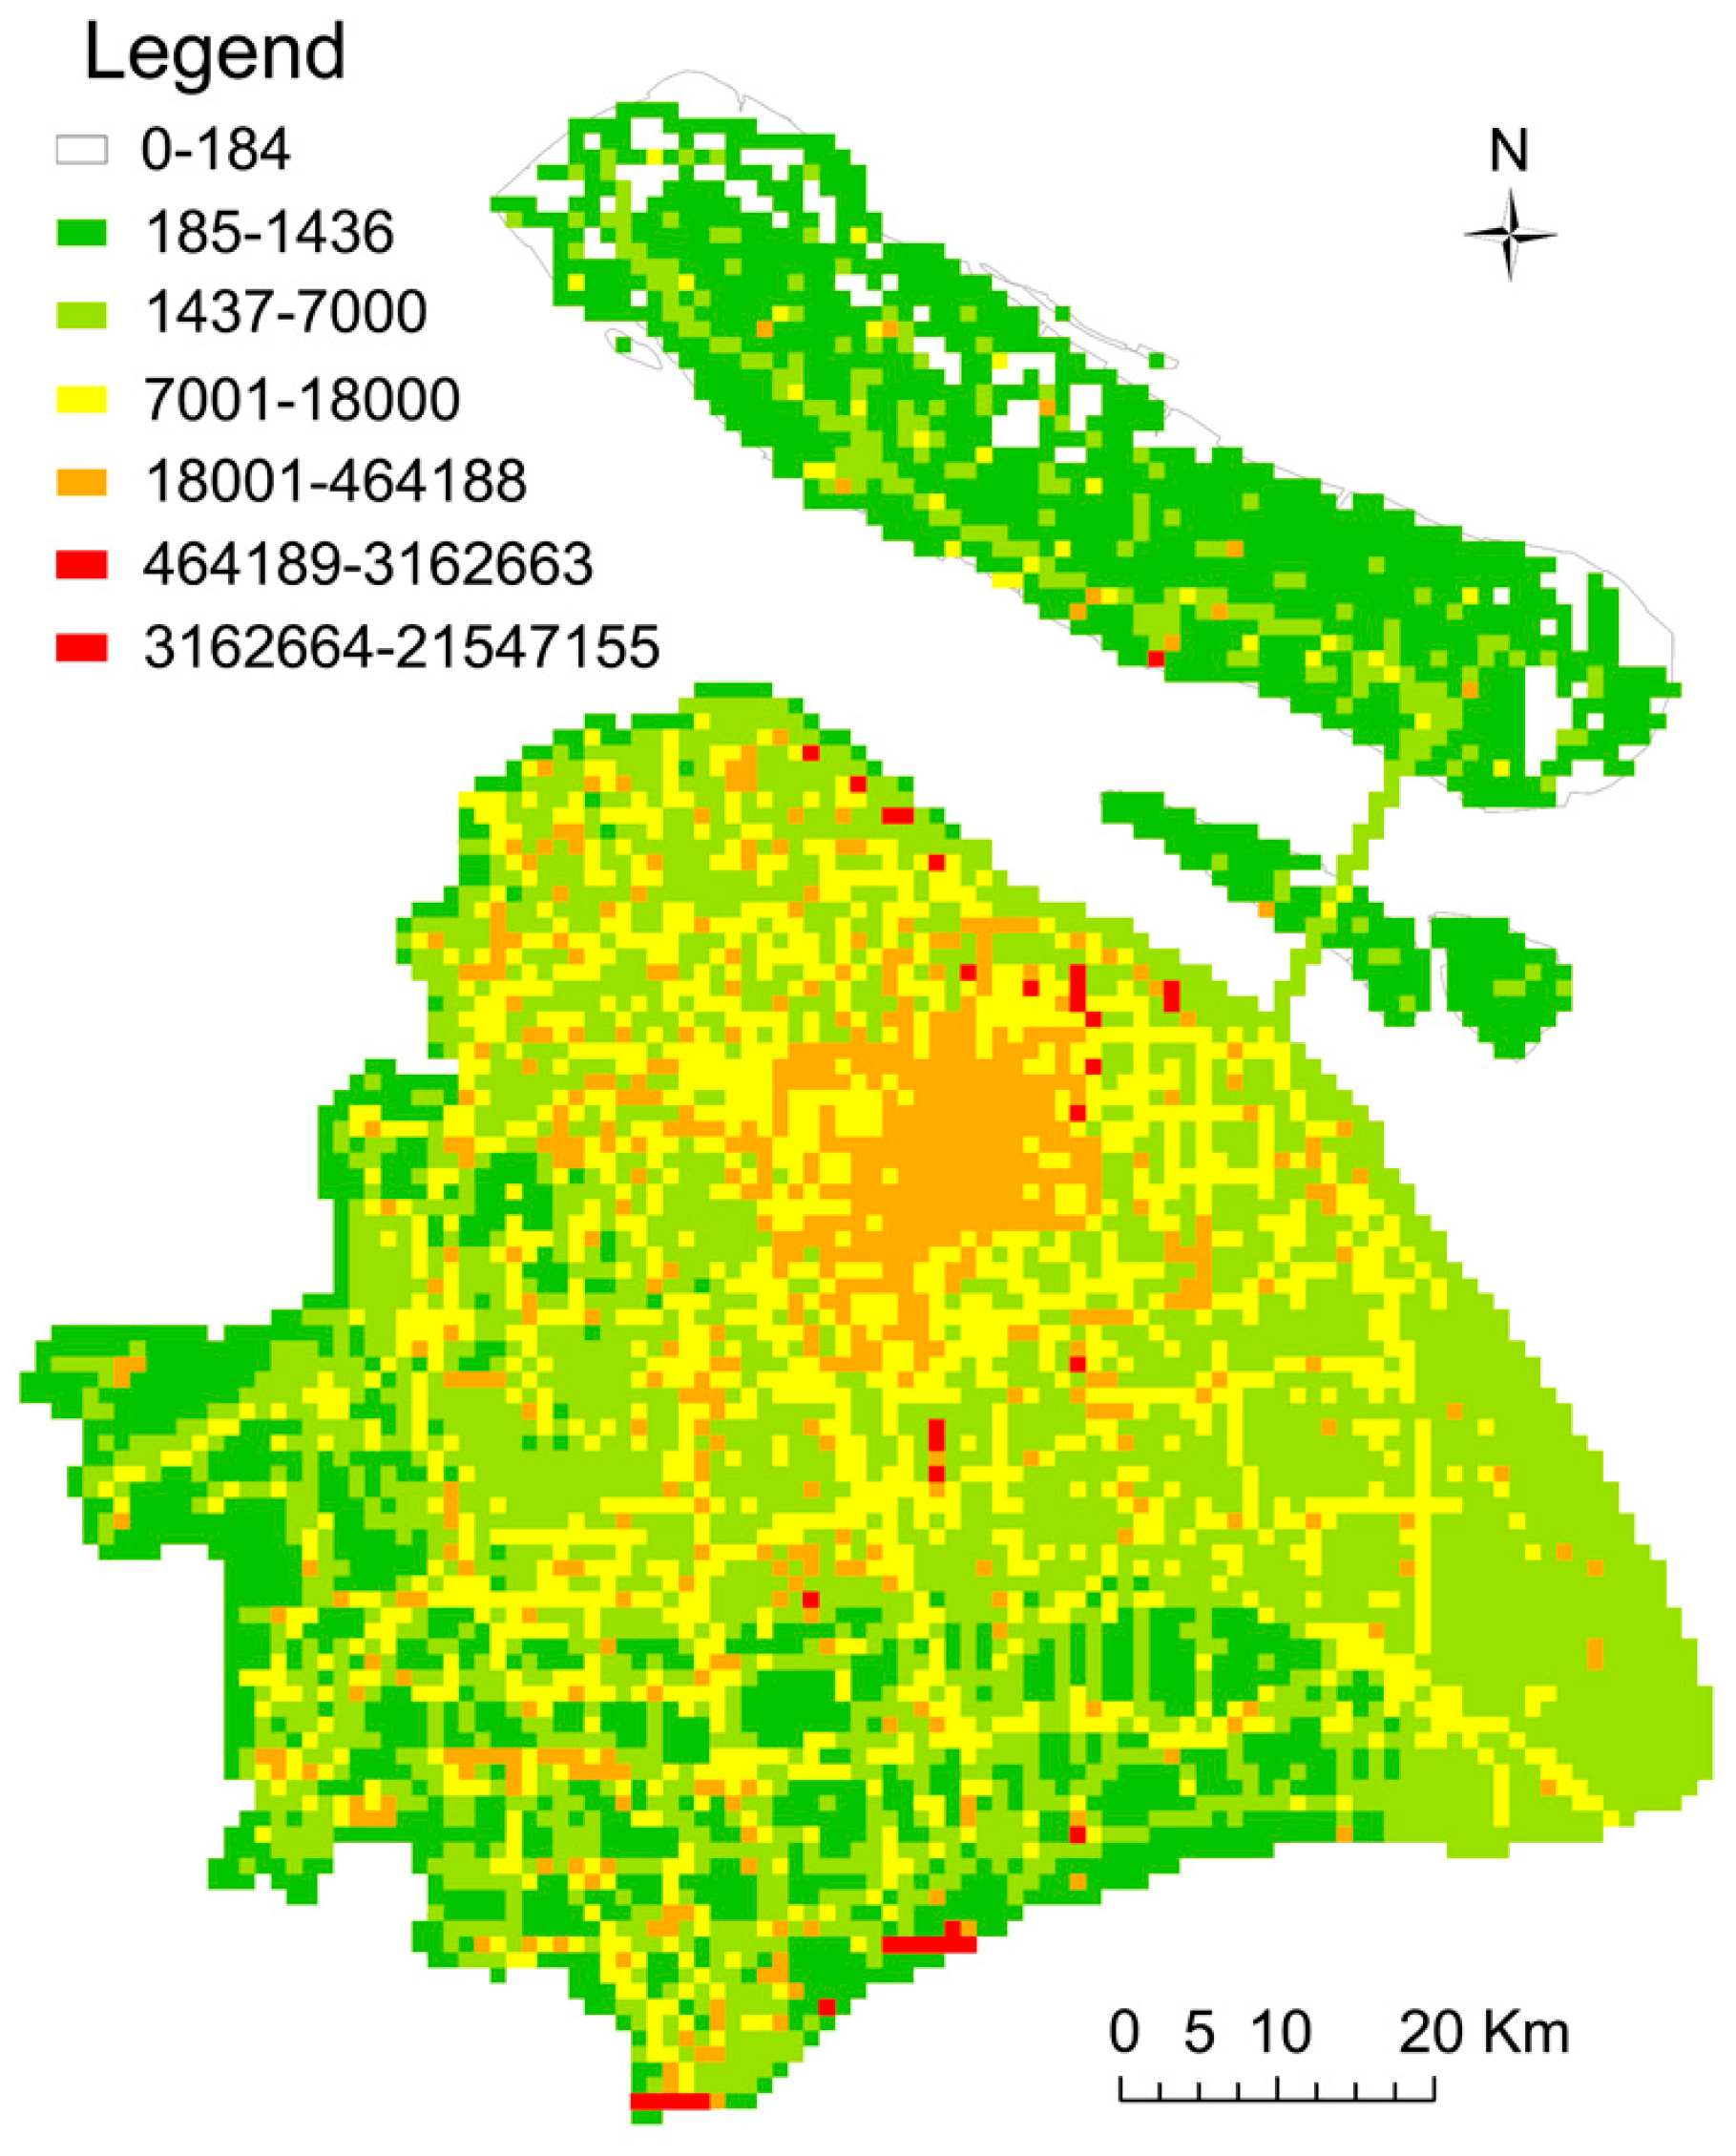
(1) Shanghai energy consumption and energy-related CO2 emissions are characterized by high spatial aggregation. In the total 7209 grids, CO2 emissions accumulated from the top 10 grids account for 52.8% of the total gridded energy-related CO2 emissions in Shanghai; CO2 emissions accumulated from the top 20 grids account for 64.5% of the total gridded energy-related CO2 emissions in Shanghai; and CO2 emissions accumulated from the top 50 grids account for 76.5% of the total gridded energy-related CO2 emissions in Shanghai. As such, policy-makers should implement strategies based on emission resources when making energy and carbon emission related policies. In other words, they should implement delicacy management on energy consumption in the key grids, in order to achieve the maximum effects of policy with the least administrative cost.
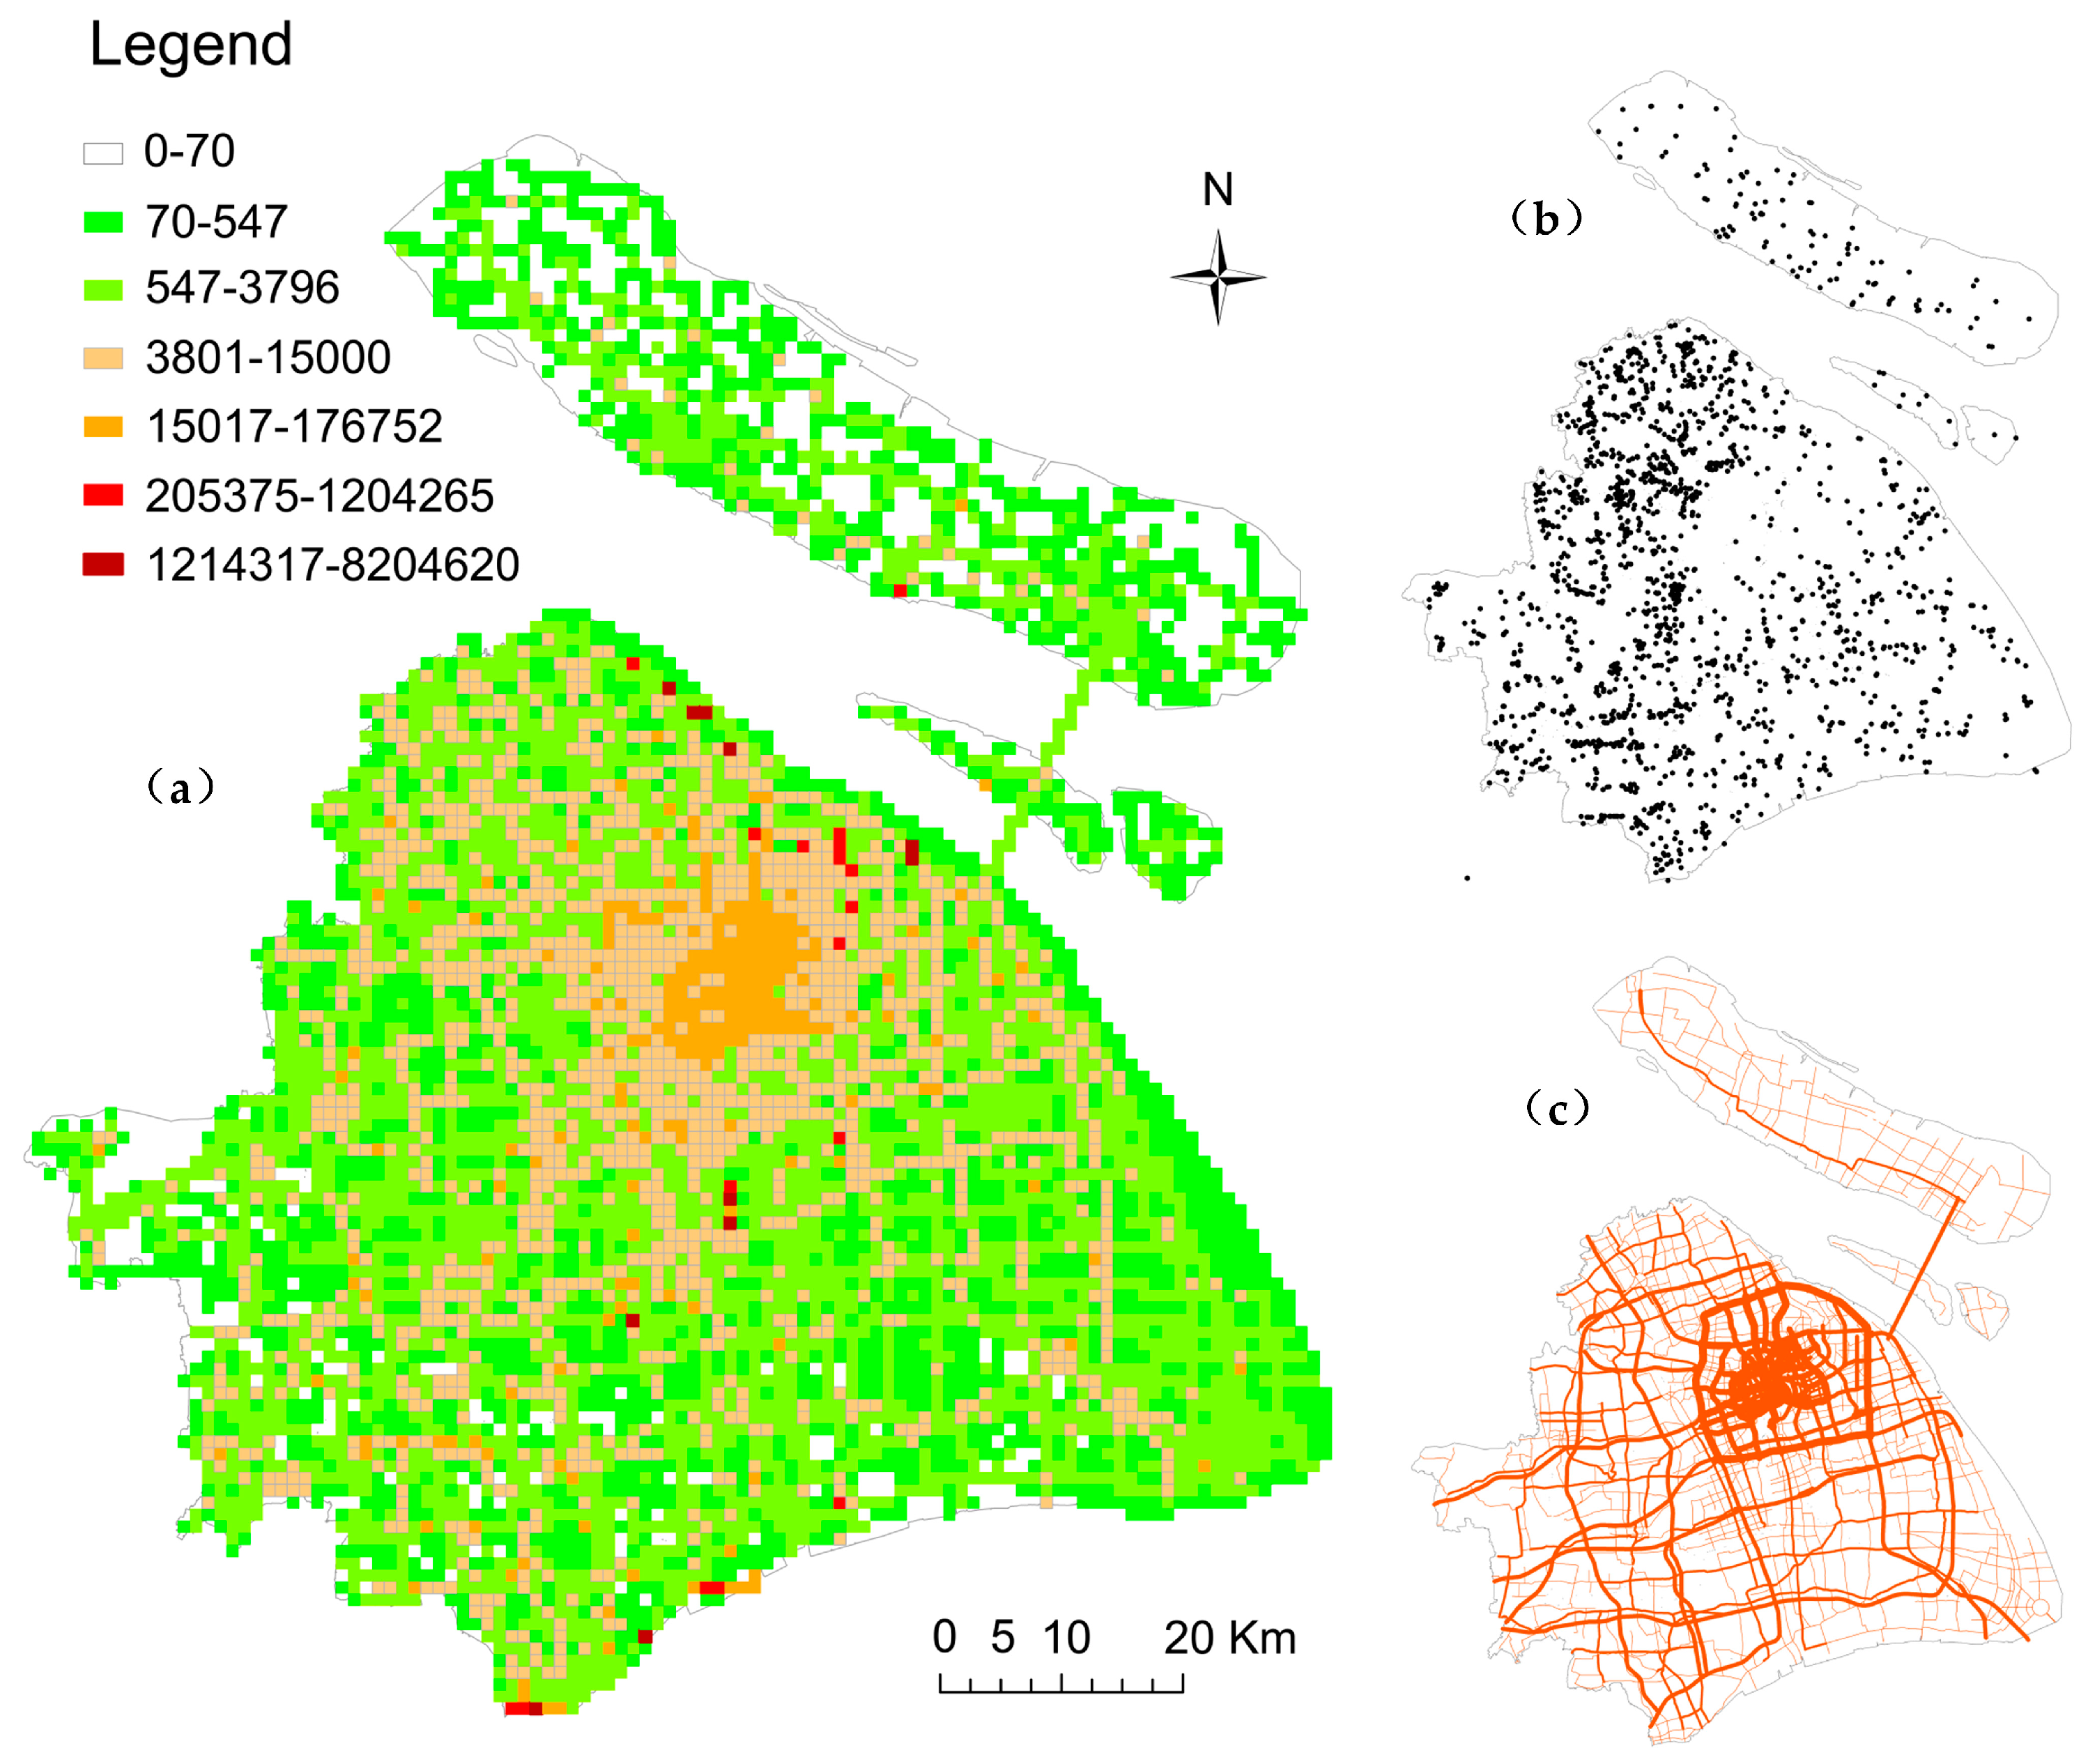
(2) The Shanghai industrial sector constitutes the major sector of CO2 emissions while carbon emissions in resident sector have relatively low ratio. Energy-related CO2 emissions in the industry sector account for 63.45% of total emissions, while energy used in resident sector only accounts for 3.36%. According to the development plan for the future industry sector, we anticipated that Shanghai CO2 emission spatial configuration in the future will aggregate more in the southern coastline and northern coastline. The gridded energy consumption and carbon emissions data product can provide a strong tool in Shanghai planning decision making system to support urban planning in a sustainable way.
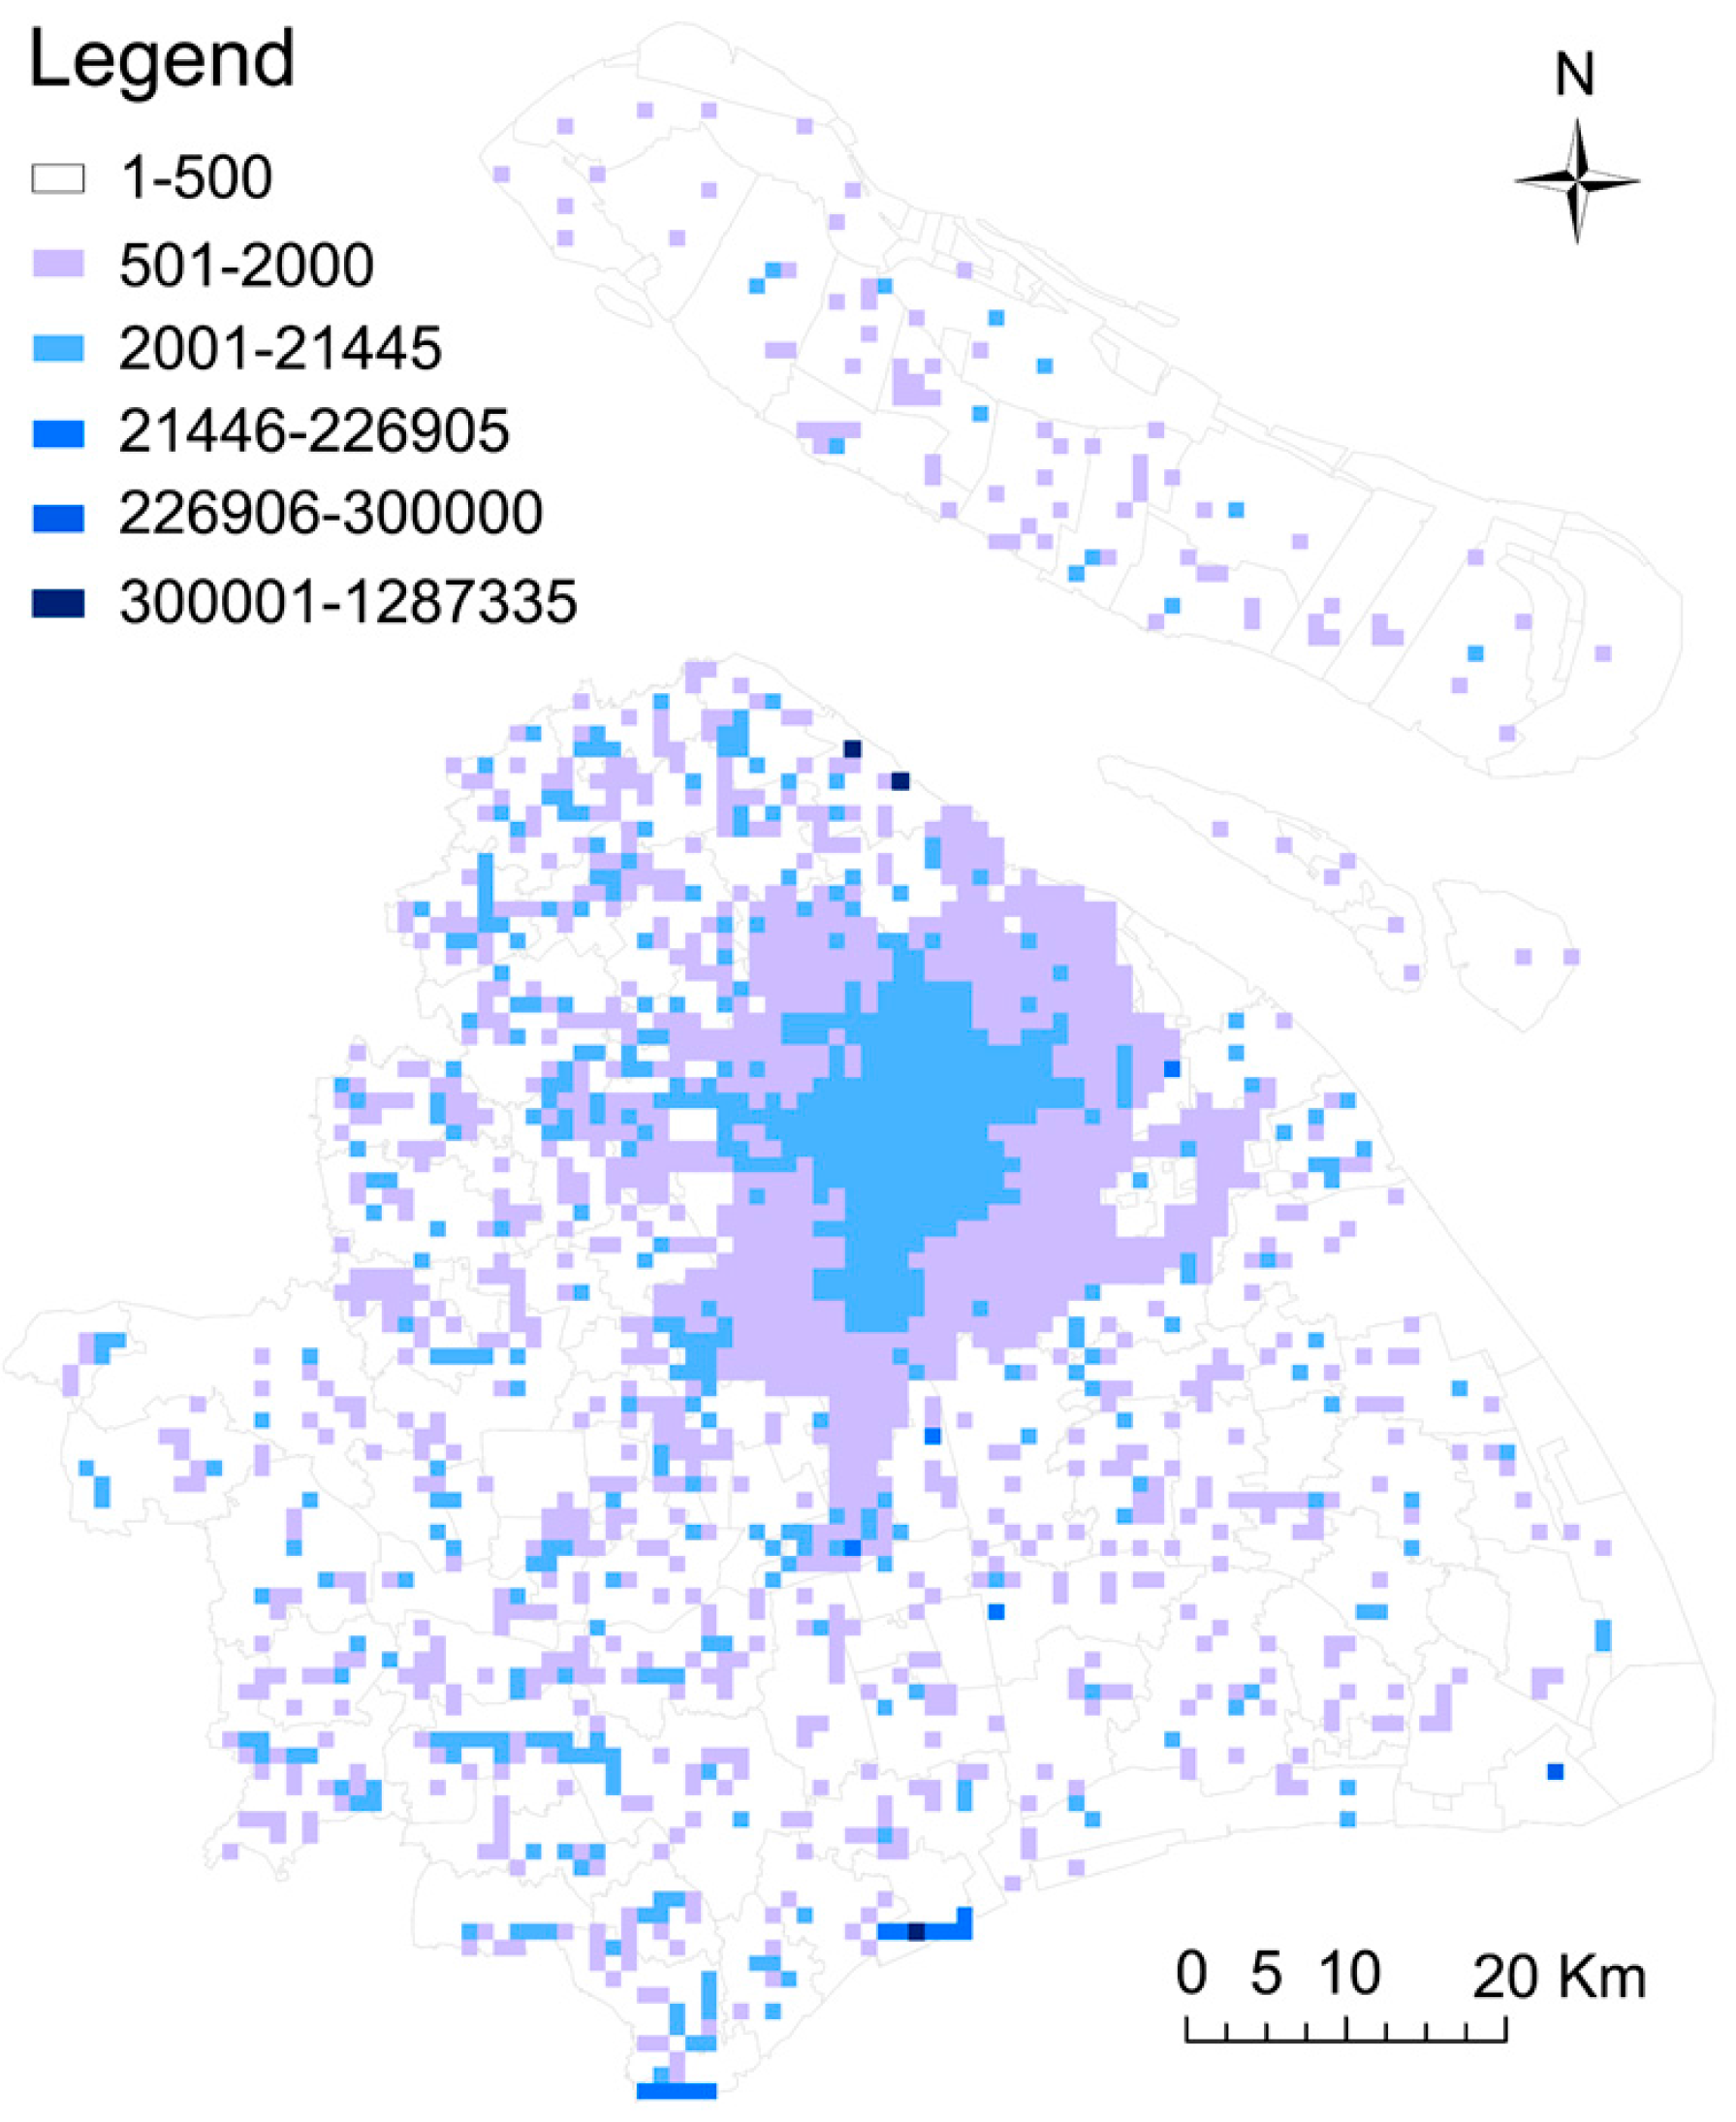
(3) Emission intensity of on-road traffic ranks highest in the central area. CO2 emissions emitted from Shanghai on-road traffic account for 8.96% of Shanghai total emissions. The carbon emission intensity of roads in Shanghai central area is 4.63 times that of roads in rural areas. Roads in the central area assume 48.5% of Shanghai traffic volumes, but the length of such roads account for only 21.9% of the total length of roads in shanghai. Given such, more attention shall be paid to the road planning in the central area, particularly for road planning inside the Inner Ring viaduct. In addition, underground rail traffic shall be promoted so as to mitigate road traffic demand in the central area.
(4) The grid constructed by this research realizes high-resolution identification and location to key point sources of coal-related CO2 emissions, key line sources of road traffic related CO2 emissions and natural gas related CO2 emissions for the year of 2010. There are some improvements that can be done in the future. First, re-disaggregate gas consumption consumed by commercial and resident sector by gas type, based on the house based natural gas consumption data, so as to enhance the accuracy of the emission spatial distribution. Currently, the gas consumed by resident and commercial sector is allocated according to the populations and GDP of the tertiary industry, which cannot accurately reflect the natural gas consumption difference among population with different income and the internal difference of the tertiary industry among various districts. Second, with regard to oil consumption, aviation CO2 emissions emitted inside Shanghai will be estimated and the spatial configuration coverage of carbon emissions will be expanded in the future, based on parameters such as the aviation flight flow and the average take-off distance at the airport, in order to provide more detailed essential data for monitoring and verifying the Shanghai carbon flux.


