Article

Analysis of the Dynamic Relationship between Fluctuations in the Korean Housing Market and the Occurrence of Unsold New Housing Stocks

1
Department of Architectural Engineering, Hanyang University, 222, Wangsipri-ro, Sungdong-gu, Seoul 04763, Korea
2
Innovative Durable Building and Infrastructure Research Center, Hanyang University, 55 Hanyangdaehak-ro, Sangrok-gu, Ansan-si 15588, Gyeonggi-do, Korea
*
Author to whom correspondence should be addressed.
Sustainability 2017, 9(1), 107; https://doi.org/10.3390/su9010107
Submission received: 13 August 2016 / Revised: 28 December 2016 / Accepted: 6 January 2017 / Published: 13 January 2017
(This article belongs to the Section Economic and Business Aspects of Sustainability)

Abstract

:
In this paper, we intend to identify the characteristics of occurrence of unsold new housing stocks and draw the implications for the housing business strategy that can effectively cope with the market risk under the Korean housing market. As a result of the analysis, most of the theoretical causality of occurrence of unsold new housing stocks under the three-dimensional Korean housing market was found to correspond to the empirical analysis result. In addition, the chonsei market that produces the characteristic movement of Korean housing market had a significant relation with occurrence of unsold new housing stocks. Because of these results, it is thought that the proposed housing business strategy can effectively cope with the housing market risk. It is thought that we need to additionally examine the financial validity of the proposed housing business model by calculating the cash flow and grope for policy support measures to materialize it on the basis of the analysis result of this paper.

1. Introduction

The Korean War (1950–1953) not only devastated Korea’s territories, but also resulted in an extreme shortage of urban infrastructure and housing. The Korean government adopted diverse urban policies after the war to accommodate huge in-migration toward the capital regions, especially Seoul. Furthermore, unprecedented economic growth over the last four to five decades has caused rapid growth in Korea’s housing industry [1]. The Korean housing business has grown to become a very significant part of the business portfolio of Korean construction companies because of this economic growth and the imbalance between housing supply and demand.
Accordingly, unsold new housing stocks aggravate the financial difficulties of construction companies at an alarming rate, thereby resulting in insolvency. Such insolvency affects not only construction companies, but also their various stakeholders [2].
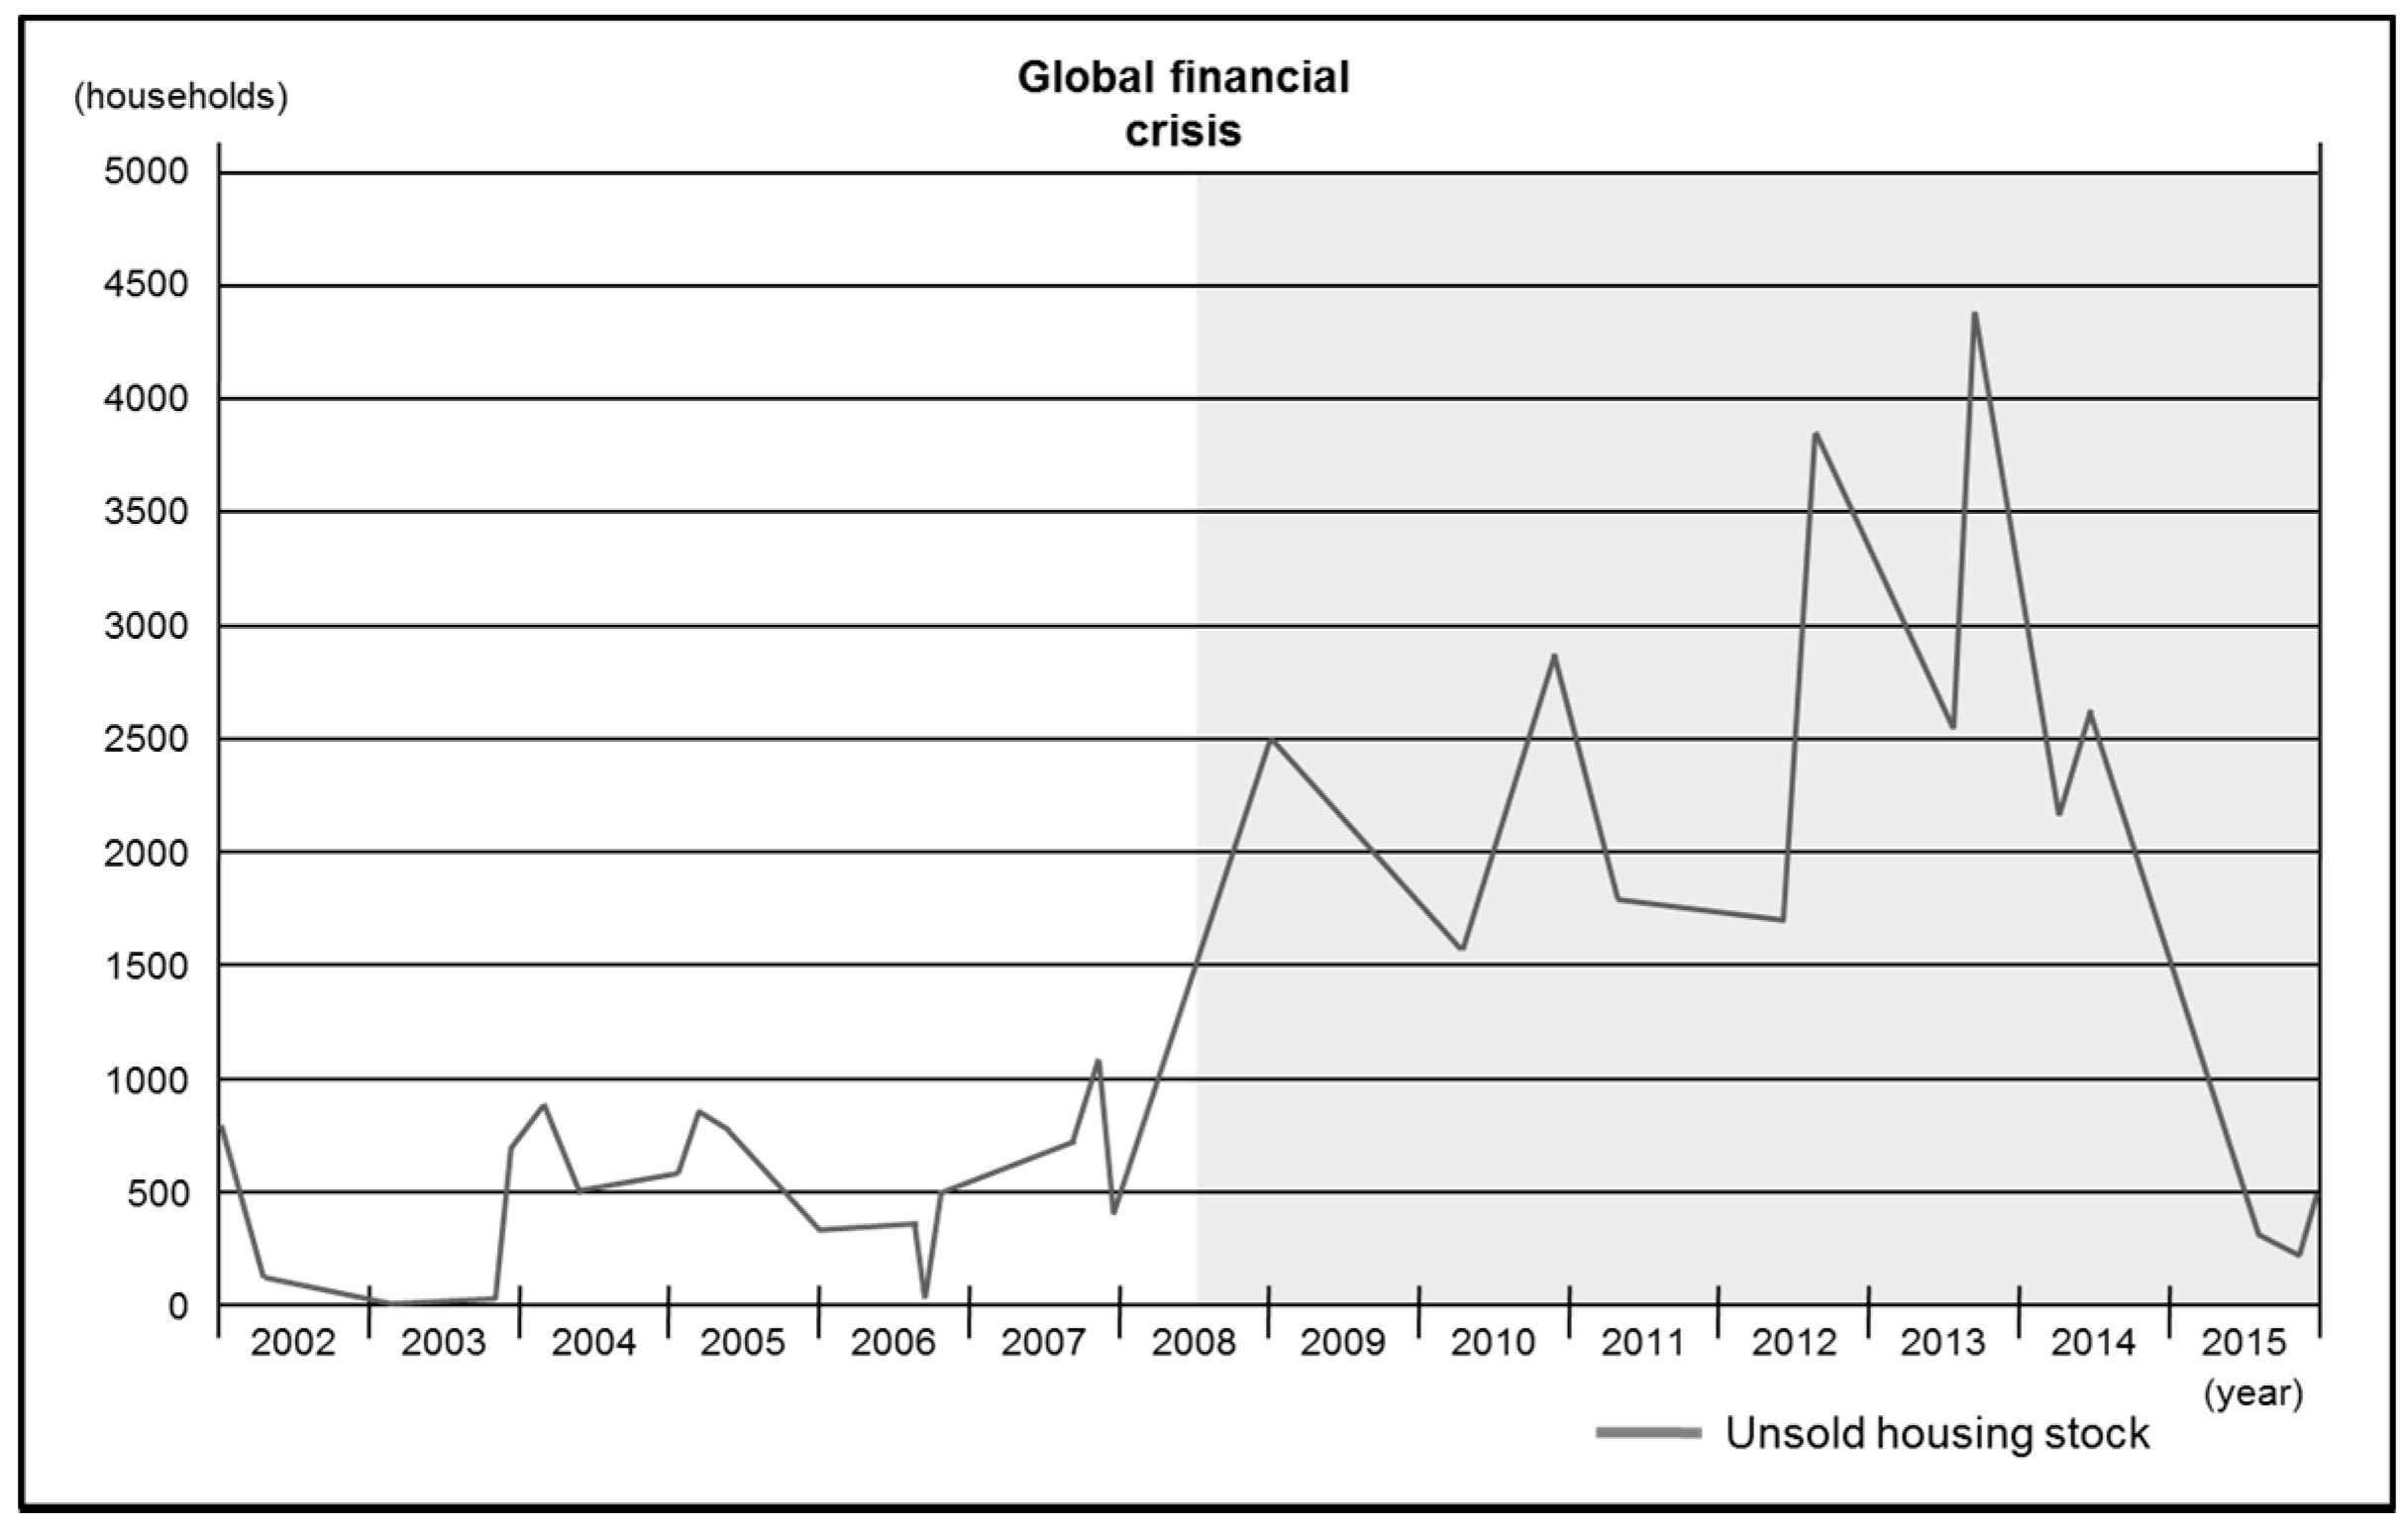
Unsold new housing stocks represent the imbalance between housing supply and demand. Unlike usual products, housing projects normally take long periods of time to be completed, which causes difficulties in maintaining the balance between demand and supply at the right time. Therefore, the probability of the occurrence of unsold new housing stocks is always present. The number of unsold new housing stocks is the main sign of the economic situation of the housing market. It is also used as a market indicator that reflects the preferences of homebuyers. In other words, the number of unsold new housing stocks is an important indicator for determining the time of supply and purchase [3]. From this point of view, the number of unsold new housing stocks has an immense effect on the financial sustainability of construction companies and their various stakeholders. It is also a key indicator of the housing market conditions. Therefore, it is very important to analyze the characteristics of the occurrence of unsold new housing stocks.
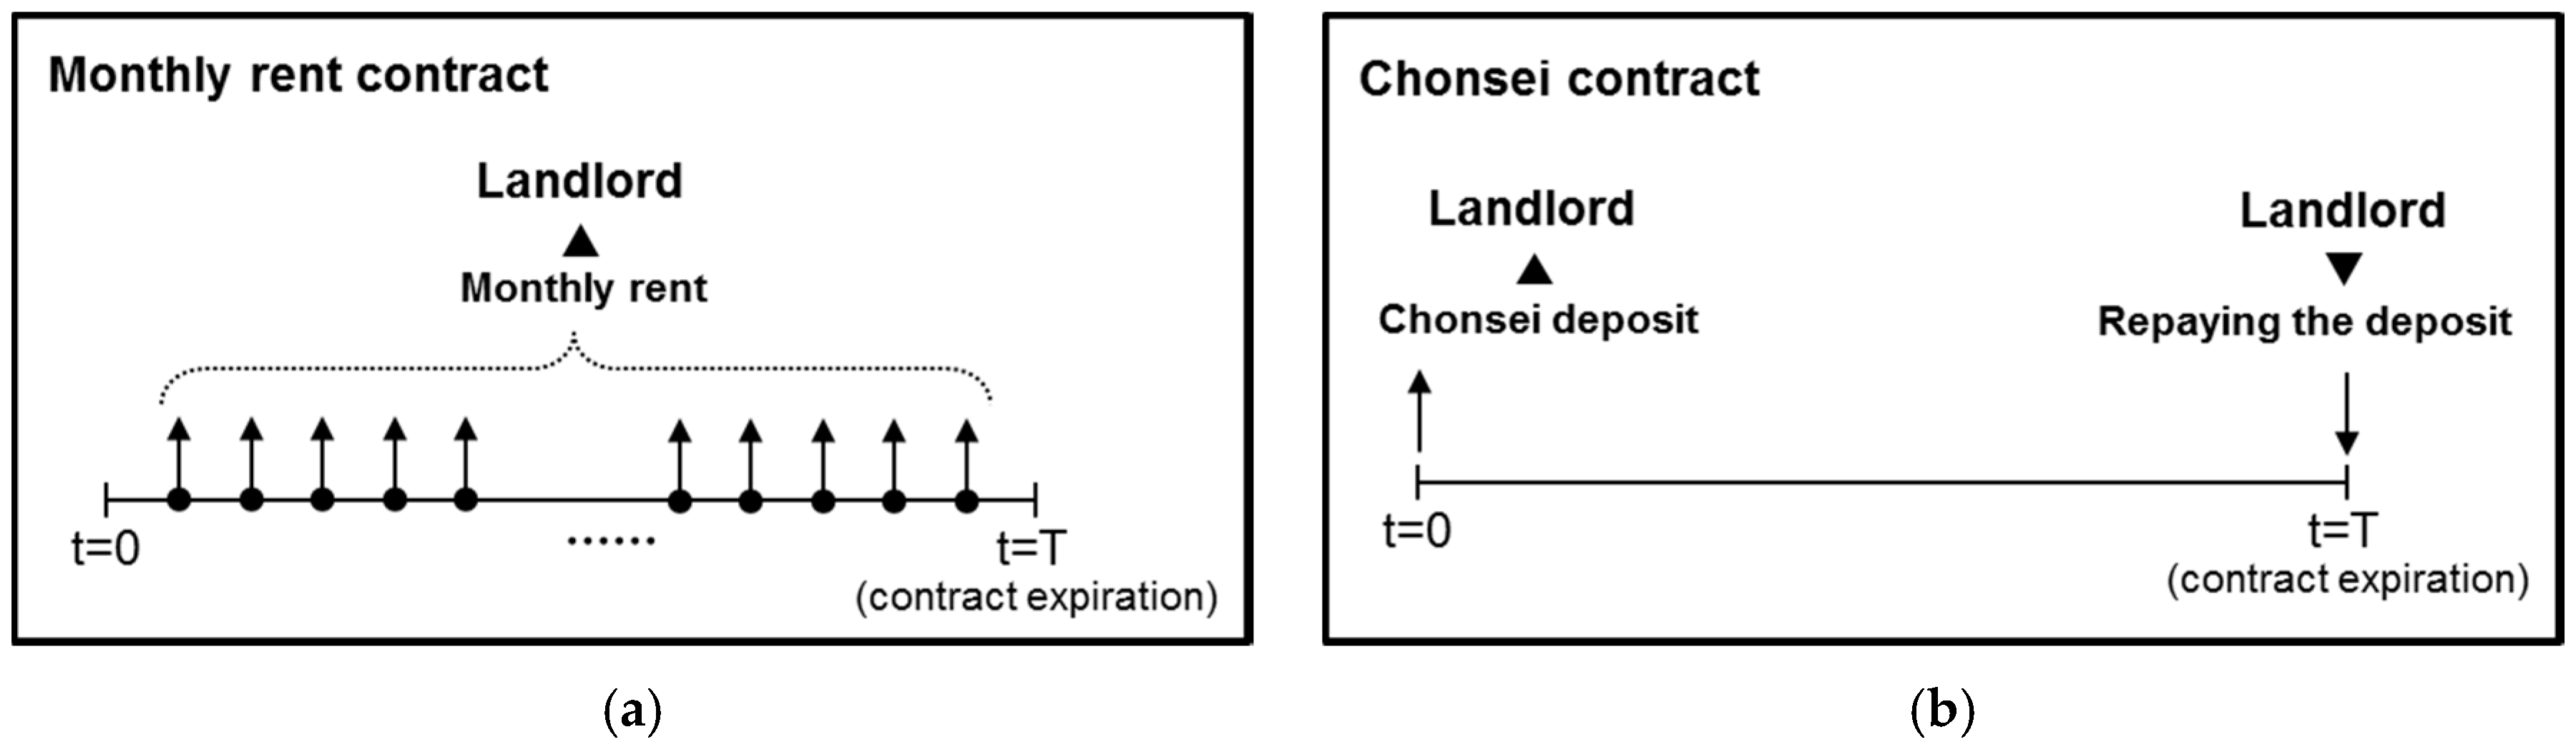
The Korean housing market has a structure that differs from the overseas housing market. Korea has a unique lease market, called the chonsei market. The tenant pays an upfront lump-sum deposit, which is typically from 40% to 90% of the property value, to the landlord for the use of the property. The landlord repays the nominal value of the deposit to the tenant upon contract termination. No additional requirements, such as periodic rental payments, are asked from the tenant. Hence, the chonsei deposit, which is held during the contract period and repaid by the landlord, becomes the substitute for such payments [4].
The chonsei market is highly important in the Korean housing market because it has a different configuration from the overseas housing market, which consists of transaction and monthly rent. One of the main characteristics of the chonsei, which is another form of rent, is that the landlord can lower a significant portion of the equity capital investment ratio at the time of house purchase. Thus, the landlord can take out a loan from the market at the market interest rate and buy the house with the upfront deposit and seek profits through the rise in housing price, which, in the landlord’s perspective, functions as leverage. Meanwhile, in the tenant’s perspective, the upfront deposit functions as a reserve fund for future house purchasing. The deposit is given to the landlord for two years, and the tenant receives housing services in return [4,5].
Thus, the residential spaces in Korea can be effectively secured through the chonsei market without getting to the housing transaction market. In other words, the existence of the chonsei market in Korea has a very significant effect on the housing demand activities even in conditions where the housing market is unstable. From this perspective, it is very important to analyze the characteristics of unsold new housing stocks by considering the structural features of the Korean housing market for assessing sustainability of the housing market and developing appropriate business strategies.
Accordingly, in this paper, we intend to identify the characteristics of occurrence of unsold new housing stocks and draw the implications for the housing business strategy that can effectively cope with the risk of housing market fluctuation under the Korean housing market.

2. Background

2.1. Characteristics of the Korean Housing Market

Housing is an important form of assets with which housing services are provided. Accordingly, the types of the market formed in relation to housing can be also divided in general into the market where ownership of asset is transacted and the house rental market where the right to use the housing service which occurs for a specific period of time is transacted. In Korea, not only general transaction market and monthly rental market but also a characteristic housing rental market called chonsei market exists.
Chonsei is a unique lease contract in Korea. Rather than paying monthly rent for the right to use real property for a specified period of time as in most Western lease contracts, the Korean chonsei contract specifies that the tenant pays an up-front deposit for the use of the property with no requirement for periodic rent payments (see Figure 1). This up-front deposit, commonly called chonsei deposit, is typically between 40% and 90% of the value of the property. Furthermore, at the contract expiration, the tenant is entitled to receive from the landlord a payment equal to the chonsei deposit. Thus, the “rent” received by the landlord in compensation for forgoing the use of the property is the investment return on the deposit over the lease contract [5].
In Korea, inflow of population into cities increased quickly as urbanization progressed rapidly as a result of the success in the economic development strategy since the 1960s. Nevertheless, systematic supply of public rental houses was not realized in the institutional point of view. Accordingly, conditions were shaped where private house owners could not but have the initiative in the rental housing market. Chonsei which has evolved like this is a system where residential function and private financing function are exchanged one to one between the lesser and the tenant with a house as the medium. In addition, as city development and house construction delayed in comparison to the increasing income, the housing price rapidly increased. Those who intended to purchase a house increased their properties using the chonsei deposit provided by the tenant-to-be which has the nature of private finance. That is to say, the landlord purchases a house investing its own capital as little as possible by utilizing the chonsei deposit of the tenant and obtains capital gain later when the house price increases. In addition, the tenant is provided with a stable residential service by the lesser in return for providing the chonsei deposit. That is to say, as chonsei has a strong point advantageous to both the lesser and the tenant, the parties of a chonsei contract, chonsei established itself as a major housing rental market in Korea [5].

2.2. Fluctuations of the Korean Housing Market

This study aims to analyze the characteristic changes of the Korean housing market structure and the connection between unsold new housing stocks. Figure 2 shows the fluctuations of the chonsei market, which is a unique kind of lease market, and the housing transaction market.
The housing transaction price had a continuously rising trend before the global financial crisis. This rising trend then stopped for a long time and started declining since 2011. However, under the policies of the new government, the housing transaction price is again presenting a rising trend. Meanwhile, the chonsei price had repeatedly increased and decreased before the global financial crisis. The chonsei price in 2007 was higher than that in 2002. This also had smaller fluctuations than the transaction price. However, unlike the transaction price, the chonsei price maintained a continuous and even higher rising trend after the global financial crisis.
Figure 3 shows the changes in the number of unsold new housing stocks. As it can be inferred from the rising trend of the housing transaction price before the global financial crisis (Figure 2), the number of unsold new housing stocks was very low before the global financial crisis, which was generally caused by the flow of various investment capitals into the housing market. However, the number of unsold new housing stocks rapidly increased after the global financial crisis because of the general market recession. The number of unsold new housing stocks has now decreased because of the support provided by the policies of the new Korean government. However, many construction companies experienced financial difficulties because of the unsold new housing stocks accumulated before.
The chonsei/transaction ratio is an indicator that directly explains the relation between the housing transaction price and the chonsei price. The chonsei/transaction ratio shown in Figure 4 indicates that the housing transaction ratio was constantly declining before the global financial crisis. Meanwhile, the chonsei/transaction ratio presented a continuous rising trend after the global financial crisis. Thus, Figure 4 shows the characteristic correlation between the housing transaction market and the chonsei market depending on the general market changes.
This indicates that the number of unsold new housing stocks, which is a result of the fluctuations of the housing transaction market and the chonsei market, has a significant connection with the movement of the housing market.

2.3. Literature Review

Existing literature has focused on identifying the short- and long-term movements of the housing market by considering various factors. Riddel (2004) developed a disequilibrium housing market model that separates disequilibrium generated by supply-side disturbances from those arising from demand disturbances. This study suggested that income and price were equally important in determining long-run housing demand and rents, although less influential than income or price, still affected the choice to own a home [6]. Chen et al. (2011) analyzed the changes over time in housing price in each Chinese province and examined empirically the determinants of urban house price at national and regional levels using time-series and cross-sectional data. This paper showed that the increase in urban household incomes could drive the growth in urban housing price, the power of urban household income on the urban housing market was not clear [7]. Jud et al. (2002) examined the dynamics of real housing price appreciation in 130 metropolitan areas across the United States. This study found that real housing price appreciation was strongly influenced by the growth of population and real changes in income, construction costs and interest rates [8]. Case et al. (1996) analyzed the pattern of house price appreciation in the Boston area from 1982 to 1994. This study suggested that changes in the cross-sectional pattern of house price were related to differences in manufacturing employment, demographics, new construction, proximity to the downtown, and to aggregate school enrollments [9]. Clapp et al. (1994) explored the relationship between methods used to measure house price indices and economic determinants of house price at the local level. The results of this study indicated a strong role for expected inflation and unemployment, both of which reduced house price changes [10]. However, the literature focused on analyzing the relationship between the housing transaction market and various factors. The dynamics of the Korean housing market also differ from other countries because of the existence of the characteristic lease market, called chonsei.
For such a reason, some literature identified the distinctiveness of the chonsei contracts in Korea. Kim (2013) showed why such a unique rental system exists and has been so popular in Korea. This study showed that the tenant, who suffered from insufficient mortgage borrowings, was able to access cheaper rental housing via chonsei than when only monthly rental housing was available [4]. Ambrose et al. (2003) developed a contingent-claims model that recognizes the compound options embedded in the chonsei contract. This study showed that chonsei contract was an indigenous market response to economic conditions prevalent in Korea [5]. Kim (1991) proposed an alternative Korean rental housing (chonsei or monthly rent) choice model, in which households choose their dwelling units using hierarchical logit analysis [11]. Kim et al. (2012) analyzed the effects of household characteristics on housing sub-tenure choice, and identified the behavior of families who rent while owning another house. This study suggested reasonable implications for the behavior of families who rent while owning another home [12]. These studies identified the characteristics of the chonsei contracts, such as the housing cost advantages and the reasons why people prefer chonsei contracts. However, the demand shifts induced by the advantages of the chonsei contracts were not enough for analyzing the effect they had on the entire housing transaction market and their relationship with the number of unsold new housing stocks.
Because the effect of unsold new housing stocks on the entire construction industry becomes greater, much literature in Korea and other countries has actually identified various factors related to the occurrence of unsold new housing stocks. Kwoun et al. (2013) analyzed cycles of unsold new housing stocks (UNHS), housing investment, and housing supply–demand by introducing system dynamics to determine the dynamics of the housing market and the importance of UNHS as a potential indicator of housing investment, supply and price [3]. Vakili-Zad et al. (2011) explain the major factors contributing to the unlikely combination of a high vacancy rate and the high price of housing from a welfare state perspective [13]. Couch et al. (2013) explored the relationships between shrinking cities, housing vacancy and policy responses in Liverpool, UK. The results of this study were drawn about the nature of housing vacancy and the effectiveness of policy responses [14]. Whitaker et al. (2013) estimated the impacts of property-tax delinquency, vacancy, and foreclosures on the value of neighboring homes. This study showed that an additional property within a certain distance that is vacant or delinquent reduced a home’s selling price [15]. Molloy (2016) presented a simple theoretical framework to illustrate the connection between vacancy and excess supply in the housing market, and discussed why data on duration of vacancy could help refine estimates of the excess supply. This study showed that the long-term vacancy rate was more strongly correlated with various measures of housing market distress than standard measures of vacancy, such as the gross vacancy rate or the home owner vacancy rate [16]. However, the literature is not sufficient to prove why houses remain unsold considering the Korean chonsei market.

2.4. Vector Error Correction Models

A vector error correction (VEC) model is recommended for multivariate time series modeling in which the variables are cointegrated [17]. A VEC model can lead to a better understanding of the nature of any non-stationarity among the different component series and can also improve the longer term forecast over an unconstrained model [18]. The vector error correction model is a combination of the Vector Autoregressive (VAR) model and cointegration restrictions [19]. In other words, the VEC model is a variant of the VAR model used when cointegration restrictions are also present.
A VAR specification is used to model each variable as a function of all the lagged endogenous variables in the system. Johansen [20] considered that the process yt is defined by an unrestricted VAR system of order (p) as follows:
y t = δ + Γ 1 y t 1 + Γ 2 y t 2 +     + Γ p y t p + u t t = 1 ,   2 ,   3 , ,   T ,
where yt is the independent I(1) variables, the Γ s are estimable parameters and u t ~ niid (0, ) is vector of impulses which represent the unanticipated movements in yt. However, such a model is only appropriate if each of the series in yt is integrated to order zero, I(0), meaning that each series is stationary [21]. However, Engle et al. (1987) demonstrated that once a number of variables are found to be cointegrated, there always exists a corresponding error-correction representation that implies that changes in the dependent variable are a function of the level of disequilibrium in the cointegrating relationship (captured by the error-correction term) as well as changes in other explanatory variable(s) [22].
Thus, using Δ = ( I L ) where L is the lags operator, the above system can be reparameterized in the VEC model as
Δ y t = δ + Π y t 1 + i = 1 p 1 Γ i Δ y t i + u t
where yt is an I(0) vector, δ is the intercept, the matrix Γ reflects the short-run aspects of the relationship among the elements of yt and the matrix Π captures the long-run information. The number of linear combinations of yt that are stationary can be determined by the rank of Π , which is denoted as r. If there are k endogenous variables, Granger’s representation theorem asserts that if the coefficient matrix Π has reduced rank r < k, then there exists k × r matrices, α and β , each with rank r such that Π = α β and β y t is stationary. The order of r is determined by using likelihood ratio (LR) trace test statistic. We could reject models where Π has a full rank, i.e., r = k 1 since in such a situation yt is stationary and has no unit root, thus no error-correction can be derived. If the rank of Π is zero, this implies that the elements of yt are not cointegrated, and thus no stationary long-run relationship exists [23]. This study actually performed a cointegration test, which resulted in the existence of cointegrations. Thus, a VEC model was used to perform the empirical analysis.

3. Theoretical Framework

In this study, the relationship between occurrence of unsold new housing stocks and fluctuation of housing market was analyzed on the basis of the FDW model. Occurrence of unsold new housing stocks is after all a major phenomenon of the housing market which occurs due to the imbalance between the demand and supply in the housing market. Accordingly, dynamic relations are thought to exist between the diverse factors which affect the demand and supply in the housing market and occurrence of unsold new housing stocks. In such a point of view, the theoretical relation between the aspect of the fluctuation in the Korean housing market and occurrence of unsold new housing stocks was examined on the basis of the FDW model.
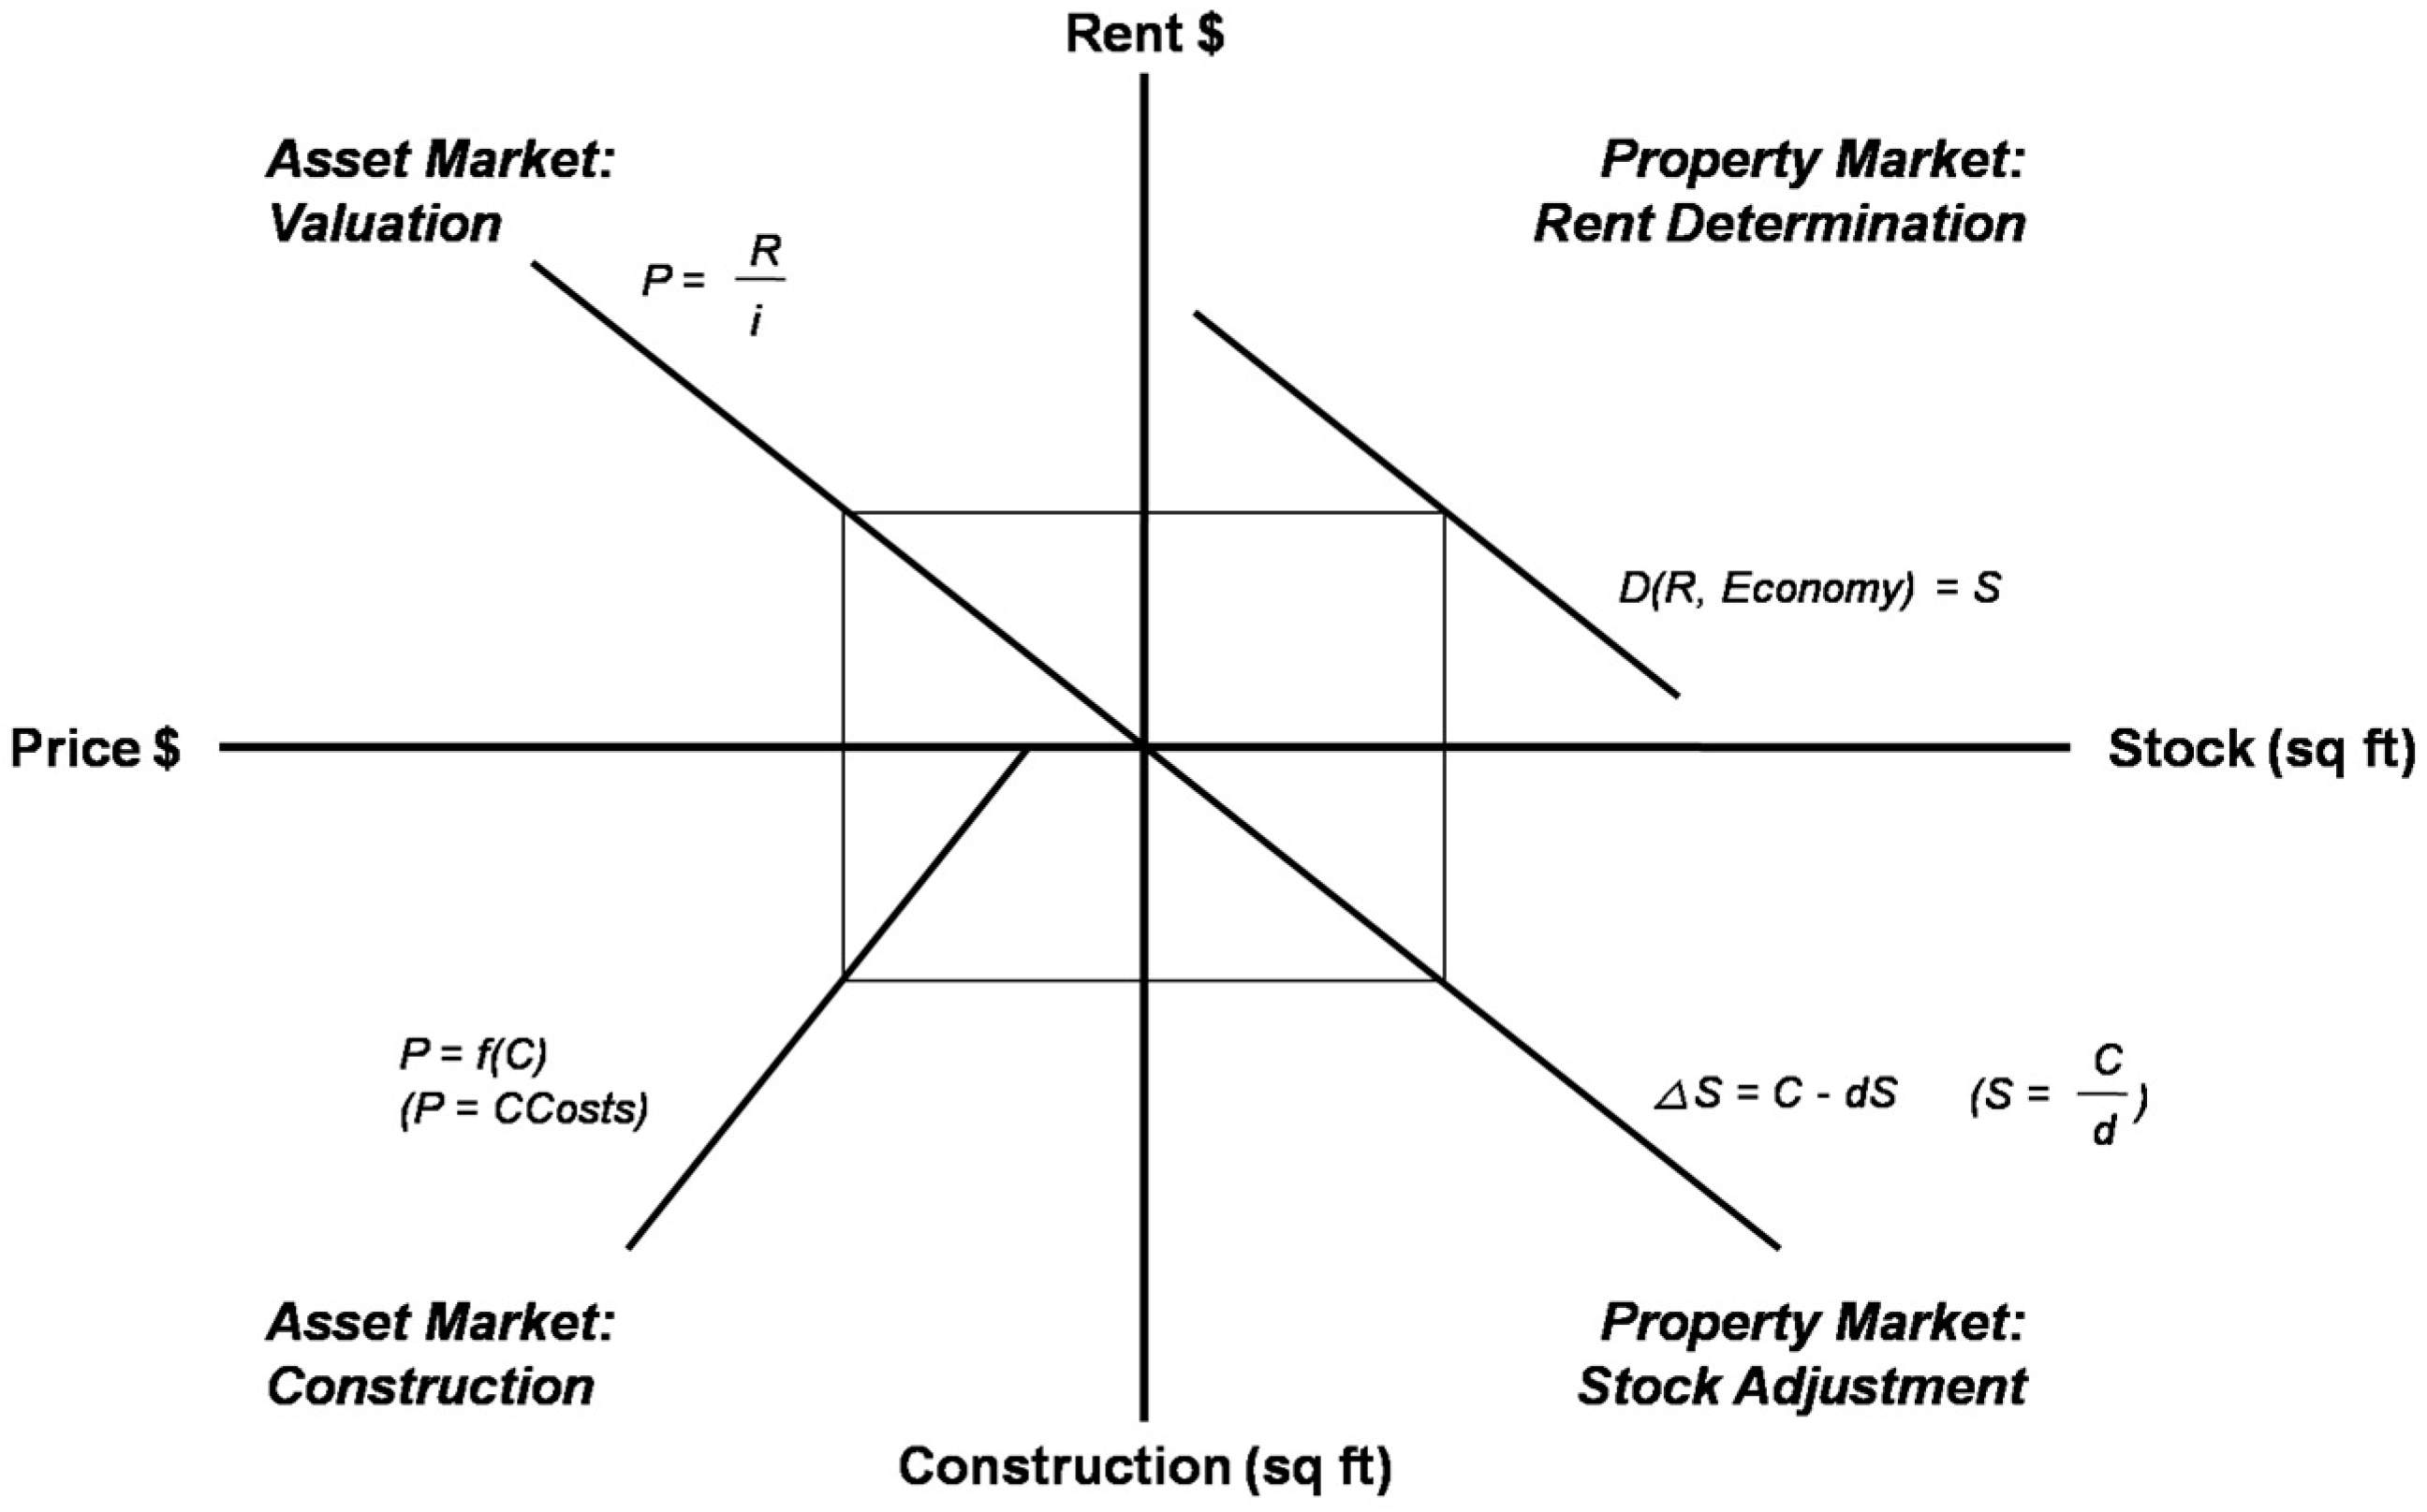
The Fisher–Dipasquale–Wheaton (FDW) model is a quadrant model that defines the equilibrium of demand and supply in a real estate market and traces the relation between spatial market and property market. The FDW model basically explains market equilibrium based on the demand-supply model. That is to say, the FDW model conceptually assumes that real estate development takes place when a profit can be created in the property market for the demand generated by an imbalance between the demand and supply in the spatial market. That is to say, if the spatial demand for real estate increases as a result of a macroeconomic change such as interest rate, economic growth or liquidity and the value of real estate as a property realizes a profit, development takes place and the equilibrium price is recovered in the long run [24,25].
There are largely two links between the property market and the spatial market. First, the level of rent determined in spatial market determines the demand for real properties. It is like investors purchasing properties predicting the current or future income in general. That is to say, the change in rent taking place in spatial market immediately affects the demand for properties in capital market; Second, the number of houses built plays the role of the link between the two markets. If the number of houses built increases, not only the price in the property market but also the rent in the spatial market comes to drop. Such a correlation between spatial market and property market is shown in the quadrant model in Figure 5 below.
As can be seen in 
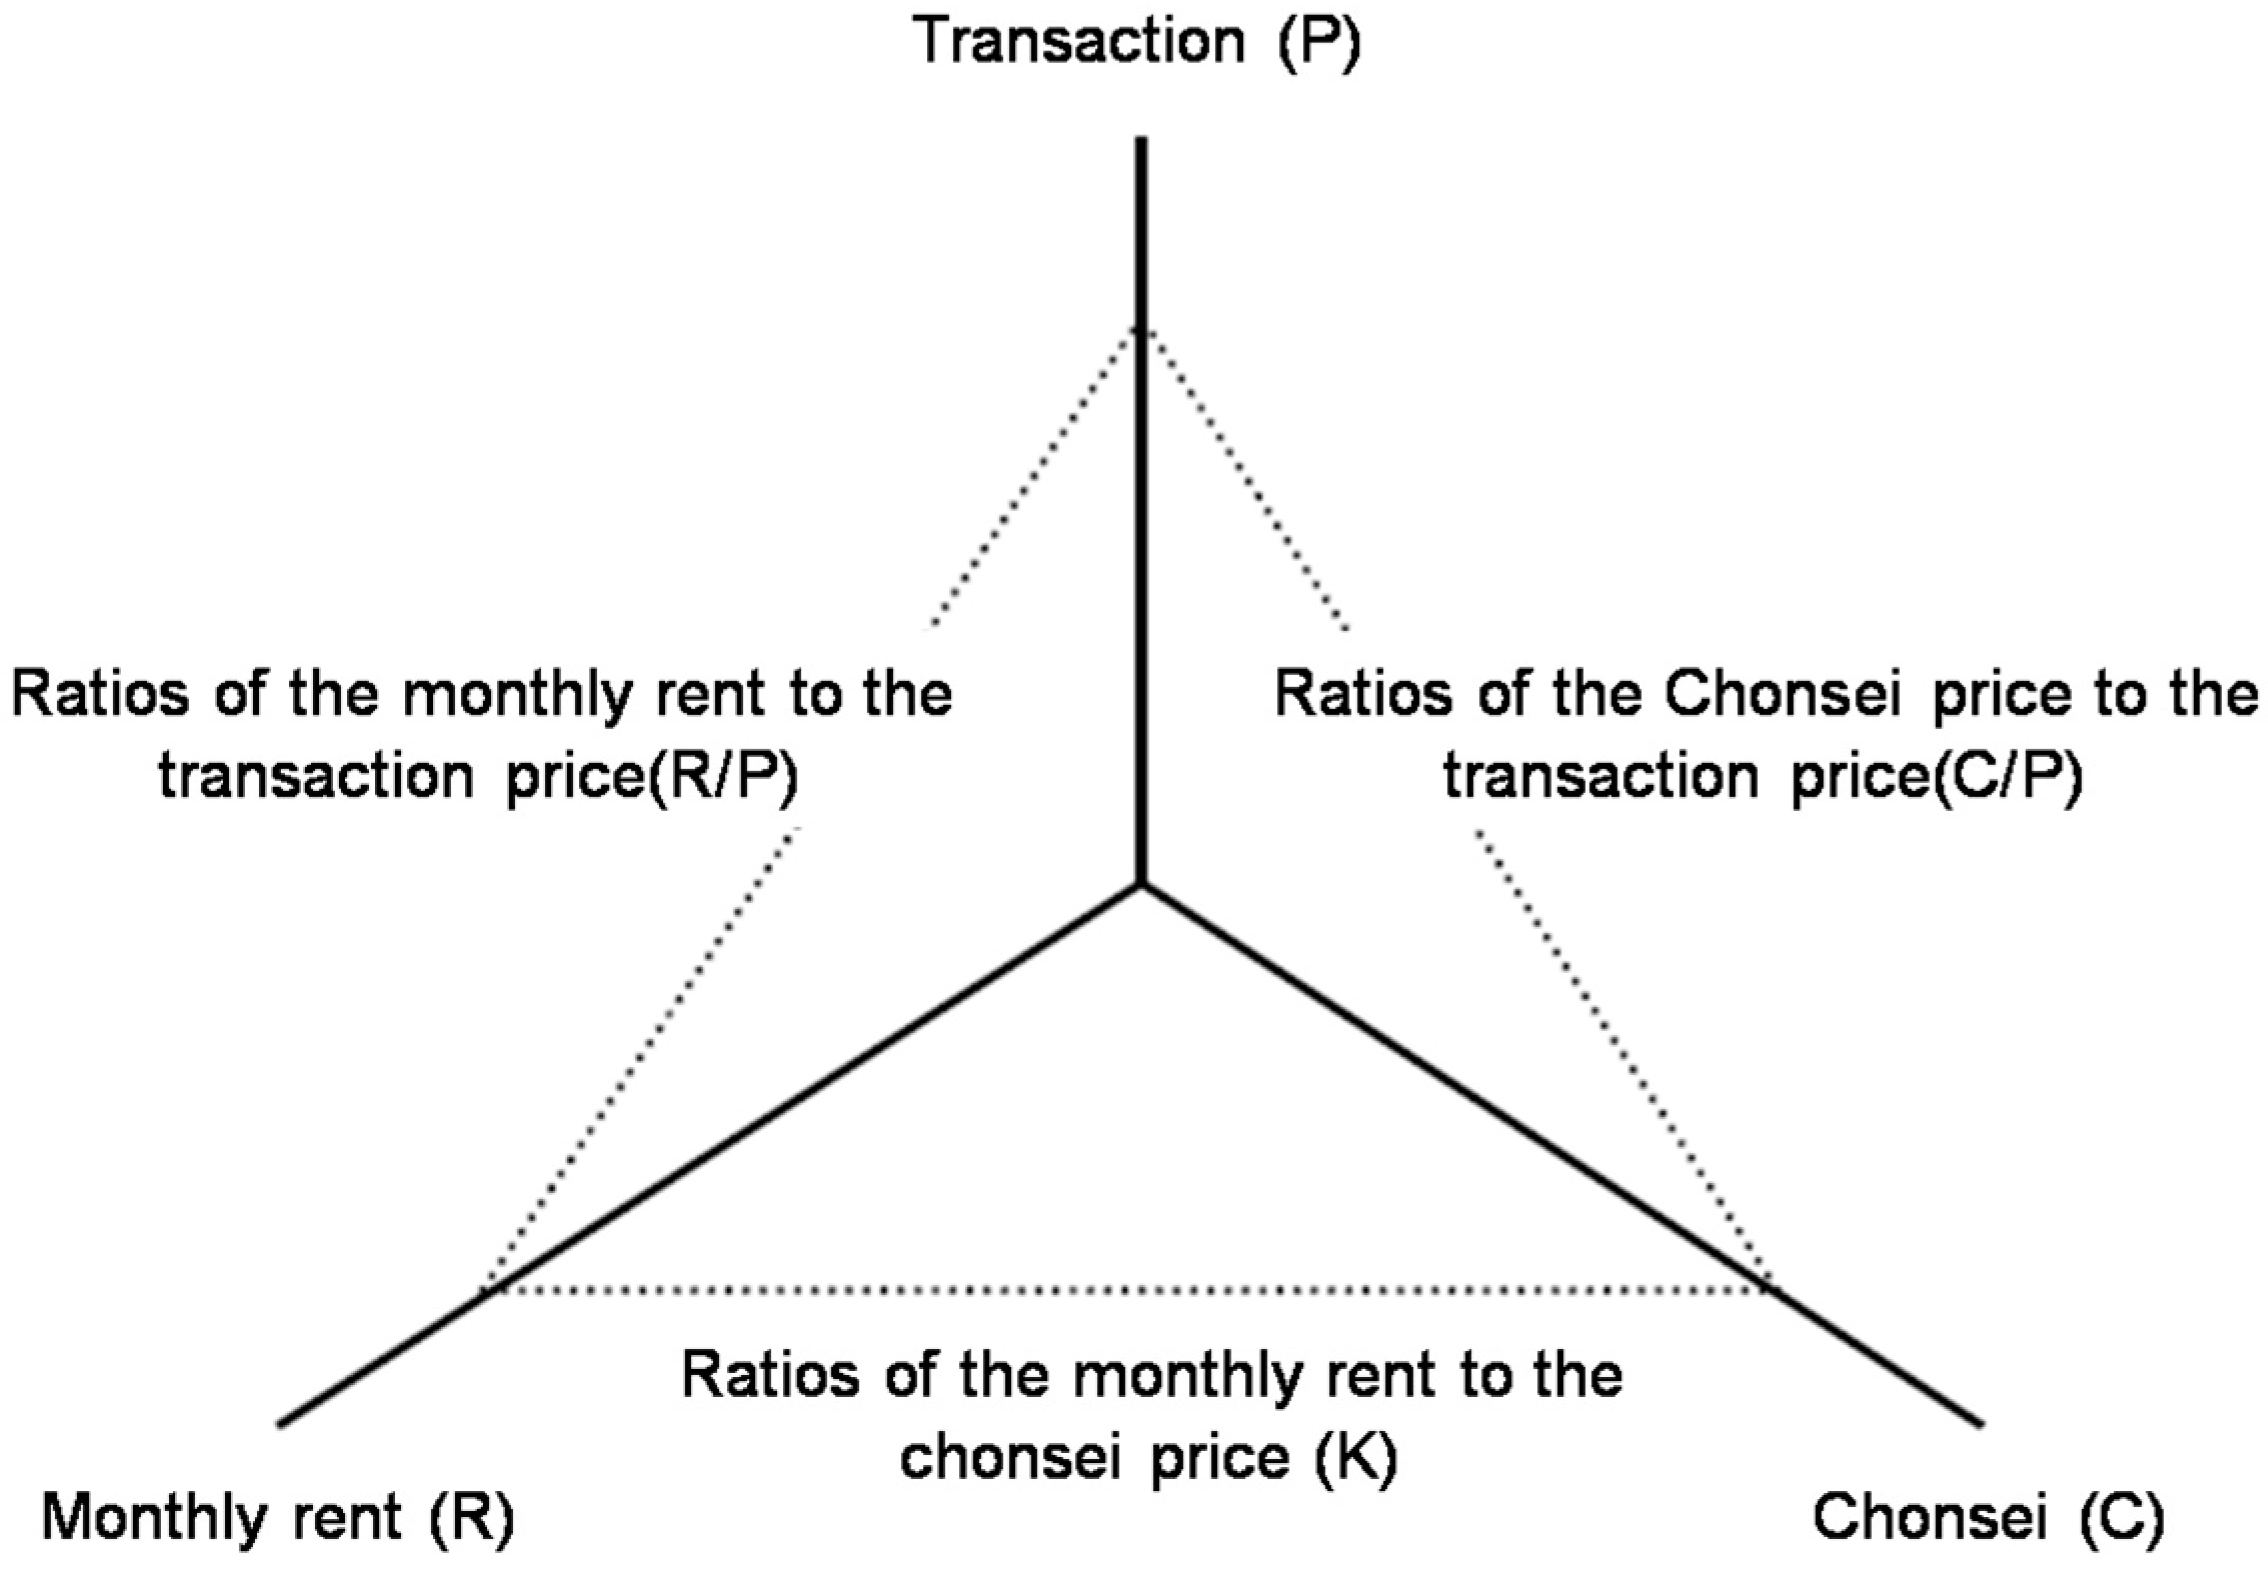
Figure 5, while the basic FDW model is made up of the relation between spatial market and property market, in the case of Korean housing market, the property market which is a rental market is classified into the chonsei market and rental market. In particular, chonsei market is a rental market unique to Korea, where the tenant secures the residential right for a space by putting down a security deposit. Accordingly, the structure of the Korean housing market comprised of transaction market, chonsei market and monthly rental market can be expressed as shown in Figure 6 below [26].
The three-dimensional structure model of the housing market is comprised of three axes called transaction, chonsei and monthly rent and the relations between the individual markets can be expressed in chonsei/transaction price ratio, monthly rent/transaction price ratio and chonsei/monthly rent conversion rate. The individual markets move independently and are changed by the factors inside the housing market such as the demand factor including the change in the number of households or the income, the supply factor including the increase in the housing stocks or the decrease in the number of houses built, the factors of property market such as the market interest rate, the expectations of the buyers-to-be for increase in the price, and the housing policy and taxes.
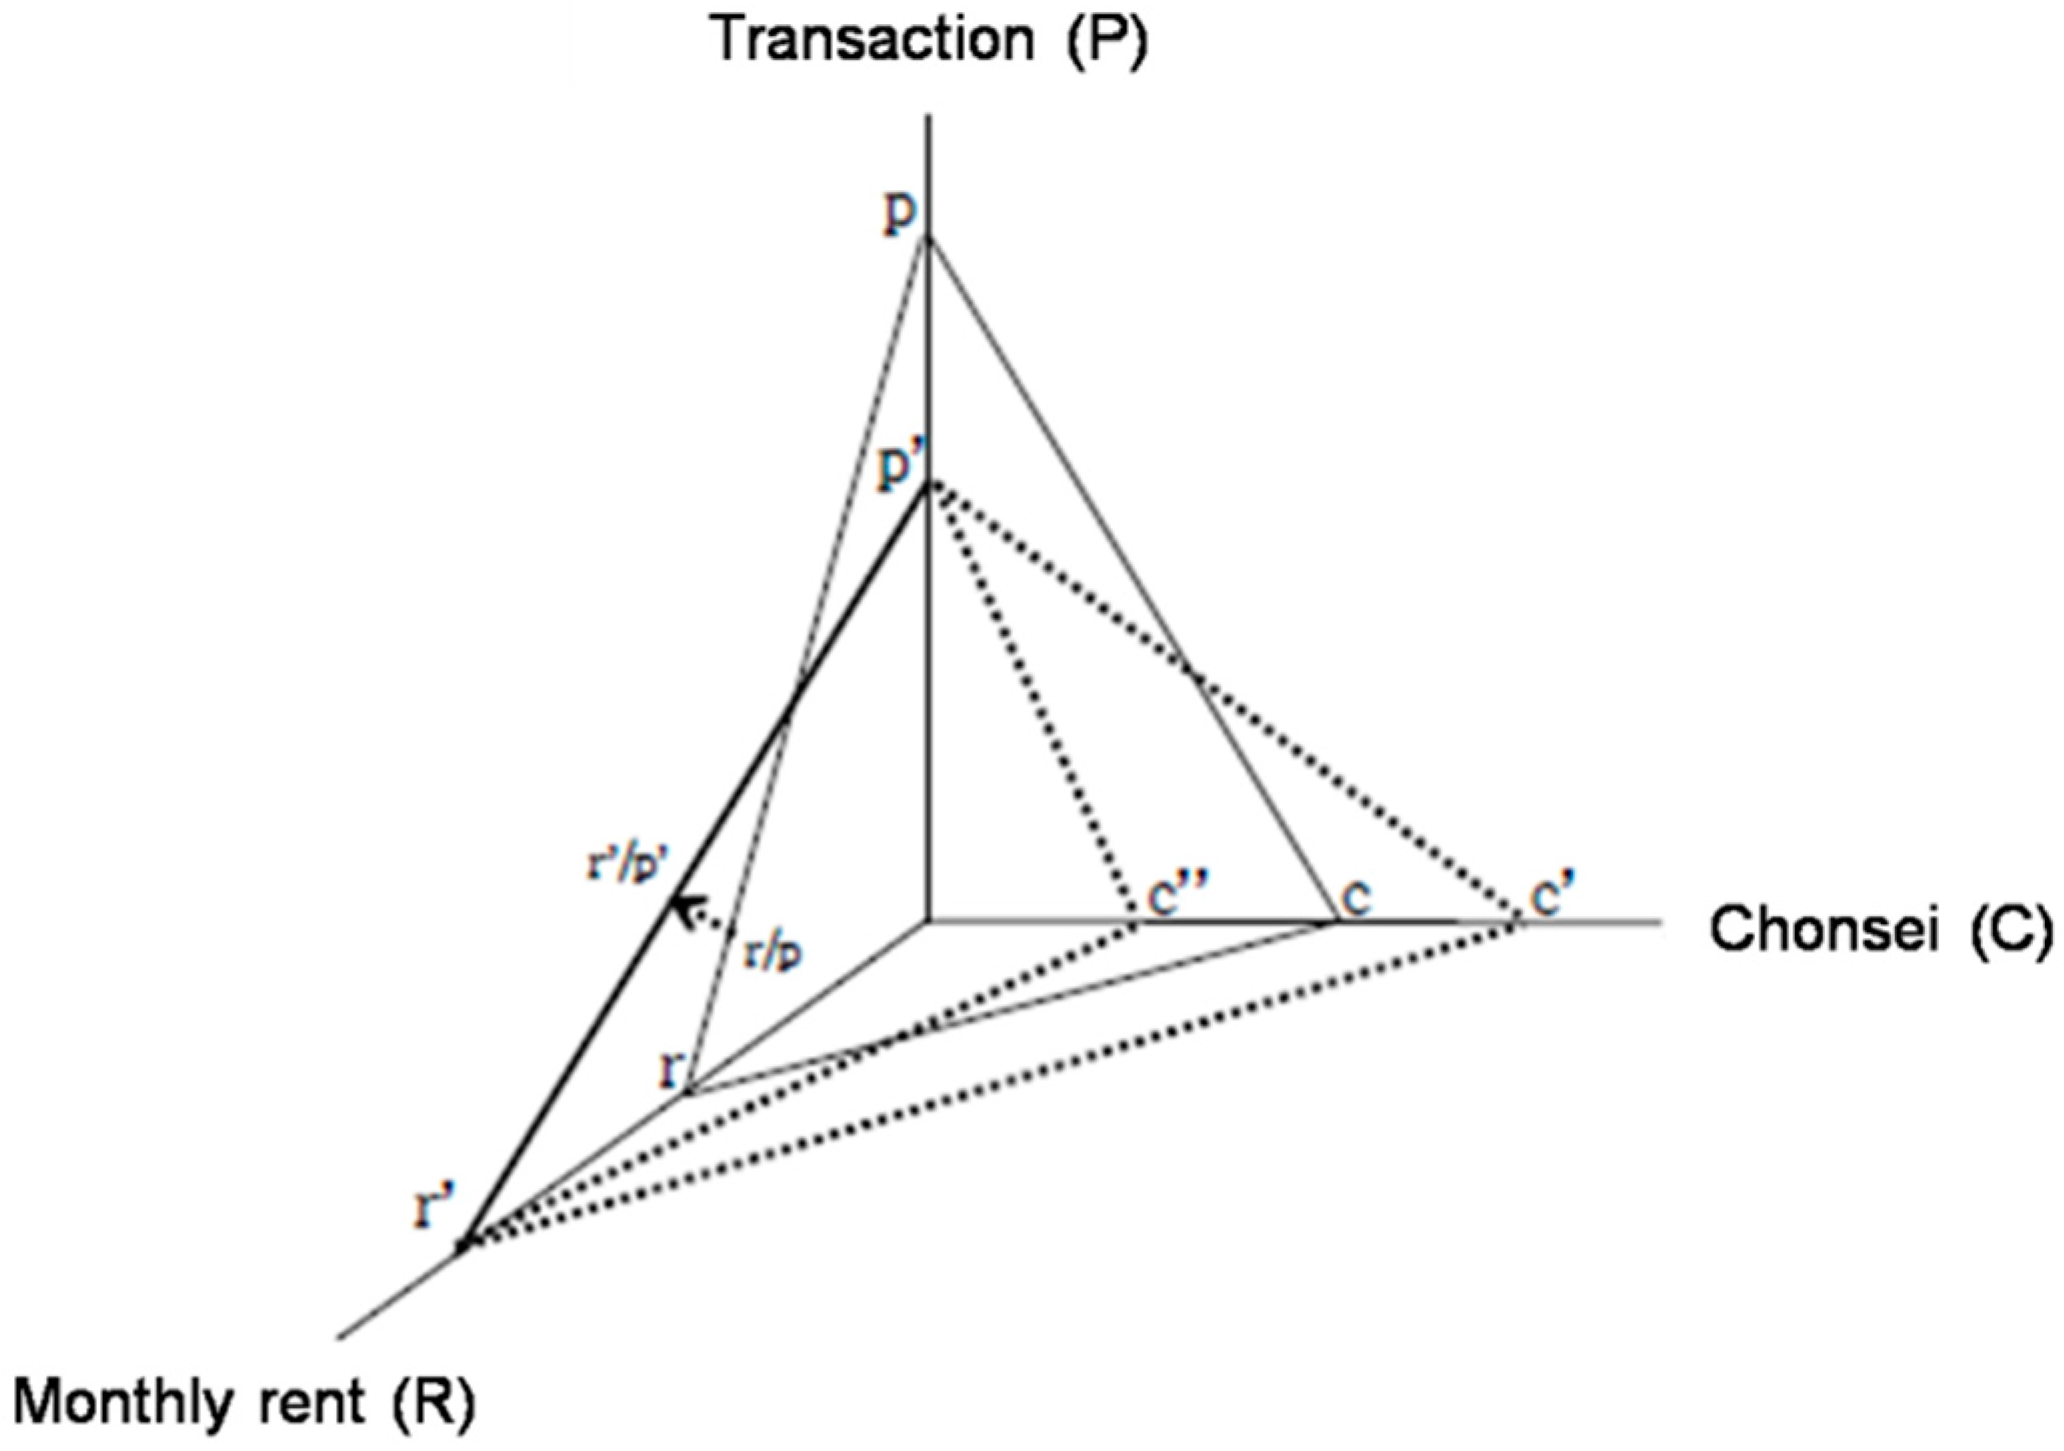
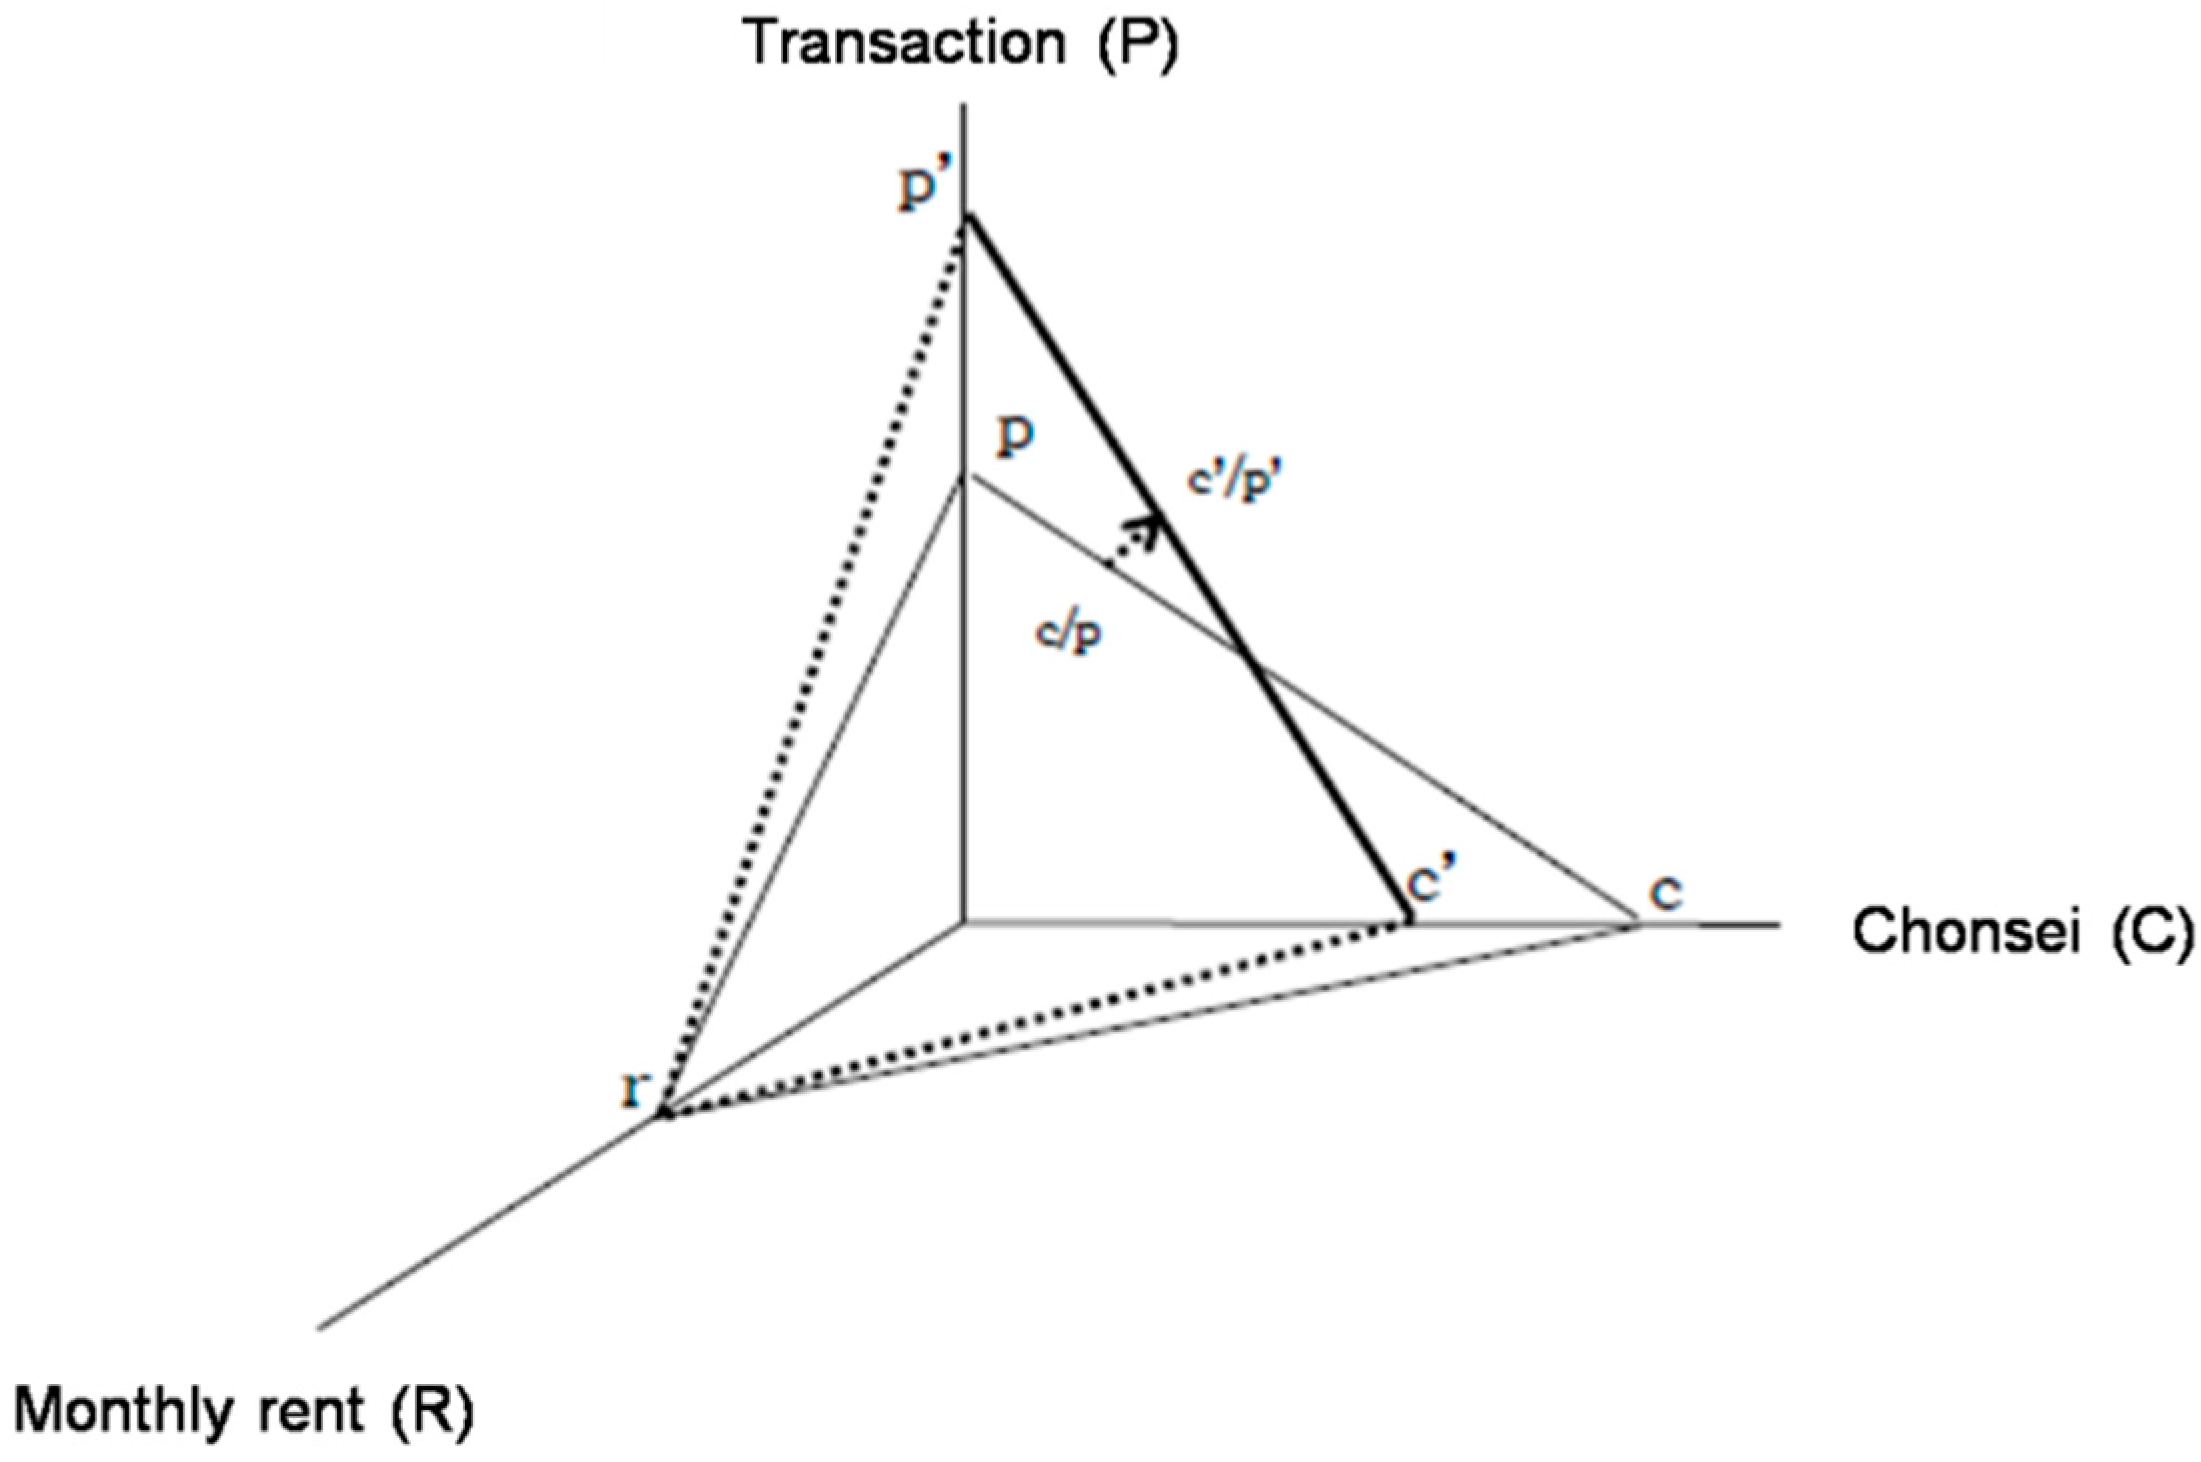
The change in the market caused by a change in the market interest rate is as shown in Figure 7 below. According to the FDW model, housing price can be defined to be the value obtained by converting the rent (monthly rent) using the capitalization rate. If it is assumed that the capitalization rate moves in the same direction as the market interest rate moves, the transaction price drops and the rent (monthly rent) increases as the market interest rate increases. As can be seen in Figure 7, if the market interest rate increases in the initial equilibrium state, the transaction price moves p → p′ and the monthly rent r → r′ and the monthly rent/transaction ratio grows. At this time, though the chonsei price changes being affected at the same time by the transaction price and the monthly rent, it is difficult to predict whether the change direction will be c → c′ or c → c″. It is because the market interest rate has an effect not only on the financing capability of the buyers-to-be but also on the suppliers as it acts as the reference for the profit rate in the housing rental market. First, if the market interest rate increases, the monthly rent also increases. Accordingly, demand can move between the monthly rental market and the chonsei market by comparing the interest rate, chonsei/monthly rent conversion rate and the capitalization rate. In addition, if the market interest rate increases, the transaction price drops. It is because the investment demand psychology for the transaction market has been shrunk and the financing capability of the end users in the chonsei market has been aggravated. Moreover, the aggravation of the financing capability of the end users resulting from the increase in the interest rate may cause movement of the demand up to the monthly rental market. Like this, it is difficult to predict how the price will actually change following a change in the interest rate because bi-directional changes in demand and supply occur in the chonsei market as a result of a change in the interest rate. However, as the change in the interest rate acts as an unfavorable factor on the housing transaction market, the unsold new housing stocks increase.
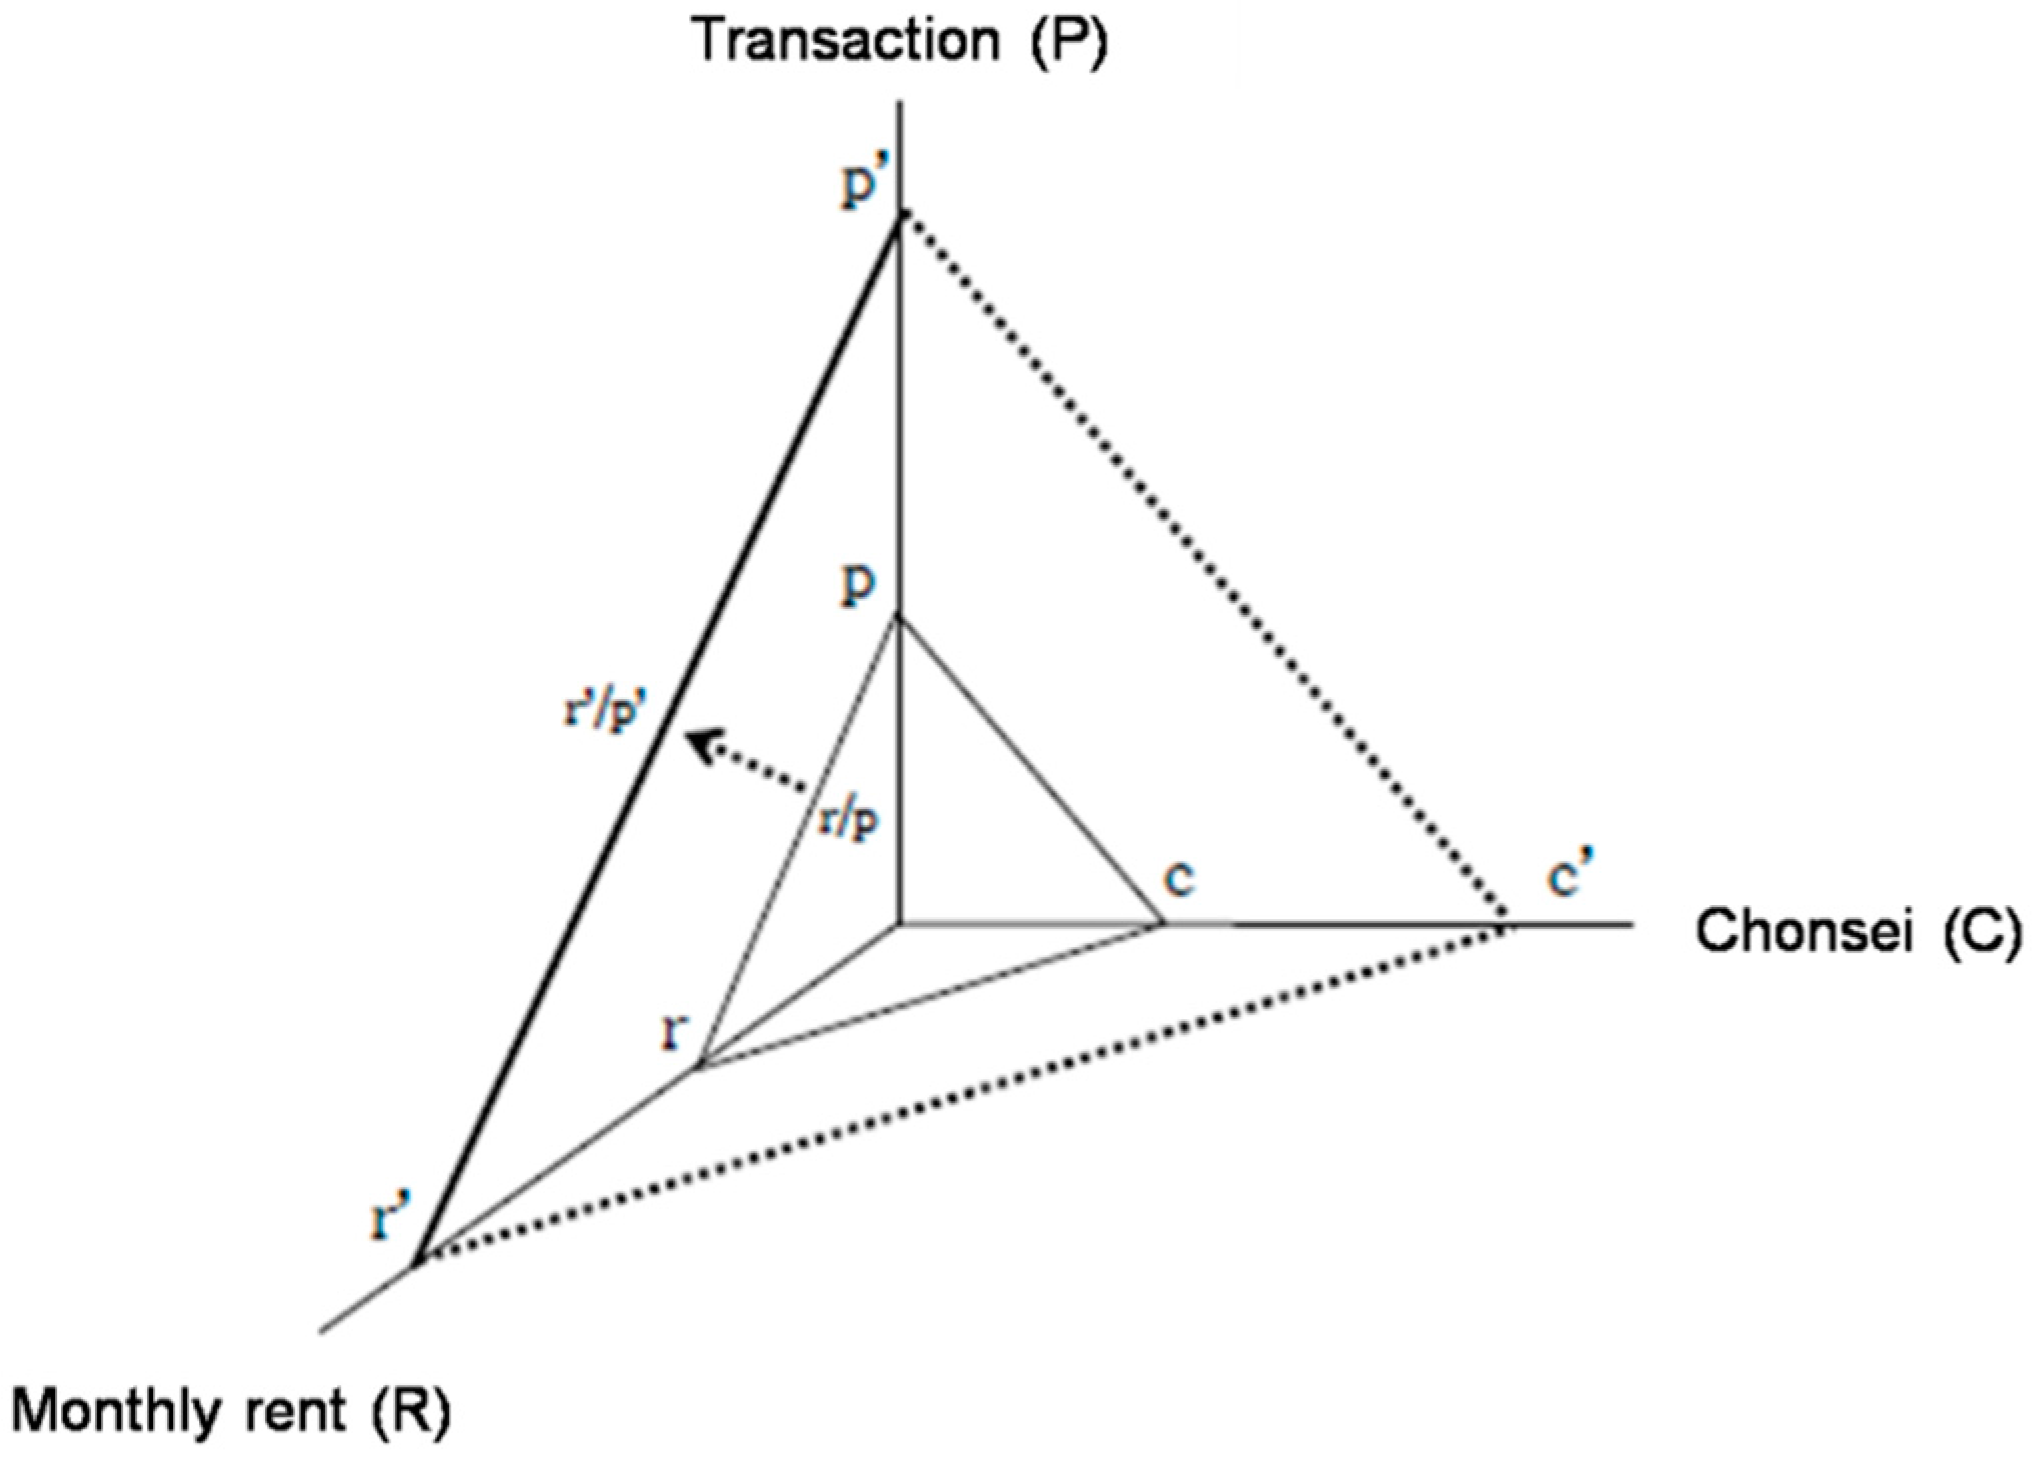
As the expected price increase rate is for the house investors to expect an increase or a decrease in the housing price in the future, it is conceptually independent from monthly rent. When we look it in the viewpoint of financial transaction, an increase in the expected price increases the housing price. However, chonsei price moves in the opposite direction to the expected price increase rate in the relations between the three markets. As the chonsei market has a nature of a rental market and reflects the current flow of the housing service, increase in the expected price increase rate has an effect of decreasing chonsei. Figure 8 shows that, as the expected price increase rate increases in the initial equilibrium state, the transaction prices increases p → p′ and the chonsei price decreases c → c′. At this time, if the monthly rent is fixed, as the chonsei/monthly rent conversion rate increases, a bigger amount of monthly rent is required when converting the same chonsei amount to monthly rent. The chonsei/transaction ratio c′/p′ becomes bigger than c/p. Meanwhile, the rate of increase in c′/p′ varies depending on how sensitively the transaction and chonsei prices respond to the expected price increase rate. Accordingly, in the situation future price increase is expected, the chonsei price drops in comparison to the transaction price. In addition, as the increase in the transaction price following an increase in the expected price increase rate means inflow of the demand for houses into transaction market, the unsold new housing stocks come to decrease.
The content mentioned above expresses the result of the theoretical review carried out by analyzing the relations between the individual markets. However, the movement of the prices in an actual market is affected by demand and supply factors. In an equilibrium state, the rent (monthly rent) increases due to the decrease in supply (stock), etc. as shown in the FDW model and an increase in the rent brings about an increase in the transaction price if other factors such as the market interest rate are unchanged. In the same context, increase in demand brings about an increase in the rent and an increase in the transaction price. Accordingly, as it can be seen in Figure 9, an increase in the demand and a decrease in the supply in an equilibrium state increase the transaction price and the monthly rent p → p′ and r → r′, respectively. As the chonsei price moves in the same direction as the monthly rent and the transaction price move, the chonsei price increases from c to c′. Of course, as the elasticity of the monthly rent and the transaction price relative to demand and supply and the elasticity of chonsei price relative to the change in the monthly rent and the transaction price are different from each other, the gradients of r′/p and r/p increase or decrease. In addition, in such a change in the housing market, the unsold new housing stocks decrease.

4. Empirical Analysis

4.1. Variables and Data Collection

This study selected variables below utilizing the three-dimensional housing market structure based on the FDW model above (cf. Appendix A). That is to say, the housing market is basically divided into transaction market which is a property market rental market which is a spatial market and the rental market is subdivided into chonsei market and monthly rental market reflecting the characteristics of the Korean housing market. In this paper, housing transaction price index, housing chonsei price index and housing monthly rent index are set as the variables that represent each market. In addition, KOSPI is defined as the macroeconomic variable that is the variable of the first quadrant variable of the FDW model. KOSPI is the composite price index of stocks of Korea, which was utilized as a variable of this paper because it enables not only the macroscopic market situation to be checked but also the overall flow of the investment market to be taken into account. As the interest rate has an effect on the capabilities of the buyers-to-be of houses to raise funds and on the investment profit rate as mentioned earlier, it has a great effect on the housing market. Furthermore, it can have an effect not only on the chonsei market but also on the monthly rental market due to its relations with the capitalization rate and chonsei/monthly rent conversion rate. For this reason, interest rate was selected as an analysis variable. In addition, among the various indexes that can be used to grasp the movement of housing demand and supply, housing loan and the number of houses supplied were defined as the analysis variables in this paper. As it costs much to purchase a house to the extent it accounts for a very big portion of the asset possessed by general households, it is secured through a loan in general. Accordingly, it is thought that whether the potential demand for houses moves to the house transaction market or not can be grasped by checking the level of housing loan. In addition, as to the level of housing supply, the actual number of houses supplied was utilized as the analysis variable.
The relevant data were acquired through Statistics of Korea. As housing loan data have been announced by Statistics of Korea since 2004, it is confirmed that the time series data are shorter than that of other variables. Accordingly, in this paper, the dynamic relation between the fluctuations in the Korean housing market and occurrence of unsold new housing stocks was analyzed setting the period from January 2004 till December 2015 as the analysis period.

4.2. Empirical Procedure

The series data stationarity must be secured to perform a series analysis. Unstable series data would result in a spurious regression, which makes no correlated variables seem as if they had a high correlation between each other [27]. Thus, the stationarity of the series data must first be secured before performing the analysis. Unstable series data include unit roots. Hence, analyzing them would mean performing a unit root test [28]. The augmented Dickey–Fuller (ADF) test, which is a representative unit root test, was used to test the stationarity of the serial data. Most of the DF-t statistical values in the level variables presented a significance level higher than 1%, 5%, and 10%. Thus, the null hypothesis of the existence of unit roots could not be rejected. However, the null hypothesis of the existence of unit roots was rejected at 1%, 5%, and 10% significance levels after performing the unit root test by 1st differencing variables. This result implies that the 1st differencing variables are stationary (cf. Appendix B).
A spurious regression is obtained if the typical regression analysis method is applied to the variables judged as unstable series data. Thus, analyzing the relationship between the unstable series data would lack statistical meaning. However, performing a typical regression analysis would be meaningful if a cointegration relation exists between such unstable series data. The analysis should be performed using the VEC model if a cointegration exists [29].
A proper time lag test is performed to conduct the cointegration test. The VAR model provides an error when a time lag length is randomly set. Thus, the time lag is tested according to an information criterion to secure the reliability of the research. The p lag of the VAR(p) model is generally determined through different methods, including the Akaike information criteria (AIC) and the Schwarz information criteria (SIC), in which the minimized point of each criterion is determined as the proper time lag. The explanatory power of the proper time lags determined through these criteria increases when new variables are introduced. However, the model size increases at the same time, and its degree of freedom decreases. Thus, the side with the lowest time lag is selected to secure the model conciseness [30]. A time lag of 2 is selected as the proper time lag according to the SIC method (cf. Appendix C).
The Johansen test, which is a representative co-integration test, was performed based on these results. The test resulted in the rejection of the null hypothesis, which says that “the number of co-integrated vectors is less than or equal to r”. A co-integration relation at a significance level of 5% was consequently revealed. Moreover, the analysis was performed through the VEC model because a co-integration exists between the level variables (cf. Appendix D).
The VAR model analysis results are sensitive to the arrangement order of the endogenous variables. Thus, determining the order of the variables according to their causal relationship is necessary before forming the VAR model. A Granger causality test was performed to this end. The Granger causality test is a method used to accurately separate the causal and outcome variables using a lag-distributed model, excluding economic theory [31].
The causal relationship determined after performing the Granger causality test was HS → UHS → KOSPI → HCPI → HRPI → HTPI → I →HL (cf. Appendix E).

4.3. Results

The impulse response analysis is used to verify the fluctuations of variables themselves and other variables over time when an impulse equivalent to a standard deviation of 1 is applied to the model variables. The ripple effect and the correlation between the variables can be analyzed through this [32]. The dynamic relationship between the unsold new housing stocks and the other variables of the housing market is also analyzed through this analysis.
Figure 10 shows the result of analyzing the impulse response between the unsold new housing stocks and the other variables of the housing market (cf. Appendix F). The implications of this are put in order in Table 1 and Table 2 below. In addition, the correlation between the above theoretical framework and the result of empirical analysis is put in order in Table 3 below.

5. Discussion and Conclusions

The objective of this paper is to examine the characteristics of occurrence of unsold new housing stocks by dividing the domestic housing market into the transaction market, chonsei market and the monthly rental market and analyzing their dynamic relations with occurrence of unsold new housing stocks through the vector error correction model and to elicit the implications for a housing business strategy that can effectively cope with the market risk in the Korean housing market. For this, in this paper, we defined the three-dimensional housing market structure of Korea based on the FDW model and examined the theory of imbalance between the housing demand and supply. Based on this, the number of the unsold new housing stocks, housing transaction price index, housing chonsei price index, housing monthly rent index, KOSPI, housing loan, interest rate, and the number of houses supplied were defined as the analysis variables. The temporal range of the time series data was January 2004 to December 2015, and the analysis data were secured through Statistics of Korea.
As a result of the analysis, it was basically confirmed that most of the theoretical relations between the number of the unsold new housing stocks and the housing market variables correspond to the result of the empirical analysis. In particular, the chonsei market that has a peculiar effect on the movement of the demand for houses in the middle of the transaction market and the monthly rental market is a housing market form unique to Korea and also has a significant relation with occurrence of unsold new housing stocks. Among such results of comprehensive analysis, the implications for a housing business strategy that can effectively cope with the market risk taking into account the characteristics of the Korean housing market can be put in order as shown in Table 4 below.
Table 4 is summarized as follows. When the transaction price falls, the chonsei price rises. The housing chonsei price generally account for over 50% of the housing transaction price. However, as the number of the unsold new housing stocks increases, the housing chonsei demand increases sharply and the chonsei price show more than 90% of the transaction price. This means that if a certain ratio of the chonsei housing is supplied along with the transaction housing at the same time, developers can carry out the housing project stably against the market fluctuations. In other words, when only transaction housing are supplied, the loss may become very large when the number of the unsold new housing stocks increases sharply. However, if the transaction housing and chonsei housing are supplied simultaneously, the profit is relatively low, but catastrophic losses can be avoided rather than supplying only the transaction housing. In particular, if the number of the unsold housing stocks increases, the demand may rapidly move from the transaction market to the chonsei market and developers can secure funds equivalent to 80% to 90% of transaction price without interest cost. Moreover, it was confirmed that an increase in the housing chonsei price leads to an increase in the housing transaction price. It shows that developers become the lessor of the chonsei housing for a certain period, but it is able to profit from selling the chonsei housing to the market.
The basic concept of the housing business model proposed in this paper on the bases of the above analysis result is as follows: As it is very difficult to predict future housing demand and supply accurately due to the characteristics of the construction industry, it is impossible to prevent occurrence of unsold new housing stocks at source. Accordingly, it is important to secure strategic flexibility to cope with the uncertainty of the future such as occurrence of unsold new housing stocks. In such a viewpoint, this paper proposes to utilize the chonsei market which is a rental market unique to Korea. When we look into the fluctuations in the transaction price and chonsei price caused by the impulse of unsold new housing stocks, fluctuations in the number of unsold new housing stocks caused by the changes in the transaction price and the chonsei price, and the relation between the transaction price and the chonsei price put in order in 
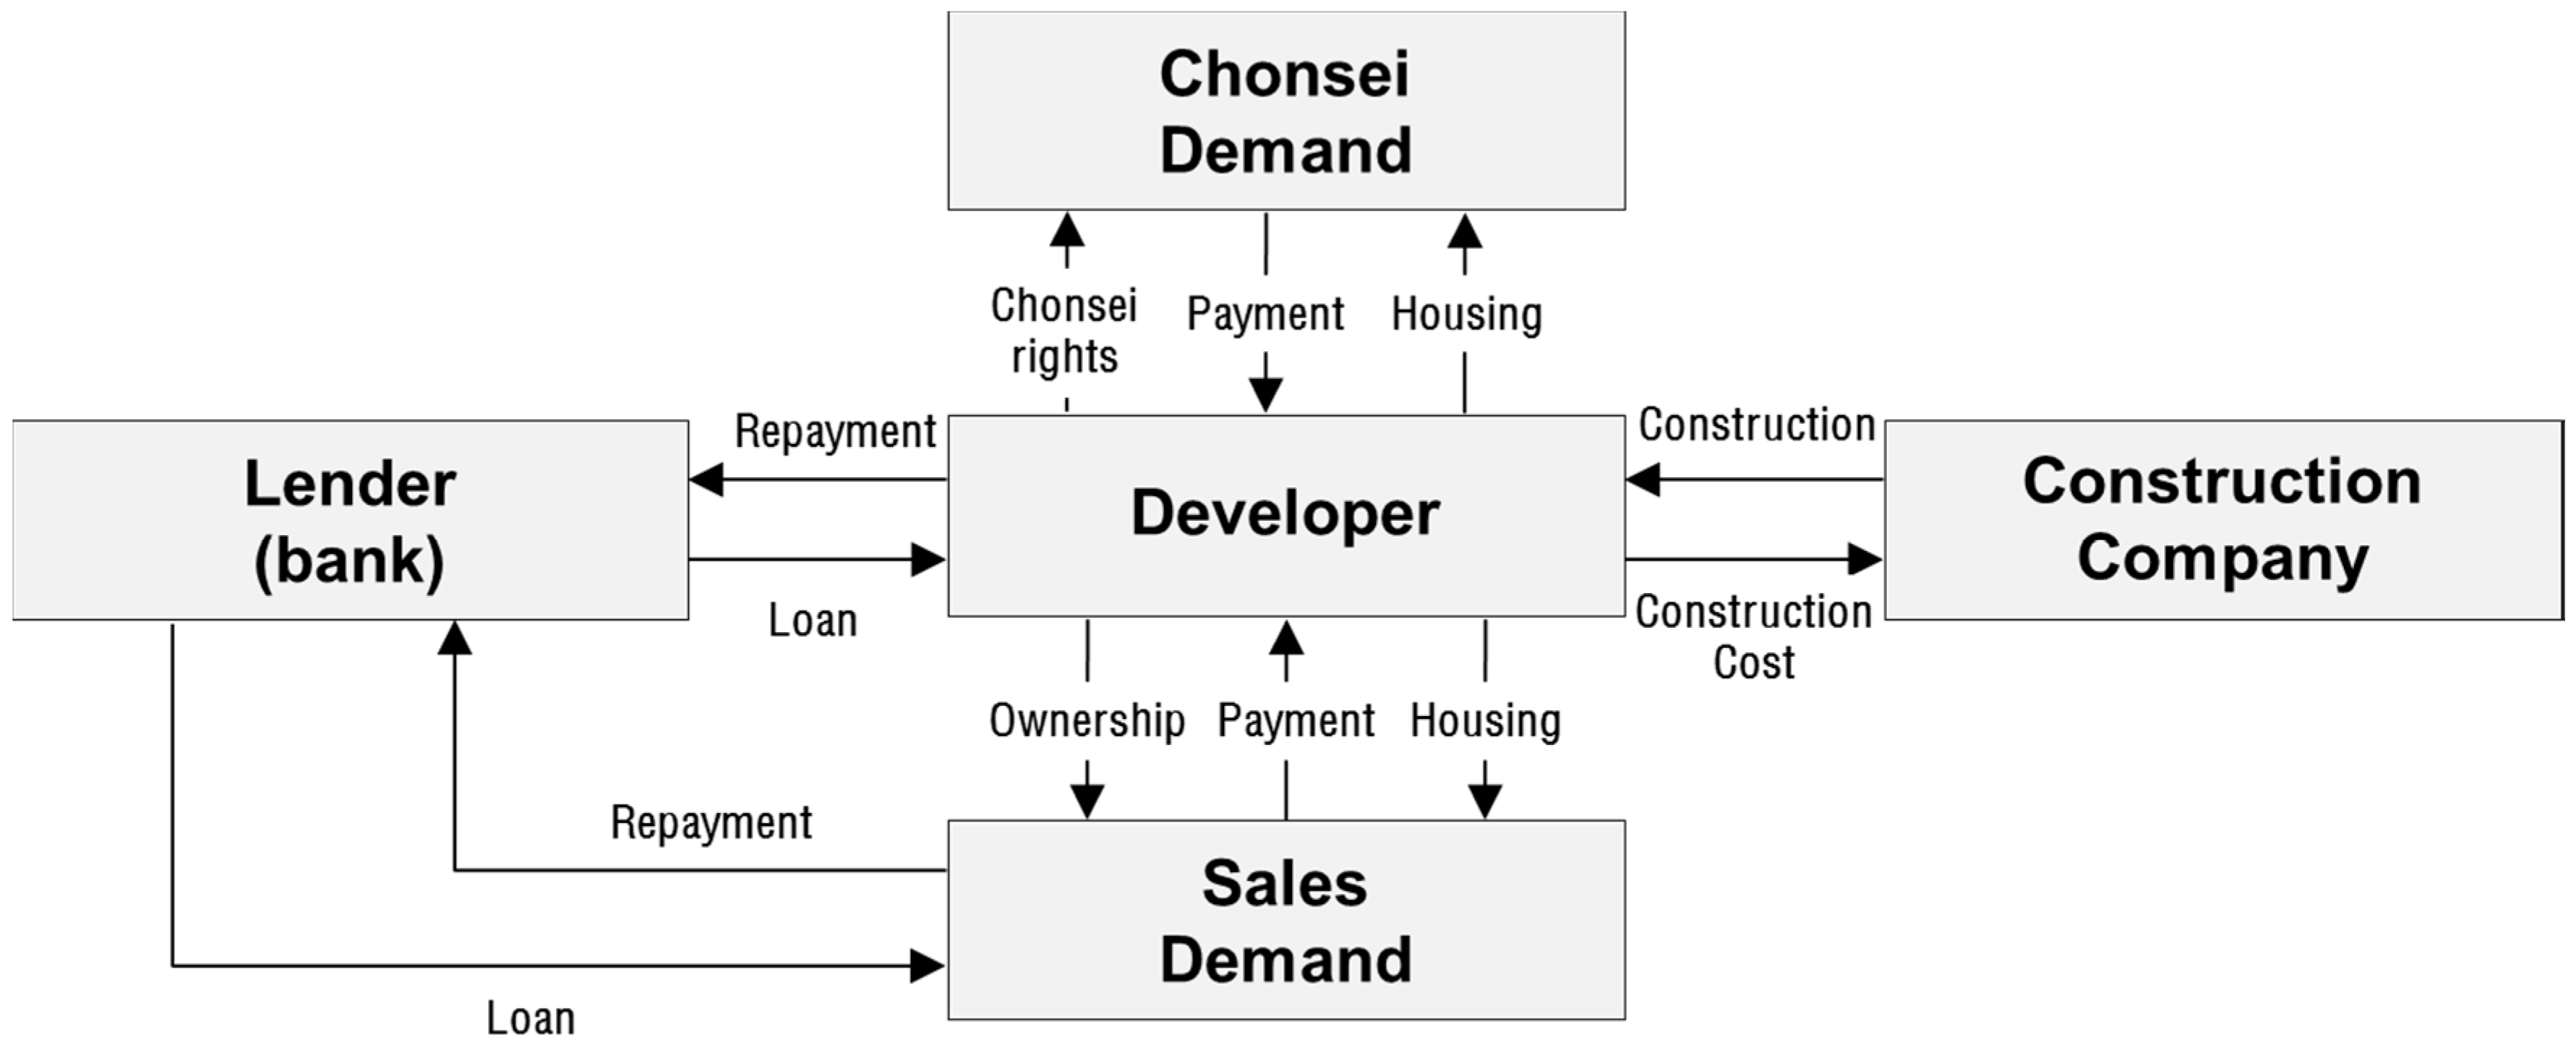
Table 4 above, it is thought that stable financing through the chonsei market can contribute to stable management of housing businesses against abrupt market fluctuation. As the tenant deposits a security amounting to 40% to 90% of the transaction price with the landlord under a chonsei contract, funds can be effectively raised with the security deposit during the business period. In addition, if the market situation improves after two years when the chonsei contract expires, the landlord may sell the relevant house and pay back the chonsei security deposit to the tenant, and, if the market stagnation continues, it is easy for the landlord to extend the chonsei contract period as the tenant may also stay in the chonsei market. That is to say, the chonsei market can be utilized as a way to effectively cope with the future changes in the market. In such a viewpoint, this paper proposes to construction companies a business model of supplying houses to both the chonsei market and the transaction market at a certain ratio as shown in Figure 11 below instead of supplying the whole quantity to the transaction market when conducting a housing business. In this business model, supply of chonsei houses plays the role of lowering the sensitivity to the market fluctuation by effectively raising funds and enhancing the leverage effect and supply of transaction houses plays the role of securing a short-term profit.
However, a plan for determining the housing supply stocks that will be targeted at each market is necessary to materialize the sustainable housing project model proposed in this paper. Moreover, in terms of policies, a plan for supplementing the business model proposed herein will also be necessary. Thus, the cash flow of the sustainable housing projects model will be completed and its validity will be tested in future studies. In addition, policy support measures will be explored to harmonize the flow of funds between the tenants and the landlords.

Acknowledgments

This research was supported by Basic Science Research Program through the National Research Foundation of Korea (NRF) funded by the Ministry of Science, ICT & Future Planning (No. 2015R1A5A1037548).

Author Contributions

Younghoon Lee developed the concept and drafted the manuscript. Sanghyo Lee revised the manuscript and supervised the overall work. Jaejun Kim reviewed the manuscript. All authors read and approved the manuscript.

Conflicts of Interest

The authors declare no conflict of interest.

Appendix A

Table A1. Variables and descriptions.
VariablesDescriptionsPeriodFrequency
UHSUnsold new housing stocksJanuary 2004–December 2015Monthly
HTPIHousing transaction price indexJanuary 2004–December 2015Monthly
HCPIHousing chonsei price indexJanuary 2004–December 2015Monthly
HRPIHousing monthly rent indexJanuary 2004–December 2015Monthly
KOSPIKorea Stock Price IndexJanuary 2004–December 2015Monthly
HLHousing LoanJanuary 2004–December 2015Monthly
IInterestJanuary 2004–December 2015Monthly
HSAmount of housing supplyJanuary 2004–December 2015Monthly

Appendix B

Table B1. Unit root tests (augmented Dickey–Fuller tests).
VariablesLevel1st Differencing
t-Statisticp-Valuet-Statisticp-Value
UHS−0.7429390.9674−14.642580.0000
HTPI−1.4440990.8437−5.7420180.0000
HCPI−3.0433460.1244−4.2714090.0046
HRPI−2.5419010.3078−3.3260520.0663
KOSPI−2.1188960.5305−11.695290.0000
HL−1.9797030.6070−7.9418990.0000
I−2.9450350.1518−5.9336720.0000
HS−6.9348950.0000−12.665010.0000
Notes: The number of lags is selected using the Schwarz information criterion with pmax = 13.

Appendix C

Table C1. Lag specification results.
LagAICSIC
0−12.77082−12.59948
1−39.97615−38.43416
2−41.62873−38.71608
3−41.65922−37.37590
4−41.35413−35.70016
5−41.11836−34.09372
6−41.19385−32.79855
7−41.13642−31.37046
8−41.20596−30.06934

Appendix D

Table D1. Co-integration test results.
Null HypothesisTest Statistic0.05 Critical Valuep-Value
r = 0 *205.3177159.53970.0000
r 1 *137.8124125.61540.0073
r ≤ 284.7048895.753660.2253
r ≤ 356.7691269.818890.3477
r ≤ 435.8330347.856130.4048
r ≤ 515.9932229.797070.7128
r ≤ 65.96262015.494710.7000
r ≤ 70.1810503.8414660.6705
Notes: * Significant at 5% level; r is the co-integration rank.

Appendix E

Table E1. Granger causality test results.
Lag 1Lag 2
CausalityF-Statisticp-ValueCausalityF-Statisticp-Value
UHSHTPI6.684840.0108UHSHCPI2.533220.0831
UHSHRPI3.523890.0626HSUHS5.178840.0068
UHSKOSPI3.702060.0564HRPIHTPI3.668790.0281
HSUHS6.199210.0140HTPIHL4.653550.0111
HTPIHL5.385310.0218HTPII2.832080.0624
HTPII60193830.0140HCPIHRPI5.437240.0053
HCPIHRPI8.044450.0052KOSPIHCPI12.49101.E-05
KOSPIHCPI3.376030.0683IHCPI3.816820.0244
HLHCPI3.516870.0628HCPII7.980160.0005
IHCPI6.595640.0113HRPIKOSPI2.928360.0569
HCPII15.45960.0001HRPIHL2.963070.0550
HRPIKOSPI3.463910.0648KOSPII4.755600.0101
HRPIHL3.220000.0749
KOSPII3.661470.0577

Appendix F

Table F1. Impulse response results.
Period (Month)UHSHTPI
UHSHTPIHCPIHRPIKOSPIHLIHSUHSHTPIHCPIHRPIKOSPIHLIHS
10.23810.00000.00000.02030.00000.00000.00000.00000.00050.00380.00190.00070.00040.00000.0000−0.0005
20.1761−0.0007−0.01290.04190.0034−0.02920.00700.01390.00140.00740.00360.00200.00160.0006−0.0005−0.0015
30.1807−0.0105−0.0230−0.0238−0.0005−0.03540.02130.0389−0.00010.00970.00480.00290.00290.0012−0.0012−0.0028
40.1844−0.0230−0.0191−0.0052−0.0053−0.02920.03140.0377−0.00150.01070.00540.00300.00400.0014−0.0017−0.0049
50.1799−0.0408−0.02050.0017−0.0129−0.03480.03730.0369−0.00250.01070.00570.00240.00480.0014−0.0018−0.0061
60.1833−0.0467−0.01850.0001−0.0113−0.03440.04150.0432−0.00320.01020.00580.00130.00530.0015−0.0019−0.0067
70.1869−0.0501−0.01880.0000−0.0102−0.03100.04510.0454−0.00350.00970.00570.00030.00580.0016−0.0020−0.0071
80.1875−0.0529−0.0190−0.0026−0.0084−0.03040.04680.0474−0.00360.00940.0053−0.00060.00610.0015−0.0022−0.0075
90.1881−0.0544−0.0184−0.0038−0.0078−0.03090.04750.0484−0.00360.00920.0048−0.00130.00630.0015−0.0023−0.0079
100.1879−0.0550−0.0178−0.0040−0.0073−0.03170.04780.0483−0.00360.00920.0043−0.00190.00640.0015−0.0023−0.0083
Period (Month)HCPIHRPI
UHSHTPIHCPIHRPIKOSPIHLIHSUHSHTPIHCPIHRPIKOSPIHLIHS
10.00000.00000.00340.0000−0.00040.00010.0000−0.00040.00010.00000.00010.0007−0.00010.00000.00000.0000
20.0005−0.00030.00570.00010.0000−0.0003−0.0006−0.00090.00010.00000.00020.0009−0.00020.00000.00000.0001
30.0009−0.00060.00760.00020.0017−0.0010−0.0017−0.00130.00010.00000.00040.0011−0.00020.00010.00000.0003
40.0012−0.00100.0090−0.00020.0026−0.0013−0.0027−0.00140.0001−0.00010.00070.0013−0.00030.00010.00000.0005
50.0016−0.00170.0102−0.00070.0033−0.0019−0.0037−0.00140.0001−0.00010.00090.0014−0.00030.0002−0.00010.0007
60.0018−0.00240.0109−0.00130.0039−0.0025−0.0047−0.00140.0001−0.00020.00120.0015−0.00030.0002−0.00020.0008
70.0020−0.00310.0115−0.00190.0043−0.0028−0.0056−0.00140.0001−0.00030.00140.0016−0.00030.0002−0.00030.0009
80.0020−0.00370.0118−0.00240.0045−0.0031−0.0064−0.00130.0001−0.00040.00160.0017−0.00020.0002−0.00050.0010
90.0021−0.00410.0119−0.00280.0047−0.0033−0.0069−0.00130.0001−0.00050.00180.0018−0.00020.0003−0.00060.0011
100.0021−0.00450.0120−0.00310.0048−0.0034−0.0074−0.00130.0000−0.00050.00190.0018−0.00020.0003−0.00070.0012
Period (Month)KOSPIHL
UHSHTPIHCPIHRPIKOSPIHLIHSUHSHTPIHCPIHRPIKOSPIHLIHS
10.00220.00000.00000.00000.05250.00000.00000.0112−0.00050.00030.00000.00040.00050.00370.0006−0.0003
20.0124−0.00320.0027−0.00480.0479−0.00020.00370.0164−0.00100.00130.00070.00070.00080.00500.0001−0.0003
30.0073−0.01070.0054−0.01240.04970.0054−0.00300.0131−0.00140.00220.00080.00040.00060.00490.0001−0.0002
40.0052−0.01490.0038−0.01590.05120.0055−0.00880.0109−0.00190.00250.00060.00030.00060.00460.0004−0.0004
50.0045−0.01720.0016−0.02080.05200.0046−0.01130.0121−0.00200.00250.00040.00020.00070.00430.0007−0.0008
60.0044−0.0187−0.0005−0.02360.05110.0044−0.01210.0121−0.00200.00250.00020.00000.00090.00420.0009−0.0012
70.0045−0.0192−0.0026−0.02530.05070.0042−0.01270.0116−0.00190.00240.0000−0.00020.00100.00420.0010−0.0014
80.0047−0.0191−0.0047−0.02620.05040.0037−0.01270.0107−0.00190.0024−0.0002−0.00040.00100.00420.0011−0.0015
90.0049−0.0185−0.0066−0.02680.05000.0033−0.01210.0099−0.00180.0025−0.0004−0.00050.00100.00430.0012−0.0016
100.0052−0.0178−0.0082−0.02720.04960.0031−0.01120.0092−0.00180.0026−0.0006−0.00070.00100.00420.0013−0.0017
Period (Month)IHS
UHSHTPIHCPIHRPIKOSPIHLIHSUHSHTPIHCPIHRPIKOSPIHLIHS
10.00060.00130.00720.0012−0.00550.00000.0333−0.00420.00000.00000.00000.00000.00000.00000.00000.5383
20.0047−0.00030.02210.0036−0.00410.00250.0539−0.0090−0.0220−0.0076−0.04320.07890.0585−0.0166−0.03450.2358
30.0108−0.00050.03380.00370.00430.00430.0613−0.00910.0311−0.0318−0.03790.12420.1008−0.1007−0.07560.1057
40.01370.00010.04250.00310.01370.00660.0618−0.00960.0031−0.0665−0.03870.07380.0964−0.0791−0.04760.1225
50.01370.00010.04900.00150.02030.00900.0587−0.0113−0.0066−0.0900−0.01650.05920.0984−0.0331−0.03900.1297
60.0112−0.00110.0532−0.00130.02480.01110.0542−0.01330.0012−0.0933−0.00140.04180.0991−0.0228−0.05370.1592
70.0083−0.00290.0556−0.00470.02780.01230.0500−0.0151−0.0008−0.0899−0.00090.03420.1051−0.0258−0.06530.1655
80.0060−0.00510.0566−0.00830.02980.01280.0467−0.0163−0.0020−0.0885−0.00320.03390.1089−0.0319−0.07250.1589
90.0044−0.00720.0566−0.01160.03110.01300.0443−0.0173−0.0047−0.0903−0.00600.03120.1105−0.0345−0.07620.1521
100.0035−0.00880.0559−0.01440.03190.01300.0426−0.0182−0.0072−0.0929−0.00840.02800.1114−0.0340−0.07760.1473

References

  1. Park, M.; Lee, M.; Lee, H.; Hwang, S. Boost, Control, or Both of Korean Housing Market: 831 Countermeasures. J. Constr. Eng. Manag. 2010, 136, 693–701. [Google Scholar] [CrossRef]
  2. Kangari, R. Business Failure in Construction Industry. J. Constr. Eng. Manag. 1988, 114, 172–190. [Google Scholar] [CrossRef]
  3. Kwoun, M.J.; Lee, S.H.; Kim, J.H.; Kim, J.J. Dynamic Cycles of Unsold new housing stocks, Investment in Housing, and Housing Supply-Demand. Math. Comput. Model. 2013, 57, 2094–2105. [Google Scholar] [CrossRef]
  4. Kim, J. Financial repression and housing investment: An analysis of the Korean chonsei. J. Hous. Econ. 2013, 22, 338–358. [Google Scholar] [CrossRef] [Green Version]
  5. Ambrose, B.W.; Kim, S. Modeling the Korean Chonsei Lease Contract. Real Estate Econ. 2003, 31, 53–74. [Google Scholar] [CrossRef]
  6. Riddel, M. Housing-market disequilibrium: An examination of housing-market price and stock dynamics 1967–1998. J. Hous. Econ. 2004, 13, 120–135. [Google Scholar] [CrossRef]
  7. Chen, J.; Guo, F.; Wu, Y. One decade of urban housing reform in China: Urban housing price dynamics and the role of migration and urbanization, 1995–2005. Habitat Int. 2011, 35, 1–8. [Google Scholar] [CrossRef]
  8. Jud, G.D.; Winkler, D.T. The Dynamics of Metropolitan Housing Price. J. Real Estate Res. 2002, 23, 29–46. [Google Scholar]
  9. Case, K.E.; Mayer, C.J. Housing price dynamics within a metropolitan area. Reg. Sci. Urban Econ. 1996, 26, 387–407. [Google Scholar] [CrossRef]
  10. Clapp, J.M.; Giaccotto, C. The Influence of Economic Variables on Local House Price Dynamics. J. Urban Econ. 1994, 36, 161–183. [Google Scholar] [CrossRef]
  11. Kim, S. Choice of Rental Housing in Korean Market: Alternative Approach. J. Urban Plan. Dev. 1991, 117, 41–58. [Google Scholar] [CrossRef]
  12. Kim, K.; Jeon, J.S. Why do households rent while owning houses? Housing sub-tenure choice in South Korea. Habitat Int. 2012, 36, 101–107. [Google Scholar] [CrossRef]
  13. Vakili-zad, C.; Hoekstra, J. High dwelling vacancy rate and high price of housing in Malta a mediterranean phenomenon. J. Hous. Built Environ. 2011, 26, 441–455. [Google Scholar] [CrossRef]
  14. Couch, C.; Cocks, M. Housing Vacancy and the Shrinking City: Trends and Policies in the UK and the City of Liverpool. Hous. Stud. 2013, 28, 499–519. [Google Scholar] [CrossRef]
  15. Whitaker, S.; Fitzpatrick IV, T.J. Deconstructing distressed-property spillovers: The effects of vacant, tax-delinquent, and foreclosed properties in housing submarkets. J. Hous. Econ. 2013, 22, 79–91. [Google Scholar] [CrossRef]
  16. Molloy, R. Long-term vacant housing in the United States. Reg. Sci. Urban Econ. 2016, 59, 118–129. [Google Scholar] [CrossRef]
  17. Pfaff, B. Analysis of Integrated and Cointegrated Time Series with R, 2nd ed.; Springer: New York, NY, USA, 2008. [Google Scholar]
  18. Pindyck, R.S.; Rubinfeld, D.L. Econometric Models and Economic Forecasts, 4th ed.; McGraw-Hill: New York, NY, USA, 1998. [Google Scholar]
  19. Jiang, H.; Liu, C. Forecasting construction demand: A vector errorcorrection model with dummy variables. Constr. Manag. Econ. 2011, 29, 969–979. [Google Scholar] [CrossRef]
  20. Johansen, S. Statistical analysis of cointegration vectors. J. Econ. Dyn. Control. 1988, 12, 231–254. [Google Scholar] [CrossRef]
  21. Price, S. Cointegration and Modelling the Long Run; Oxford University Press: Oxford, UK, 1998. [Google Scholar]
  22. Engle, R.F.; Granger, C.W.J. Cointegration and Error Correction: Representation, Estimation, and Testing. Econometrica 1987, 55, 251–276. [Google Scholar] [CrossRef]
  23. Wong, J.M.W.; Chan, A.P.C.; Chiang, Y.H. Forecasting construction manpower demand: A vector errorcorrection model. Build. Environ. 2007, 42, 3030–3041. [Google Scholar] [CrossRef]
  24. Fisher, J.D. Integrating research on markets for space and capital. Real Estate Econ. 1992, 20, 161–180. [Google Scholar] [CrossRef]
  25. Dipasquale, D.; Wheaton, W.C. The markets for real estate assets and space: A conceptual framework. Real Estate Econ. 1992, 20, 181–198. [Google Scholar] [CrossRef]
  26. Kim, S.; Kim, J.; Kim, J. Structural Changes in the Korean Housing Market before and after Macroeconomic Fluctuations. Sustainability 2016, 8, 415. [Google Scholar] [CrossRef]
  27. Granger, C.; Newbold, P. Spurious regressions in econometrics. J. Econ. 1974, 2, 111–120. [Google Scholar] [CrossRef]
  28. Chen, J. Re-evaluating the association between housing wealth and aggregate consumption: New evidence from Sweden. J. Hous. Econ. 2006, 15, 321–348. [Google Scholar] [CrossRef]
  29. Eagle, R.; Granger, C. Cointegration and error correction: Representation, estimation and testing. Econometrica 1987, 55, 251–276. [Google Scholar]
  30. Boswijk, H.P. Efficient inference on cointegration parameters in structural error correction models. J. Econ. 1995, 69, 133–158. [Google Scholar] [CrossRef]
  31. Granger, C.W.J. Investigating Causal Relations by Econometric Models and Cross-Spectral Methods. Econometrica 1969, 37, 424–438. [Google Scholar] [CrossRef]
  32. Sims, C. Are forecasting models usable for policy analysis? Fed. Reserv. Bank Minneap. Q. Rev. 1986, 10, 2–16. [Google Scholar]
Figure 1. Concept of the monthly rent and the chonsei contract. (a) Monthly rent contract; (b) Chonsei contract.
Sustainability 09 00107 g001
Figure 2. Price fluctuations in the chonsei and transaction markets.
Sustainability 09 00107 g002
Figure 3. Trends of unsold new housing stocks.
Sustainability 09 00107 g003
Figure 4. Trends of chonsei/transaction ratio.
Sustainability 09 00107 g004
Figure 5. Fisher–Dipasquale–Wheaton (FDW) model.
Sustainability 09 00107 g005
Figure 6. Three-dimensional structure of the Korean housing market.
Sustainability 09 00107 g006
Figure 7. Market change following the fluctuation in the interest rate.
Sustainability 09 00107 g007
Figure 8. Market change as a result of an increase in the expected rate of price increase.
Sustainability 09 00107 g008
Figure 9. Market change following decreases in supply and increases in demand.
Sustainability 09 00107 g009
Figure 10. Impulse response graph. (a) Impulse response of UHS; (b) Impulse response of HTPI; (c) Impulse response of HCPI; (d) Impulse response of HRPI; (e) Impulse response of KOSPI; (f) Impulse response of HL; (g) Impulse response of I; (h) Impulse response of HS.
Sustainability 09 00107 g010
Figure 11. Basic concept of the housing business model proposed in this paper.
Sustainability 09 00107 g011
Table 1. Results of Impulse Response (IR) between unsold new housing stocks and housing price variables.
VariablesResultsImplications
Transaction price
-
As it can be seen in Figure 10a, the number of the unsold new housing stocks moves to the negative (−) direction from the beginning in reaction to the impulse of the housing transaction price, which has an effect on occurrence of unsold new housing stocks in the long run.
-
An increase in the housing transaction price after all means that the demand flows into the housing market. The number of the unsold new housing stocks comes to decrease accordingly. In particular, an increase in the housing transaction price generally motivates the demand for houses to move to the transaction market as the investors can expect a profit for housing investment.
-
As it can be seen in Figure 10b, though the housing transaction price moves to the positive (+) direction at the beginning in reaction to the impulse of the unsold new housing stocks, the effect is of a short-term. It is confirmed that the housing transaction price moves to the negative (−) direction in reaction to the impulse of the unsold new housing stocks in the long run.
-
An increase in the unsold new housing stocks after all means that the demand for houses does not move to the housing transaction market. Accordingly, the housing transaction price eventually drops. Moreover, as a decrease in the housing price may result in loss of assets and, in Korea, residential service can be secured through security deposit, if not the transaction market, because the chonsei market exists, if there is no definite signal for market recovery, the slump in the transaction market caused by an increase in the unsold new housing stock may be protracted.
Chonsei price
-
As it can be seen in Figure 10a, the number of unsold new housing stocks moves to the negative (−) direction from the beginning in reaction to the impulse of the housing chonsei price, which has an effect on occurrence of unsold new housing stocks in the long run.
-
As the housing chonsei price increases, the gap between the housing chonsei price and the housing transaction price gradually narrows. That is to say, if the housing chonsei/transaction price ratio gradually increases, the end users move to the housing transaction market where residential service can be more stable secured, as a result of which the number of the unsold new housing stocks decrease.
-
In the case of investment demand, an effective leverage investment can be made utilizing the security deposits of the tenants as a result of the increase in the housing chonsei price. That is to say, as an environment is formed where the investment demand can be enticed into the housing market due to the increase in the chonsei price, the number of the unsold new housing stocks decrease.
-
As it can be seen in Figure 10c, the housing chonsei price moves to the positive (+) direction from the beginning in reaction to the impulse of the unsold new housing stocks, which has an effect on the housing chonsei price in the long run.
-
An increase in the number of the unsold new housing stocks means that the demand for houses does not move to the housing transaction market. That is to say, it means that the end users of the housing chonsei market do not move to the transaction market. In addition, as an increase in the number of the unsold new housing stocks may mean that the investment demand that supplies chonsei houses to the market by purchasing houses may also decrease, the supply of chonsei houses may also decrease after all. As a result, an increase in the unsold new housing stocks increases the chonsei price.
Monthly rent price
-
As it can be seen in Figure 10a, the number of unsold new housing stocks moves in both directions alternately in reaction to the impulse of the housing monthly rent, and the range of fluctuation is also very narrow.
-
In general, an increase in the monthly rent makes demand move to the transaction market, which leads to a decrease in the unsold new housing stocks eventually. However, as the chonsei market exists in Korea, tenants do not directly flow into the transaction market.
-
In addition, an increase in the monthly rent may become a motive that induces investment demand to flow into the housing transaction market. However, as the chonsei market exists in Korea, because the investment demand intends to maximize the investment returns by comparing the leverage effect of utilizing the security deposits of the chonsei tenants and the monthly rent income, the effect of monthly rent on the unsold new housing stocks is thought to be limited.
-
As it can be seen in Figure 10d, though the monthly rent moves to the positive (+) direction in reaction to the impulse of unsold new housing stocks, the overall range of the change is very narrow and becomes gradually narrower with time.
-
Because the chonsei market exists as a buffer zone between the housing transaction market and the monthly rental market as mentioned above, the direct correlation is relatively low.
Table 2. Result of Impulse Response (IR) between unsold new housing stocks, demand and supply of houses, and macroeconomic variables.
VariablesResultsImplications
KOSPI
-
As it can be seen in Figure 10a, though the number of unsold new housing stocks moves to the positive (+) direction at the beginning in reaction to the impulse of KOSPI, the change direction is converted to negative (−) direction from the second month and the effect lasted. However, the range of fluctuation is found to decrease with time.
-
As an increase in KOSPI means that the economic situation improves after all, the number of the unsold new housing stocks is found to decrease as a whole.
-
As it can be seen in Figure 10e, though the range of fluctuation in KOSPI changes in reaction to the impulse of the unsold new housing stocks, the change is in the positive direction (+) from the beginning.
-
This is thought to be because of the characteristics of KOSPI which is a macroeconomic index and, at the same time, an investment market. That is to say, as an increase in the number of unsold new housing stocks means that the housing market will eventually stagnate, it means that the investment demand may move from the housing market to the stock market which is an alternative market.
Housing loan (HL)
-
As it can be seen in Figure 10a, the number of the unsold new housing stocks moves to the negative (−) direction from the beginning in reaction to the impulse of the housing loan, which has an effect on the number of the unsold new housing stocks in the long run.
-
As housing transaction fund is mostly raised through housing loan, an increase in the housing loan means an increase in the demand. For this reason, the number of unsold new housing stocks is thought to decrease as the housing loan increases.
-
As it can be seen in Figure 10f, the housing loan moves to the negative (−) direction from the beginning in reaction to the impulse of the unsold new housing stocks, which has an effect on the housing loan in the long run.
-
As an increase in the number of unsold new housing stocks means that the demand for houses does not flow into the transaction market, the housing loan is thought to decrease.
Interest (I)
-
As it can be seen in Figure 10a, the number of the unsold new housing stocks moves to the positive (+) direction from the beginning in reaction to the impulse of the interest rate, which has an effect on the number of the unsold new housing stocks continuously.
-
As an increase in the interest rate decreases the ability of the buyers-to-be to purchase houses, the number of the unsold new housing stocks may increase as a result of an increase in the interest rate.
-
As it can be seen in Figure 10g, though the interest rate moves to the positive (+) direction from the beginning in reaction to the impulse of the unsold new housing stocks, the range of fluctuation is found to become smaller with time.
-
As increase in the number of the unsold new housing stocks means that the market risk grows, the interest rate is thought to also increase reflecting this.
Housing supply (HS)
-
As it can be seen in Figure 10a, the number of the unsold new housing stocks moves to the positive (+) direction from the beginning in reaction to the impulse of the house supply, which has an effect on the number of the unsold new housing stocks continuously.
-
Unsold new housing stocks may occur due to excessive supply of houses.
-
As it can be seen in Figure 10h, though the housing supply moves in both directions alternately in reaction to the impulse of unsold new housing stocks, it is found to move in the negative (−) direction with time.
-
Occurrence of unsold new housing stocks means that the market situation is relatively risky after all, the supply of houses decreases.
Table 3. The connections between the theoretical framework and empirical results.
FactorsImplications for Empirical Results
Interest rate
-
As it can be seen in Figure 7 above, an increase in the interest rate theoretically brings down the housing transaction price. It is because the capability to purchase houses through borrowing of funds is lowered due to the increase in the interest rate. As a decrease in the demand for houses causes imbalance between the demand and supply in the housing transaction market in such a viewpoint, unsold new housing stocks may occur.
-
The same result appeared in the empirical analysis. As it can be seen in Figure 8a above, the number of unsold new housing stocks increases when the interest rate increases, and the effect of an increase in the interest rate is found to have persistency.
-
Furthermore, in Korea, as the chonsei market exists between the transaction market and the monthly rental market, the imbalance between the demand and supply in the housing market due to an increase in the interest rate may be intensified. That is to say, the demand may move to the transaction market if the monthly rent is relatively high even when the interest rate increases, as residential service can be secured using the security deposit through the chonsei market in Korea, it is not easy for the demand for houses to flow into the transaction market.
Expected rate of price increase
-
The theoretical relation mentioned in Figure 8 also appeared in the empirical analysis result. That is to say, as it can be seen in Figure 10b, the housing transaction price shows the biggest amount (+) of fluctuation in reaction to the impulse of the housing transaction price itself. That is to say, an increase in the housing transaction price means that the expected profit rate resulting from a future investment in houses can be increased. In addition, as shown in Figure 10a, as an increase in the housing transaction price decreases the number of unsold new housing stocks, an increase in the expected rate of price increase has an effect on decrease in the number of the unsold new housing stocks.
-
In addition, in the theoretic relation in Figure 8, the increase in the expected rate of price increase is shown to bring down the chonsei price. It is because the demand for houses moves as a profit is expected to be secured in the housing transaction market. A drop in the chonsei price following the movement of the demand for houses decrease the number of the unsold new housing stocks by resulting in an increase in the house transaction price. Such a result is also shown in the empirical analysis result in Figure 10c. That is to say, the impulse of the housing transaction price and the change in the chonsei price show a negative (−) relation. This means that an increase in the housing transaction price induces movement of the demand in the chonsei market as an investment profit can be expected.
Supply & Demand
-
According to the theoretical relation in Figure 9 above, an increase in the house supply or a decrease in the demand for houses increase the number of unsold new housing stocks. This corresponds to the result of the empirical analysis that can be also seen in Figure 10a. That is to say, the number of the unsold new housing stocks has shown a negative (−) long-term change for the impulse of the housing loan that represents increase and decrease in the demand for houses and a positive (+) long-term change for the impulse of housing supply.
Table 4. Implications for a housing business strategy that can effectively cope with the market risk.
RelationshipsDescription
Fluctuations in transaction price and chonsei price caused by the impulse of unsold new housing stocks
-
As a result of an empirical analysis, it is found that the transaction price drops (Figure 10b) and the chonsei price rises (Figure 10c) if the number of the unsold new housing stocks increases. This means that, particularly in a period of economic stagnation when the number of unsold new housing stocks rapidly increases, buyers-to-be of houses adhere to a conservative position on housing transaction due to occurrence of unsold new housing stocks, which means that the demand may rapidly move from the transaction market to the chonsei market after all.
Fluctuations in the number of unsold new housing stocks caused by the impulse of housing transaction price and chonsei price
-
As a result of an empirical analysis, the number of unsold new housing stocks shows negative (−) change in reaction to the impulse of both the housing transaction price and the housing chonsei price (Figure 10a).
-
Such a result is due to the intrinsic attribute of the housing transaction market and the housing chonsei market. That is to say, as an increase in the housing transaction price makes the investors expect a capital gain, an increase in the housing transaction price may eventually decrease the number of unsold new housing stocks. However, as only housing service, not a house, is secured by a chonsei contract, chonsei tenants cannot secure the profit resulting from the increase in the housing price. That is to say, as an increase in the housing chonsei price only means an increase in the housing service price, movement of the demand rather occurs due to the increase in the housing chonsei price.
Relation between housing transaction price and chonsei price
-
The above implications can be also found in Figure 10c,d. That is to say, though the housing chonsei price moves in the negative (−) direction in reaction to the impulse of the housing transaction price, the housing transaction price moves in the positive (+) direction in reaction to the impulse of the housing chonsei price.
-
When it is put in order, it means that, if the housing transaction price drops, the housing chonsei price increases. That is to say, in a period of housing market stagnation, a decrease in the transaction price may have a crucial effect on financing and profitability of housing projects. If the housing chonsei price that basically accounts for 50% or more of the transaction price rises continuously, financing which utilizes the relevant chonsei security deposit may rather become easier.
-
In addition, as an increase in the housing chonsei price leads to an increase in the housing transaction price, though no direct profit is made through the chonsei contract at present, a future housing profit can be expected.

