Article

Decomposition of the Urban Water Footprint of Food Consumption: A Case Study of Xiamen City

1
Key Lab of Urban Environment and Health, Institute of Urban Environment, Chinese Academy of Sciences, Xiamen 361021, China
2
University of Chinese Academy of Sciences, Beijing 100049, China
3
School of Resource and Environmental Science, Chifeng University, Chifeng 024000, China
*
Author to whom correspondence should be addressed.
Sustainability 2017, 9(1), 135; https://doi.org/10.3390/su9010135
Submission received: 10 December 2016 / Revised: 8 January 2017 / Accepted: 10 January 2017 / Published: 23 January 2017
(This article belongs to the Section Environmental Sustainability and Applications)

Abstract

:
Decomposition of the urban water footprint can provide insight for water management. In this paper, a new decomposition method based on the log-mean Divisia index model (LMDI) was developed to analyze the driving forces of water footprint changes, attributable to food consumption. Compared to previous studies, this new approach can distinguish between various factors relating to urban and rural residents. The water footprint of food consumption in Xiamen City, from 2001 to 2012, was calculated. Following this, the driving forces of water footprint change were broken down into considerations of the population, the structure of food consumption, the level of food consumption, water intensity, and the population rate. Research shows that between 2001 and 2012, the water footprint of food consumption in Xiamen increased by 675.53 Mm3, with a growth rate of 88.69%. Population effects were the leading contributors to this change, accounting for 87.97% of the total growth. The food consumption structure also had a considerable effect on this increase. Here, the urban area represented 94.96% of the water footprint increase, driven by the effect of the food consumption structure. Water intensity and the urban/rural population rate had a weak positive cumulative effect. The effects of the urban/rural population rate on the water footprint change in urban and rural areas, however, were individually significant. The level of food consumption was the only negative factor. In terms of food categories, meat and grain had the greatest effects during the study period. Controlling the urban population, promoting a healthy and less water-intensive diet, reducing food waste, and improving agriculture efficiency, are all elements of an effective approach for mitigating the growth of the water footprint.

1. Introduction

Water scarcity is being globally recognized as a serious and growing concern [1]. More than half of the world’s population now lives in cities, and the very rapid urban population growth expected in the next few decades will place more stress on water resources [2,3]. China’s historically rapid urbanization has led to two-thirds of China’s 669 cities having water shortages [4]. Furthermore, urbanization also places a greater demand on the food system, as resident incomes rise and urban diets evolve [5,6,7]. Food systems, driven by human patterns of consumption, are responsible for 70% of freshwater consumption [8], illustrating a significant link between food consumption and water use. In order to address these critical problems concerning food and water, the water footprint (WF) attributable to urban food consumption has recently received increasing attention.
The WF, a concept introduced in 2002 by Hoekstra [9], is recognized as a valuable indicator in water management, as it facilitates the assessment of water use and the identification of ways in which water efficiency and management can be improved [10,11]. It is developed from virtual water (VW) and is defined as the total volume of direct or indirect freshwater consumed by consumers or producers [12]. The WF is widely used at different scales, such as for products, individuals/households, organizations, cities, regions, and countries [12,13,14].
There are two methods presented by Hoekstra for calculating the WF: top-down and bottom-up, which are also known as the Water Footprint Assessment (WFA) approach [12]. The bottom-up method calculates the sum of the direct and indirect water use by the goods and services consumed or produced in a region, while the top-down method calculates local water use plus imported virtual water, minus exported virtual water. Due to better data availability, the bottom-up approach is applied more widely than the top-down approach [12]. Besides, ISO 14046 was also recently developed by the Life Cycle Assessment (LCA) community to calculate the water footprint and address the environmental impact [15], while in comparison, the WFA approach was more widely used in water-related hot-spot studies [10]. Considering the large amount of water used for food production, an increasing amount of research has been done on the WF attributable to food production and consumption. Research subjects have included: the global VW trade embodied in agricultural products [16,17]; the regional WF embodied in the production and consumption of agricultural products in EU river basins [18] and the Mediterranean region [19]; the national WF attributable to food production, consumption, and trade, in places such as China [20] and European countries [21,22]; the provincial WF attributable to the consumption of crop products in Indonesia [23]; and the urban WF of crop production and consumption in Beijing [24,25].
Decomposition analysis has been successfully applied to studies focusing on the factors that correlate with changes in energy consumption and greenhouse gas emissions [26,27,28]. There are two principal decomposition methods: index decomposition analysis (IDA) and structural decomposition analysis (SDA). IDA typically uses aggregated sector data, while SDA uses an input–output model. Because of its simplicity and the availability of data, IDA is more widely used in decomposition studies, with the Divisia and the Laspeyres indexes being the two most commonly applied methods [29]. The logarithmic mean Divisia index (LMDI) is typically the preferred method for IDA, due to its robust theoretical foundations, strong adaptability, and perfect decomposition ability with no residual terms [30]. Many researchers have therefore utilized LMDI for analyzing the driving forces of energy consumption and greenhouse gas emissions at national, regional, and urban levels [26,27,28].
In addition to the energy and carbon emission studies noted, some researchers have recently investigated WF decomposition in relation to food production and consumption. At the global scale, the LMDI approach was used to analyze the contributions of the major drivers of the WF for food consumption: population, diet, and agricultural practices (output per unit of water) [31]. At the national level, the LMDI was applied in order to analyze the driving forces of China’s agricultural WF for consumption: diet structure, water efficiency, economic activity, and the population [32]. At the urban level, the LMDI decomposition method was used to quantitatively analyze the driving factors of WF change related to crop production in Beijing: population, urbanization, water-saving technology, production scale, and plantation structure [25]. These studies filled the gap by applying a decomposition model to the WF of food production and consumption, but the various driving forces of the WF related to consumption by urban and rural residents have been ignored.
Using the LMDI method, this study developed a new decomposition method for further analyzing the determinants of WF changes related to urban food consumption, considering the WF of both urban and rural residents.

2. Methods and Case Study

2.1. Urban WF Accounting

In this study, the bottom-up method was used to calculate the urban WF of food consumption, including the consumption of crops and livestock. The WF includes three categories: a blue WF, green WF, and grey WF. The blue WF is defined as the surface and ground water consumed during production, the green WF refers to productive precipitation, and the grey WF refers to the volume of water used to assimilate the load of pollutants, so that acceptable water quality standards are met [33]. In this paper, only the blue WF and green WF were quantified, while the grey WF was ignored, due to the limited availability of data on the agricultural pollution load and the consequent uncertainty concerning the environmental impact of its use [33,34,35]. Additionally, the Water Footprint Assessment (WFA) approach was adopted in order to calculate the aggregated WF of blue and green water, though this aggregation is debated [36,37]. The WF of urban food consumption was calculated using the following equation:
W F f o o d , c o n s = n ( V W C [ i ]   ×   C [ i ] )
where WFfood,cons represents the WF of food consumption (m3/year), VWC[i] is the virtual water content (VWC) of the agricultural product i (m3/ton), and C[i] is the consumption (ton/year) of agricultural product i in the city.
The calculation of the VWC value differs between crops and livestock. For crops, it was a weighted average VWC value for local and imported crops. The VWC value of local crops was calculated with CROPWAT software, developed by the Food and Agriculture Organization [12]. The VWC of imported crops was adopted by Hoekstra and Chapagain’s calculation [38]. When considering livestock, the VWC value of Chapagain and Hoekstra’s research was applied in this research, having noted data availability [39].
When calculating the boundary, crops included grains, oil crops, vegetables, fruits, and tea, while livestock products included pork, beef, lamb, chicken, eggs, and dairy products.

2.2. LMDI Methodology on WF of Food Consumption

The LMDI approach was used to analyze the factors that affect changes in the WF of urban food consumption. It has been shown that the water footprint is highly related to factors such as water-use efficiency, diet patterns, the urbanization rate and the population [25,38,40]. Thus, to quantify the different effects of urban and rural residents on the WF, a new decomposition method was formulated that considered WF intensity (which refers to the water consumption per kg of the agricultural products), the food consumption structure, the food consumption level (which is represented by per capita food consumption in kg), the urbanization rate, and the population. The index decomposition analysis of urban water consumption was as follows:
W F = W F u + W F r = i W F u i + i W F r i = i W F u i C u i C u i C u C u P u P u P P + i W F r i C r i C r i C r C r P r P r P P = i I u i × S u i × V u × U × P + i I r i × S r i × V r × U × P
where, WF is the total WF of food consumption in the city, and WFu and WFr are the WF of urban residents and rural residents, respectively. W F u i and W F r i are the urban and rural WF of agricultural products i, respectively. C u i and C r i represent the urban and rural consumption of agricultural products I, respectively. C u and C r are the total food consumption of urban and rural residents, respectively. P u and P r are the number of urban residents and rural residents, respectively, and P is the total population. I u i and I r i represent the urban and rural WF intensity, respectively.   S u i and S r i refer to urban and rural food consumption structures, respectively. V u and V r are the urban and rural per capita food consumption, respectively. U is the urban population rate, and U is the proportion of the rural population. Here U + U = 1 .
According to the LMDI method [41], the change in WF consumption between base year 0 and target year t can be broken down into the following formula:
Δ W F = W F t W F 0 = Δ W F u ( I ) + Δ W F u ( S ) + Δ W F u ( V ) + Δ W F u ( U ) + Δ W F u ( P ) + Δ W F r ( I ) + Δ W F r ( S ) + Δ W F r ( V ) + Δ W F r ( U ) + Δ W F r ( P )
where ΔWFu(I), ΔWFu(S), ΔWFu(V), ΔWFu(U), and ΔWFu(P), are the effects of the five factors contributing to the WF change of urban residents. They refer to WF intensity, the structure of food consumption, the level of food consumption, the urban population rate, and the population, respectively. Factors ΔWFr(I), ΔWFr(S), ΔWFr(V), ΔWFr(U’), and ΔWFr(P), represent those effects of rural residents. Each effect’s contribution to the change in the urban WF of food can be calculated using the following formulation:
Δ W F u ( I ) = i W F u i ,   t W F u i , 0 ln ( W F u i ,   t ) ln ( W F u i ,   t ) × l n ( I u i , t I u i , 0 )
Δ W F u ( S ) = i W F u i ,   t W F u i , 0 ln ( W F u i ,   t ) ln ( W F u i ,   t ) × l n ( S u i , t S u i , 0 )
Δ W F u ( V ) = i W F u i ,   t W F u i , 0 ln ( W F u i ,   t ) ln ( W F u i ,   t ) × l n ( V u t V u 0 )
Δ W F u ( U ) = i W F u i ,   t W F u i , 0 ln ( W F u i ,   t ) ln ( W F u i ,   t ) × l n ( U t U 0 )
Δ W F u ( P ) = i W F u i ,   t W F u i , 0 ln ( W F u i ,   t ) ln ( W F u i ,   t ) × l n ( P t P 0 )
Δ W F r ( I ) = i W F r i ,   t W F r i , 0 ln ( W F r i ,   t ) ln ( W F r i ,   t ) × l n ( I r i , t I r i , 0 )
Δ W F r ( S ) = i W F r i ,   t W F r i , 0 ln ( W F r i ,   t ) ln ( W F r i ,   t ) × l n ( S r i , t S r i , 0 )
Δ W F r ( V ) = i W F r i ,   t W F r i , 0 ln ( W F r i ,   t ) ln ( W F r i ,   t ) × l n ( V r t V r 0 )
Δ W F r ( U ) = i W F r i ,   t W F r i , 0 ln ( W F r i ,   t ) ln ( W F r i ,   t ) × l n ( U t U 0 )
Δ W F r ( P ) = i W F r i ,   t W F r i , 0 ln ( W F r i ,   t ) ln ( W F r i ,   t ) × l n ( P t P 0 )

2.3. Study Case and Data Use

Xiamen is a municipality and a major city situated on the southeast coast of China (118°04′04″E by 24°26′46″N), with an area of 1699.39 km2. In 2012, Xiamen’s GDP amounted to 281.52 billion RMB, having increased from 55.83 billion RMB in 2001. Secondary and tertiary industries are the main economic sectors; the ratio of primary to secondary to tertiary industry was 0.9:48.4:50.7 in 2012. Due to rapid urbanization, the urbanization rate reached 86.5% in 2012, having increased from 72.4% in 2001. Xiamen has a monsoonal, humid, subtropical climate with abundant rainfall. Average annual rainfall is 1350 mm (53 in). From 2001 to 2012, the population of Xiamen City expanded from 2.19 million residents to 3.67 million residents. Accordingly, the average per capita water resource decreased from 669.86 m3 in 2001, to 333.90 m3 in 2012; the latter represents only about one-third of the international minimum standard (1000 m3 per capita) [42]. Xiamen was therefore identified as a “water-poor” city by the Chinese National Ministry of Water Resources. The rapid growth of the population, however, has resulted in a rising food consumption in Xiamen City. The total food consumption rose from 620.22 kt in 2001, to 968.00 kt in 2012. This obviously required more water for the production of food.
The research period ran from 2001 to 2012. The data for basic social and economic food production, consumption, and trade, were obtained from the Yearbook of Xiamen Special Economic Zone (2002–2013). For calculating the local VWC of crops, the data for climate, crop types, cultivation times, and soil conditions, were taken from the Yearbook of Xiamen Special Economic Zone (2002–2013), and the crop coefficients were obtained from the CROPWAT database [43].

3. Results and Discussions

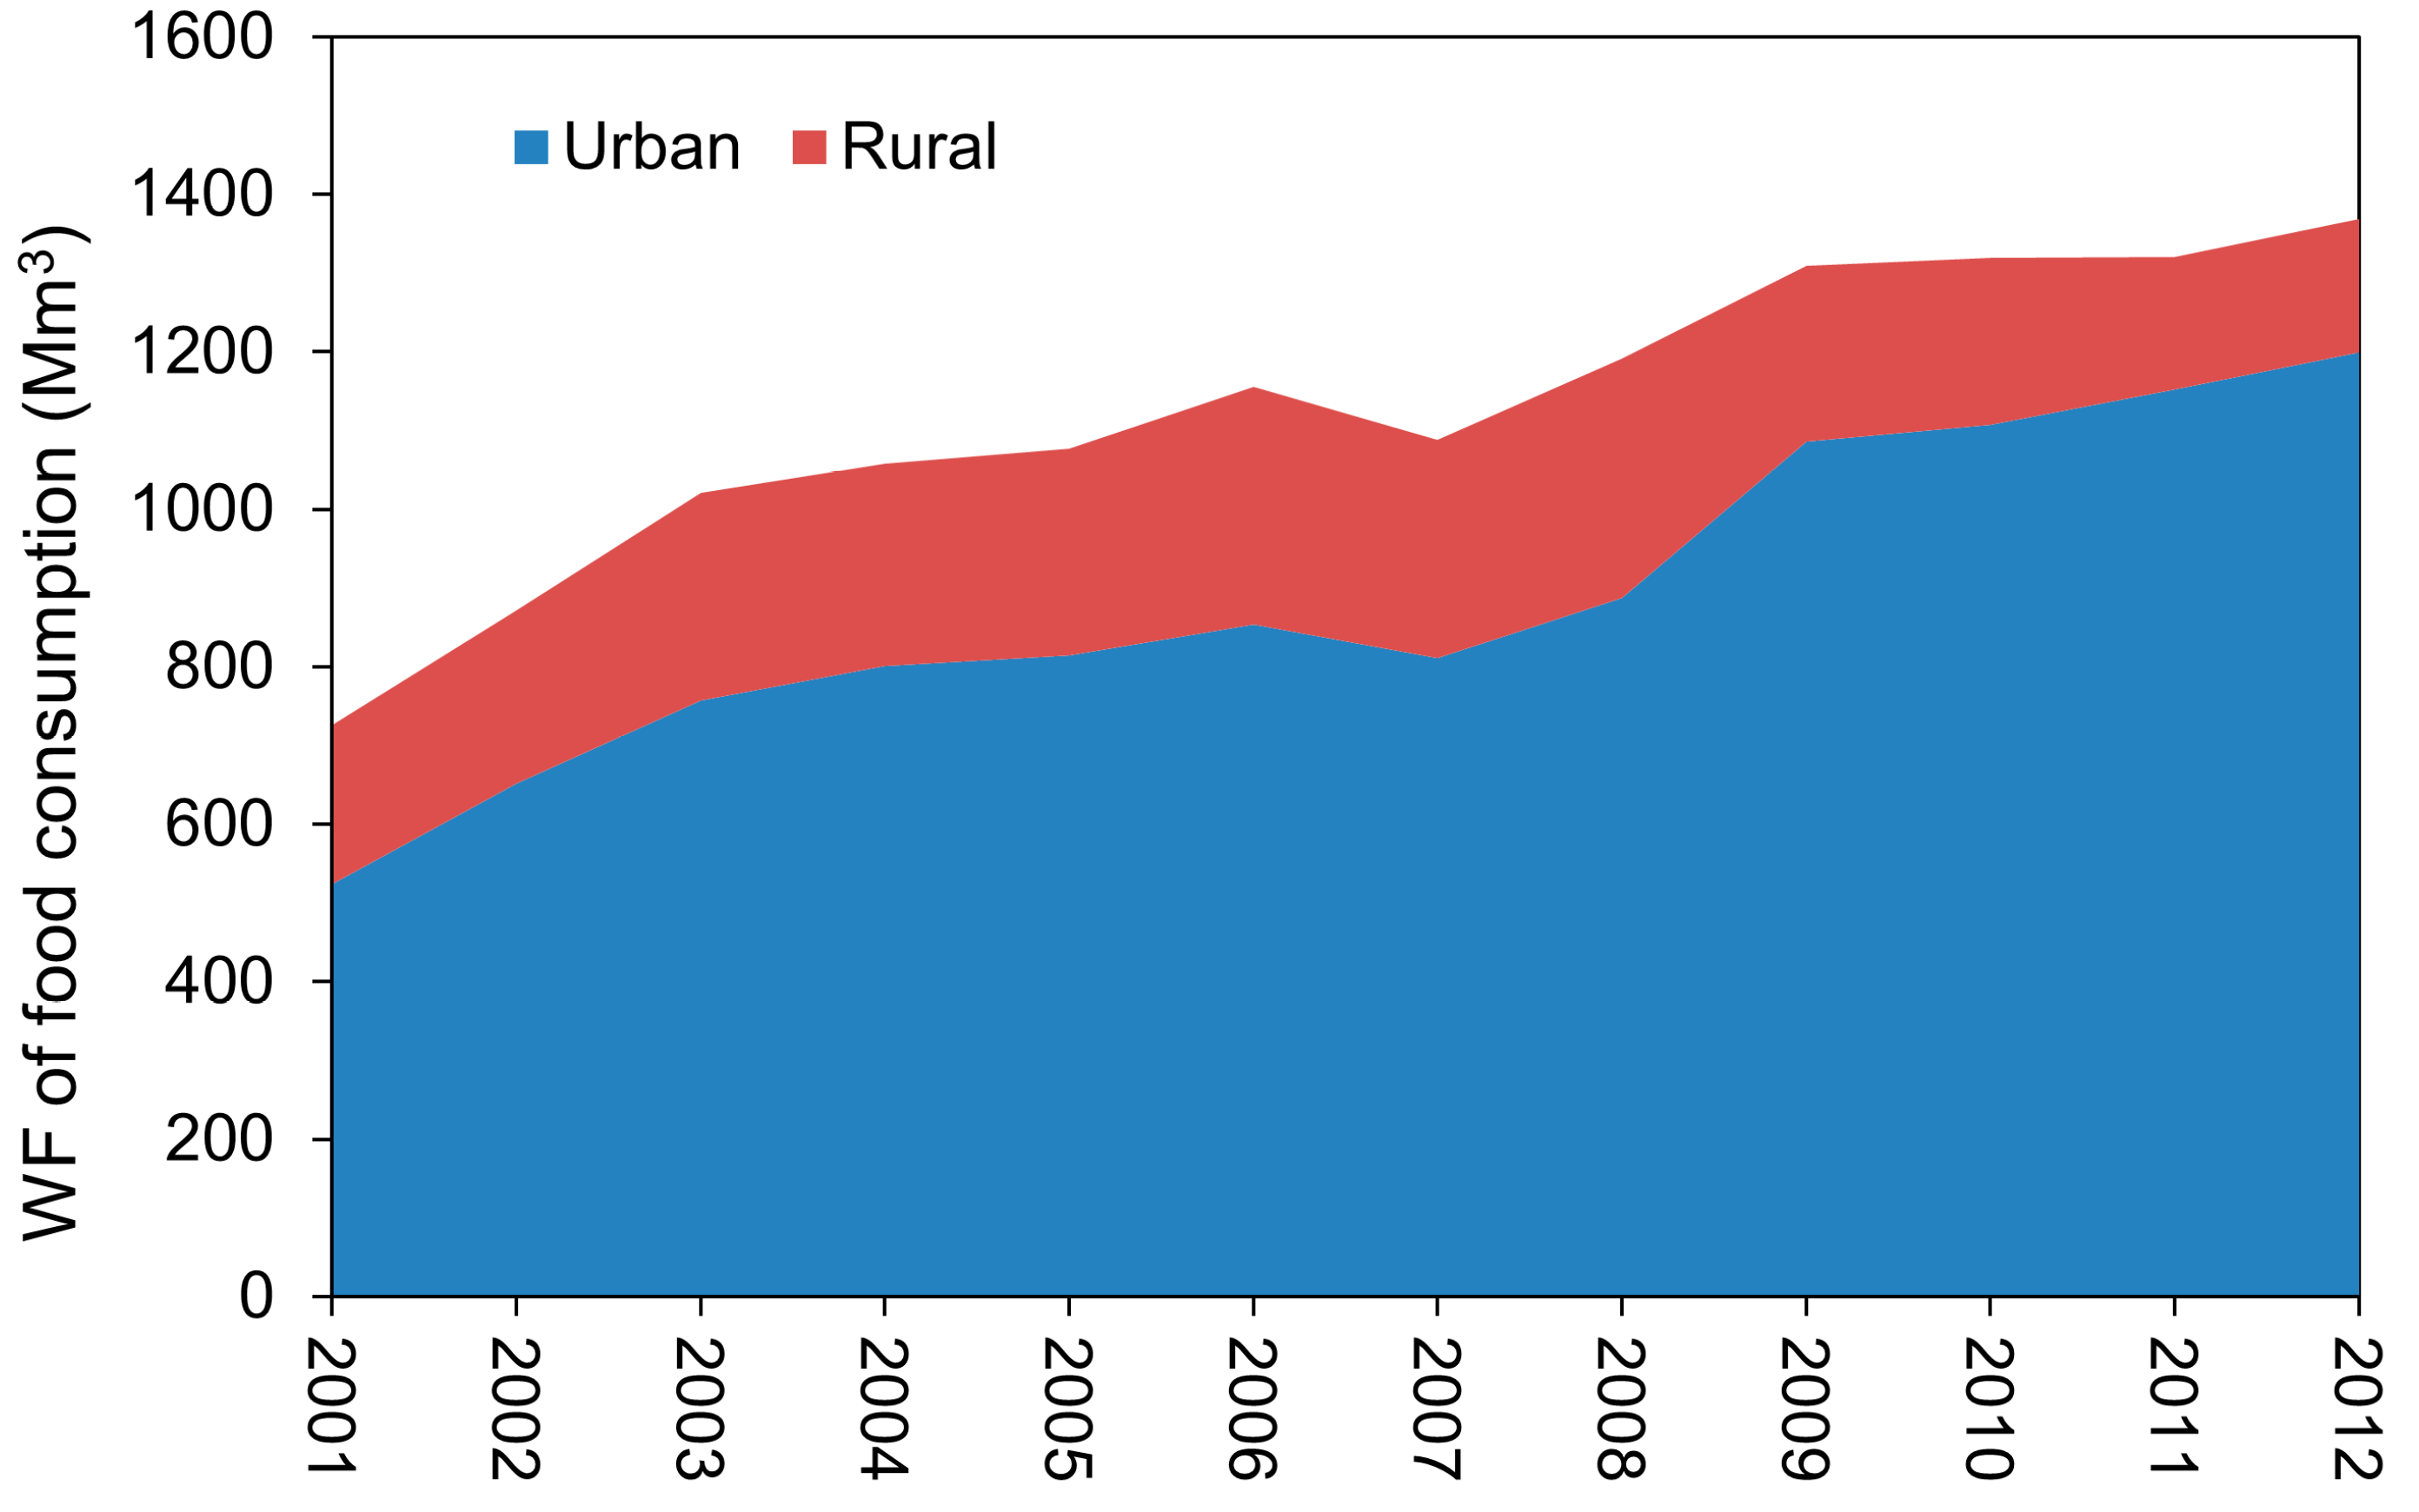
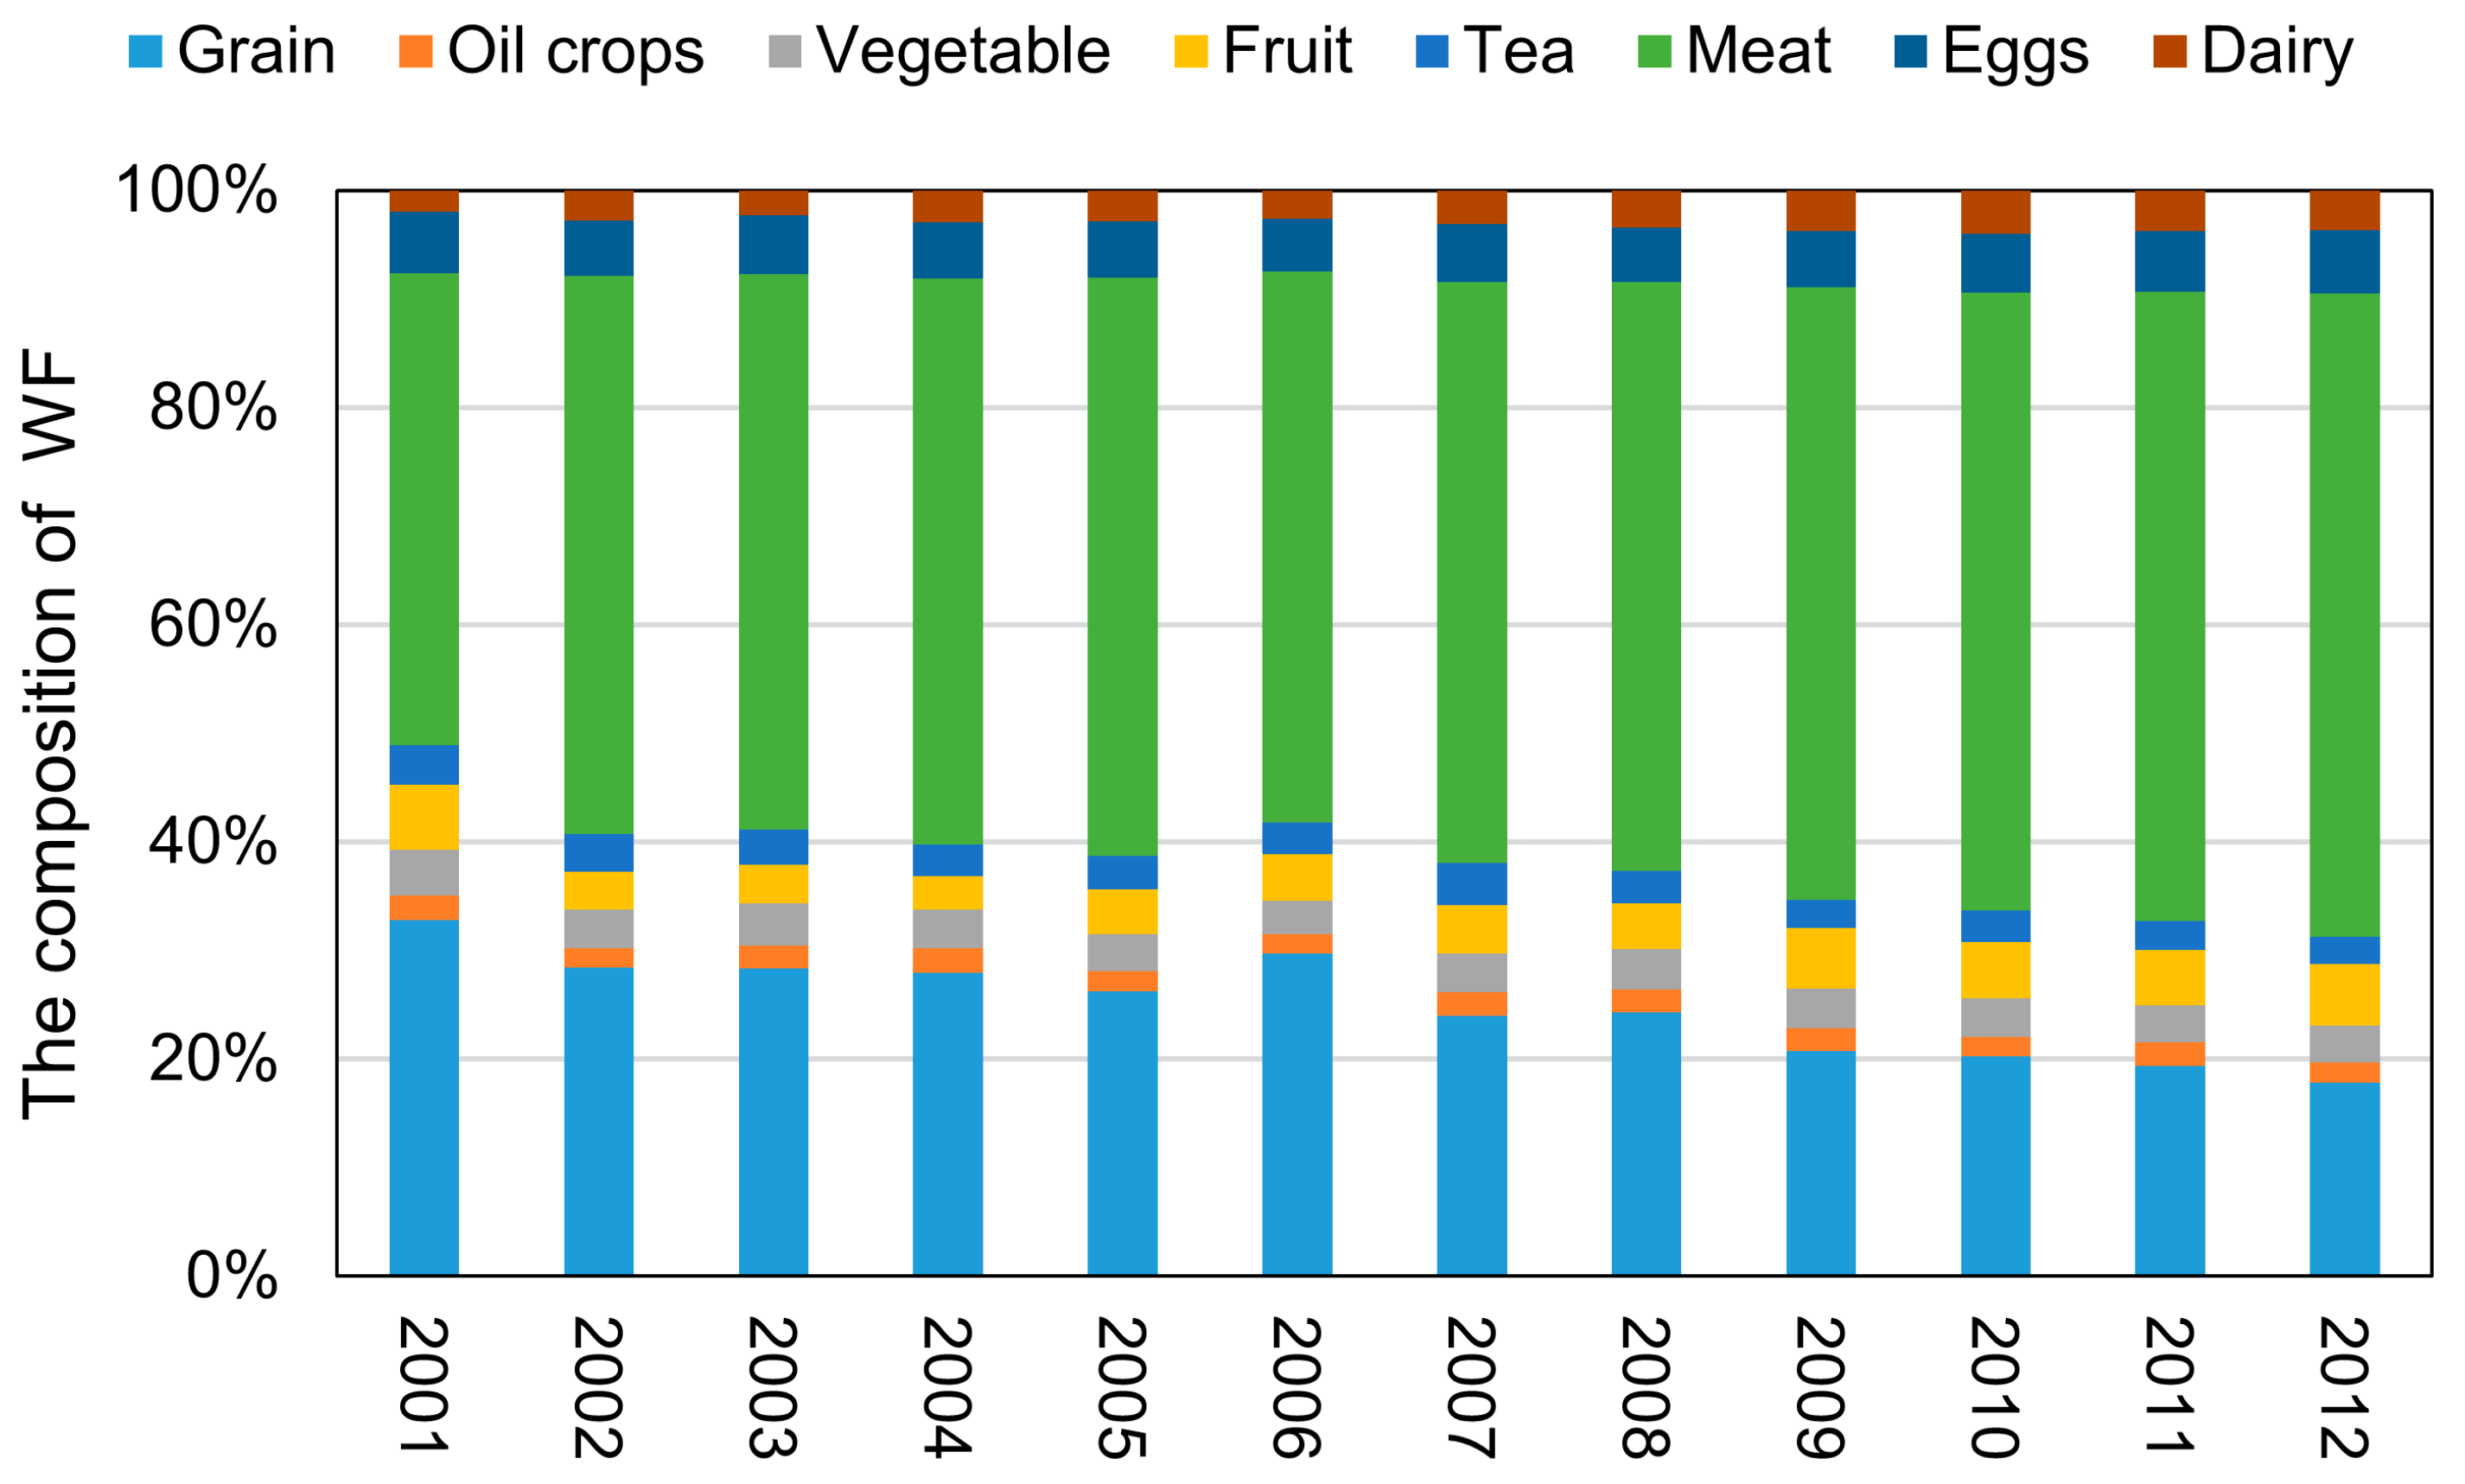
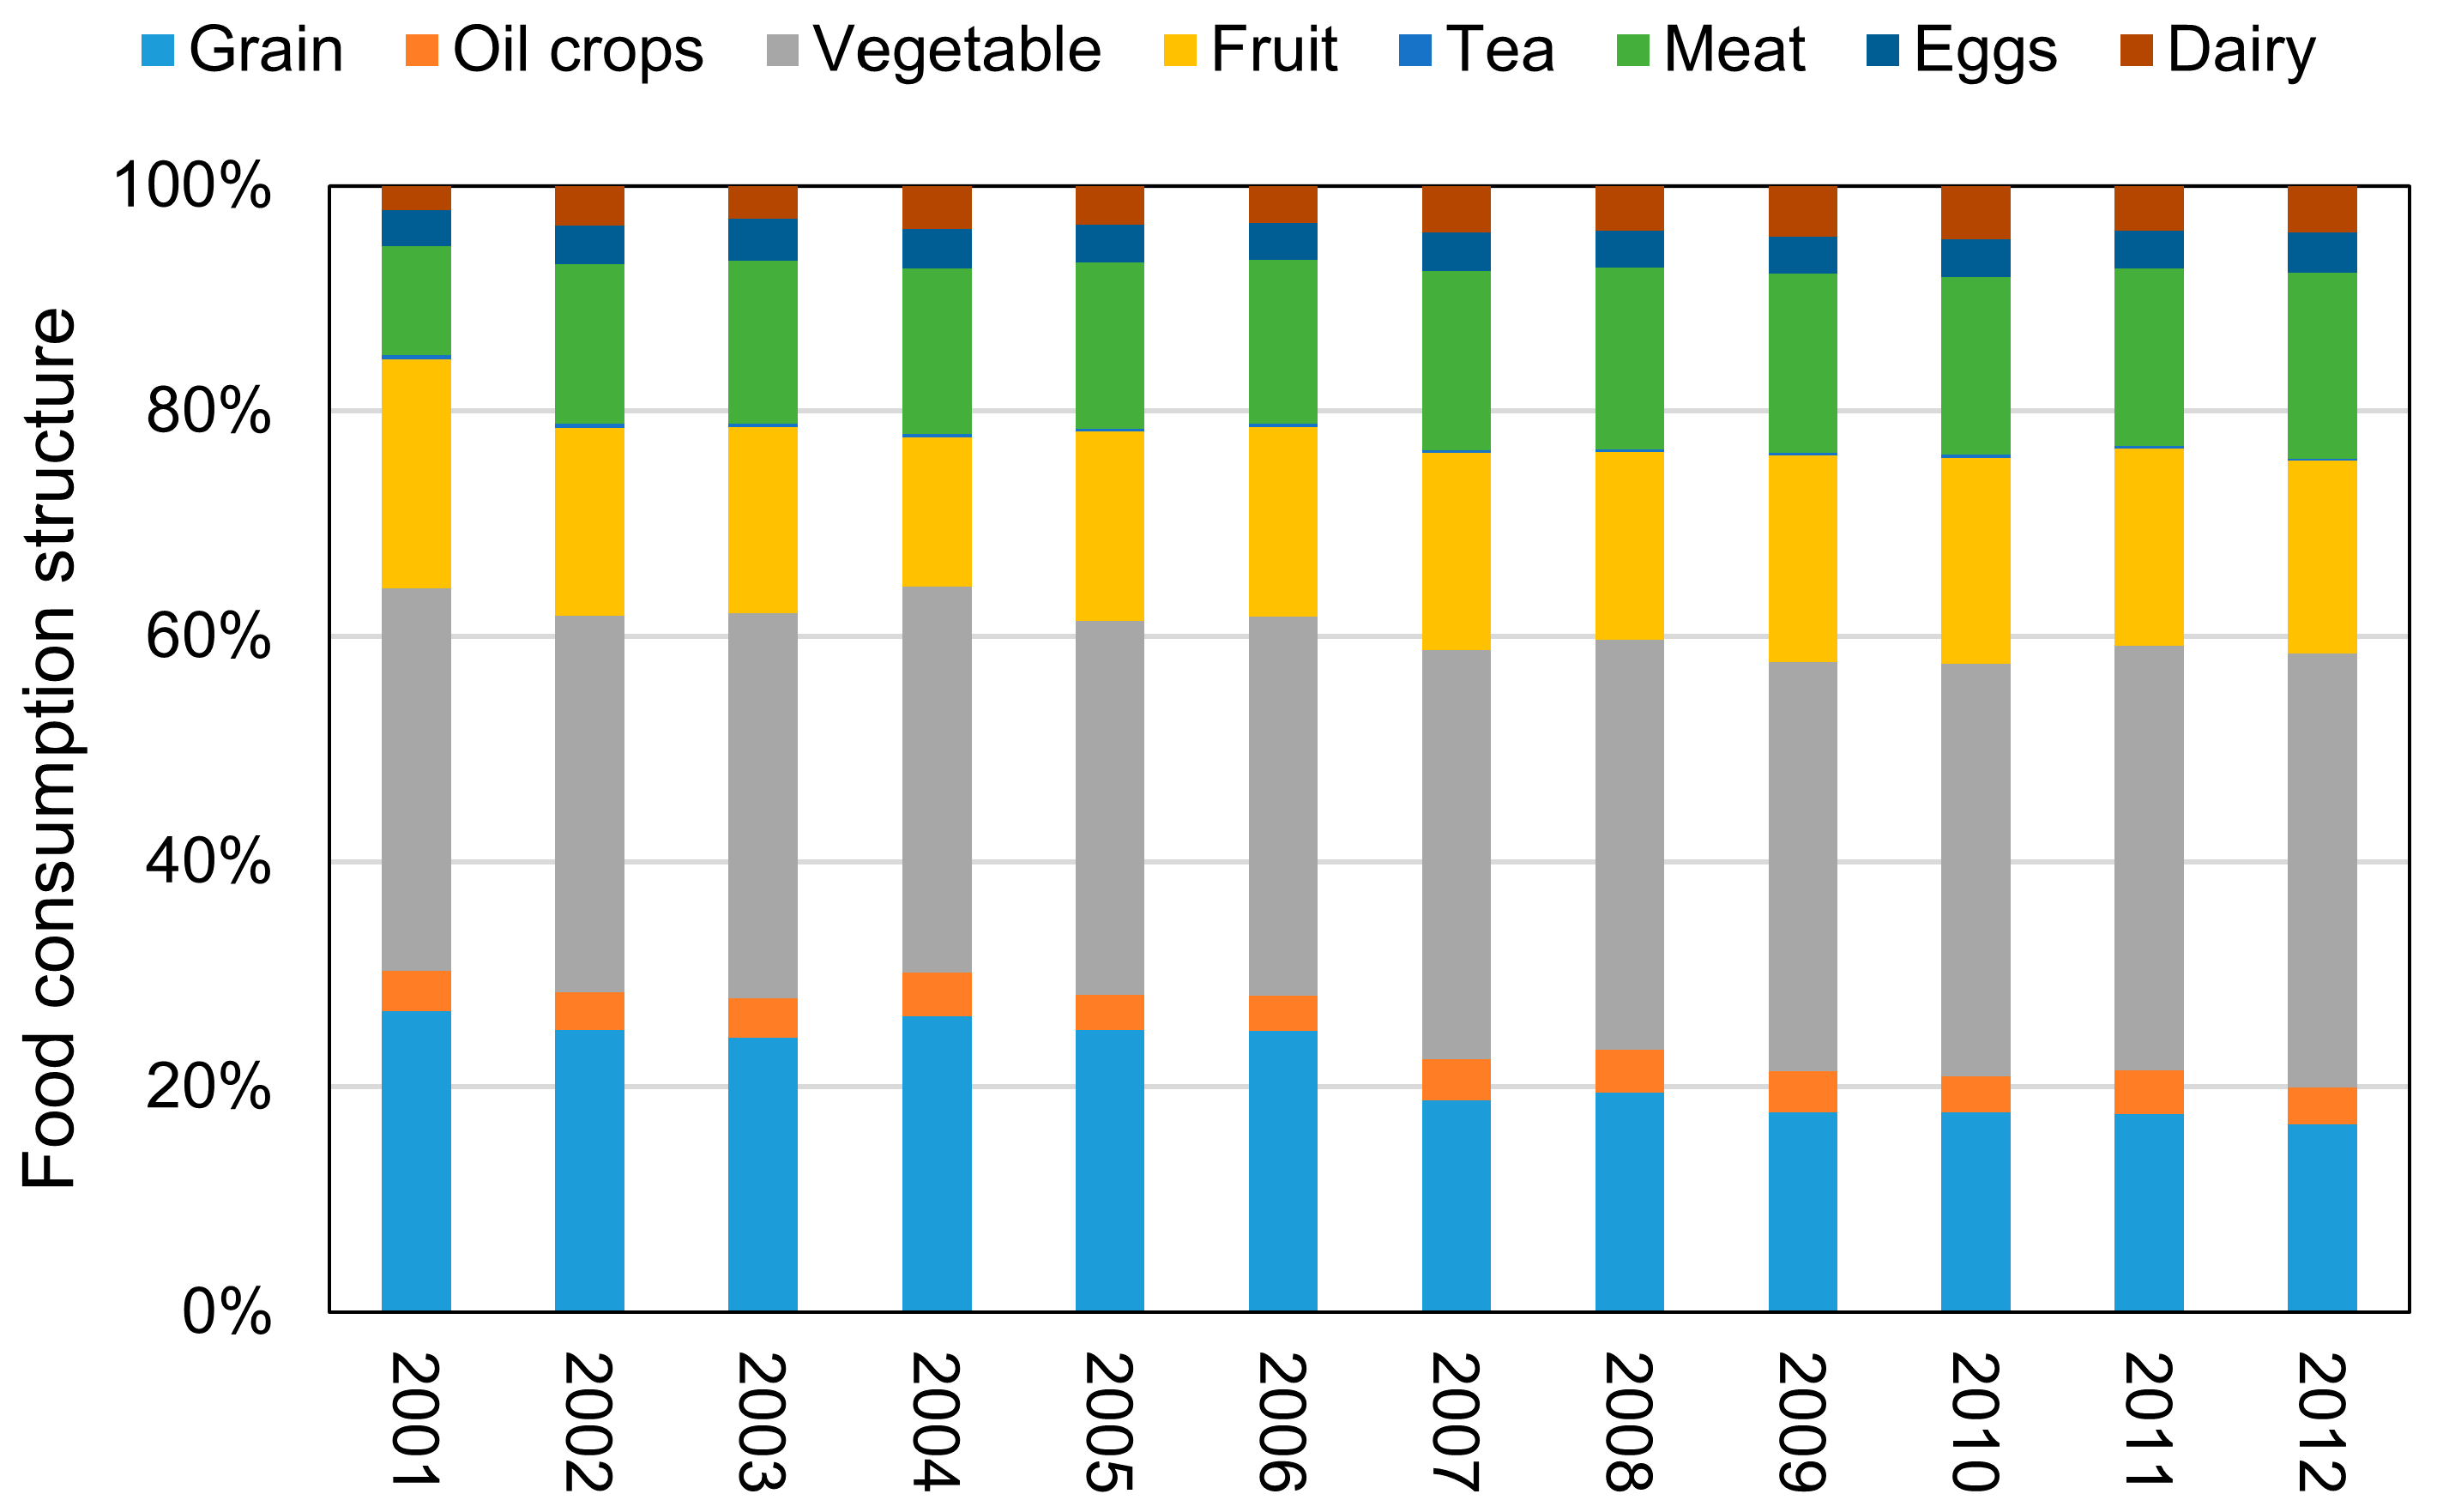
3.1. WF of Food Consumption in Xiamen

As shown in Figure 1, the total WF attributable to Xiamen’s food consumption increased rapidly from 725.38 Mm3 in 2001, to 1368.69 Mm3 in 2012. The annual growth rate of the total WF was 5.43%, while that of the WF of urban food consumption (WFu) and the WF of rural food consumption (WFr), were 7.15% and −1.44%, respectively. In terms of composition, WFu contributed the most to the total WF; it represented 72.18% of the total in 2001, and 87.61% in 2012. The WFu increased from 523.55 Mm3, to 1199.07 Mm3, during the research period. There was a significant decrease in the total WF in 2007 and 2008, which might have been due to the global financial crisis. The global financial crisis resulted in a decrease of per capita consumption and in a decrease of per capita food consumption.
In terms of food categories, meat and grain had the greatest effect on the total WF over the study period. As shown in Figure 2, the proportion of the grain WF dropped from 32.82% to 17.84%, while the proportions of the meat WF and the dairy WF increased from 43.41% and 1.94% in 2001, to 59.23% and 3.69% in 2012, respectively. Except for grain, the proportion of oil crops, vegetables, fruit, and tea, also experienced a decrease during the period, specifically from 2.27%, 4.15%, 6.01% and 3.67%, to 1.83%, 3.40%, 5.63% and 2.56%, respectively.

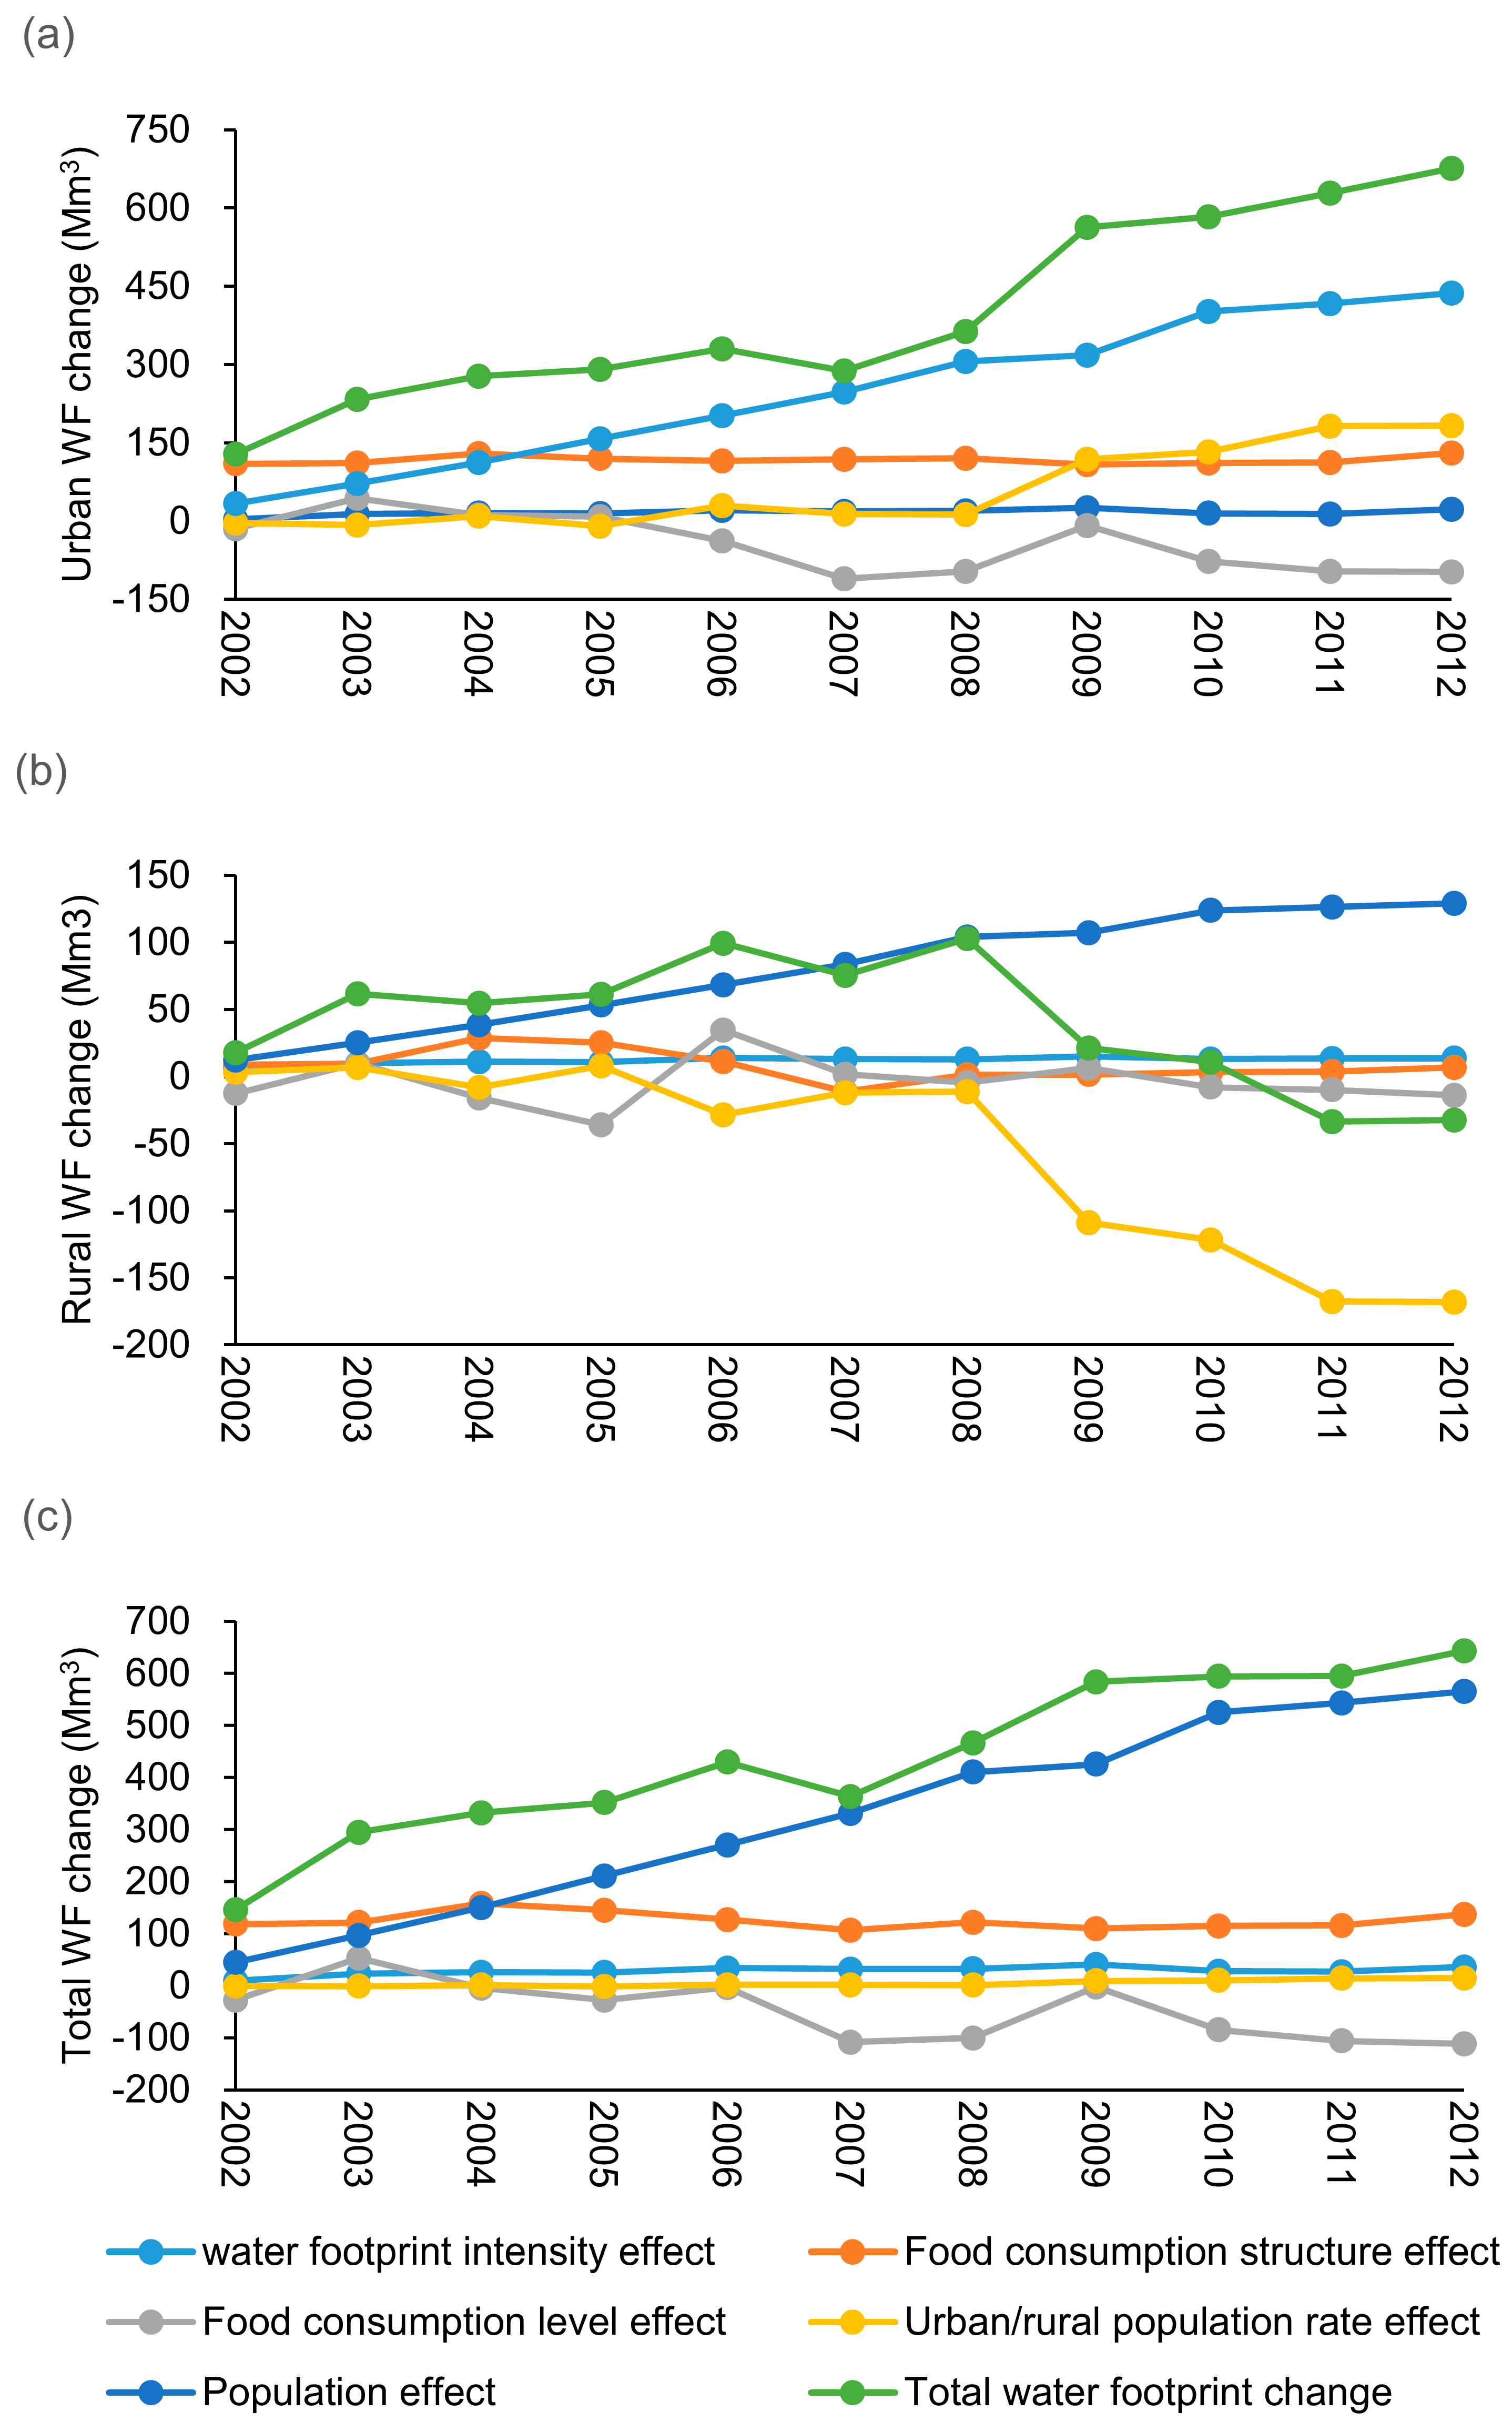
3.2. Decomposition of the WF of Urban Food Consumption

The results of the decomposition of the WF attributable to urban food consumption (WFu) are shown in Figure 3a. The overall trend shows that the population, food consumption structure, urbanization rate, and WF intensity, acted as positive effects on the increase in the WF from 2001 to 2012. The population effect contributed most towards the WFu growth; this was followed by the urbanization rate and the effects of the food consumption structure and WF intensity. The population increased rapidly, from 2.19 million residents in 2001, to 3.67 million residents in 2012, representing an annual growth rate of 4.81%. At the same time, the urbanization rate increased from 72.4% in 2001, to 86.5% in 2012. The food consumption structure has a small positive effect, due to increasing meat consumption and decreasing grain consumption, as shown in Figure 2. The level of food consumption, however, had a negative effect on the results during most of the period. The detailed cumulative effects, in terms of food categories in urban areas during the research period, are shown in Table 1; this will be discussed further.

3.2.1. Water Footprint Intensity Effect

The effect of WF intensity acted as a weak positive factor at the end of the research period. The WF growth led by WF intensity was 22.72 Mm3 between 2001 and 2012, accounting for only 3.36% of the total WFu change. Positive effects indicated a higher blue and green water evapotranspiration intensity in agriculture production that may have been caused by changes in temperature, wind speed, and humidity. In terms of food categories, the accumulative WF change caused by water intensity relating to the change in grain proportion, was 20.90 Mm3 between 2001 and 2012, and that by water intensity relating to the change in fruit proportion, was 10.82 Mm3. The WF intensity change relating to the change in vegetable proportion, however, had a negative cumulative effect on WF change (−8.75 Mm3), and those relating to changes in oil crops and tea proportions also had very small negative effects.

3.2.2. Food Consumption Structure Effect

Overall, the increase in WFu, led by the structure of food consumption, was 130.66 Mm3 between 2001 and 2012. In terms of food categories, the accumulative WFu increase from meat had the greatest positive effect, with an increase of 206.93 Mm3 between 2001 and 2012. The categories of dairy, vegetables, and eggs, also had positive effects. Grain consumption, however, acted as a neutralizer for the WF growth; it accounted for −82.12 Mm3 of the WF change. Oil crops, fruit, and tea, had small negative effects. These results demonstrated that Xiamen changed its diet from a vegetable-rich style, to one that included more products of animal origin. Additional details on the urban food structure are shown in Figure 4. From 2001 to 2012, the proportion of meat in food consumption increased from 9.69% to 16.47%, while that of grain decreased from 26.47% to 16.65%.

3.2.3. Food Consumption Level Effect

The level of food consumption was the only negative factor, declining due to the decrease in the urban WF of food consumption between 2001 and 2012. The decreased food consumption level indicated a decrease in the physical weight of food consumed. This did not mean, however, that the nutrition of food decreased as the diet changed from a vegetable-rich style, to one that included more products of animal origin. Among the subgroup factors, meat and grain contributed the most to the cumulative WFu decrease, caused by the food consumption level over the research period. From 2001 to 2012, these values were 54.53 Mm3 and 20.62 Mm3, respectively, and they were followed by eggs (5.75 Mm3), fruit (5.61 Mm3), dairy (3.48 Mm3), vegetables (3.42 Mm3), tea (1.97 Mm3), and oil crops (1.84 Mm3).

3.2.4. Urban Population Rate Effect

The rapid urbanization in Xiamen, from 72.36% in 2001, to 86.46% in 2012, had a significant influence on WF growth. The increase in the WFu value, led by the urban population rate, accounted for 182.73 Mm3. Within the urban rate effect, the cumulative WFu change from meat represented the largest proportion in 2012, with a value of 108.53 Mm3. Grain was the second-most important contributor, the cumulative WFu change of which was 31.54 Mm3 in 2012, followed by eggs (10.66 Mm3), fruit (10.47 Mm3), dairy (7.54 Mm3), vegetables (7.19 Mm3), oil crops (3.72 Mm3), and tea (3.08 Mm3).

3.2.5. Population Effect

The population represented an important positive factor; the cumulative WF change, led by the effect of population in urban areas, was 436.64 Mm3 in 2012. Food consumption grew with the population expansion, as Xiamen’s population increased rapidly from 2.19 million residents to 3.67 million residents over the research period. In terms of food categories, meat was the largest contributor. The accumulative WFu change attributable to meat consumption was 248.34 Mm3 in 2012, and the accumulative WFu change based on grain was only 86.58 Mm3. All other food categories created positive effects on the increase of the WFu.

3.3. Decomposition of the WF of Rural Food Consumption

The results of the decomposition of the WF of rural food consumption (WFr) are shown in Figure 3b. The population, WF intensity, and food consumption structure, were positive factors between 2001 and 2012, while the rural population rate and food consumption level were overall negative effects. Among the positive factors, the population was the main contributor to the increased WF of rural food consumption, as its effect was much greater than that of the other positive factors. The rural population rate effect was the largest contributor to a decrease in WFr, especially from 2009 onwards. The level of food consumption had a weak negative effect. During the research period, WFr showed an overall increasing trend between 2002 and 2008, but has been decreasing since 2009. The overall trend was dominated by the positive population effect and the negative rural population rate effect. The detailed cumulative effects in terms of food categories during the research period are shown in Table 2 and will be discussed further.

3.3.1. Water Intensity Effect

From 2001 to 2012, the cumulative WF change led by water intensity in rural areas was 13.71 Mm3. In terms of food categories, grain was the most important contributor to the increase in the WFr; it accounted for 14.38 Mm3. Fruit contributed 0.74 Mm3 to the increase in the WF. The increase of the WFr was slightly weakened by the consumption of vegetables (−0.78 Mm3), tea (−0.53 Mm3), and oil crops (−0.10 Mm3). Compared to urban areas, there was a smaller WF increase from grain consumption in rural areas, while the proportion of grain consumption in rural areas was much higher.

3.3.2. Food Consumption Structure Effect

During the study period, the increase in WFr from the structure of food consumption was 6.93 Mm3. In terms of food categories, tea represented the largest contribution to the cumulative WFr increase, which was 16.38 Mm3 between 2001 and 2012. Meat consumption represented the second-largest contribution to the increase (6.33 Mm3). Among the negative contributors, grain contributed the most; its value was −23.69 Mm3. The change in the food consumption structure in rural areas is shown in Figure 5. The proportion of grain in rural food consumption decreased from 59.68% in 2001, to 47.96% in 2012. Unlike the change of food consumption in urban areas, however, the proportion of meat consumption in rural areas did not increase much, with a value of only 1.5% during the research period. The proportion of tea increased by only 0.98%, but the WFr increase from tea was significant due to the high WF intensity of tea.

3.3.3. Food Consumption Level Effect

The level of food consumption increased a small amount during the research period. The WFr change based on the effect of the food consumption level was 13.94 Mm3 between 2001 and 2012. The WFr decrease mainly resulted from changes in grain and meat consumption. From 2001 to 2012, the WF change from grain was −6.24 Mm3, and that from meat was −4.85 Mm3.

3.3.4. Rural Population Rate Effect

The rural population rate dropped between 2001 and 2012 due to rapid urbanization in Xiamen. Accordingly, this caused a significant decrease in the WFr. Consequently, the rural population rate effect was the most important negative factor for rural WF change. The WF decrease attributable to changes in the urbanization rate in rural areas, was −168.21 Mm3, which was larger than the total WF decrease in rural areas (−32.22 Mm3). In terms of food categories, grain and meat were the largest contributors to the decreased WF.

3.3.5. Population Effect

The rapid population growth in Xiamen also had a positive effect in rural area’s WF change, even though the rural population rate decreased during the research period. Considering all of the factors that contributed towards rural food consumption WF change, the population effect was the most important positive factor. The cumulative contribution of the population effect was 129.28 Mm3 during the research period. In terms of food categories, WFr growth from grain and meat consumption accounted for 44.02% and 41.10% of the population effect in 2012, respectively.

3.4. Cumulative Effect of WF Change of Food Consumption in Xiamen

From 2001 to 2012, the total water footprint change in Xiamen was 675.53 Mm3; the cumulative effect of its decomposition is shown in Figure 3c. The population effect contributed the most towards this change, with a figure of 565.92 Mm3; it accounted for 87.97% of the total WF growth. The growth trend led by the population effect slowed down after 2008, which was coincident with the growth trend of the population growth in Xiamen. The results indicated a close relationship between population control and the WF. As one of the most important cities in southeast China, however, the population in Xiamen is projected to grow to 5 million in 2020. This will require more water for producing food to meet the consumption need. In terms of food categories, meat and grain consumption were the main contributors from 2001 to 2012, as shown in Table 3.
The food consumption structure also played an important role in the WF change; this led to a cumulative 137.59 Mm3 WF change between 2001 and 2012. Urban areas represented 94.96% of the WF increase, attributable to the food structure effect. This indicated that changes in diet structure occurred mainly in urban areas and that relatively little change occurred in rural areas. In terms of food categories, meat was the main positive contributor, while grain was the main negative contributor. A change in diet is expected to continue to, placing further pressure on water resources, as China still exhibits less livestock consumption than other rich Asian countries [32].
The effect of WF intensity was a weak positive factor between 2001 and 2012. The cumulative WF change from WF intensity was 36.44 Mm3 during the period; this was smaller than the effects of the population and food consumption structure. In terms of food categories, grain had the greatest positive effect on the value. The urbanization population rate caused a significant WF increase between 2009 and 2012, while the growth trend was mitigated by a significant decrease resulting from the rural population rate effect.
The urbanization rate had a very limited cumulative effect on the total WF change, accounting for 14.52 Mm3 between 2001 and 2012. The effect of the urbanization rate in urban areas on WF change, however, was 182.73 Mm3, while the effect of the urbanization rate in rural areas was −168.21 Mm3. This offset resulted in little cumulative effect on the change in the WF. In terms of food categories, meat acted as the main positive factor, while grain acted as the main negative factor.
The effect of the food consumption level was the most important force mitigating the WF of food consumption in Xiamen in the aggregate during the research period. The cumulative WF decrease caused by the food consumption level was −111.17 Mm3 between 2001 and 2012. This trend was dominated by the effect of the food consumption level in urban areas; this represented 87.46% of the total effect of the food consumption level. In terms of food categories, meat and grain were the main contributors to the decrease.

4. Conclusions

In our study, the WF of food consumption in Xiamen City from 2001 to 2012 was evaluated. A new decomposition method based on LMDI was developed in order to analyze the driving forces of WF changes, attributable to food consumption. These forces included the population, the food consumption structure, the food consumption level, water intensity, and the urbanization rate. Compared to previous studies, the new method had the potential to reveal the different contributions of urban and rural residents. The main conclusions are as follows:
(1) From 2001 to 2012, the WF of food consumption in Xaimen increased by 675.53 Mm3, representing a growth rate of 88.69%. The total WF was dominated by the urban WF and the proportion of this WF increased during the research period. In terms of food categories, meat consumption contributed the most towards the total WF and the proportion of the WF attributable to meat consumption increased between 2001 and 2012. The proportion of grain decreased; this was another important contributor to the WF. These results indicated that there was a shift in diet structure, caused by urbanization and per capita income.
(2) Among the positive driving forces, the population contributed the most, influencing WF change in urban and rural areas alike. Xiamen’s population expanded rapidly due to migration from other areas, significantly enhancing the WF increase. Population expansion resulted in more food consumption, which in turn resulted in a higher food consumption WF.
(3) As the second-largest contributor, the food structure also had a considerable effect on WF change in Xiamen between 2001 and 2012. A similar conclusion has also been shown in other research, illustrating that diet pattern can affect the WF [44]. During the research period, Xiamen experienced a shift in diet from a vegetable-rich style, to a livestock-rich style. The decomposition results showed that the diet shift occurred mainly in the urban areas, while it only changed a little in rural areas. The increased income of urban residents undoubtedly resulted in a more livestock-rich food consumption lifestyle. A healthy and less water-intensive diet should be promoted in the future.
(4) The effect of water intensity was a weak positive factor for the whole city during the research period. This reflected a higher blue and green water evapotranspiration intensity in agriculture production that may have been caused by changes in temperature, wind speed, and humidity. Implementation of water-saving technologies may reduce green and blue water consumption by agriculture production. An adjustment in the food consumption structure could also affect agriculture production, and thus change the WF. Scherer and Pfister’s calculated global water scarcity indices for the decades 1981–1990 and 2001–2010, and concluded that increased water consumption, rather than climate change, plays a more important role in the increase of water scarcity [45]. Our study supports this, illustrating that other factors, rather than climate change, are more responsible for the increase of the WF of food consumption. The results indicate that population and diet patterns are greater concerns than those relating to climate change, in terms of water management.
(5) The effect of the urban/rural population rate was very limited, offset by the effect of the whole city’s WF change. The effect of the WF change in specifically urban and rural areas, however, was individually significant. The cumulative WF change from the effect of the urban population rate effect increased rapidly, while that from the rural population rate effect decreased.
(6) The food consumption level was the only driving force mitigating the WF increase, especially in urban areas. The decreased food consumption level only indicated a decrease in the physical weight of food consumed; this might be due to less food waste in Xiamen. Efforts to reduce food waste are meaningful for reducing the urban WF. As the diet changed from a vegetable-rich style to a livestock-rich style, the decrease did not mean that the nutrition of food also decreased.
In this paper, the LMDI decomposition of the driving forces of WF change provide insight for urban WF management. There are some uncertainties in this research, however, such as in the estimation of blue and green water use for food consumption. In further studies, additional and more accurate data collection on the origin of imported food for Xiamen’s consumption, should be achieved.

Acknowledgments

This study was supported by the National Natural Science Foundation of China (71573242, 41371392 and 71273252).

Author Contributions

Jianyi Lin had the original idea for the study. Jiefeng Kang was responsible for data collecting and data analysis. Jianyi Lin and Jiefeng Kang drafted the manuscript. Xiaofeng Zhao, Shengnan Zhao and Limin Kou reviewed the manuscript.

Conflicts of Interest

The authors declare no conflict of interest.

References

  1. Mekonnen, M.M.; Hoekstra, A.Y. Four billion people facing severe water scarcity. Sci. Adv. 2016, 2, e1500323. [Google Scholar] [CrossRef] [PubMed]
  2. Larsen, T.A.; Hoffmann, S.; Lüthi, C.; Truffer, B.; Maurer, M. Emerging solutions to the water challenges of an urbanizing world. Science 2016, 352, 928–933. [Google Scholar] [CrossRef] [PubMed]
  3. Paterson, W.; Rushforth, R.; Ruddell, B.; Konar, M.; Ahams, I.; Gironás, J.; Mijic, A.; Mejia, A. Water Footprint of Cities: A Review and Suggestions for Future Research. Sustainability 2015, 7, 8461–8490. [Google Scholar] [CrossRef]
  4. Liu, J.; Yang, W. Water Sustainability for China and Beyond. Science 2012, 337, 649–650. [Google Scholar] [CrossRef] [PubMed]
  5. Tilman, D.; Balzer, C.; Hill, J.; Befort, B.L. Global food demand and the sustainable intensification of agriculture. Proc. Natl. Acad. Sci. USA 2011, 108, 20260–20264. [Google Scholar] [CrossRef] [PubMed]
  6. Lin, J.; Hu, Y.; Cui, S.; Kang, J.; Xu, L. Carbon footprints of food production in China (1979–2009). J. Clean. Prod. 2015, 90, 97–103. [Google Scholar]
  7. Keating, B.A.; Herrero, M.; Carberry, P.S.; Gardner, J.; Cole, M.B. Food wedges: Framing the global food demand and supply challenge towards 2050. Glob. Food Secur. 2014, 3, 125–132. [Google Scholar] [CrossRef]
  8. Song, G.; Li, M.; Semakula, H.M.; Zhang, S. Food consumption and waste and the embedded carbon, water and ecological footprints of households in China. Sci. Total Environ. 2015, 529, 191–197. [Google Scholar] [CrossRef] [PubMed]
  9. Chapagain, A.K.; Hoekstra, A.Y. Virtual Water Trade: A Quantification of Virtual Water Flows between Nations in Relation to International Trade of Livestock and Livestock Products; IHE: Delft, The Netherlands, 2002. [Google Scholar]
  10. Jefferies, D.; Muñoz, I.; Hodges, J.; King, V.J.; Aldaya, M.; Ercin, A.E.; Milà i Canals, L.; Hoekstra, A.Y. Water Footprint and Life Cycle Assessment as approaches to assess potential impacts of products on water consumption. Key learning points from pilot studies on tea and margarine. J. Clean. Prod. 2012, 33, 155–166. [Google Scholar] [CrossRef]
  11. Manzardo, A.; Mazzi, A.; Loss, A.; Butler, M.; Williamson, A.; Scipioni, A. Lessons learned from the application of different water footprint approaches to compare different food packaging alternatives. J. Clean. Prod. 2016, 112, 4657–4666. [Google Scholar] [CrossRef]
  12. Hoekstra, A.Y.; Chapagain, A.K.; Aldaya, M.M.; Mekonnen, M.M. The Water Footprint Assessment Manual: Setting the Global Standard; Routledge: London, UK, 2012. [Google Scholar]
  13. Hoekstra, A.Y.; Mekonnen, M.M. The water footprint of humanity. Proc. Natl. Acad. Sci. USA 2012, 109, 3232–3237. [Google Scholar] [CrossRef] [PubMed]
  14. Manzardo, A.; Loss, A.; Fialkiewicz, W.; Rauch, W.; Scipioni, A. Methodological proposal to assess the water footprint accounting of direct water use at an urban level: A case study of the Municipality of Vicenza. Ecol. Indic. 2016, 69, 165–175. [Google Scholar] [CrossRef]
  15. Boulay, A.M.; Hoekstra, A.Y.; Vionnet, S. Complementarities of water-focused life cycle assessment and water footprint assessment. Environ. Sci. Technol. 2013, 47, 11926–11927. [Google Scholar] [CrossRef] [PubMed]
  16. Chapagain, A.K.; Hoekstra, A.Y.; Savenije, H.H.G. Water saving through international trade of agricultural products. Hydrol. Earth Syst. Sci. 2006, 10, 455–468. [Google Scholar] [CrossRef]
  17. Fader, M.; Gerten, D.; Thammer, M.; Heinke, J.; Lotze-Campen, H.; Lucht, W.; Cramer, W. Internal and external green-blue agricultural water footprints of nations, and related water and land savings through trade. Hydrol. Earth Syst. Sci. 2011, 15, 1641–1660. [Google Scholar] [CrossRef] [Green Version]
  18. Vanham, D. An assessment of the virtual water balance for agricultural products in EU river basins. Water Resour. Ind. 2013, 1–2, 49–59. [Google Scholar] [CrossRef]
  19. Papadopoulou, M.P.; Charchousi, D.; Tsoukala, V.K.; Giannakopoulos, C.; Petrakis, M. Water footprint assessment considering climate change effects on future agricultural production in Mediterranean region. Desalination Water Treat. 2016, 57, 2232–2242. [Google Scholar] [CrossRef]
  20. Zhuo, L.; Mekonnen, M.M.; Hoekstra, A.Y. Consumptive water footprint and virtual water trade scenarios for China—With a focus on crop production, consumption and trade. Environ. Int. 2016, 94, 211–223. [Google Scholar] [CrossRef] [PubMed]
  21. Duarte, R.; Pinilla, V.; Serrano, A. The Spanish Food Industry on Global Supply Chains and Its Impact on Water Resources. Water 2015, 7, 132–152. [Google Scholar] [CrossRef]
  22. Sandström, V.; Kauppi, P.E.; Scherer, L.; Kastner, T. Linking country level food supply to global land and water use and biodiversity impacts: The case of Finland. Sci. Total Environ. 2017, 575, 33–40. [Google Scholar] [CrossRef] [PubMed]
  23. Bulsink, F.; Hoekstra, A.Y.; Booij, M.J. The water footprint of Indonesian provinces related to the consumption of crop products. Hydrol. Earth Syst. Sci. 2010, 14, 119–128. [Google Scholar] [CrossRef]
  24. Huang, J.; Zhang, H.-L.; Tong, W.-J.; Chen, F. The impact of local crops consumption on the water resources in Beijing. J. Clean. Prod. 2012, 21, 45–50. [Google Scholar] [CrossRef]
  25. Xu, Y.; Huang, K.; Yu, Y.; Wang, X. Changes in water footprint of crop production in Beijing from 1978 to 2012: A logarithmic mean Divisia index decomposition analysis. J. Clean. Prod. 2015, 87, 180–187. [Google Scholar] [CrossRef]
  26. Lin, J.; Liu, Y.; Hu, Y.; Cui, S.; Zhao, S. Factor decomposition of Chinese GHG emission intensity based on the Logarithmic Mean Divisia Index method. Carbon Manag. 2014, 5, 579–586. [Google Scholar] [CrossRef]
  27. Wang, W.; Liu, X.; Zhang, M.; Song, X. Using a new generalized LMDI (logarithmic mean Divisia index) method to analyze China’s energy consumption. Energy 2014, 67, 617–622. [Google Scholar] [CrossRef]
  28. Ang, B.W.; Zhang, F. A survey of index decomposition analysis in energy and environmental studies. Energy 2000, 25, 1149–1176. [Google Scholar] [CrossRef]
  29. Ang, B.W.; Huang, H.C.; Mu, A.R. Properties and linkages of some index decomposition analysis methods. Energ Policy 2009, 37, 4624–4632. [Google Scholar] [CrossRef]
  30. Ang, B.W.; Liu, F.L. A new energy decomposition method: Perfect in decomposition and consistent in aggregation. Energy 2001, 26, 537–548. [Google Scholar] [CrossRef]
  31. Yang, C.; Cui, X. Global Changes and Drivers of the Water Footprint of Food Consumption: A Historical Analysis. Water 2014, 6, 1435–1452. [Google Scholar] [CrossRef]
  32. Zhao, C.; Chen, B. Driving Force Analysis of the Agricultural Water Footprint in China Based on the LMDI Method. Environ. Sci. Technol. 2014, 48, 12723–12731. [Google Scholar] [CrossRef] [PubMed]
  33. Chenoweth, J.; Hadjikakou, M.; Zoumides, C. Quantifying the human impact on water resources: A critical review of the water footprint concept. Hydrol. Earth Syst. Sci. Dis. 2013, 10, 9389–9433. [Google Scholar] [CrossRef]
  34. Gu, Y.; Li, Y.; Wang, H.; Li, F. Gray Water Footprint: Taking Quality, Quantity, and Time Effect into Consideration. Water Resour. Manag. 2014, 28, 3871–3874. [Google Scholar] [CrossRef]
  35. Pfister, S.; Ridoutt, B.G. Water footprint: Pitfalls on common ground. Environ. Sci. Technol. 2014, 48, 4. [Google Scholar] [CrossRef] [PubMed]
  36. Berger, M.; Finkbeiner, M. Methodological Challenges in Volumetric and Impact-Oriented Water Footprints. J. Ind. Ecol. 2013, 17, 79–89. [Google Scholar] [CrossRef]
  37. Pfister, S.; Boulay, A.-M.; Berger, M.; Hadjikakou, M.; Motoshita, M.; Hess, T.; Ridoutt, B.; Weinzettel, J.; Scherer, L.; Döll, P. Understanding the LCA and ISO water footprint: A response to Hoekstra (2016) “A critique on the water-scarcity weighted water footprint in LCA”. Ecol. Indic. 2017, 72, 352–359. [Google Scholar] [CrossRef]
  38. Hoekstra, A.Y.; Chapagain, A.K. Water footprints of nations: Water use by people as a function of their consumption pattern. Water Resour. Manag. 2006, 21, 35–48. [Google Scholar] [CrossRef]
  39. Chapagain, A.K.; Hoekstra, A.Y. Virtual Water Flows between Nations in Relation to Trade in Livestock and Livestock Products; UNESCO-IHE: Delft, The Netherlands, 2003. [Google Scholar]
  40. Liu, J.; Savenije, H.H. Food consumption patterns and their effect on water requirement in China. Hydrol. Earth Syst. Sci. Dis. 2008, 12, 887–898. [Google Scholar] [CrossRef]
  41. Ang, B.W. Decomposition analysis for policymaking in energy: Which is the preferred method? Energy Policy 2004, 32, 1131–1139. [Google Scholar] [CrossRef]
  42. The United Nations Educational, Scientific and Cultural Organization (UNESCO). The United Nations World Water Development Report 2016; UNESCO: Paris, France, 2016. [Google Scholar]
  43. FAO Software: CropWat. Available online: http://www.fao.org/nr/water/infores_databases_cropwat.html (accessed on 25 July 2016).
  44. Vanham, D.; Bidoglio, G. The water footprint of Milan. Water Sci. Technol. 2014, 69, 789–795. [Google Scholar] [CrossRef] [PubMed]
  45. Scherer, L.; Pfister, S. Dealing with uncertainty in water scarcity footprints. Environ. Res. Lett. 2016, 11, 054008. [Google Scholar] [CrossRef]
Figure 1. Water footprint (WF) of food consumption for Xiamen City.
Sustainability 09 00135 g001
Figure 2. Composition in the WF of food consumption for Xiamen.
Sustainability 09 00135 g002
Figure 3. Decomposition of changes in (a) WF of urban food consumption (b) WF of rural food consumption and (c) total WF of food consumption in Xiamen.
Sustainability 09 00135 g003
Figure 4. Food consumption structure of urban residents in Xiamen (2001–2012).
Sustainability 09 00135 g004
Figure 5. Food consumption structure in rural areas of Xiamen from 2001 to 2012.
Sustainability 09 00135 g005
Table 1. Details of decomposition of WF attributable to urban food consumption in Xiamen (Mm3).
Water Footprint IntensityFood Consumption StructureFood Consumption LevelUrban Population RatePopulation
Grain20.90−82.12−20.6231.5486.58
Oil crops−0.20−1.84−1.843.728.99
Vegetable−8.754.68−3.427.1917.54
Fruit10.82−5.30−5.6110.4722.95
Tea−0.05−12.20−1.973.089.55
Meat0.00206.93−54.53108.53248.34
Eggs0.006.22−5.7510.6626.43
Dairy0.0014.30−3.487.5416.26
Total22.72130.66−97.23182.73436.64
Table 2. Details of decomposition in WF of rural food consumption in Xiamen (Mm3).
Water Footprint Intensity EffectFood Consumption Structure EffectFood Consumption Level EffectRural Population RatePopulation Effect
Grain14.38−23.69−6.24−71.4656.91
Oil crops−0.101.32−0.35−3.502.43
Vegetable−0.781.28−0.38−3.522.58
Fruit0.740.53−0.28−2.641.81
Tea−0.5316.38−1.41−12.398.00
Meat0.006.33−4.85−68.0753.13
Eggs0.002.01−0.41−4.513.28
Dairy0.002.78−0.02−2.111.13
Total13.716.93−13.94−168.21129.28
Table 3. Details of the decomposition of WF for food consumption in Xiamen (Mm3).
Water Footprint Intensity EffectFood Consumption Structure EffectFood Consumption Level EffectUrban/Rural Population RatePopulation
Grain35.28−105.81−26.86−39.92143.49
Oil crops−0.30−0.52−2.190.2211.42
Vegetable−9.535.96−3.803.6720.12
Fruit11.56−4.77−5.897.8324.76
Tea−0.584.18−3.38−9.3117.55
Meat0.00213.26−59.3840.46301.47
Eggs0.008.23−6.166.1529.71
Dairy0.0017.08−3.505.4317.39
Total36.43137.59−111.1714.52565.92

