Article

An Emergy-Based Hybrid Method for Assessing Sustainability of the Resource-Dependent Region

College of Land Science and Technology, China University of Geosciences, Beijing 100083, China
*
Author to whom correspondence should be addressed.
Sustainability 2017, 9(1), 153; https://doi.org/10.3390/su9010153
Submission received: 6 November 2016 / Revised: 9 January 2017 / Accepted: 16 January 2017 / Published: 20 January 2017

Abstract

:
As the natural resources are getting exhausted, the concept of sustainable development of regions has received increasing attention, especially for resource-dependent cities. In this paper, an innovative method based on emergy analysis and the Human Impact Population Affluence Technology (IPAT) model is developed to analyze the quantitative relationship of economic growth, energy consumption and its overall sustainability level. Taiyuan, a traditional, resource-dependent city in China, is selected as the case study region. The main results show that the total emergy of Taiyuan increased from 9.023 × 10²³ sej in 2007 to 9.116 × 10²³ sej in 2014, with a 38% decline in non-renewable emergy and an increase of imported emergy up to 125%. The regional emergy money ratio (EMB) was reduced by 48% from 5.31 × 10¹³ sej/$ in 2007 to 2.74 × 10¹³ sej/$ in 2014, indicating that the increasing speed of consuming resources and energy was faster than the increase of GDP, and that Taiyuan’s money purchasing power declined. The lower emergy sustainability index (ESI) indicates that Taiyuan was explored and produced large quantities of mineral resources, which puts more stress on the environment as a consequence, and that this is not sustainable in the long run. The IPAT analysis demonstrates that Taiyuan sticks to the efforts of energy conservation and environmental protection. In order to promote regional sustainable development, it is necessary to have an integrated effort. Policy insights suggest that resourceful regions should improve energy and resource efficiency, optimize energy and resourceful structure and carry out extensive public participation.

1. Introduction

The sustainability of natural resources is a critical consideration in the development of modern societies, as natural resources are the key factors promoting economic development and supporting our daily life [1]. One important aspect that must be considered is the consequence of the rapid resource consumption and the associated waste generation and polluting emissions, such as air pollutants emission, wastewater discharge and solid wastes [2,3,4,5,6]. Also, the increasing income and improved life quality require more natural resources [7], Thus, it is essential, and of tremendous significance, to study the complicated interactions between economic, ecological and social systems and quantify various flows [8,9], and to try to provide scientific decision support to policy makers to develop appropriate policies for promoting regional sustainability.
Currently, several methods have been used to evaluate regional sustainability; material flow accounting [10,11,12], life cycle analysis [13,14,15] and ecological footprint [16,17,18] are methods that are widely used to account for inputs, out-puts, throughputs and storages in the regions. Indeed, the present study is on emergy analysis, which provides a way to incorporate environmental and socioeconomic flows, as emergy is “the total amount of available energy of one kind that is directly and indirectly required to make a given product or to support a given flow” [19]. This method is conducted from a deep environmental sustainability perspective [20] and has received increasing attention because it can provide a bio-centered perspective to quantify resources use [21]. Emergy analysis is an appropriate method for evaluating and comparing the regional sustainability [22].
Many empirical cases were carried out for assessing resource consumption, overall economic outputs and social benefits by emergy analysis. This method has been successfully applied at the national level [23,24], at the regional level including provinces [25,26], and cities [6,27,28], and at the industrial park level [29,30]. For instance, Wei Chen et al. [23] estimated the sustainability of cement production in China and suggested that adjusting industrial structure, improving energy efficiency, and applying alternatives to replace raw materials were effective approaches to improve the sustainability of cement industry. Liu Hao et al. [25] evaluated the ecological-economic system in Liaoning Province of China and found the principles of reduction, reutilization and recycling should be taken as the guidelines for promoting the reuse of wastes and the closed fine circulation of resources to minimize the discharge of wastes by conducting emergy analysis. Liu, Z. et al. [6] compared the different characteristics among different four Chinese mega-cities (Beijing, Tianjin, Shanghai and Chongqing) by conducting emergy analysis and implied that large cities were further dependent on energy supplies from neighboring regions. Similar studies were also undertaken in Texas, namely by Odum, H.T. and Blissett, M. [24], who examined and evaluated the relationships of natural and environmental resources to the Texas economy. Such a research finding can help local governments make appropriate regional sustainable production and consumption policies.
Emergy analysis has been employed to assess renewable, nonrenewable, local and imported resource flows, as well as human-dominated ecosystems. However, at the regional level, in recent years, many scholars have selected some cities as research subjects, to probe deeply into the sustainability regarding resource flows, which are organized and measured to depict the development structure of a city. Some are focused on the metropolitan cities like Beijing, Texas, Rome and Italy [6,24,31,32]; there are some researchers who concentrate on the specific types of cities, such as Suzhou, an export-oriented city in Eastern China [33], and Shenyang, an industrial city in the northeast of China [25]. Moreover, there are also studies on other patterns of cities , such as the research on urban comprehensive performance linking impacts to sustainability evaluation of Chongqing [34], the research on sustainable trends from 1960 to 2013 in an agriculture-based region of Puerto Rico [35], the research on the spatial disparity between built-up urban sprawl region and urban footprint regions of Xiamen [36], and discussions of sustainability on eco-economic system of Chengdu [37] and each of municipality in the province of Siena [38]. Few researchers discuss the sustainability of resource-dependent cities, and, in previous research, there were some researchers who used the emergy method to analyze the development of resource-dependent cities, and the papers are mainly focused on the development level of a circular economy [39], evaluation of economic system [40], eco-efficiency [41], and urban development level evaluation [42]. However, there is little research on the sustainability of resource-dependent cities, especially cities located in Shanxi Province of Western China. Shanxi Province has been determined as the “Experimental area of comprehensive reform of resource-dependent economy”. Moreover, few studies focused on the dynamics of the anthropogenic drivers on total resource use and the overall sustainability. Under such a circumstance, it is critical to evaluate resource-dependent regions by employing emergy analysis so that proper sustainable development strategies can be prepared. The unique contribution is that this study will combine emergy analysis with the IPAT model so that the relationship between population dynamics, human well-being and resource consumption can be examined. A case study approach is adopted to investigate its development and evaluate its overall sustainability.
Taiyuan city, a traditional, resource-dependent city center in the hinterlands of China, is selected as our case study region. There are abundant mineral resources, such as iron, manganese, copper, aluminum, lead, zinc, etc., and the city is facing various challenges brought by these resources exploitation and utilization, such as higher energy consumed, heavier pollution, higher waste emission [43]. The potential policy insights from this study can also provide useful references for other resource-dependent regions with similar challenges. The whole paper is organized as below. After this introduction section, we present our data source and research methods, including emergy analysis procedures and the IPAT model. We then present our research results and discussions, finally, we give the policy implications before drawing our conclusions.

2. Study Area and Data Source
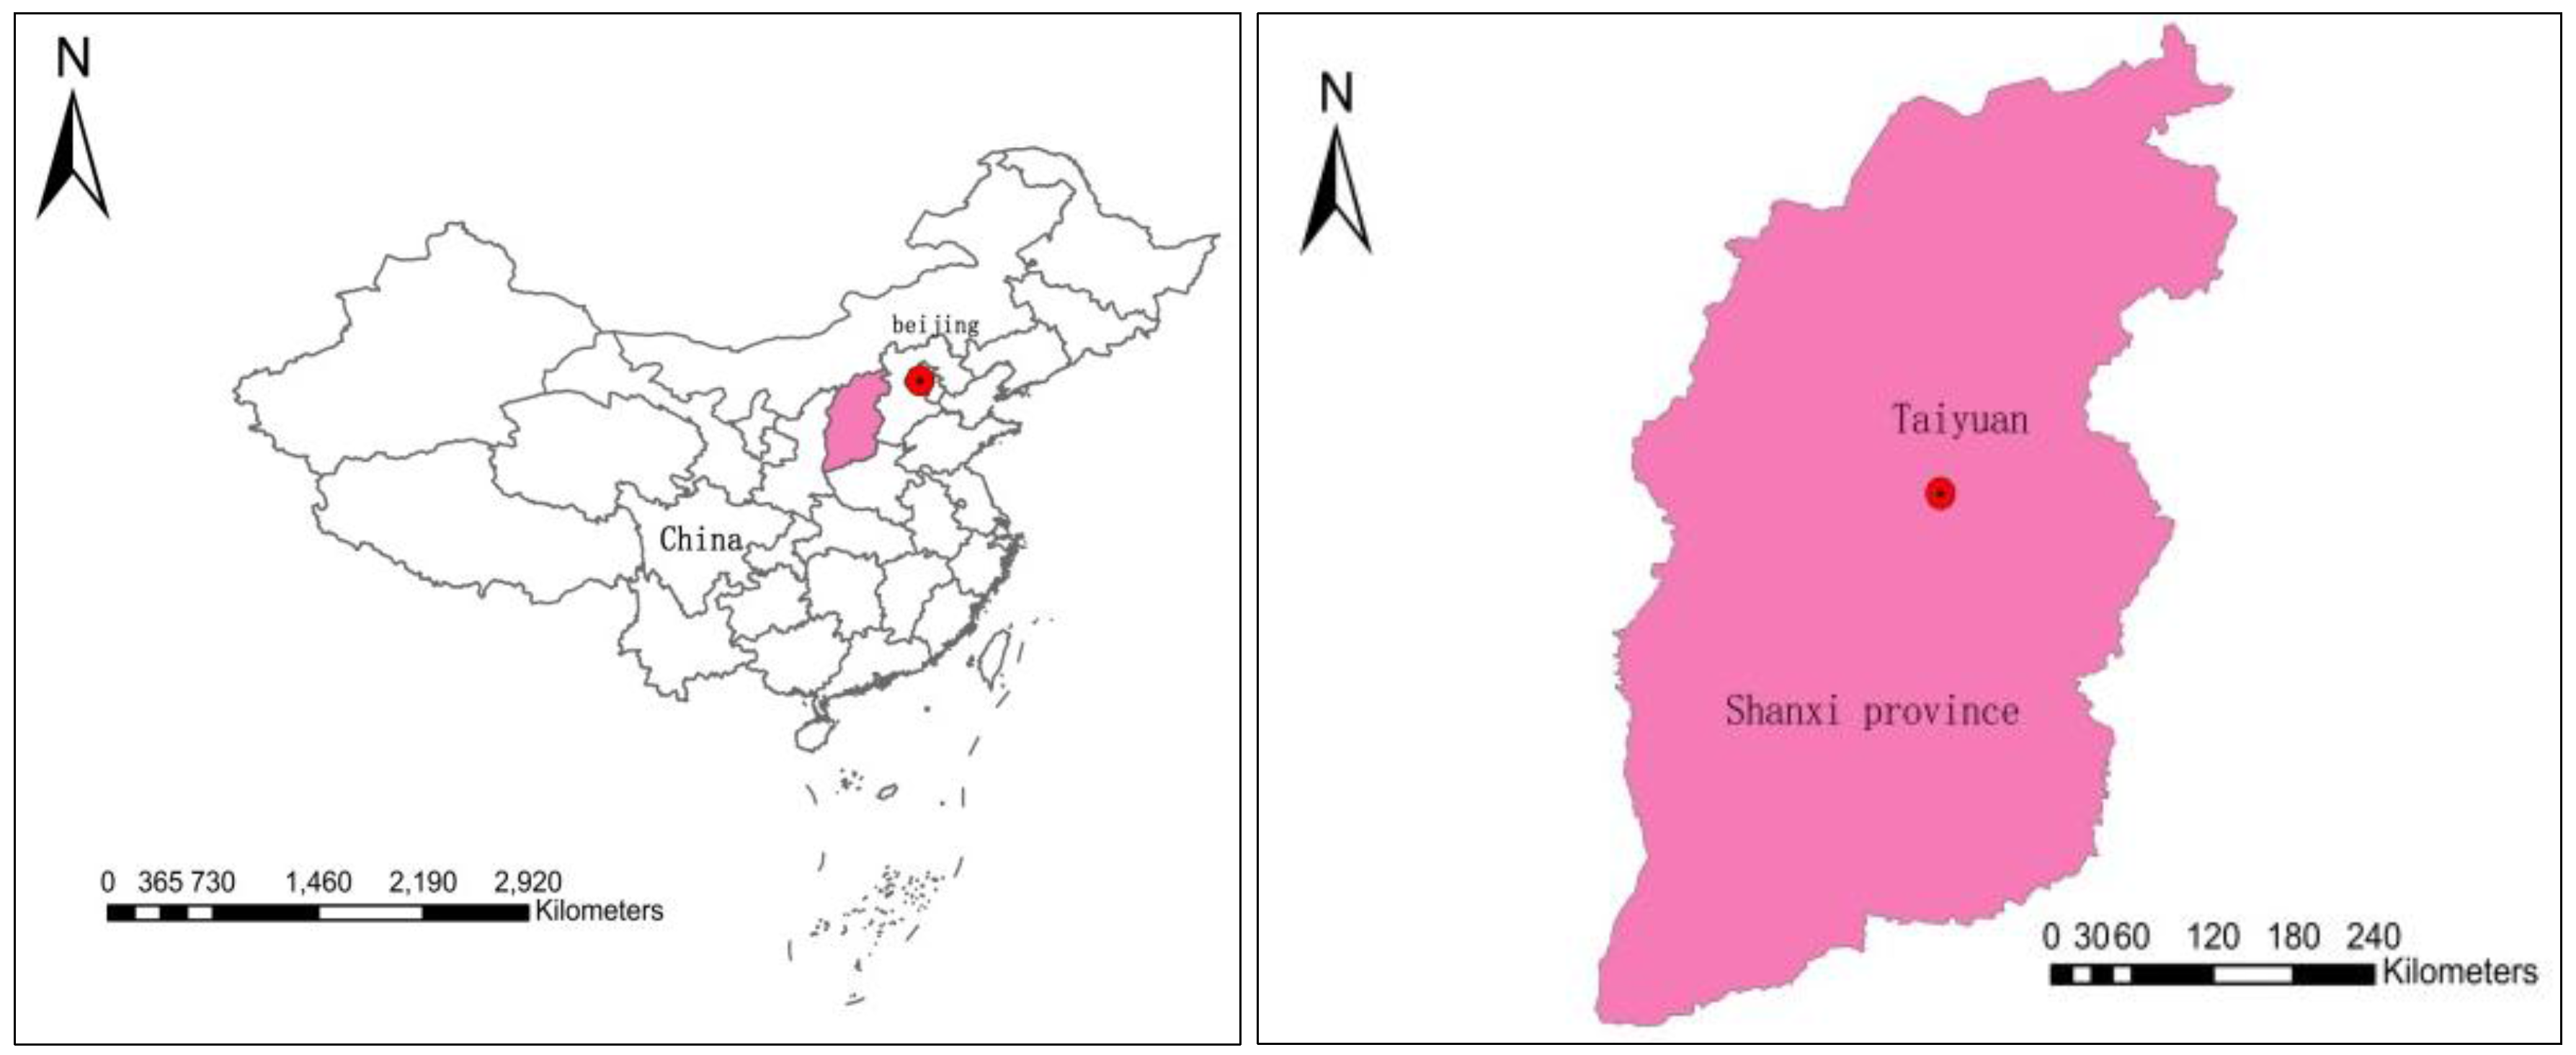
2.1. Study Area

Taiyuan City (lat. 32°20′ N–34°08′ N, long. 101°30′ E–103°30′ E, elevation 800 m above mean sea level), shown in Figure 1, the capital of Shanxi Province, lies in the fragile ecological environment of the eastern Loess Plateau. With a total area amounting to 6988 km2, Taiyuan, the political, economic, cultural and educational heart of Shanxi province, has been oriented as one of the major centers in China for energy production and for chemical and metallurgical industries, and the proportion of heavy metal industries in Taiyuan is ranked second out of 20 major metropolitans in China [44,45]. It is the national important energy sources and heavy chemical city which is characteristic by outputting energy, raw materials and other products, taking the metallurgy, chemical engineering etc. as the pillar. Similar to other Chinese cities, Taiyuan City has experienced rapid urbanization and economic development. The proportion of heavy industry production values within the secondary industry in Taiyuan was above 90% from 2007. Furthermore, the Chinese government set targets for energy efficiency for the 11th Five Year Plan; starting in November 2006, the Shanxi government made various efforts to reduce energy intensity of the economy. The GDP of Taiyuan City increased from 1.04 × 10¹¹ yuan in 2007 to 2.53 × 10¹¹ yuan in 2014.
The orientation of Taiyuan is a “national important energy sources and heavy chemical city”, which has run counter to the concept of sustainable development of city. In 1998, Taiyuan was listed by some related organization in United Nations as one of the world’s top 10 polluted cities. Natural resources are being exhausted because of unreasonable use. Such a series of problems are reducing the development of Taiyuan. Since Taiyuan has done better in controlling the pollution and economic structure transformation, we choose Taiyuan City as an appropriate case study for assessing the sustainability. However, there is still much work to do for Taiyuan with respect to sustainable development.

2.2. Data Source

The original research data were derived from the Taiyuan Statistics Yearbook (2007–2015) [46].

3. Methods

3.1. Emergy Analysis

Emergy was first introduced by the ecologist Odum, and is defined as the amount of energy of one type (usually solar) that is directly or indirectly required to provide a given flow or storage of energy or matter. Emergy synthesis projects local input flows on a biosphere scale, by converting all the materials, energy sources, human labor, and services required, directly and indirectly, into emergy units that are summed up to yield the total emergy [47]. The emergy of all inputs to a system is calculated in terms of solar emjoules (sej) by means of suitable conversion factors called transformities (expressed in sej/J) or specific emergy (expressed in sej/g or other units). In this paper, the following steps were used to conduct the emergy analysis:
The first step is to analyze the main ingredients and energy flows of the study area, and establish a basic database consisting of the natural environment, agriculture, industry, and other economic and social sectors. It is crucial to define the system boundary and identify the main features of the research area so that the interactions of resource flows and primary resources can be clearly reflected. The second step is to distinguish main renewable, local non-renewable, imported and exported emergy categories, and then calculate the emergy value in terms of solar emjoules (sej) by the process of conversion. The conversion equation is as follows:
E m = i T i × E i
In the equation, Ti stands for the solar transformity of the ith input flow, while Ei is the actual energy content of the input flow to the process.
The third step is to calculate the emergy value of each category comprised of renewable resources (R), non-renewable resources (N), imported resources (IM) and exported resources (EX). Renewable resources include natural energy, such as solar energy, wind energy, rainfall energy (chemical), rainfall energy (geo-potential), planet cycle energy, and local renewable resources, such as agricultural products, livestock, and aquatic products. Non-renewable resources include electricity, cement, steel, gasoline diesel, etc. The imported and exported resources mainly consist of raw and commercial products, and tourism is also included in the imported resources. The values of solar transformity are drawn from published research, by researchers including Odum and Huang [48,49,50]. The detailed flows and corresponding transformity are shown in Table 1.
Finally, emergy indicators are selected to examine the properties and environmental performances of the urban system, in this paper, several emergy indicators are established based on published papers from Odum, Song and Brown [48,51,52]. The main dynamic indicators can be seen in Table 2.

3.2.The IPAT Model

In order to further analyze the quantitative relationship of economic growth and energy consumption, this article employs the IPAT equation and expands this model to carry out empirical analysis. The IPAT equation, proposed by Ehrlich and Holdren [53] in 1970, is a mathematical equation that includes the relationship of environmental impact (I) with population (P), affluence (A) and technology (T), to study the relationship among economic growth, resources and environment of the form. In this study, we employ this identical model to reveal the contribution of the three driving factors, the equations can be expressed as
I = P × A × T
Where P indicates the total population, A indicates per capita GDP, T indicates emergy consumption per unit of GDP (total emergy/GDP, namely consumption intensity).
This equation could be simplified as:
I = G × T
Where G refers to GDP.
If G0 represents GDP in the base year, g represents the annual growth rate of GDP, t represents the decline rate of technology improvement, then emergy use in target year (n) can be calculated as:
I n = G n T n = G 0 × T 0 × ( 1 + g ) n × ( 1 t ) n = G 0 × T 0 × ( 1 + g t g t ) n
In case of gtgt > 0, the environmental impact increases year by year.
In case of gtgt = 0, the environmental impact is constant.
In case of gtgt < 0, the environmental impact decreases year by year. GT is defined as an indicator to measure the environmental impact.

3.3. Assessment Procedures

The first assessment step is to analyze all the emergy flows within the regional system. It is crucial to define the system boundary and identify the main features of the study area so that the interactions of resource flows and primary resources, outside components and processes, and their import and export flows can be clearly depicted. The second step is to provide flows of resource consumption that promote economic growth and human welfare within the region (Table 1). The third step is to distinguish main renewable, non-renewable, imported and exported emergy categories. Each flow should be multiplied by a correspondent, the solar transformity, so that it can be converted into an emergy value. The fourth step is to calculate the emergy value of each category that supports the region during the investigated years as well as the emergy-based indicators detailed in Table 2. By combining this with the IPAT equation, the quantitative relationship of economic growth and energy consumption since 2007 can be further analyzed. Finally, appropriate sustainable development policies can be proposed by considering the local realities.

4. Results and Discussion

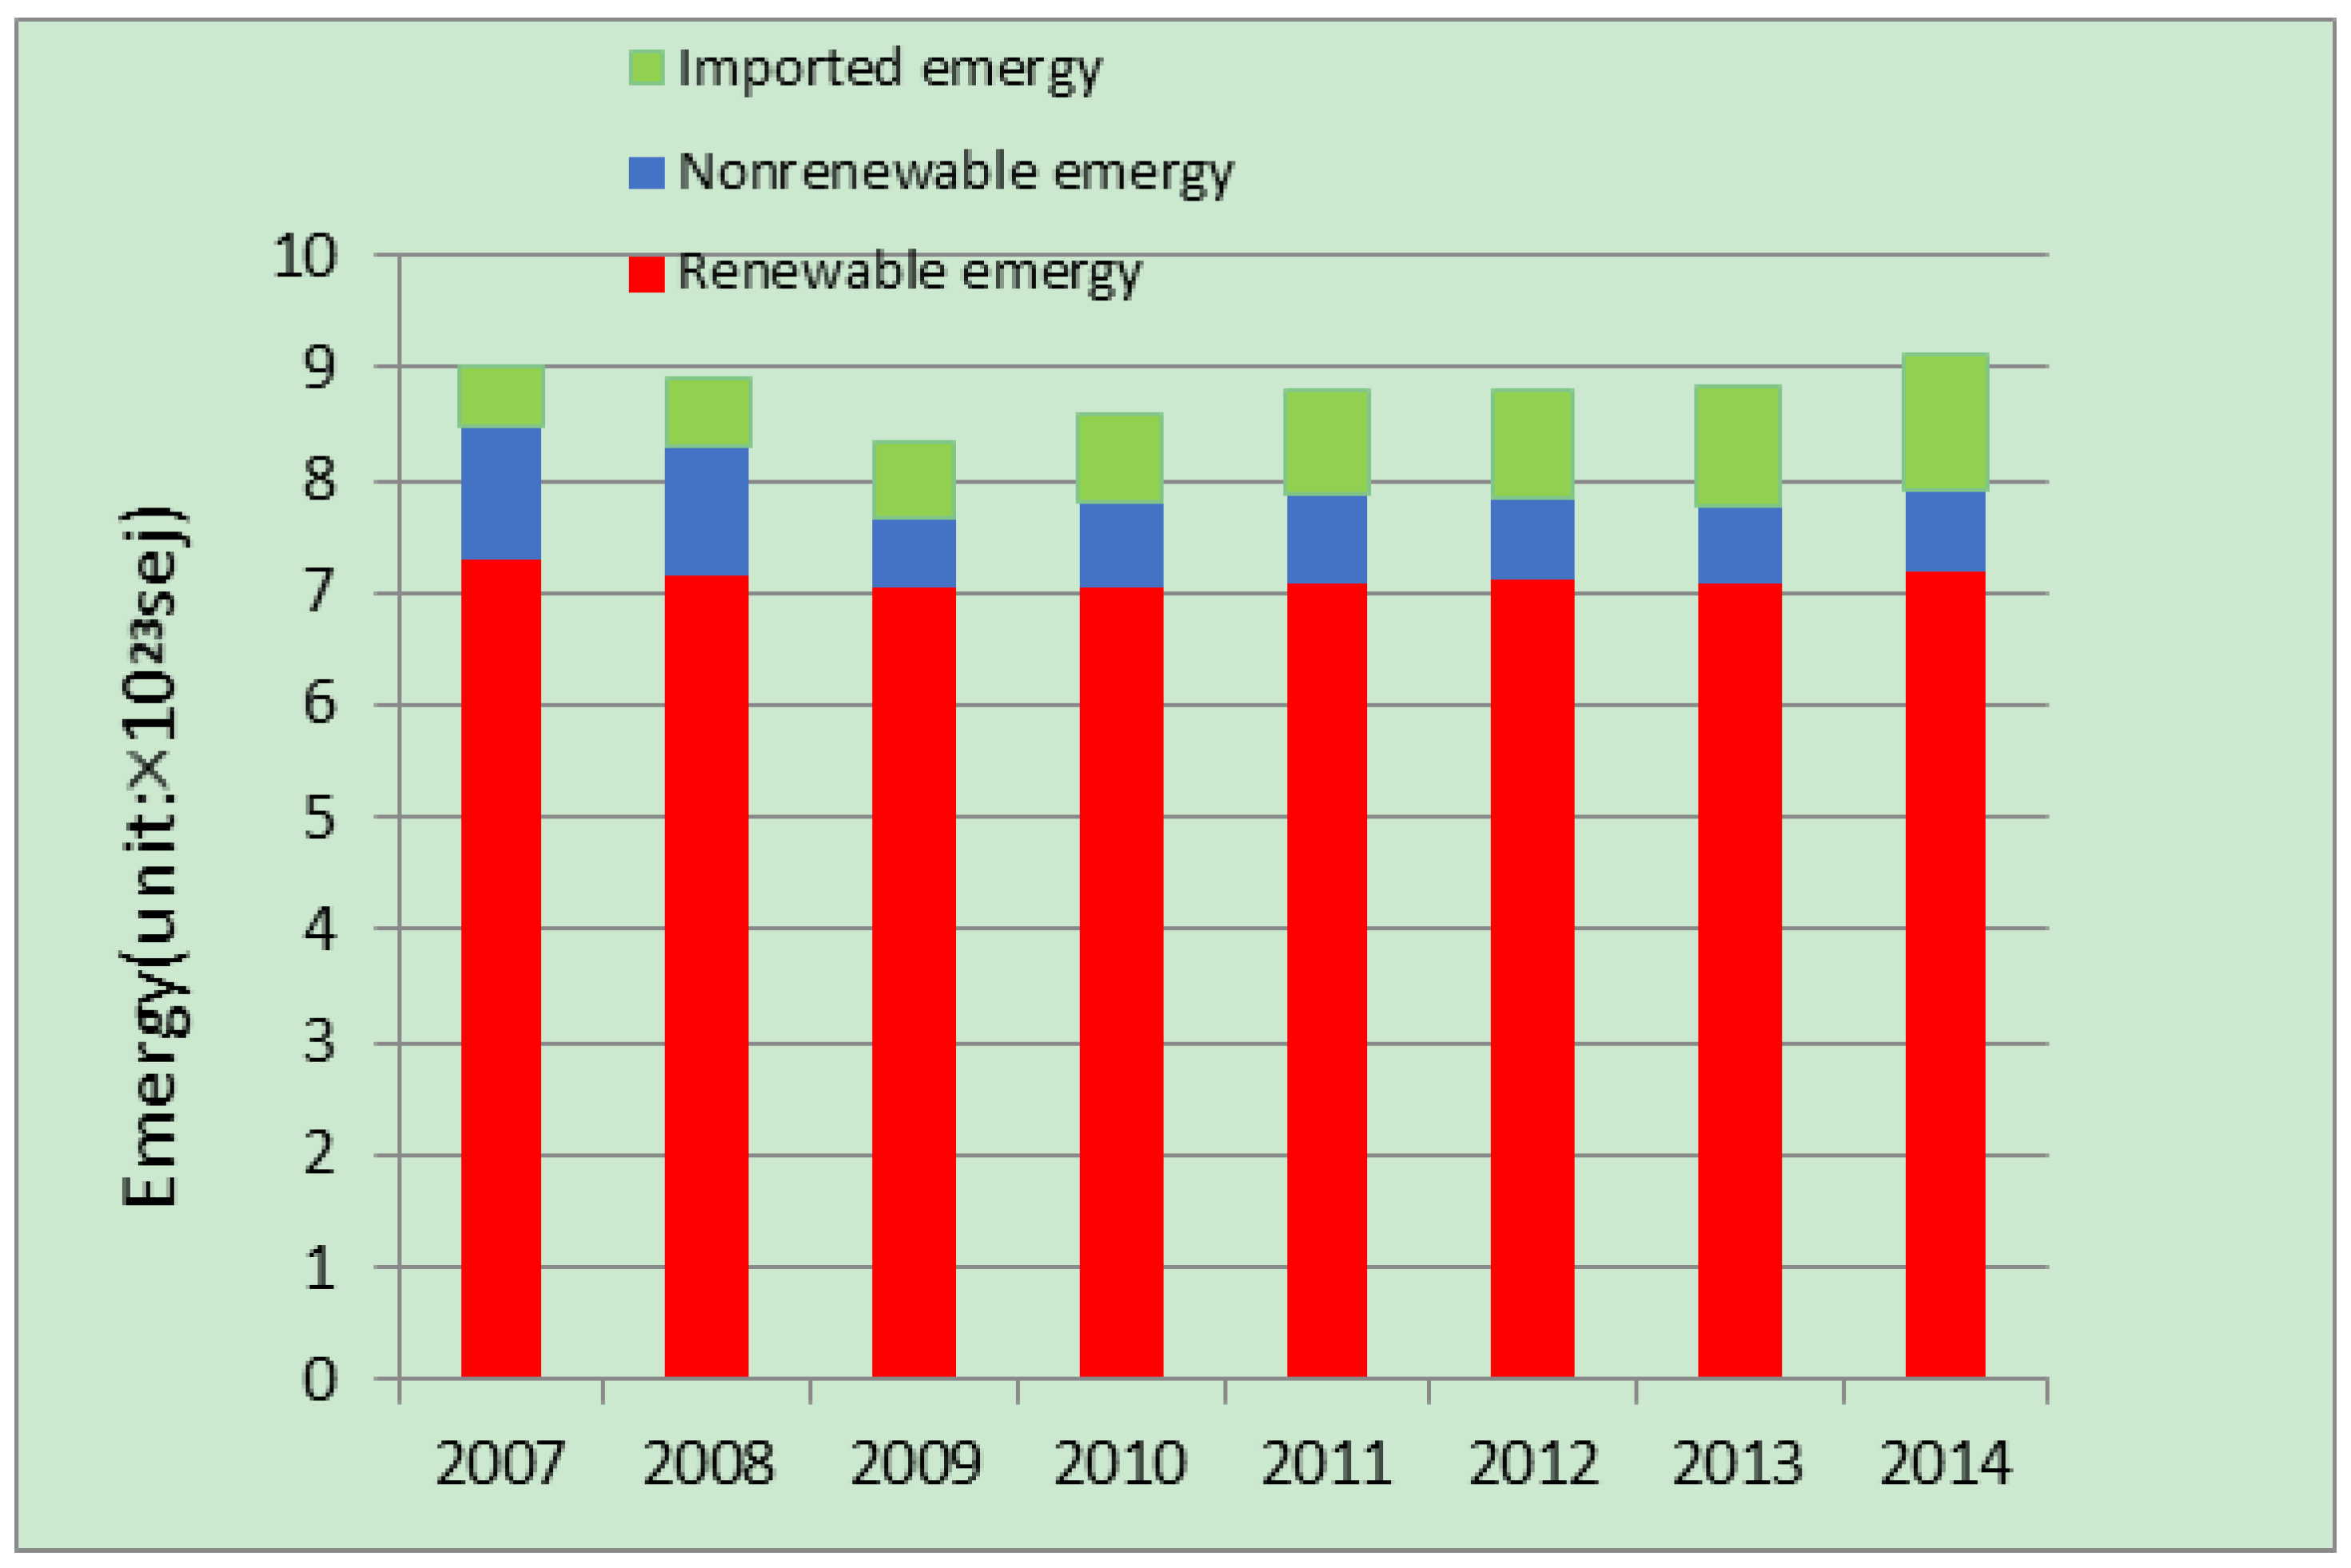
4.1. Emergy Flows of the City from 2007 to 2014

In the composition and structure of the emergy flows, the values of total emergy per year (U) demonstrate an upward trend, but there are no significantly increased amplitudes for this region. From 2007 to 2014, the total emergy of Taiyuan increased from 9.024 × 10²³ sej to 9.116 × 10²³ sej (Figure 2). In terms of the growth range, the value of total emergy in Taiyuan increased by only 1.02%. These results show that the materials and energy involved in the city increased due to an accelerated development of urbanization and industrialization in recent years, but because the entire scale of Taiyuan is too large, the potential rising speed is slowed. More specifically, renewable and nonrenewable emergy, imported and exported emergy are the four main components. Renewable resources including solar, rain, wind, earthcircle, agricultural products, livestock and aquatic products remained nearly steady on the whole. Nonrenewable emergy decreased from 1.166 × 10²³ sej in 2007 to 0.741 × 10²³ sej in 2014, which demonstrates that Taiyuan is abundant in mineral resources and a decrease in nonrenewable emergy in Taiyuan was mainly induced by consumption of minerals, a key feature of a manufacturing-based resource city, so it develops its economy mainly through exploiting and producing mineral resources, which are generally non-renewable. With regard to imported and exported emergy, the imported emergy increased from 5.59 × 10²² sej in 2007 to 1.26 × 10²³ sej in 2014, while the exported emergy increased from 2.35 × 10²² sej in 2007 to 4.16 × 10²² sej in 2014, and the imported emergy is higher than exported emergy in Taiyuan. This indicates that local commodity and services cannot support local economic development and have to rely on importing resources.

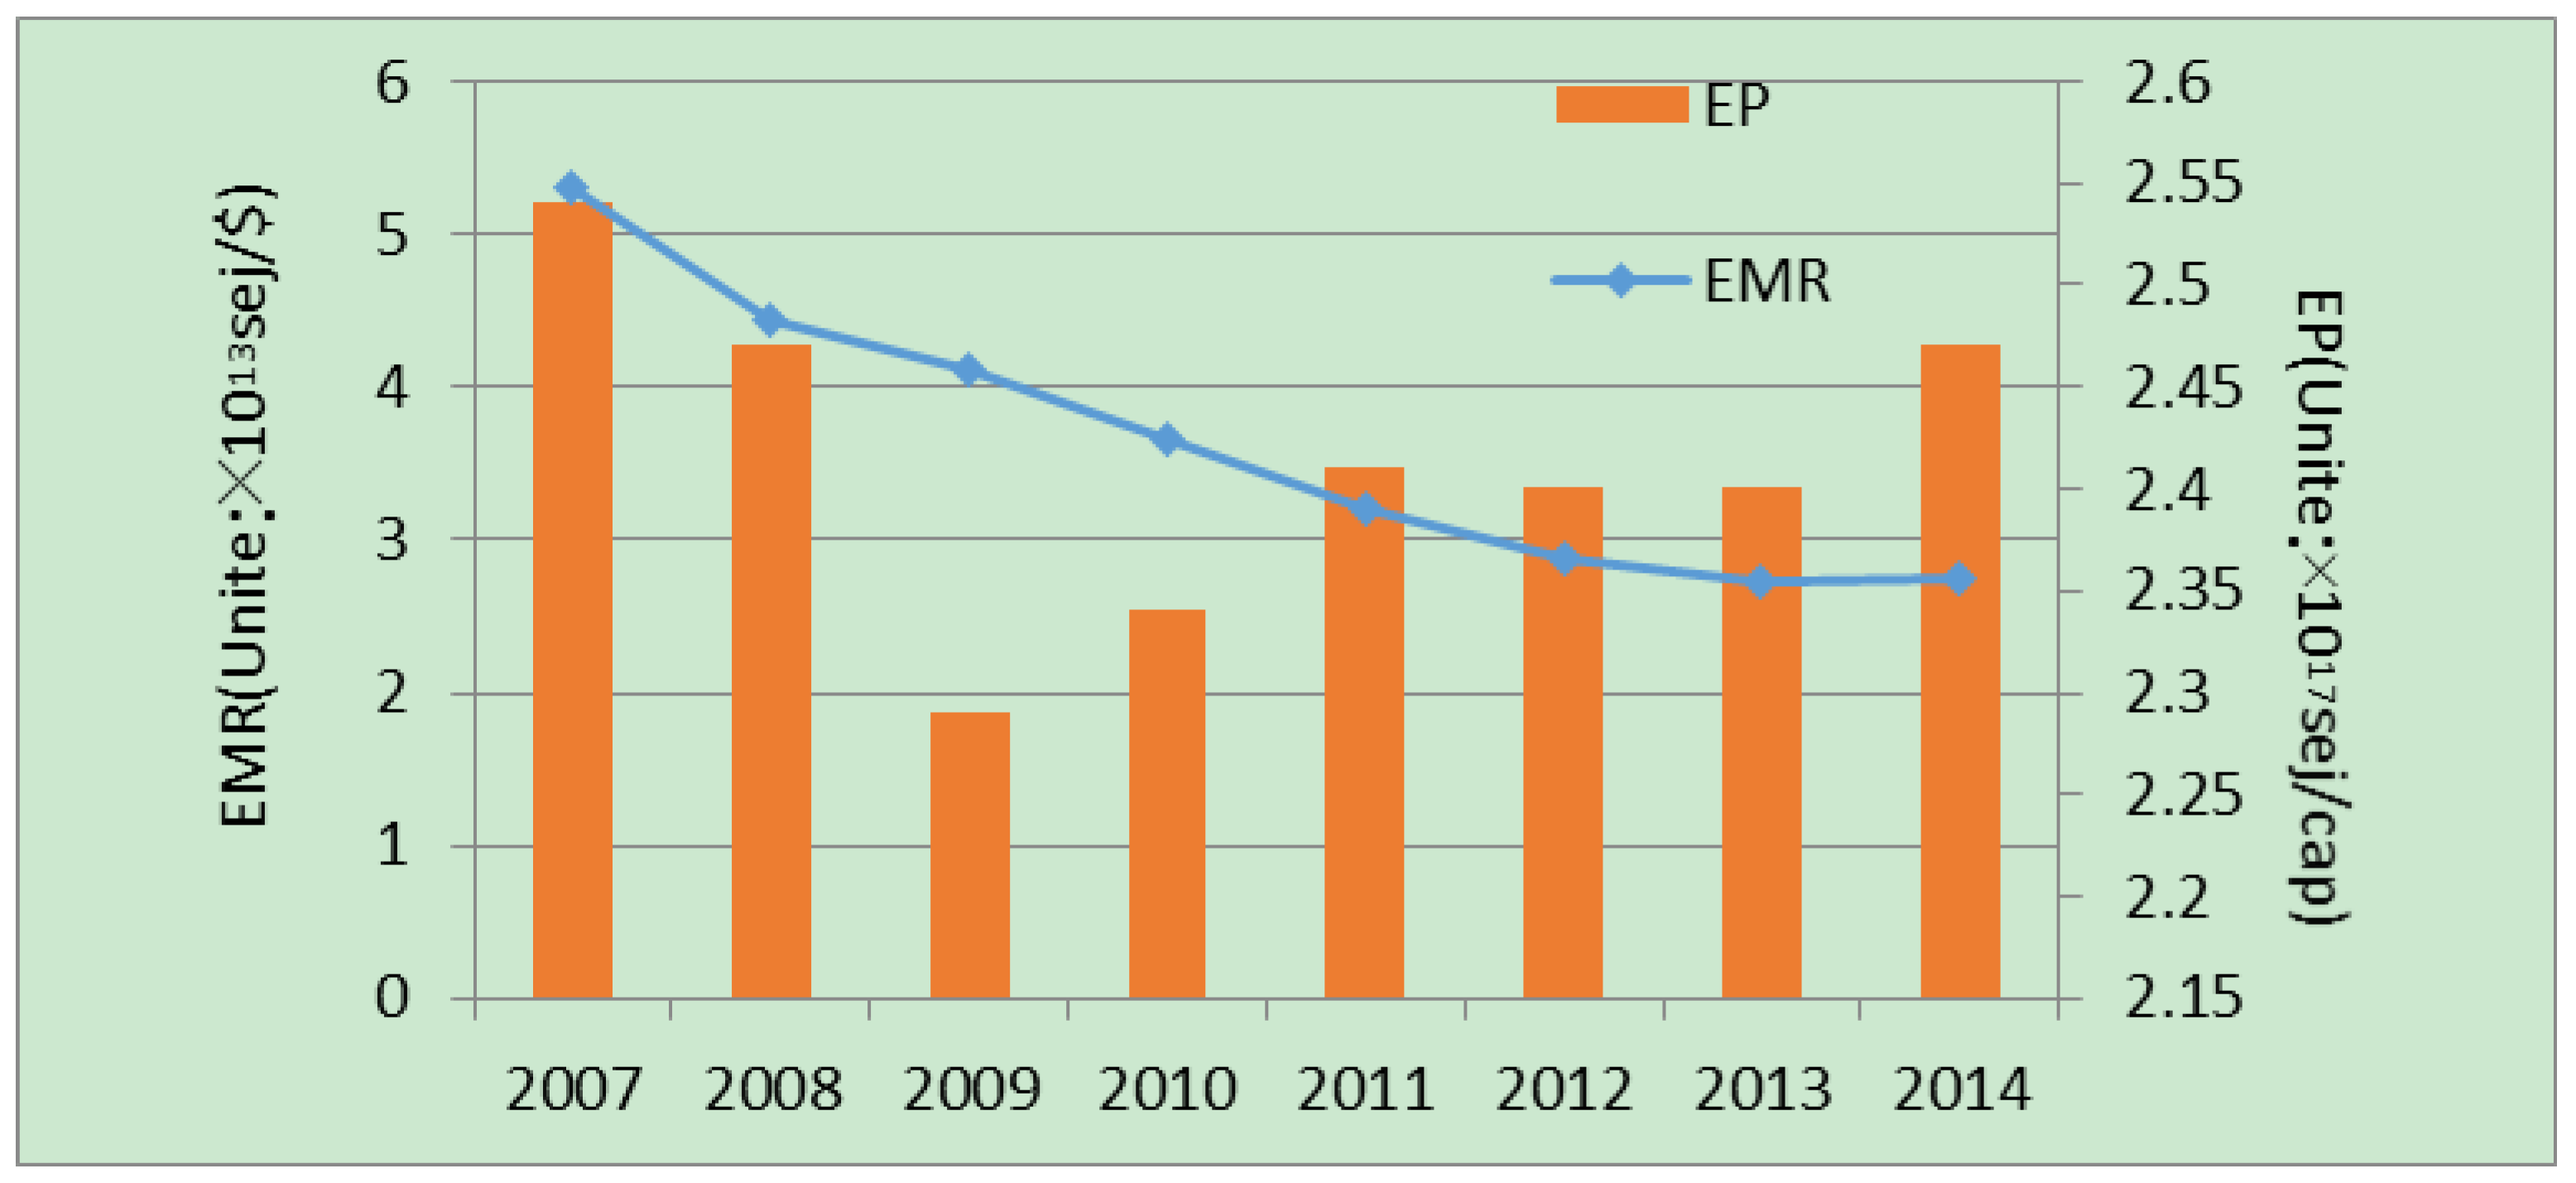
4.2. Emergy Indicators

EMR is the ratio of total used emergy divided by the GDP of one region, which is an indicator to evaluate how the economic system depends on local resource consumption and money purchasing power. The higher the value of EMR, the fewer resources are being used to generate the same amount of GDP. Figure 3 shows that EMR in Taiyuan decreased by 48% from 5.31 × 10¹³sej/$ in 2007 to 2.74 × 10¹³ sej/$ in 2014; from the change process, the value of EMR is reduced, indicating that the increasing speed of consuming resources and energy was faster than the increase of GDP, and that Taiyuan’s money purchasing power declined.
EP was calculated by dividing total emergy by the local population, which is an indicator to evaluate the living standard of the region, including both renewable and nonrenewable resources. During 2007–2014, Taiyuan’s population increased from 3.56 million to 3.7 million. EP for Taiyuan remained at the level of approximately 2.42 × 10¹⁷ sej/cap; this demonstrates that the increasing growth of the population is equivalent to the increment of available resources and energy in Taiyuan. As an industrial city, Taiyuan has a high value of emergy use, mainly from the mining of local coal and metal ores, but the benefits are not completely conveyed to local residents since an increasing number of workers and trained staff from neighboring cities pour into Taiyuan, as there are more employment opportunities and better living standards.
EYR can be used to measure the investment efficiency of external resources to exploit local resources and contributions to the economy. A larger EYR value indicates that the economic development relies more on local resources, so the higher the value of EYR, the more efficient the energy and materials used in the local urban system. As can be seen in Figure 4, the EYR of Taiyuan decreased gradually from 16.15 in 2007 to 7.56 in 2014, with an almost twofold decrease. This demonstrates that less local resources are exploited, and that the utilization efficiency of resources has been decreasing, and the configuration of resources in Taiyuan still need to be optimized. ELR reflects environmental pressure from the perspective of environmentally renewable capacity to support economic processes; the ELR in Taiyuan is on the rise with some fluctuations, increasing from 0.24 in 2007 to 0.27 in 2014. The above results demonstrate that the use of non-renewable resources were consumed, and there exists a great deal of potential opportunities for Taiyuan to adjust its industrial structure and to implement an energy saving strategy. ESI is the system performance indicator to measure one system’s overall sustainability. An increasing value of ESI indicates that one region is moving toward sustainable development, with a feature of using less nonrenewable resources locally available and less import, while a lower ESI value reflects that one region consumes more nonrenewable emergy and imports more emergy from outside, moving toward unsustainable development . In the study period, the ESI of Taiyuan shows a downward trend, declining from 68.33 in 2007 to 27.80 in 2014, which shows that the self-organization and sustainability of Taiyuan is continuously deteriorating. This result reveals that Taiyuan, a resource-dependent city, explored and produced large quantities of mineral resources, which puts more stress on the environment as a consequence, and that this is not sustainable in the long run. As the capital of Shanxi Province, though tremendous volumes of mineral resources were buried underground the city, its exploration activities were constrained by some influential factors, such as urban land use planning and environmental regulations, etc. But the stress to the environment is still high; it is critical to identify the optimal pathway so that the resource-dependent city can move toward sustainable development.

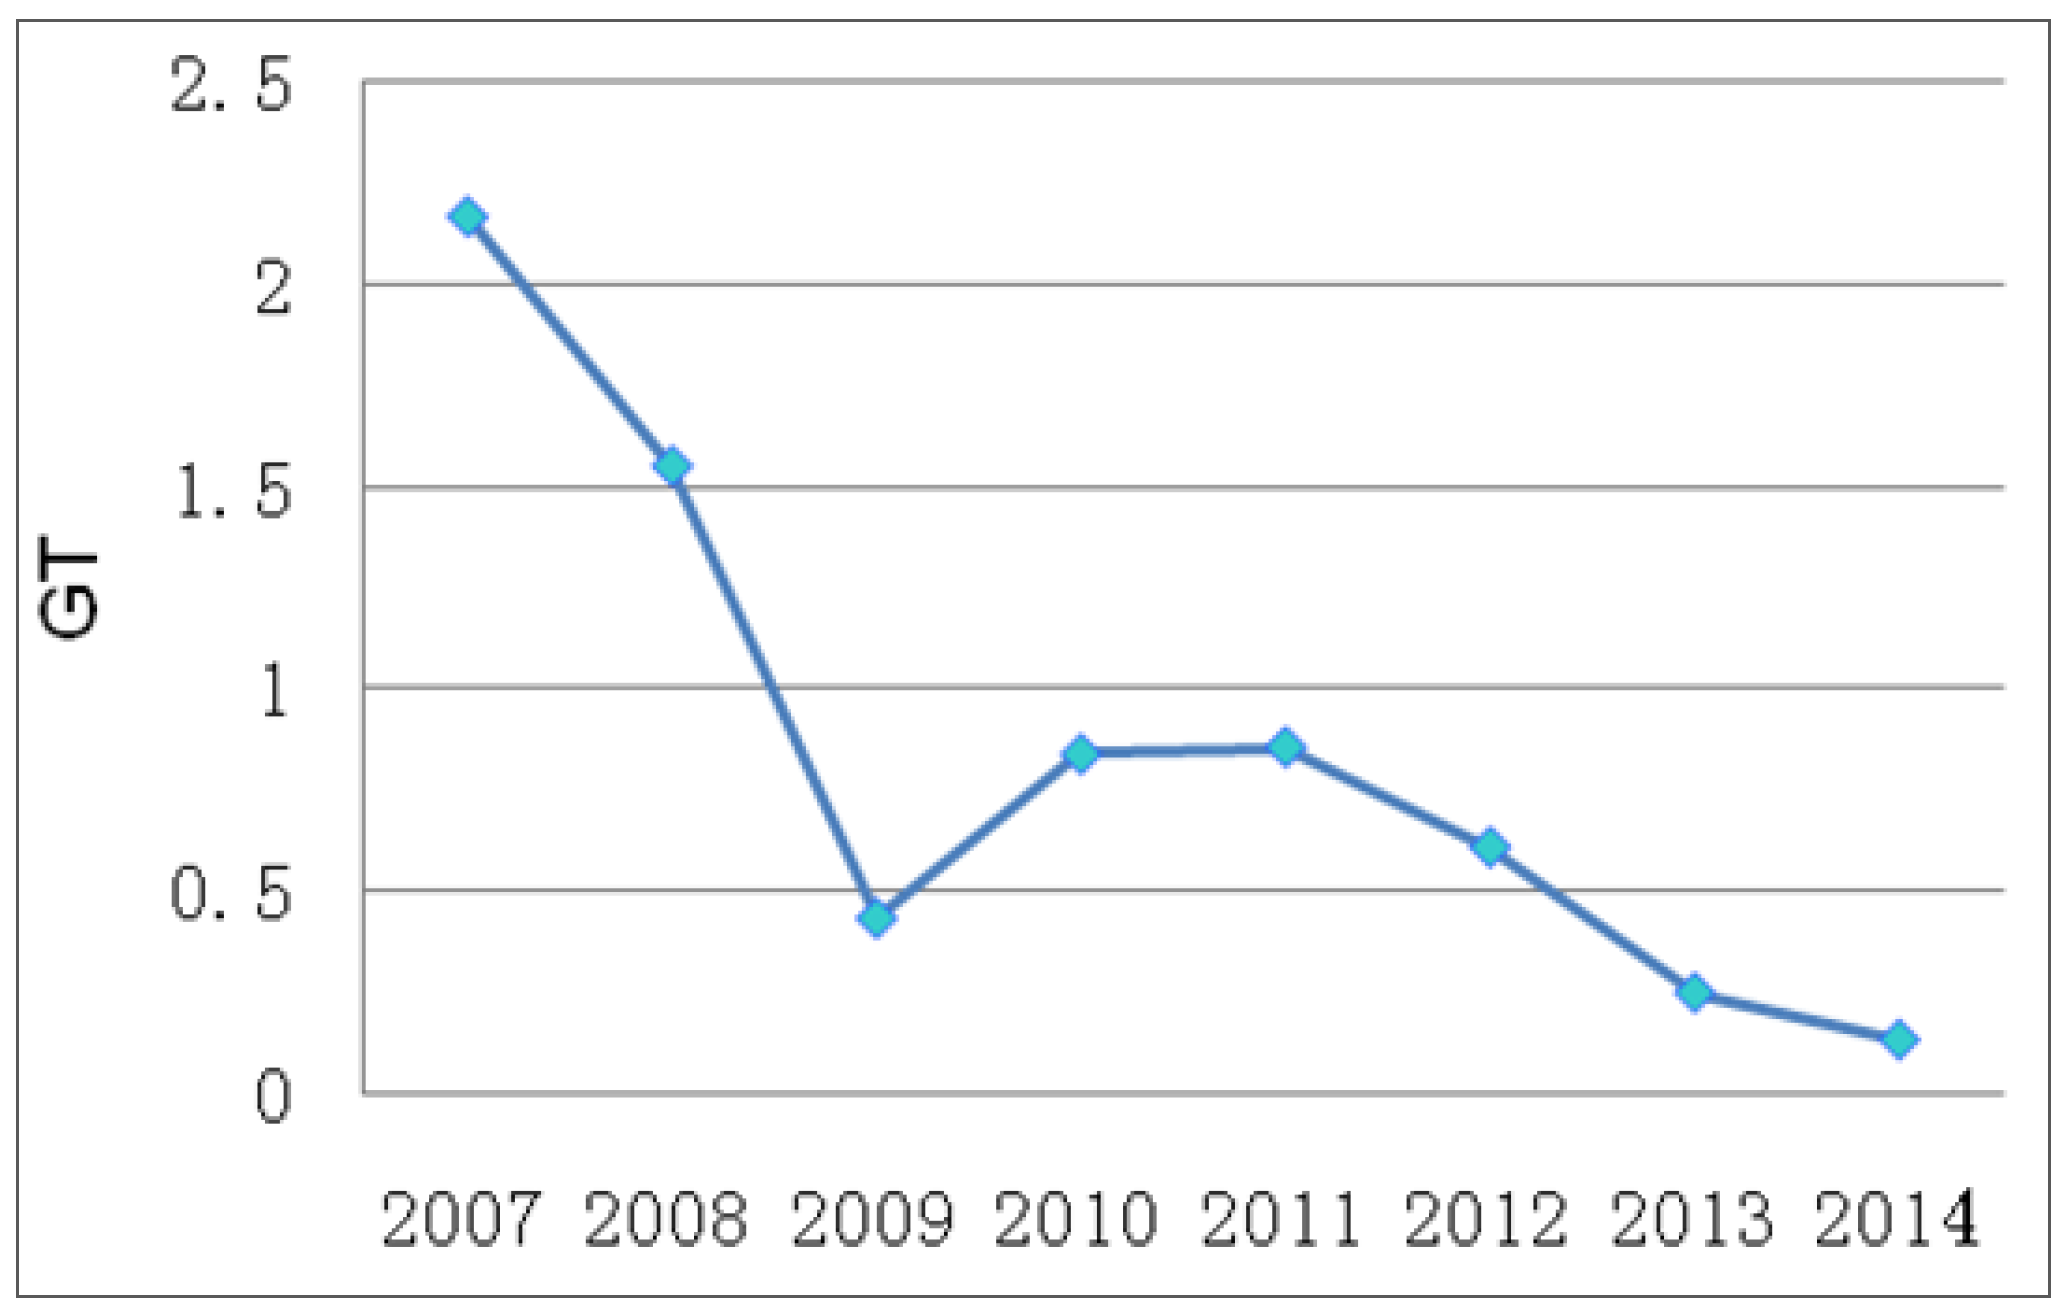
4.3. The Application of IPAT Function

As shown in Figure 5, from 2009 to 2014, the values of GT fluctuate in a relatively stable condition, while some unstable values appear from 2007 to 2009. As a whole, the results mean that the impact of economic development on environment tend to decrease over time, and economic development is harmonious with environmental protection. The GT values reached the relatively stable period maximum of 0.86 in 2011 and then declined gradually from 2011 to 2014. Because of the international financial crisis starting in 2008, Taiyuan expanded investment of infrastructure once again in order to ensure its rapid economic growth, in which the effects of investment of infrastructure to the environment are evident and the value of GT decrease disharmony.
According to the growth rates in all years, we determined that the average growth rate of GDP in 2007–2014 is 0.12, while the average decline rate of energy consumption is 0.6206 in the same period, in which the average decline rate of the total GT value is 0.8582. In the course of fast development of the economy, Taiyuan has not given up the efforts of energy conservation and environmental protection.

5. Policy Implications

In particular, resource-dependent cities face more challenges in balancing economic development and environmental protection. In this paper, as a typical Chinese resource-dependent city, Taiyuan is selected as one case study region for quantifying the interactions between its economic, ecological and social systems, so that valuable policy implications can be found for policy makers. Emergy analysis and the IPAT model are combined in order to evaluate its overall sustainability level. The following policy insights have been achieved and listed below.
Taiyuan should improve energy and resource efficiency, reduce local fossil fuel and natural resource exploitation and rely less on imported energy. As a typical Chinese resource-dependent city, Taiyuan has too many different mineral resources, leading to more consumption of fossil fuels. Such a resource development structure cannot be easily changed due to the national development plan. Therefore, it is critical for both local government and local residents to work together and support innovative green production technologies [54,55]. Shanxi is experiencing a stage of urbanization process, and this will increase the pressure on its carbon mitigation. Therefore, the government should promote the green urbanization by developing green construction and improving the public transportation systems. Meanwhile, the clean and renewable energy should be widely popularized and used in people’s daily life, heating and power generation, e.g., wind, solar, hydro and biogas [56]. Under such a circumstance, the Taiyuan government should prepare their own green building standards by considering the local weather and other conditions. Meanwhile, innovative concepts, such as process integration and industrial symbiosis, should be further promoted so that both energy and resource efficiency can be further improved. In addition, it is urgent to develop renewable and clean energy, such as solar power, wind power, and geothermal power, so that energy structure can be optimized toward more sustainable direction.
It is rational for Taiyuan to optimize its resource structure. The emergy analysis results indicate that Taiyuan is more developed than other resource-exporting cities, but still far from the most developed regions in China, such as Beijing [28]. As an important resource-dependent city, Taiyuan’s economy is based upon large consumption of raw materials. However, with the depleting resources, Taiyuan is suffering from increasing environmental issues and unemployment. Many resources were simply exploited and exported to other regions for further processing due to a lack of advanced technologies. In order to respond to such a challenge, the Taiyuan government should facilitate the development of those high-tech oriented businesses so that local nonrenewable resources can be better utilized within Taiyuan. Furthermore, provincial government should allocate funds to support professional education for those workers so that they can learn the new skills. Also, those polluting and energy inefficient enterprises should be phased out, while service-oriented businesses should be supported since they consume less energy and have less emissions. In this regard, it is a signal to regional planners that they must focus more on sustainable development and the environment protection in Taiyuan City due to its fragile ecological environment, so as to maintain a balance between economic development and ecosystem health in the future [57]. The overall improvement of Taiyuan’s sustainability should be based on the concerted efforts of all the interests communities, including government, industries, non-governmental organizations, universities, and local residents. Without a collective action, it is impossible to achieve the expected targets. Therefore, various utility activities should be initiated so that all the members can improve their environmental awareness. Furthermore, various regional collaboration is also crucial so that advanced technologies, management practices can be transferred to Taiyuan.

6. Conclusions

Taiyuan is experiencing rapid urbanization, fast population growth and resource consumption. However, such rapid development also brings many problems, such as resource depletion, environmental pollution and damaged ecosystems. In order to prepare appropriate sustainable development strategies, it is crucial to evaluate its sustainability. In this regard, the study combines both emergy analysis and the IPAT model to evaluate its overall sustainability level and to analyze the parallel driving forces. The results show that the consumption of renewable resources remained nearly constant from 88.88% in 2007 to 78.64% in 2014, nonrenewable emergy decreased from 1.166 × 10²³ sej in 2007 to 0.741 × 10²³ sej in 2014, and the imported emergy increased from 5.59 × 10²² sej in 2007 to 1.26 × 10²³ sej in 2014, while the exported emergy increased from 2.35 × 10²² sej in 2007 to 4.16 × 10²² sej in 2014. With regard to key emergy indicators, EMR reduced by 48% from 5.31 × 10¹³ sej/$ in 2007 to 2.74 × 10¹³ sej/$ in 2014; EP for Taiyuan remained at the level of approximately 2.42 × 10¹⁷ sej/cap. These results indicate that local economy and residents’ living quality improved significantly with the higher emergy use. But rapid development resulted in more environmental pressure on the local ecosystem and influenced the overall sustainability. The EYR of Taiyuan decreased gradually from 16.15 in 2007 to 7.56 in 2014, the value of ELR increased from 0.24 in 2007 to 0.27 in 2014 and the value of ESI declined from 68.33 in 2007 to 27.80 in 2014. Moreover, the IPAT analysis demonstrates that Taiyuan sticks to the efforts of energy conservation and environmental protection; in order to promote regional sustainable development, it is necessary to take an integrated effort. Useful measures include improving energy and resource efficiency, optimizing energy and resourceful structure and carrying out extensive public participation. Although the case is based upon Taiyuan and the related policy recommendations are proposed specifically for Shanxi province, such policy insights are also valuable for other resource-dependent cities facing similar challenges. The empirical analysis will provide a reference for the accomplishment of the transformation of resource-dependent city in energy consumption in China. In this paper, an innovative method is that emergy analysis and the IPAT model are combined, but we only assess sustainability of a resource-dependent region. In the future, more research would employ an expanded IPAT model and energy analysis to carry out empirical analysis at different scales including the national level, the regional level and the industrial park level to further analyze the quantitative relationship of economic growth and energy consumption.

Acknowledgments

This research was supported by the Charity Special Project of Ministry of Land and Resources of People’s Republic of China (No. 201411007).

Author Contributions

Xueyi Shi and Lulu Qu designed this study; Chang Liu and Ye Yuan retrieved and analyzed the data, Lulu Qu wrote the paper; Xueyi Shi revised the paper. All authors read and approved the final manuscript.

Conflicts of Interest

The authors declare no conflict of interest.

References

  1. United Nations ESCAP; United Nations Environment Programme. Green Growth, Resources and Resilience Environmental Sustainability in Asia and the Pacific; ADB Reports; United Nations ESCAP: Bangkok, Thailand; United Nations Environment Programme: Nairobi, Kenya, 2013. [Google Scholar]
  2. Zheng, J.; Zhang, L.; Che, W. A highly resolved temporal and spatial air pollutant emission inventory for the Pearl River Delta region, China and its uncertainty assessment. Atmos. Environ. 2009, 43, 5112–5122. [Google Scholar] [CrossRef]
  3. Takeshita, T. Assessing the co-benefits of CO2, mitigation on air pollutants emissions from road vehicles. Appl. Energy 2012, 97, 225–237. [Google Scholar] [CrossRef]
  4. Cabaço, S.; Machás, R.; Vieira, V. Impacts of urban wastewater discharge on seagrass meadows (Zostera noltii). Estuar. Coast. Shelf Sci. 2008, 78, 1–13. [Google Scholar] [CrossRef]
  5. Wright I, A.; Mccarthy, B.; Belmer, N.; Price, P. Subsidence from an Underground Coal Mine and Mine Wastewater Discharge Causing Water Pollution and Degradation of Aquatic Ecosystems. Water Air Soil Pollut. 2015, 226, 1–14. [Google Scholar] [CrossRef]
  6. Liu, Z.; Liang, S.; Geng, Y.; Xue, B.; Xi, F.; Pan, Y.; Zhang, T.; Fujita, T. Features, trajectories and driving forces for energy-related GHG emissions from Chinese mega cites: The case of Beijing, Tianjin, Shanghai and Chongqing. Energy 2012, 37, 245–254. [Google Scholar] [CrossRef]
  7. Olabi, A.G. State of the art on renewable and sustainable energy. Energy 2013, 61, 2–5. [Google Scholar] [CrossRef]
  8. Hossaini, N.; Hewage, K. Emergy accounting for regional studies: Case study of Canada and its provinces. J. Environ. Manag. 2013, 118, 177–185. [Google Scholar] [CrossRef] [PubMed]
  9. Geng, Y.; Zhang, P. Measuring China’s Circular Economy. Science 2013, 339, 1526–1527. [Google Scholar] [CrossRef] [PubMed]
  10. Decker, E.H.; Elliott, S.; Smith, F.A.; Blake, D.R.; Rowland, F.S. Energy and material flow through the urban ecosystem. Annu. Rev. Energy Environ. 2000, 25, 685–740. [Google Scholar] [CrossRef]
  11. Papaspyropoulos, K.G.; Karamanolis, D.; Sokos, C.K.; Birtsas, P.K. Enhancing Sustainability in Forestry Using Material Flow Cost Accounting. Open J. For. 2016, 06, 324–336. [Google Scholar]
  12. Pratt, K.; Lenaghan, M.; Mitchard, E.T.A. Material flows accounting for Scotland shows the merits of a circular economy and the folly of territorial carbon reporting. Carbon Balance Manag. 2016, 11. [Google Scholar] [CrossRef] [PubMed]
  13. Steemers, K. Energy and the city: Density, buildings and transport. Energy Build. 2003, 35, 3–14. [Google Scholar] [CrossRef]
  14. Li, S.; Gao, L.; Jin, H. Life cycle energy use and GHG emission assessment of coal-based SNG and power cogeneration technology in China. Energy Convers. Manag. 2016, 112, 91–100. [Google Scholar] [CrossRef]
  15. Nian, V. Analysis of interconnecting energy systems over a synchronized life cycle. Appl. Energy 2016, 165, 1024–1036. [Google Scholar] [CrossRef]
  16. Muñiz, I.; Galindo, A. Urban form and the ecological footprint of commuting. The case of Barcelona. Ecol. Econ. 2005, 55, 499–514. [Google Scholar] [CrossRef]
  17. Mikulčić, H.; Cabezas, H.; Vujanović, M.; Duic, N. Environmental assessment of different cement manufacturing processes based on Emergy and Ecological Footprint analysis. J. Clean. Prod. 2016, 130, 213–221. [Google Scholar] [CrossRef] [Green Version]
  18. Yao, X.; Wang, Z.; Zhang, H. Dynamic Changes of the Ecological Footprint and Its Component Analysis Response to Land Use in Wuhan, China. Sustainability 2016, 8, 329. [Google Scholar] [CrossRef]
  19. Odum, H.T. Environmental accounting: Emergy and environmental decision making. Child Dev. 1996, 42, 1187–1201. [Google Scholar]
  20. Kennedy, C.; Pincetl, S.; Bunje, P. The study of urban metabolism and its applications to urban planning and design. Environ. Pollut. 2010, 159, 1965–1973. [Google Scholar] [CrossRef] [PubMed]
  21. Campbell, E.T.; Brown, M.T. Environmental accounting of natural capital and ecosystem services for the US National Forest System. Environ. Dev. Sustain. 2012, 14, 691–724. [Google Scholar] [CrossRef]
  22. Ascione, M.; Bargigli, S.; Campanella, L.; Ulgiati, S. Exploring an Urban System’s Dependence on the Environment as a Source and a Sink: The City of Rome (Italy) Across Space and Time Scales. Chemsuschem 2011, 4, 613–627. [Google Scholar] [CrossRef] [PubMed]
  23. Chen, W.; Liu, W.; Geng, Y.; Ohnishi, S.; Sun, L.; Han, W.; Tian, X.; Zhong, S. Life cycle based emergy analysis on China’s cement production. J. Clean. Prod. 2016, 131, 272–279. [Google Scholar] [CrossRef]
  24. Odum, H.T.; Odum, E.C.; Blissett, M. Ecology and Economy: “Emergy” Analysis and Public Policy in Texas; University of Texas at Austin: Austin, TX, USA, 2013. [Google Scholar]
  25. Liu, Z.; Geng, Y.; Zhang, P.; Dong, H.; Liu, Z. Emergy-based comparative analysis on industrial clusters: Economic and technological development zone of Shenyang area, China. Environ. Sci. Pollut. Res. 2014, 21, 10243–10253. [Google Scholar] [CrossRef] [PubMed]
  26. Mingquan, W.; Jinda, W.; Jingshuang, L. Emergy Analysis of the Land Use Practices in West Jilin Province, a Typical Area of the Agro-pastoral Transition Zone in Northern China. Prog. Environ. Sci. Technol. 2009, 29, 49–56. [Google Scholar]
  27. Vega-Azamar, R.E.; Glaus, M.; Hausler, R.; Oropeza-García, N.A.; Romero-López, R. An emergy analysis for urban environmental sustainability assessment, the Island of Montreal, Canada. Landsc. Urban Plan. 2013, 118, 18–28. [Google Scholar] [CrossRef]
  28. Zhang, Y.; Yang, Z.; Liu, G.; Yu, X. Emergy analysis of the urban metabolism of Beijing. Ecol. Model. 2011, 222, 2377–2384. [Google Scholar] [CrossRef]
  29. Fan, Y.; Qiao, Q.; Fang, L.; Yao, Y. Emergy analysis on industrial symbiosis of an industrial park—A case study of Hefei economic and technological development area. J. Clean. Prod. 2017, 141, 791–798. [Google Scholar] [CrossRef]
  30. Liu, Z.; Geng, Y.; Ulgiati, S.; Park, H.-S.; Tsuyoshi, F.; Wang, H. Uncovering key factors influencing one industrial park’s sustainability: A combined evaluation method of emergy analysis and index decomposition analysis. J. Clean. Prod. 2015, 114, 141–149. [Google Scholar] [CrossRef]
  31. Ascione, M.; Campanella, L.; Chrerubini, F.; Ulgiati, S. Environmental driving forces of urban growth and development: An emergy-based assessment of the city of Rome, Italy. Landsc. Urban Plan. 2009, 93, 238–249. [Google Scholar] [CrossRef]
  32. Ulgiati, S.; Odum, H.T.; Bastianoni, S. Emergy use, environmental loading and sustainability an emergy analysis of Italy. Ecol. Model. 1994, 73, 215–268. [Google Scholar] [CrossRef]
  33. Liang, S.; Zhang, T. Urban Metabolism in China Achieving Dematerialization and Decarbonization in Suzhou. J. Ind. Ecol. 2011, 15, 420–434. [Google Scholar] [CrossRef]
  34. Xie, H. Environmental sustainability in Chongqing Municipality, China. Int. J. Glob. Warm. 2012, 4, 1–12. [Google Scholar] [CrossRef]
  35. González-Mejía, A.M.; Ma, X. The Emergy Perspective of Sustainable Trends in Puerto Rico from 1960 to 2013. Ecol. Econ. 2017, 133, 11–22. [Google Scholar] [CrossRef]
  36. Yang, D.; Kao, W.T.M.; Zhang, G.; Zhang, N. Evaluating spatiotemporal differences and sustainability of Xiamen urban metabolism using emergy synthesis. Ecol. Model. 2014, 272, 40–48. [Google Scholar] [CrossRef]
  37. Zeng, X.; Yao, J.; Sun, H. Sustainability assessment on eco-economic system of Chengdu City based on emergy analysis. Chin. J. Ecol. 2011, 30, 2875–2880. [Google Scholar]
  38. Pulselli, R.M.; Pulselli, F.M.; Rustici, M. Emergy accounting of the Province of Siena: Towards a thermodynamic geography for regional studies. J. Environ. Manag. 2008, 86, 342–353. [Google Scholar] [CrossRef] [PubMed]
  39. Li, J.L.; Cao, M.M. Evaluation on development level of circular economy of resource-based city with the Emergy Theory: A case of Yulin city. Arid Land Geogr. 2013, 36, 528–535. [Google Scholar]
  40. Sun, Y.F.; Guo, Q.Y. Ecological efficiency analysis of the circular economy system in mining area based on emergy analytic approach. Acta Ecol. Sin. 2014, 34, 710–717. [Google Scholar]
  41. Bian, L.L.; Han, Q.; Zhang, A.H. Emergy-based eco-efficiency evaluation of coal mining area. J. China Coal Soc. 2013, 38, 549–556. [Google Scholar]
  42. Cao, Z.G.; Zhao, Y.Q.; Yuan, F.; Li, C.P. Analysis on Development Degree of Mining Cities of China Based on Emergy Theory. China Pop. Resour. Environ. 2010, 20, 56–61. [Google Scholar]
  43. Guo, C.Z.; Luo, L.L.; Ye, M. Empirical analysis of factors the sustainable development of resource-based cities. China Pop. Resour. Environ. 2014, 24, 81–89. [Google Scholar]
  44. Ding, L.; Shi, Z.L. Economic transition of resource dependent cities-A case study of Taiyuan. J. Tsinghua Univ. 2000, 15, 52–57. [Google Scholar]
  45. Tang, D.L.; Wang, C.C.; Nie, J.S.; Chen, R.J.; Niu, Q.; Kan, H.D.; Chen, B.H.; Perera, F. Health benefits of improving air quality in Taiyuan, China. Environ. Int. 2014, 73, 235–242. [Google Scholar] [CrossRef] [PubMed]
  46. Taiyuan Bureau of Statistics. Taiyuan Bureau of Statistics, Taiyuan Statistics Yearbook, 2007–2015; China Statistics Press: Beijing, China, 2007–2015.
  47. Odum, H.T.; Odum, E.C. A Prosperous Way Down: Principles and Policies; ISAER Org: Wakefield, MA, USA, 2001. [Google Scholar]
  48. Odum, H.T. Environmental Accounting: Energy and Environmental Decision Making; John Wiley and Sons Inc.: New York, NY, USA, 1996. [Google Scholar]
  49. Odum, H.T.; Brown, M.T.; Brandt-Williams, S.B. Handbook of Emergy Evaluation: A Compendium of Data for Emergy Computation Issued in a Series of Folios; Center for Environmental Policy, University of Florida: Gainesville, FL, USA, 2000. [Google Scholar]
  50. Brown, M.T.; Ulgiati, S. Emergy evaluations and environmental loading of electricity production systems. J. Clean. Prod. 2002, 10, 321–334. [Google Scholar] [CrossRef]
  51. Song, T.; Cai, J.M.; Du, S.S.; Ni, P.; Ding, Y. Emergy analysis of urban metabolism in Beijing. J. Arid Land Resour. Environ. 2015, 29, 37–42. [Google Scholar]
  52. Brown, M.T.; Ulgiati, S. Emergy-based indices and ratios to evaluate sustainability: Monitoring economies and technology toward environmentally sound innovation. Ecol. Eng. 1997, 9, 51–69. [Google Scholar] [CrossRef]
  53. Ehrlich, P.R.; Holdren, J.P. Impact of population growth. Philos. Mag. 1970, 171, 1212–1217. [Google Scholar] [CrossRef]
  54. Geng, Y.; Wang, X.; Zhu, Q.; Zhao, H. Regional initiatives on promoting cleaner production in China: A case of Liaoning. J. Clean. Prod. 2010, 18, 1502–1508. [Google Scholar] [CrossRef]
  55. Lund, H. Renewable energy strategies for sustainable development. Energy 2007, 32, 912–919. [Google Scholar] [CrossRef]
  56. Zang, X.; Zhao, T.; Wang, J.; Guo, F. The effects of urbanization and household-related factors on residential direct CO2, emissions in Shanxi, China from 1995 to 2014: A decomposition analysis. Atmos. Pollut. Res. 2016. [Google Scholar] [CrossRef]
  57. Liu, Y.; Li, J.; Zhang, H. An ecosystem service valuation of land use change in Taiyuan City, China. Ecol. Model. 2012, 225, 127–132. [Google Scholar] [CrossRef]
Figure 1. A sketch map showing the geographical location of Taiyuan.
Sustainability 09 00153 g001
Figure 2. Total emergy use per year and its components for Taiyuan.
Sustainability 09 00153 g002
Figure 3. Trends of emergy money ratio (EMR) and emergy per capita (EP) for Taiyuan.
Sustainability 09 00153 g003
Figure 4. Trends of emergy yield ratio (EYR), the environmental loading ratio (ELR) and emergy sustainable index (ESI) for Taiyuan.
Sustainability 09 00153 g004
Figure 5. Change in the values of GT.
Sustainability 09 00153 g005
Table 1. Emergy flows and corresponding transformity.
FlowsItemUnitTransformity (sej/Unit)Reference
Renewable resource emergy (R)Solar energyJ1[48]
Wind EnergyJ2.45 × 103[49]
Rainfall energy (chemical)J3.05 × 104[49]
Rainfall energy (geo-potential)J4.70 × 104[49]
Earth cycle energyJ5.80 × 104[49]
Agricultural productsg4.08 × 1011[48]
Livestockg2.50 × 1011[48]
Aquatic productsg3.02 × 1010[48]
Non-renewable resource emergy (N)Losses of topsoilt1.71 × 103[49]
ElectricityJ2.69 × 105[48]
Steelg3.02 × 109[48]
Raw coalJ6.72 × 104[48]
PetroleumJ1.86 × 105[48]
DieselJ1.86 × 105[48]
Natural gasJ8.06 × 104[48]
Fuel oilJ6.25 × 104[49]
Chemical fertilizert8.28 × 106[50]
Imported emergy (IM)Goods income$9.37 × 10¹²[49]
Tourism income$1.66 × 10¹²[50]
Exported emergy (EX)Goods and service income$6.34 × 10¹²[49]
Note: Unit Emergy Values are relative to the 15.83 × 1024 sej/year planetary baseline value, RMB is transformed into US$ using the annual exchange rate from 2007 to 2014.
Table 2. Emergy-based indicator system for the regional sustainability.
Emergy IndicatorsUnitFormulaExplanation
Total emergy per year (U)SejR + N + IMTotal emergy (the export is not included)
Emergy money ratio (EMR)sej/yuanU/GDPEmergy flux produced per unit of purchasing power
Emergy per capita (EP)sej/capU/PopulationThe ratio can reflect the true life quality of local citizens
Environmental loading ratio (ELR)1(N + IM)/RThe ration can reflect the pressure of economic activities on the local ecosystem
Emergy yield ratio (EYR)1(R + N + IM)/IMThe capacity of resource output of the local system
Emergy sustainable index (ESI)1EYR/ELRThe sustainability capacity of the local system
Note: The total emergy U = R + N + IM.

