
Extreme Weather Impacts on Maize Yield: The Case of Shanxi Province in China †


Abstract
:1. Introduction
2. Material and Methods
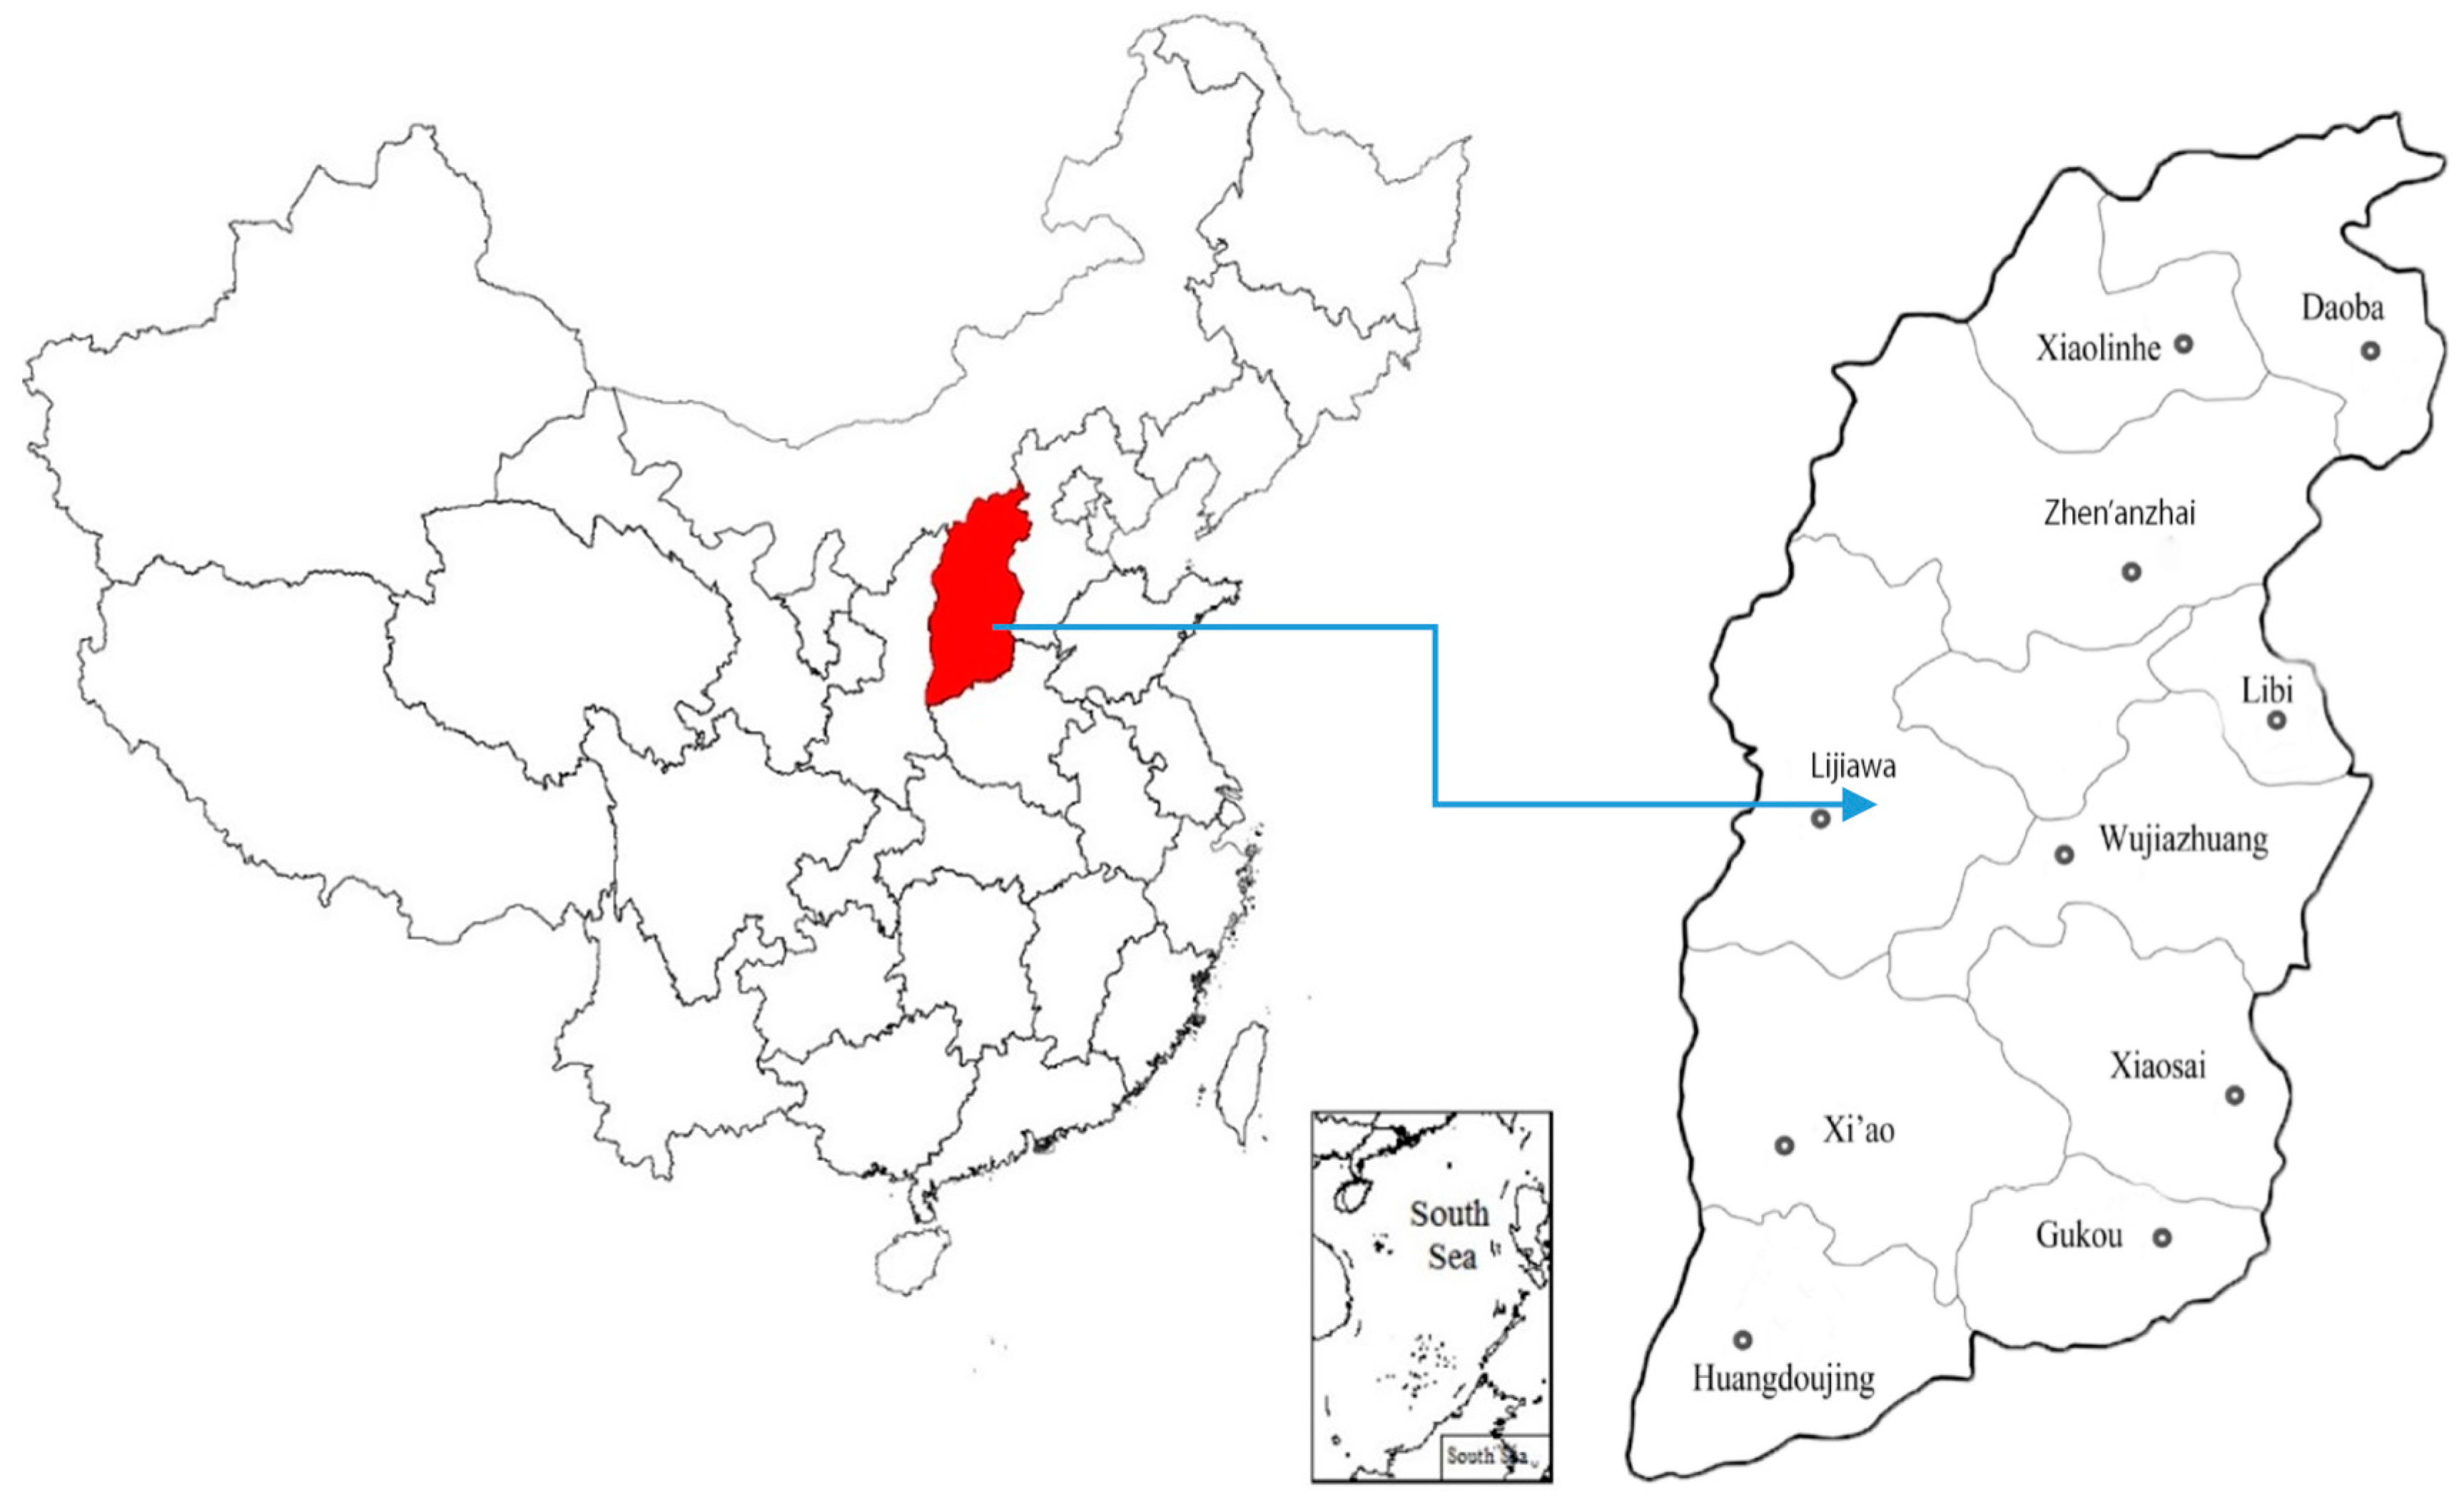
2.1. Study Regions
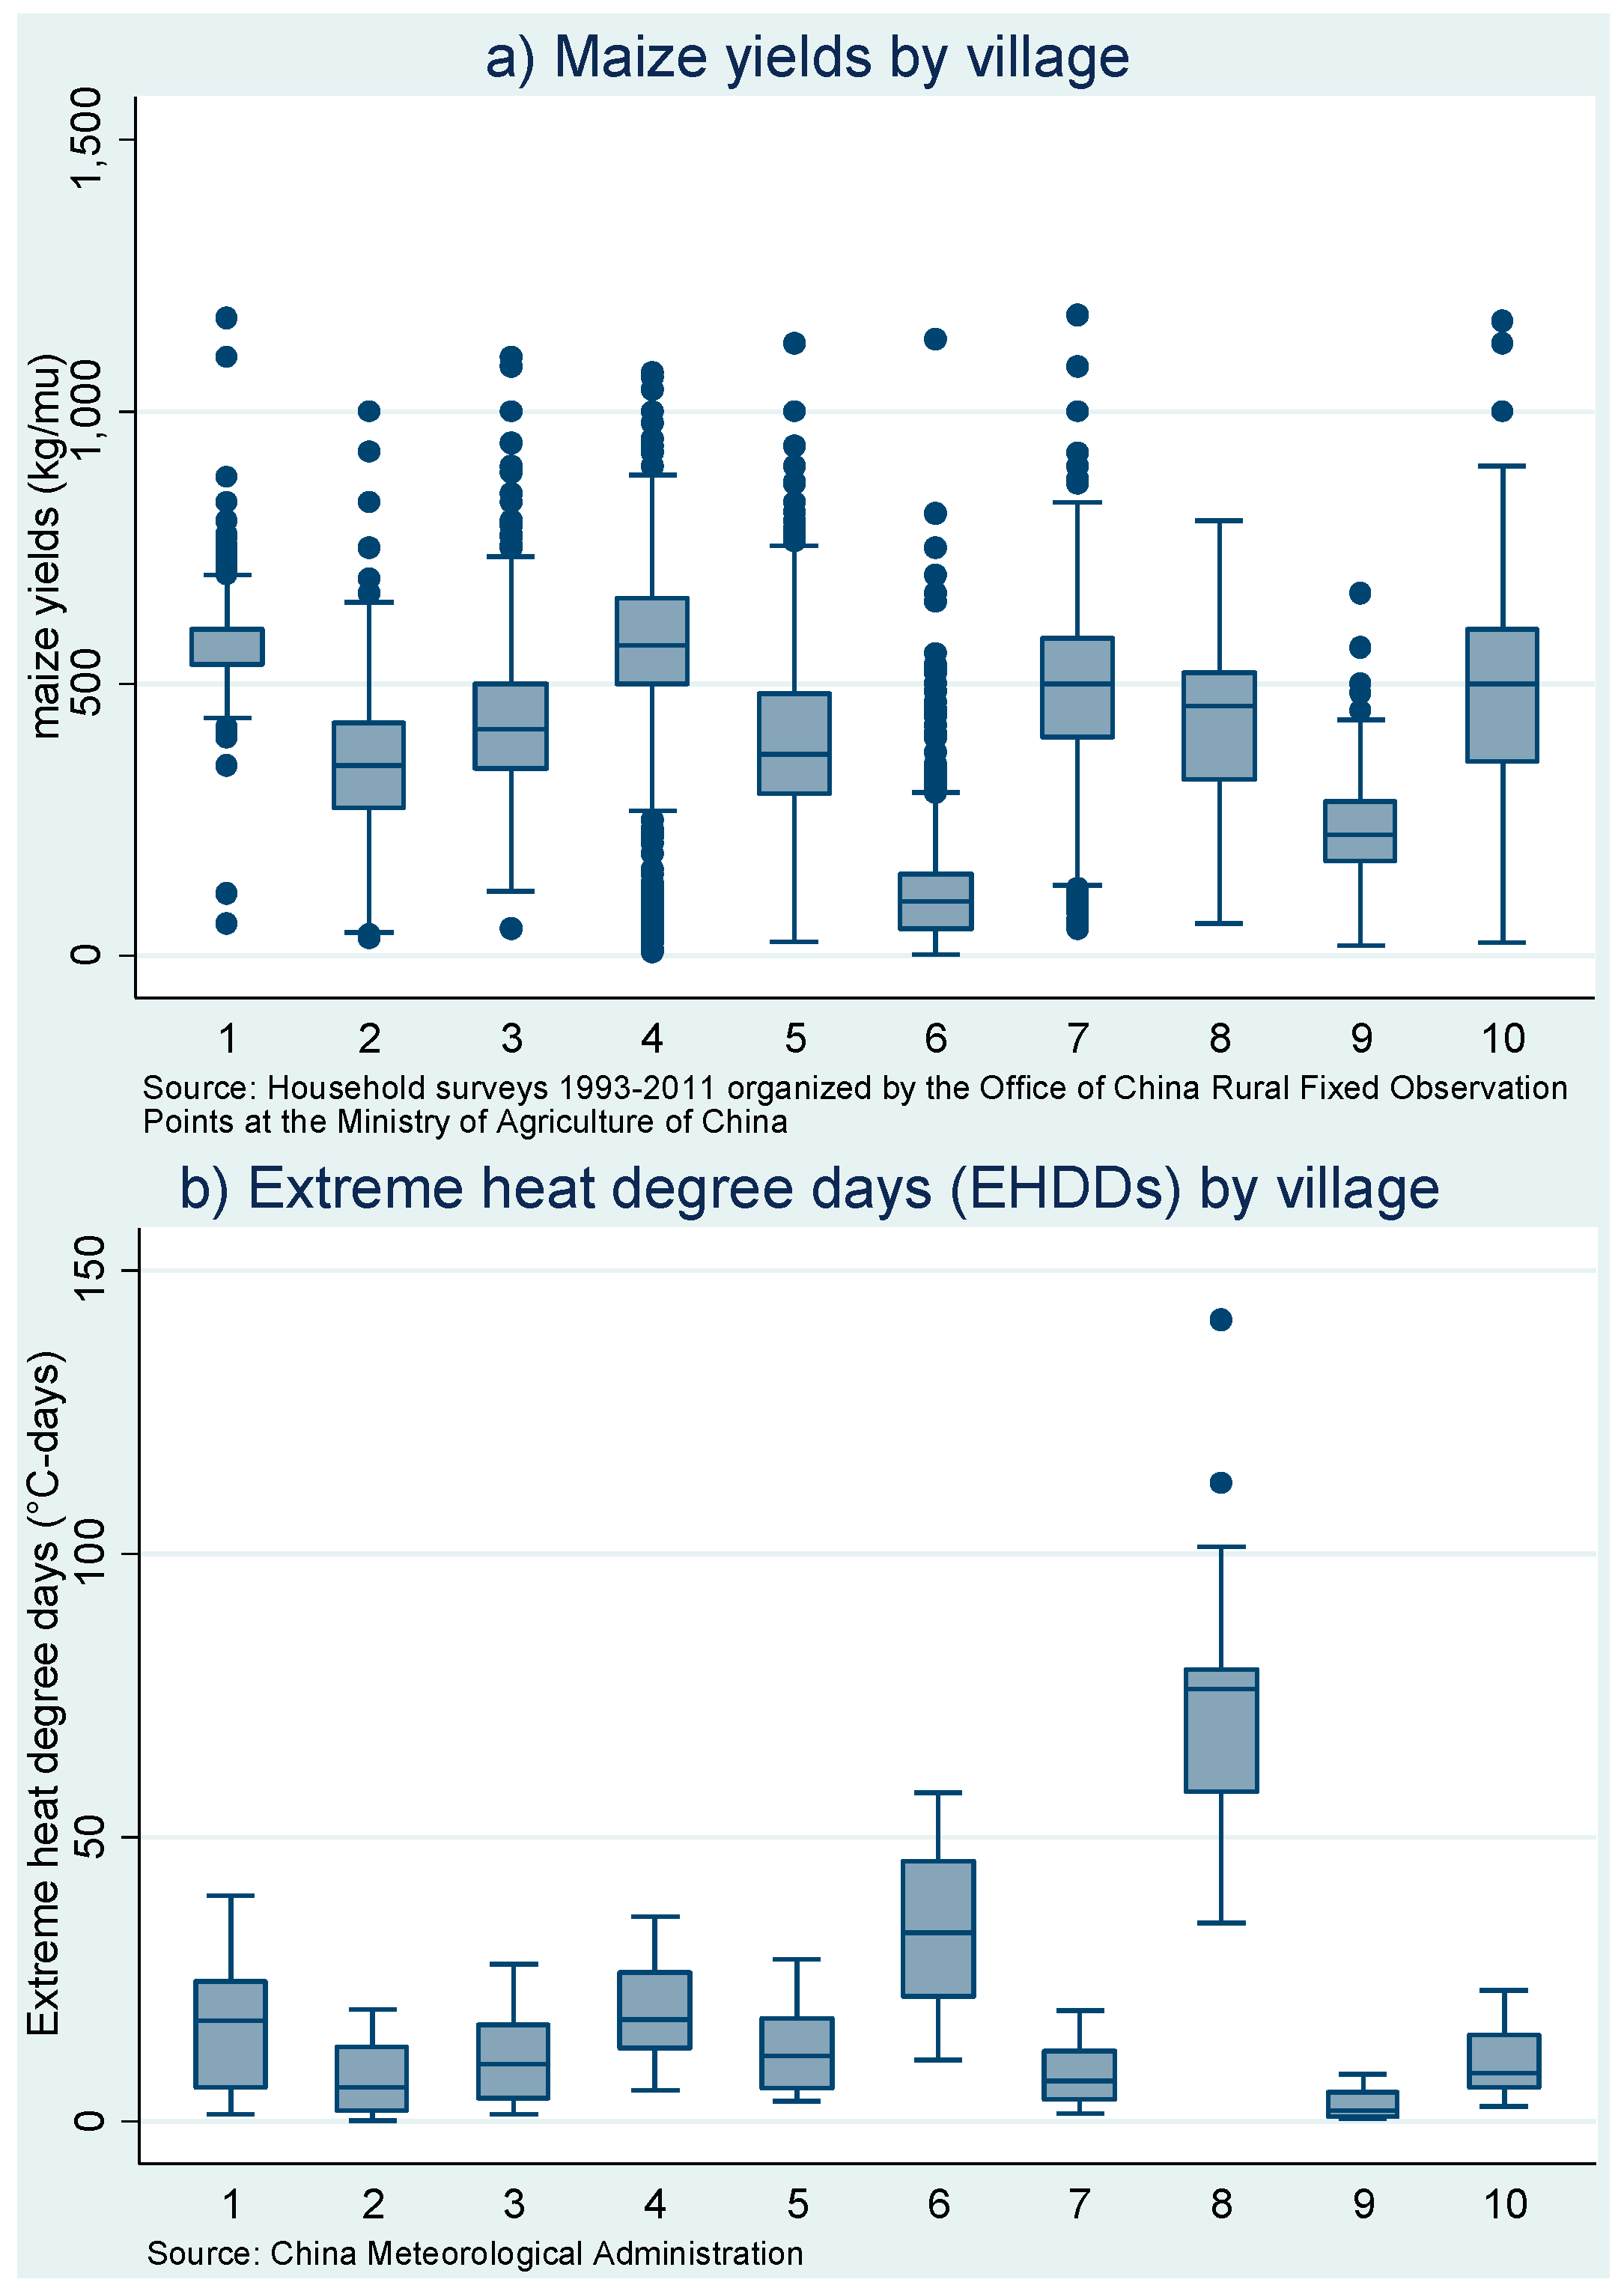
2.2. Data
2.3. Statistical Methods
3. Results and Discussion
3.1. Estimated Parameters
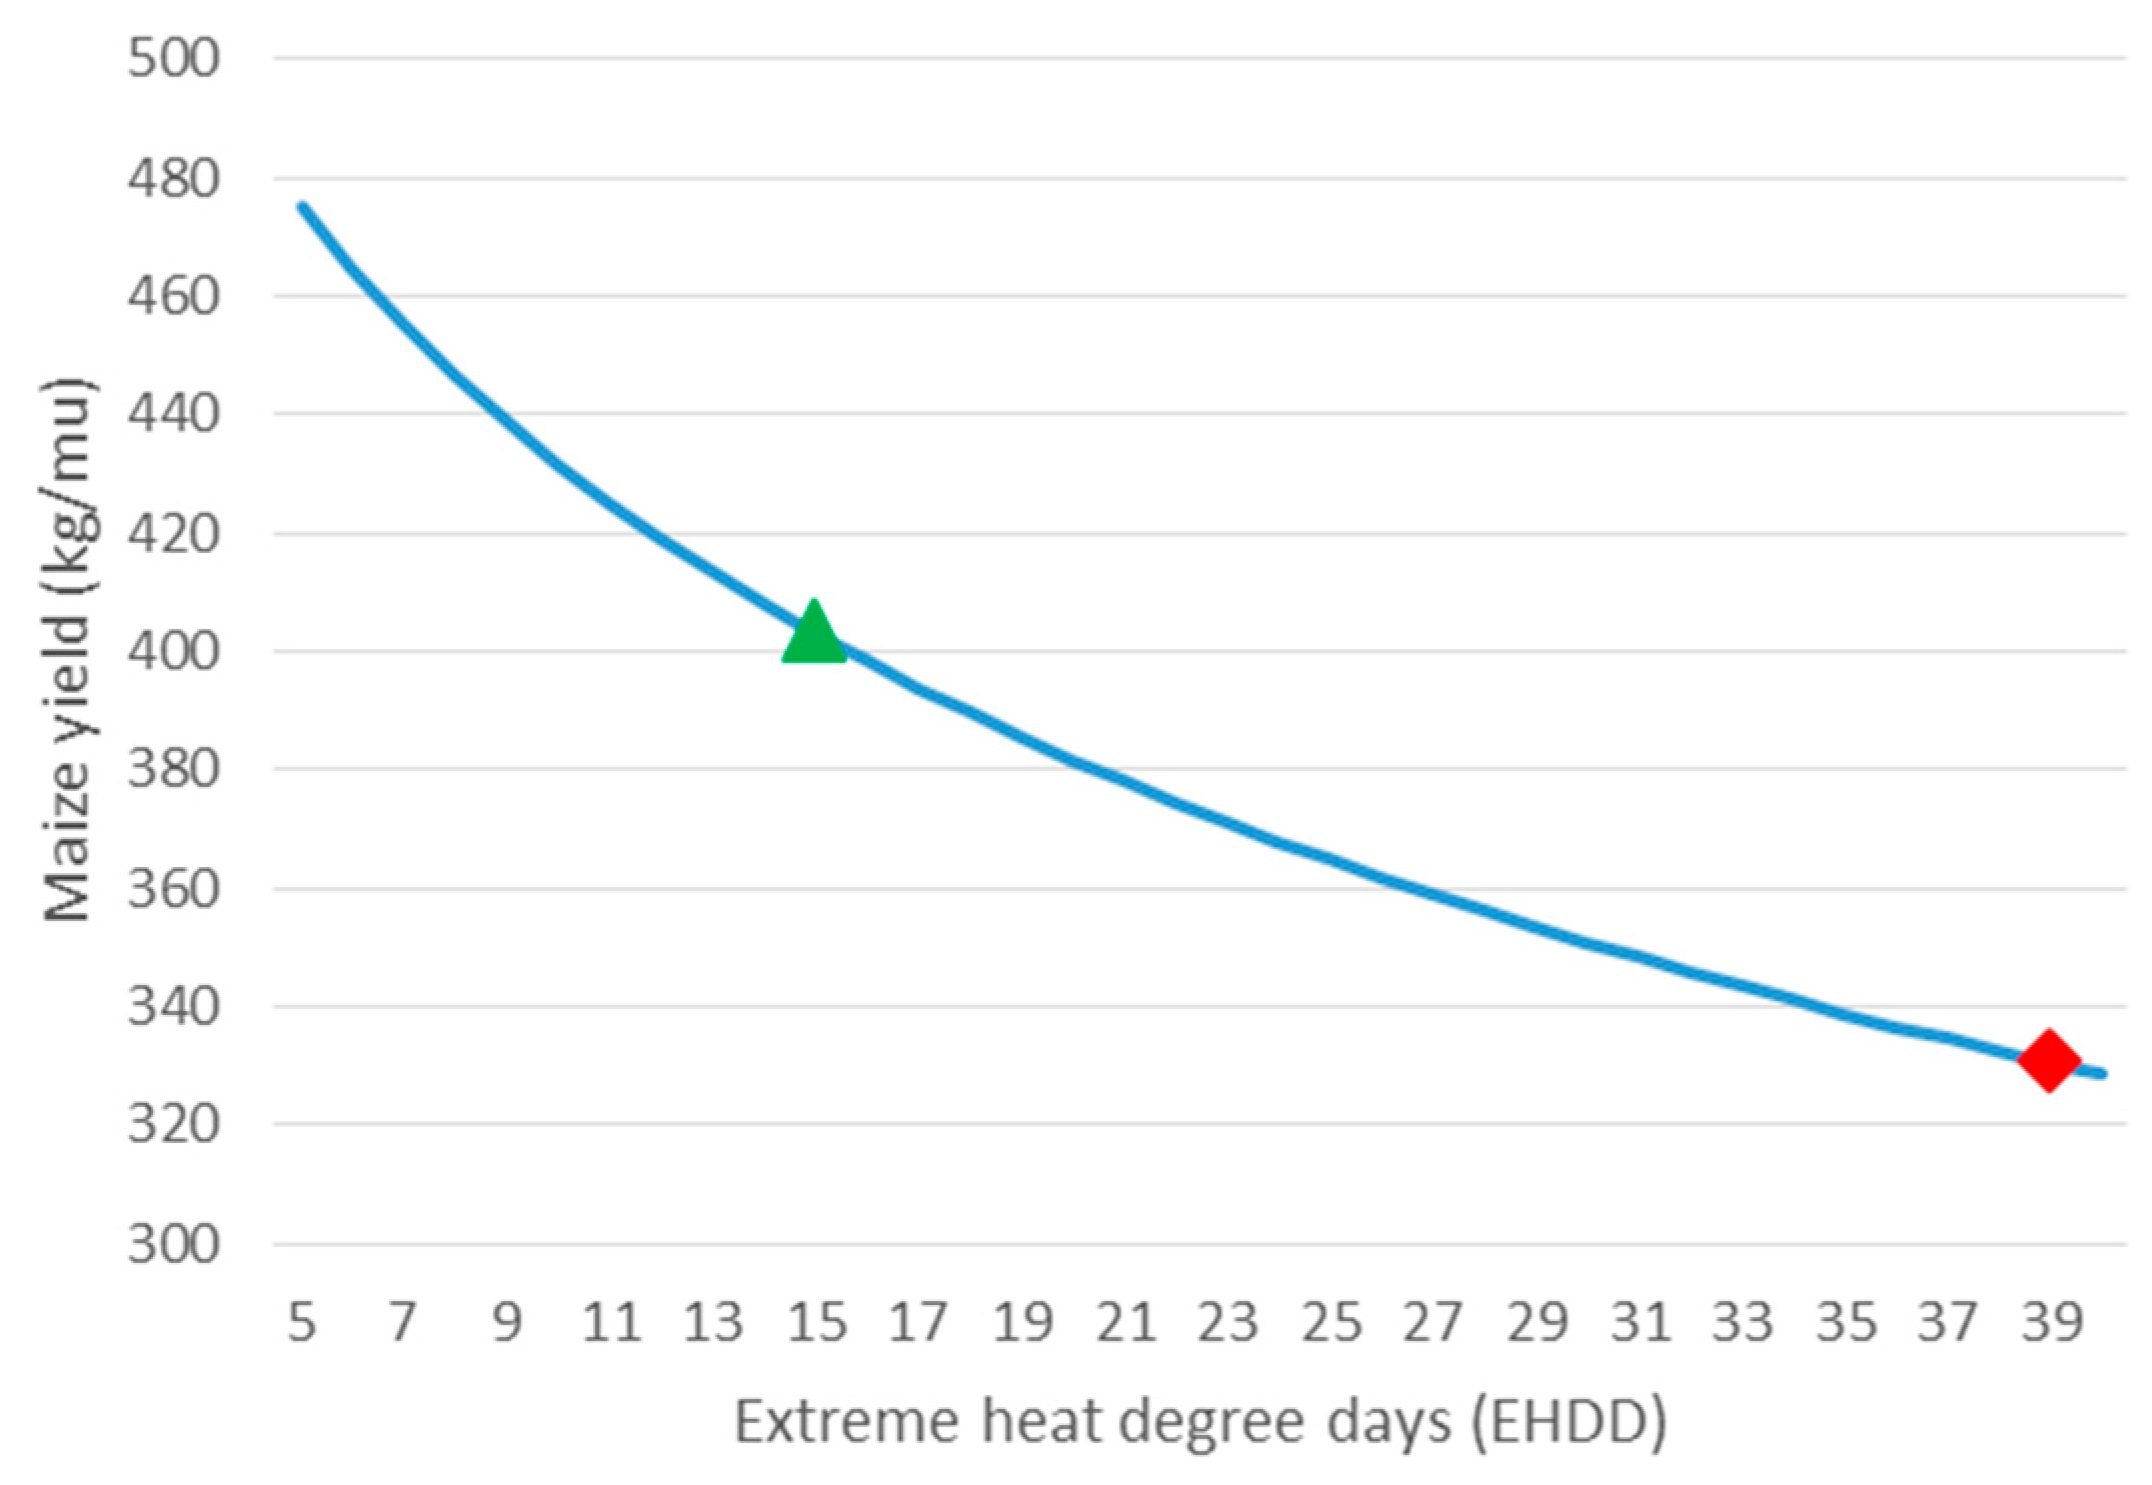
3.2. Impact When Temperature Increases
3.2.1. Heat Waves and Extreme Cold Days
3.2.2. Consecutive Dry Days
3.2.3. Total Impact with a 2 °C Increase in Temperature
3.3. Why Not GDD?
3.4. Household-Specific Fixed Effect
3.5. Sensitivity Analysis
4. Conclusions
Acknowledgments
Author Contributions
Conflicts of Interest
References
- Hartmann, D.L.; Klein Tank, A.M.G.; Rusticucci, M.; Alexander, L.V.; Brönnimann, S.; Charabi, Y.; Dentener, F.J.; Dlugokencky, E.J.; Easterling, D.R.; Kaplan, A.; et al. Observations: Atmosphere and Surface. In Climate Change 2013: The Physical Science Basis; Contribution of Working Group I to the Fifth Assessment Report of the Intergovernmental Panel on Climate Change; Stocker, T.F., Qin, D., Plattner, G.-K., Tignor, M., Allen, S.K., Boschung, J., Nauels, A., Xia, Y., Bex, V., Midgley, P.M., Eds.; Cambridge University Press: Cambridge, UK; New York, NY, USA, 2013; pp. 159–254. [Google Scholar]
- Porter, J.R.; Xie, L.; Challinor, A.J.; Cochrane, K.; Howden, S.M.; Iqbal, M.M.; Lobell, D.B.; Travasso, M.I. Food security and food production systems. In Climate Change 2014: Impacts, Adaptation, and Vulnerability Part A: Global and Sectoral Aspects; Contribution of Working Group II to the Fifth Assessment Report of the Intergovernmental Panel of Climate Change; Field, C.B., Barros, V.R., Dokken, D.J., Mach, K.J., Mastrandrea, M.D., Bilir, T.E., Chatterjee, M., Ebi, K.L., Estrada, Y.O., Genova, R.C., et al., Eds.; Cambridge University Press: Cambridge, UK; New York, NY, USA, 2014; pp. 485–533. [Google Scholar]
- Lobell, D.B.; Hammer, G.L.; McLean, G.; Messina, C.; Roberts, M.J.; Schlenker, W. The critical role of extreme heat for maize production in the United States. Nat. Clim. Chang. 2013, 3, 497–501. [Google Scholar] [CrossRef]
- Lobell, D.B.; Sibley, A.; Ivan Ortiz-Monasterio, J. Extreme heat effects on wheat senescence in India. Nat. Clim. Chang. 2012, 2, 186–189. [Google Scholar] [CrossRef]
- Zhang, T.; Lin, X.; Sassenrath, G.F. Current irrigation practices in the central United States reduce drought and extreme heat impacts for maize and soybean, but not for wheat. Sci. Total Environ. 2015, 508, 331–342. [Google Scholar] [CrossRef] [PubMed]
- Hawkins, E.; Fricker, T.E.; Challinor, A.J.; Ferro, C.A.T.; Ho, C.K.; Osborne, T.M. Increasing influence of heat stress on French maize yields from the 1960s to the 2030s. Glob. Chang. Biol. 2013, 19, 937–947. [Google Scholar] [CrossRef] [PubMed]
- You, L.; Rosegrant, M.W.; Wood, S.; Sun, D. Impact of growing season temperature on wheat productivity in China. Agric. For. Meteorol. 2009, 149, 1009–1014. [Google Scholar] [CrossRef]
- Wei, T.; Cherry, T.L.; Glomrød, S.; Zhang, T. Climate change impacts on crop yield: Evidence from China. Sci. Total Environ. 2014, 499, 133–140. [Google Scholar] [CrossRef] [PubMed]
- Schlenker, W.; Roberts, M.J. Nonlinear temperature effects indicate severe damages to U.S. crop yields under climate change. Proc. Natl. Acad. Sci. USA 2009, 106, 15594–15598. [Google Scholar] [CrossRef] [PubMed]
- Lobell, D.B.; Banziger, M.; Magorokosho, C.; Vivek, B. Nonlinear heat effects on African maize as evidenced by historical yield trials. Nat. Clim. Chang. 2011, 1, 42–45. [Google Scholar] [CrossRef]
- Intergovernmental Panel on Climate Change (IPCC). Climate Change 2013: The Physical Science Basis; Contribution of Working Group I to the Fifth Assessment Report of the Intergovernmental Panel on Climate Change; Cambridge University Press: Cambridge, UK; New York, NY, USA, 2013; p. 1535. [Google Scholar]
- Zhang, T.; Huang, Y. Impacts of climate change and inter-annual variability on cereal crops in China from 1980 to 2008. J. Sci. Food Agric. 2012, 92, 1643–1652. [Google Scholar] [CrossRef] [PubMed]
- Wei, T.; Glomsrød, S.; Zhang, T. Extreme weather, food security and the capacity to adapt—The case of crops in China. Food Secur. 2015. [Google Scholar] [CrossRef]
- National Burearu of Statistics of China. China Statistical Yearbook 2014; China Statistics Press: Beijing, China, 2014.
- Shanxi Statistical Bureau. Statistical Communiqué of Shanxi Province on the 2015 National Economic and Social Development. Available online: http://www.stats-sx.gov.cn/tjsj/tjgb/ndgb/201603/t20160302_39250.shtml. (accessed on 6 October 2016). (In Chinese)
- Guobin, L. Soil Conservation and Sustainable Agriculture on the Loess Plateau: Challenges and Prospects. Ambio 1999, 28, 663–668. [Google Scholar]
- Wang, L.; Shao, M.; Wang, Q.; Gale, W.J. Historical changes in the environment of the Chinese Loess Plateau. Environ. Sci. Policy 2006, 9, 675–684. [Google Scholar] [CrossRef]
- Fu, B.; Chen, L. Agricultural landscape spatial pattern analysis in the semi-arid hill area of the Loess Plateau, China. J. Arid Environ. 2000, 44, 291–303. [Google Scholar] [CrossRef]
- Kang, S.; Zhang, L.; Liang, Y.; Hu, X.; Cai, H.; Gu, B. Effects of limited irrigation on yield and water use efficiency of winter wheat in the Loess Plateau of China. Agric. Water Manag. 2002, 55, 203–216. [Google Scholar] [CrossRef]
- Thornton, P.E.; Running, S.W.; White, M.A. Generating surfaces of daily meteorological variables over large regions of complex terrain. J. Hydrol. 1997, 190, 214–251. [Google Scholar] [CrossRef]
- Zhang, T.; Huang, Y.; Yang, X. Climate warming over the past three decades has shortened rice growth duration in China and cultivar shifts have further accelerated the process for late rice. Glob. Chang. Biol. 2013, 19, 563–570. [Google Scholar] [CrossRef] [PubMed]
- Matthews, R.B.; Hunt, L.A. GUMCAS: A model describing the growth of cassava (Manihot esculenta L. Crantz). Field Crops Res. 1994, 36, 69–84. [Google Scholar] [CrossRef]
- Deryng, D.; Sacks, W.J.; Barford, C.C.; Ramankutty, N. Simulating the effects of climate and agricultural management practices on global crop yield. Glob. Biogeochem. Cycles 2011. [Google Scholar] [CrossRef]
- Roberts, M.J.; Schlenker, W. The Evolution of Heat Tolerance of Corn: Implications for Climate Change. In The Economics of Climate Change: Adaptations Past and Present; University of Chicago Press: Chicago, IL, USA, 2011; pp. 225–251. [Google Scholar]
- Hausman, J.A. Specification Tests in Econometrics. Econometrica 1978, 46, 1251–1271. [Google Scholar] [CrossRef]
- Stavis, B. Market Reforms and Changes in Crop Productivity: Insights from China. Pac. Aff. 1991, 64, 373–383. [Google Scholar] [CrossRef]
- Knutti, R.; Sedlacek, J. Robustness and uncertainties in the new CMIP5 climate model projections. Nat. Clim. Chang. 2013, 3, 369–373. [Google Scholar] [CrossRef]


| Variable | Definition | Sample Size | Mean | Std. Dev. | Min | Max |
|---|---|---|---|---|---|---|
| Y | Maize yield of a household (kg/mu) | 12,354 | 404.3 | 188.2 | 2.5 | 1176.5 |
| LAND | Sown land for maize of a household (mu, i.e., 1/15 ha) | 12,354 | 4.1 | 5.7 | 0.1 | 480.0 |
| Degree days (DD) from May to September (°C-days) | ||||||
| EHDD | Extreme heat degree days | 12,354 | 14.8 | 14.7 | 0.1 | 141.1 |
| MDD | Moderate degree days | 12,354 | 1620.4 | 82.2 | 1326.2 | 1788.4 |
| ECDD | Extreme cold degree days | 12,354 | −6.4 | 7.9 | −49.1 | 0.0 |
| COLD | Dummy of extreme cold days | 12,354 | 0.9836 | 0.1271 | 0 | 1 |
| GDD | Growing degree days | 12,354 | 1789.7 | 158.6 | 1331.5 | 2406.4 |
| Precipitation variables from May to September | ||||||
| DRY | Consecutive dry days, i.e., the maximum number of consecutive days when daily precipitation is less than one millimeter (days) | 12,354 | 17.0 | 5.2 | 8.0 | 45.0 |
| PRCP | Total precipitation (mm) | 12,354 | 383.8 | 90.4 | 175.7 | 626.3 |
| Model 1 | Model 2 | Model 3 | |
|---|---|---|---|
| EHDD | −0.0688 *** | −0.0271 * | −0.0266 * |
| (0.00858) | (0.0128) | (0.0128) | |
| EHDD squared | −0.0284 *** | −0.0286 *** | |
| (0.00337) | (0.00338) | ||
| MDD | 1.841 *** | 65.94 ** | 66.04 ** |
| (0.204) | (21.68) | (21.68) | |
| MDD squared | −4.457 ** | −4.466 ** | |
| (1.472) | (1.472) | ||
| COLD | −0.320 *** | −0.299 *** | −0.297 *** |
| (0.0711) | (0.0712) | (0.0712) | |
| DRY | −0.103 *** | 0.544 * | 0.546 * |
| (0.0206) | (0.222) | (0.222) | |
| DRY squared | −0.108 ** | −0.108 ** | |
| (0.0388) | (0.0388) | ||
| PRCP | 0.311 *** | 3.724 *** | 3.707 *** |
| (0.0372) | (0.938) | (0.938) | |
| PRCP squared | −0.299 *** | −0.297 *** | |
| (0.0791) | (0.0791) | ||
| LAND | −0.0498 *** | −0.0552 *** | −0.0666 *** |
| (0.00612) | (0.00614) | (0.0107) | |
| LAND squared | 0.00555 | ||
| (0.00425) | |||
| Constant | −8.154 *** | −249.2 ** | −249.4 ** |
| (1.563) | (80.41) | (80.41) | |
| Fixed village effects | Yes | Yes | Yes |
| Fixed time effects | Yes | Yes | Yes |
| Observations | 12354 | 12354 | 12354 |
| R2 | 0.597 | 0.602 | 0.602 |
| Adjusted R2 | 0.596 | 0.601 | 0.601 |
| NRMSE | 0.438 | 0.435 | 0.435 |
| Model 1 | Model 2 | |
|---|---|---|
| EHDD | −0.0688 | −0.180 |
| MDD | 1.841 | 0.0617 |
| DRY | −0.103 | −0.068 |
| PRCP | 0.311 | 0.166 |
© 2016 by the authors; licensee MDPI, Basel, Switzerland. This article is an open access article distributed under the terms and conditions of the Creative Commons Attribution (CC-BY) license (http://creativecommons.org/licenses/by/4.0/).
Share and Cite
Wei, T.; Zhang, T.; De Bruin, K.; Glomrød, S.; Shi, Q. Extreme Weather Impacts on Maize Yield: The Case of Shanxi Province in China. Sustainability 2017, 9, 41. https://doi.org/10.3390/su9010041
Wei T, Zhang T, De Bruin K, Glomrød S, Shi Q. Extreme Weather Impacts on Maize Yield: The Case of Shanxi Province in China. Sustainability. 2017; 9(1):41. https://doi.org/10.3390/su9010041
Chicago/Turabian StyleWei, Taoyuan, Tianyi Zhang, Karianne De Bruin, Solveig Glomrød, and Qinghua Shi. 2017. "Extreme Weather Impacts on Maize Yield: The Case of Shanxi Province in China" Sustainability 9, no. 1: 41. https://doi.org/10.3390/su9010041