Article

Where Land Use Changes Occur: Using Soil Features to Understand the Economic Trends in Agricultural Lands

1
Dipartimento di Bioscienze e Territorio, Università degli Studi del Molise, Pesche (IS) 86090, Italy
2
Research Centre for Inner Areas and Apennines (ArIA), Dipartimento di Bioscienze e Territorio, Università degli Studi del Molise, Pesche (IS) 86090, Italy
3
Agronomist, Rome 00134, Italy
*
Author to whom correspondence should be addressed.
Sustainability 2017, 9(1), 78; https://doi.org/10.3390/su9010078
Submission received: 5 November 2016 / Revised: 28 December 2016 / Accepted: 3 January 2017 / Published: 9 January 2017

Abstract

:
This study investigates the major land use change processes over the 1990–2008 period in Abruzzo region (Central Italy) in relation to the characteristics of the soils and with particular regard to their capability for agricultural purposes, in order to highlight their implications on agricultural productivity. The relative changes in the agricultural incomes and land values were also estimated. To this end, we proposed an inventory approach as a flexible and feasible way for monitoring land use changes at multiple scales. As main outcomes, the shrinkage of agricultural lands and their internal changes (intensification vs. extensification processes) were highlighted. The shrinkage of agricultural lands was strictly related to: (a) reforestation process in mountain areas and less productive lands after land abandonment; and (b) urbanization on plains and more productive lands. Although the intensification process was demonstrated to have a positive effect on the overall regional agricultural incomes, especially on high quality soils, this was not adequate to compensate the economic loss due to the other land use changes, especially in marginal areas and low-to-medium quality soils. Finally, the paper discusses the geographical pattern of land use change processes across the region, including their interrelations and combined effects, and ultimately offers recommendations to decision-makers addressing future sustainable development objectives from local to global scale.

1. Introduction

Land Use Change (LUC) is one of the most relevant human-induced transformations of the Earth, and strongly affects the ecological processes, undermines the biodiversity conservation and services provision, and influences the soil quality [1,2,3]. As also suggested by the Global soil partnership [4] and the European Union (EU) Thematic Strategy for Soil Protection (COM (2006) 231 [5]), the analysis of the most relevant LUC processes, particularly causing degradation (e.g., erosion, organic matter decline, and soil biodiversity loss), and having negative effects on soil capability [6], has a key role in orienting the future policies (e.g., towards food security [7]). According to the duration of the effects on human wellbeing, LUC processes may be distinguished into transient or irreversible ones, over medium or long periods (e.g., urbanization [8]). For example, the urban expansion originates several long-term environmental impacts, such as the reduction of croplands for food production [7], the biodiversity loss [9], and the ecosystem services degradation [10,11]. The prediction and monitoring of such dynamics, and of the associated implications, is often problematic for decision-makers, land managers, and other stakeholders at various scales [12]. This aspect is emphasized by the fact that LUC phenomena are extremely variable depending on the location, and according to peculiar barriers and drivers [13]. For example, in Italy, several studies have demonstrated that the increase of both forest lands [14,15], and artificial surfaces [16] is strictly dependent on land abandonment, especially in hilly and mountain areas, and, more specifically, on the reduction of croplands and pastures [17]. In particular, the urban growth is more relevant near the coastline [18] than in the uplands (e.g., National Parks’ areas [19]), while the forest re-growth is more remarkable in hilly and mountain areas [20,21], and especially in Central and Southern Italy [15]. These phenomena are particularly relevant in the Mediterranean region, because the traditional human activities (e.g., silviculture, agriculture and livestock) shaped the landscape and had a great influence on many ecological aspects, such as e.g., biodiversity [22]. Because of its irreversibility, the most critical LUC in Italy is represented by the urban growth. Urban growth has a high impact in both environmental and economic terms [11,23] and it is mostly due to the systematic lack or the obsolescence of town planning [18,24], which usually neglect concepts related to the land use efficiency and the sustainable land management [25]. Similarly, land abandonment is strictly connected to agriculture globalization and demographic trends and the following rewilding processes represent a critical issue, being at the same time a new challenge and opportunity in terms of land use policy and planning [26]). On the one hand, the natural revegetation represents a positive opportunity in terms of mitigation strategies, due to the enhancement of potential carbon sinks [27]. On the other hand, the depopulation of rural areas and the abandonment of agro-pastoral practices have several potential negative impacts from environmental, economic and social perspectives [21,28]. In land use planning, the choice between rewilding and active management should depend on the goals and the local context. In fact, it depends on the economic sustainability of the management practice and on the targets locally set in policy and planning according to the specific needs of the territory [29].
Accordingly, the choice of the geographical, ecological or administrative context in which the LUC is analyzed, should be related to the aim of the survey, the phenomena we are interested in, and the typology of policy or planning the data would support (in terms of both spatial scale and field of application) [30]. For this reason, a deeper understanding and characterization of the localized geographic LUC patterns, and of their possible effects on goods and services delivered is crucial for sustainable land management [6,31]. In fact, there is an increasing need of multi-objective and multi-scale approaches, which are demonstrated to provide accurate LUC estimates, while containing the costs of realization and updating [32]. Even though the large-scale LUC assessment is suitable to describe the general trends and support the relative strategies, it obscures crucial variations occurring at lower scale [33], and influencing the local ecologic and social-economic aspects. With regards to the small-scale LUC phenomena, two conditions should also be considered: (i) they have cumulative impacts affecting the global change [34]; and (ii) they represent the spatial context at which the regional and sub-regional scales policies are effectively implemented. At local scale, the LUC processes have additional effects on soil properties (e.g., soil organic carbon in the tropics [35]), ecological assets (e.g., local biodiversity [36]), and social-economic sustainability (e.g., changes in agricultural productivity [37]).
Although most of the available analyses on LUC dynamics refers to different administrative (municipality, region, Country [38]), and ecological boundaries (e.g., Ecoregions [30,39]; for the altitude, see, e.g., [40]), few studies have addressed so far the combination between LUC, soil properties and land capability [41,42]. In addition, during the last decade, there has been a growing need to provide land managers with more integrated approaches to consider the trade-offs among ecosystem services, and other social-economic aspects [43], and more recently the soil [44]. Soil indeed provides multiple functions such as food production, water and nutrients cycles regulation, and carbon sink. This multi-functionality is strictly related to the concept of soil quality, which is defined to as “the capacity of a soil to function, within ecosystem and land use boundaries, to sustain productivity, maintain environmental quality, and promote plant and animal health” [45]. More specifically, a portion of territory may be analyzed according to on the one hand, the morphological and pedoclimatic features (i.e., soil regions, [46]), and on the other hand, the related suitability for agricultural production [47,48]. The latter is often specifically used for the assessment of potential food provisioning [49]. In this way, the combination of soil characteristics and the location where LUC processes occur is particularly useful to understand e.g., where intensification (i.e., agriculture intensification and urbanization) and extensification (i.e., land abandonment and forest re-growth) phenomena coexist and affect the landscape integrity, the hydrogeological risk, and the plant and animal biodiversity [50,51,52]. More deeply, the changes of agricultural lands in a certain territory can directly affect its current and future sustainability by altering its potential capability to provide incomes for local communities [6]. A whole understanding of such LUC-soil combination is very important in Europe, especially to limit the loss of croplands, as well as the decreasing of the landscape capability to generate revenues for local communities in the next future, especially in mountain areas (“decline circle” [26,53]). At the same time, a further understanding of the relationship between LUC and soil can limit the loss of production in other areas of the globe (e.g., “indirect LUC” [54]), thus avoiding serious ecological, social and political consequences [55]. Finally, the linkages between soil and land management should be further analyzed in the next future [56,57]. This paper mainly aims at assessing LUC occurred during the 1990–2008 period at regional scale in the Abruzzo region, Central Italy, with particular regard to the soil properties, in terms of both pedological characteristics and land capability, and, as a consequence, their implications in terms of agricultural revenues and related land values. In the first section, LUC is analyzed through an inventory approach for the whole Abruzzo region over the 1990–2008 period, according to the soil regions and the land capability classes. Then, the effect of LUC processes on the average incomes from agricultural lands is evaluated, also with regards to soil characteristics and land capability. Finally, the major management implications of combining LUC and soil properties are outlined.

2. Materials and Methods
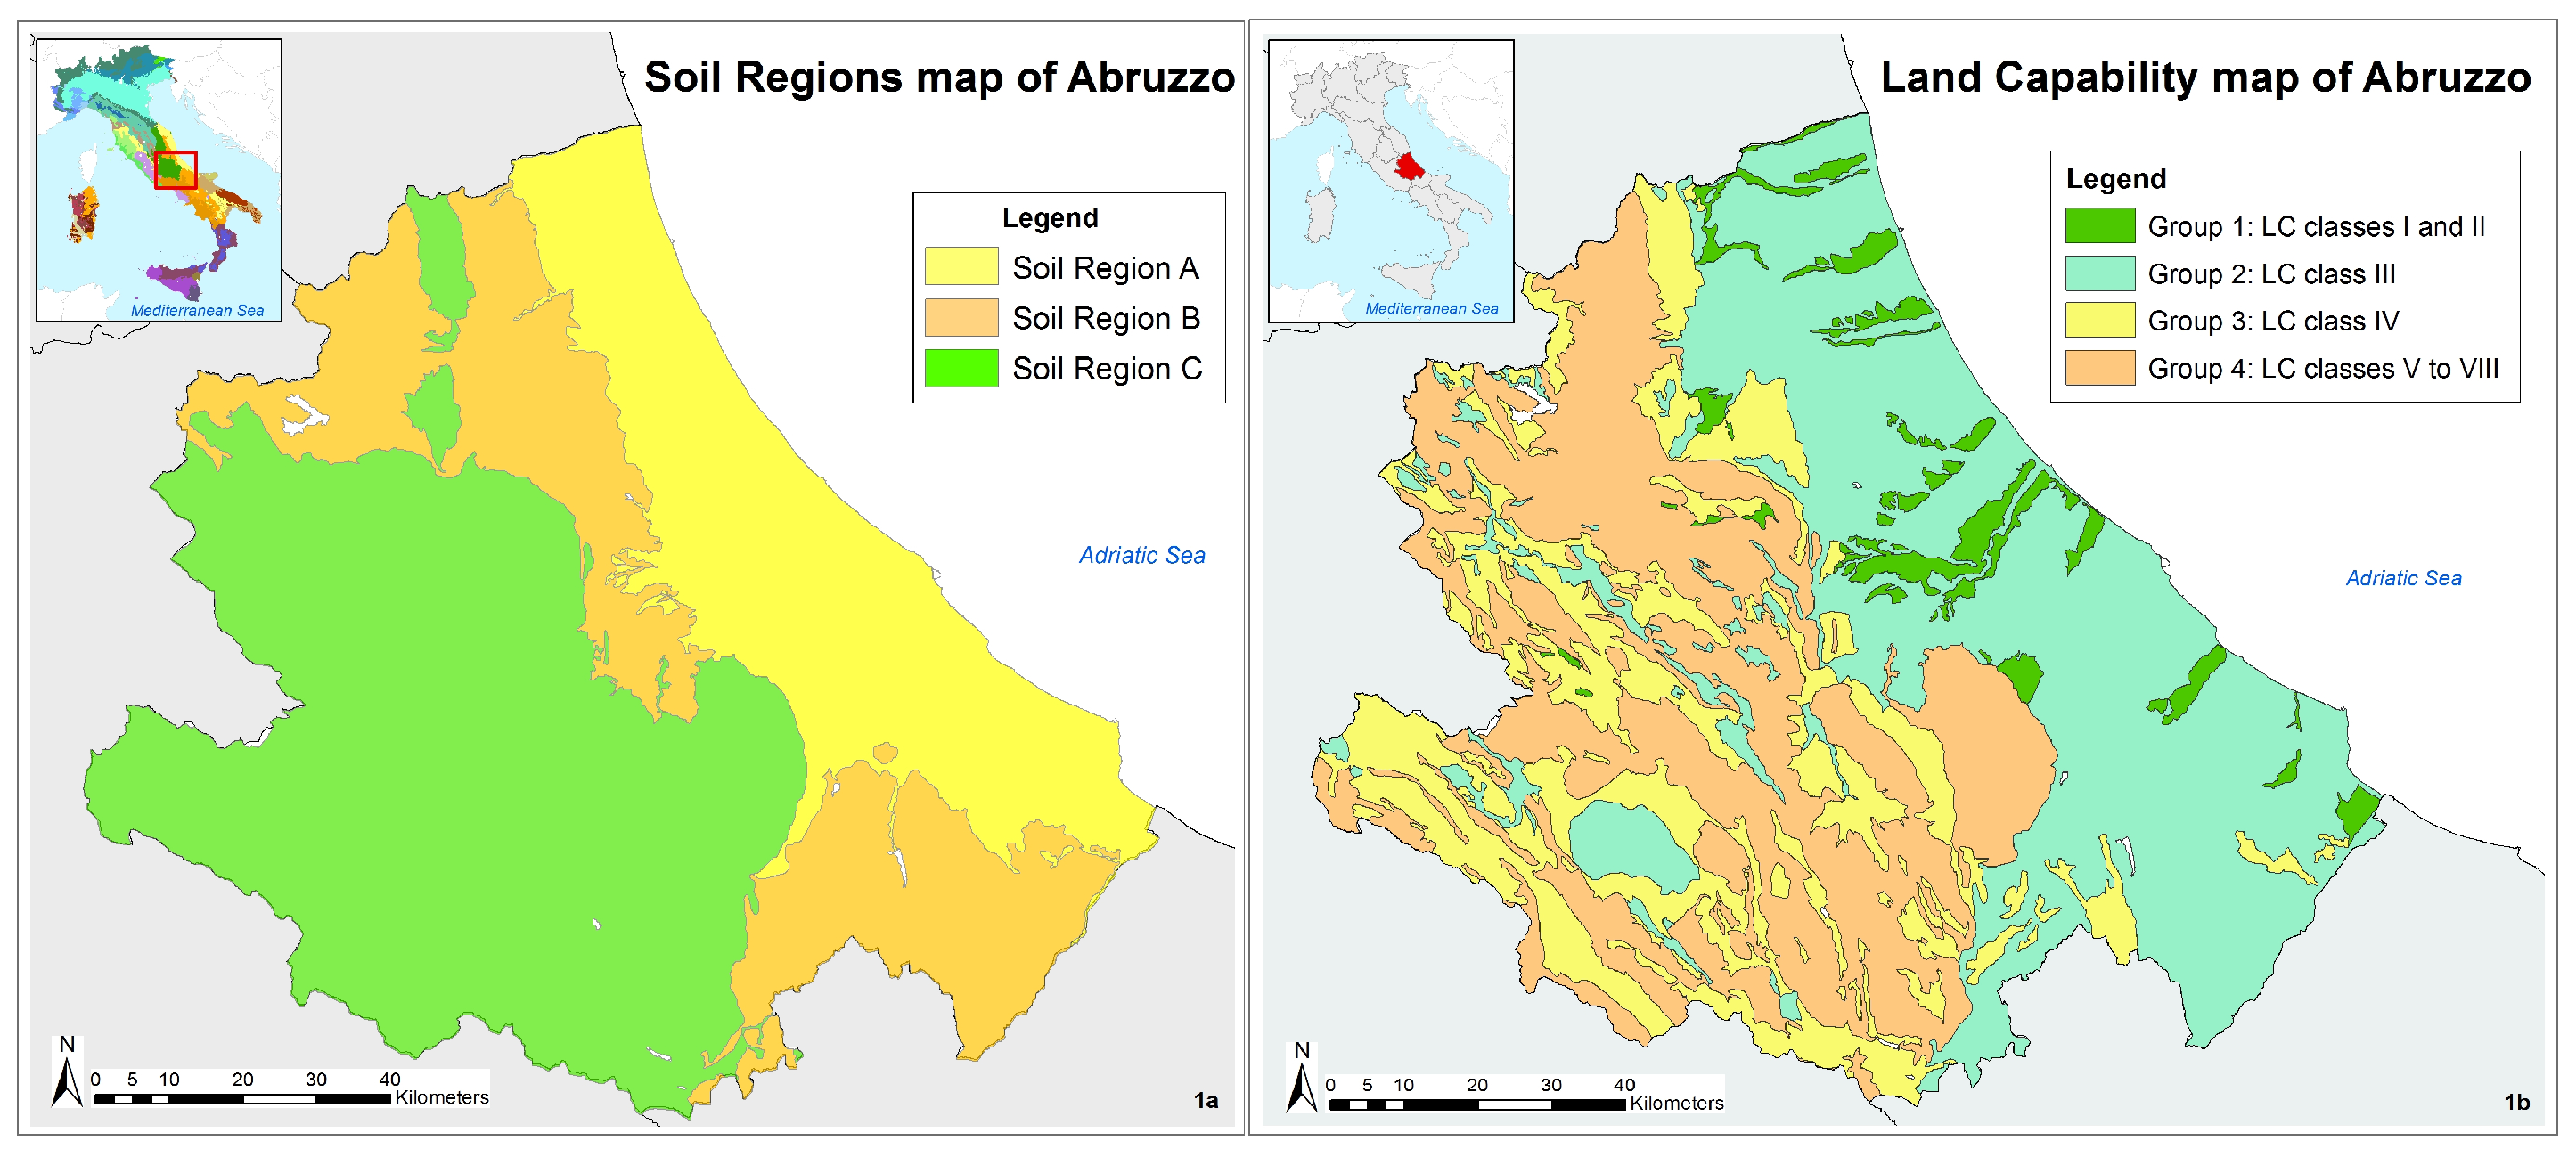
2.1. Study Area

The study area is the Abruzzo region, Central Italy, and covers approximately 10,830 km2 (Figure 1a). Its elevation ranges between the sea level up to 2914 m a.s.l. (Corno Grande). The average annual is 800 mm. The study area is dominated by forests, representing 42% of its total surface [58]. Due to the high variability of the environmental features, the area is representative of the most important agricultural activities of the Mediterranean region, such as cereals in flat zones, horticulture and orchards in the terraces, vineyards and olive groves on the summit of the marine terraces, and pastures on the steep reliefs. During the last decades, the area has been interested by socio-economic transformations, as well as in other marginal and inner areas in Europe. Particularly on the Apennines range the crisis of the agricultural sector and the shifting from an agricultural to an industrial economy has led to the abandonment of rural zones in the hilly and mountain areas and to the urbanization in the plains.

2.2. Data Sources

2.2.1. The Italian Land Use Inventory (IUTI)

The Italian Land Use Inventory (IUTI) has been promoted by the Italian Ministry of Environment and Protection of Land and Sea (MATTM), with the main aim of providing land use estimates at different reference times, specifically 1990, 2000 and 2008, and their relative changes. IUTI is based on a hierarchical classification system, with totally 2 levels and 8 land use classes, and consistent with the Good Practice Guidance for Land Use, Land-Use Change and Forestry (GPG-LULUCF [59]), as follows: Class 1, Woodlands (WO); Class 2.1, Arable lands and other herbaceous crops (AL); Class 2.2, Permanent crops (PC); Class 3.1, Pastures and grasslands (GRA); Class 3.2, Other woodlands (OWL); Class 4, Humid and water areas (WAT); Class 5, Settlements (URB); and Class 6, Other lands (OTH) (see Corona et al. [60] for further details). IUTI is based on a Tessellation Stratified Sampling (TSS) [61]. The Abruzzo region is covered by a network of 43,229 quadrats of 25 ha, and a random point is located in each of them. Each sampling point was classified according to the IUTI classification system through a visual photo-interpretation on digital colour aerial orthophotos at the three time references (1990, 2000 and 2008).

2.2.2. The Soil Database and the Land Capability Classification

The Abruzzo regional soil database is composed by a layer of points containing the pedological observations and a polygonal layer representing the soil map [62,63]. The map is organized in a hierarchical system from the broadest scale of 1:5,000,000, linked with the European level, and the national (1:500,000) and regional scale (1:250,000) and, respectively, the 3 classification levels are: Soil Regions (SRs), Soil Systems (STs) Sub-systems (SSTs). In Abruzzo 3 SRs (Figure 1a), 29 STs and 102 SSTs were defined. Particularly, SRs refer to homogenous ecological land portions with similar morphological, pedoclimatic and soil features [46]. SRs synthesize the main soilscapes in the study area as follows [64]: (i) hills of central and southern Italy on Pliocene and Pleistocene marine deposits with Cambisols, Regosols and Vertisols (24% of the total area; SR A); (ii) Apennine and anti-Apennines relieves on sedimentary rocks of central and southern Italy with Cambisols, Regosols and Luvisols (26% of the total area; SR B); and (iii) Apennine relieves on limestone and intra-mountain plains with Cambisols, Leptosols and Luvisols [65] (50% of the total area; SR C).
Compared to Land Suitability that is crop specific, the Land Capability (LC) classification approach is consolidated for planning purposes. It was originally developed by the Soil Conservation Service of the USDA [47], and more recently implemented in Italy [66]. The LC classification is organized into three hierarchical levels (class, subclass and unit), each of them representing soils having the same degree of limitations for agricultural purposes, according to their stoniness, salinity, slope, workability, etc. Taking into account these pedological features, when read inversely, the LC classification turns out to be a valuable indicator of soil quality [67]. To facilitate the understanding of LUC, the existing 8 LC classes were aggregated into 4 groups, as follows: Group 1 containing the I and II LC classes (soils with the highest suitability for agricultural purposes, thus referable as high quality soils); Group 2 containing the III LC class (soils with medium suitability for agricultural purposes, thus referable as medium quality soils); Group 3 containing the IV LC class (soils with several limitations for agricultural purposes); and Group 4 containing the V to VIII LC classes (non-arable soils). These groups cover approximately 5%, 43%, 25% and 27% of the total regional territory, respectively. This classification system was then implemented into a regional LC map (Figure 1b), mainly based on soil quality and environmental features [63], with a spatial resolution of 1:250,000.

2.2.3. The Agriculturally Homogenous District (AHD) and the Mean Agricultural Value (MAV)
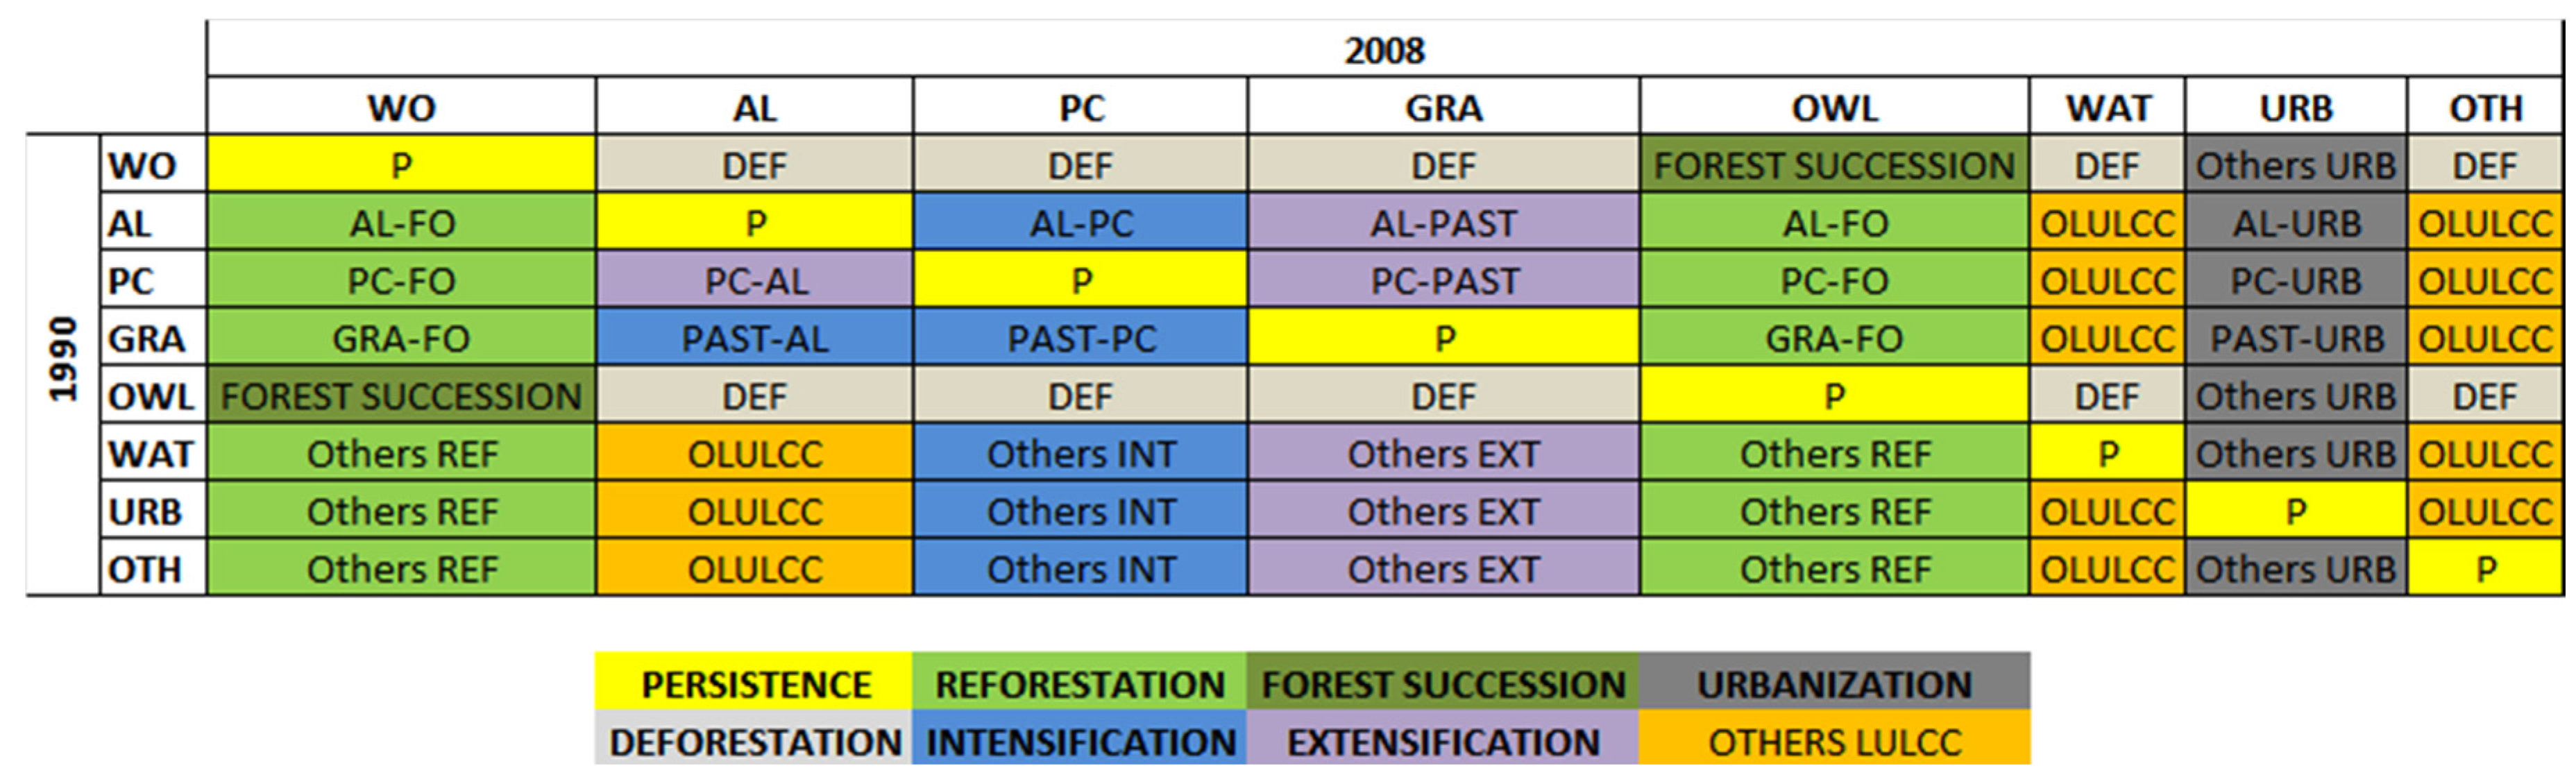
Italy is partitioned by the National Statistical Institute into about 800 agriculturally homogeneous districts (AHDs). Each AHD is obtained by the aggregation of a certain number of municipalities (usually between 5 and 10), which are homogeneous for agricultural characteristics and topography [68]. The Abruzzo region contains 34 AHDs. This classification system was established in order to both acquire and aggregate statistical data on agriculture, with regards to the farms’ structure, the agricultural incomes and the associated economic value. The latter is expressed as the so-called Mean Agricultural Value (MAV), and obtained through the periodical agricultural census (approximately every 10 years). The MAV is related to the average profitability of a specific crop in a particular AHD. Accordingly, the MAV is strictly dependent on the AHD and the type of crops. MAVs are normally used for appraisal of farmlands and are adopted as indicators of the variability of the agricultural economic values as well.

2.3. Data Analysis

LUC processes between 1990 and 2008 were analyzed in the whole region, and separately for the sub-regional domains (soil regions and land capability units), with a transition matrix (i.e., cross-tabulation matrix [69]). The main advantage concerns the possibility to analyze all the changes occurred during a given time-span and not only the net changes. In fact, the transition matrix identifies all the LUC flows and gives the possibility to highlight all gains and losses of a certain land use class in comparison with the others, and vice-versa. Then, the different LUC flows were aggregated in order to better detect the changes and facilitate the comparisons among the different SRs and LC classes. The aggregation followed the approach proposed by the LEAC classification system (Land and Ecosystems Accounts [70]). Starting from the original 64 possible combinations in the transition matrix (8 classes in 1990 × 8 classes in 2008), the LUC flows were aggregated into two hierarchical levels (Figure 2). Seven primary processes were identified, and 4 of them (i.e., reforestation, intensification, extensification and urbanization) were in turn divided in 4, for a total of 16 secondary processes. The secondary processes are hereinafter labeled with specific acronyms representing both the land use class at 1990 and that at 2008 (i.e., AL-URB stays for transition from AL to URB during the 1990–2008 period). Although the processes such as e.g., “deforestation”, “reforestation” and “urbanization” are rather common and intuitively understandable, the term “forest succession” refers to the changes occurred within the forest domain and includes those areas that are characterized by secondary evolution (from other wooded lands—OWL to WO) or degradation (from WO to OWL) processes. The transitions from and to WO and OWL were considered altogether, and indicated to as “forests” (FO). In the proposed classification of the primary LUC processes, the “intensification process” specifically regards the agricultural domain, because it implies a more intense use of the land. The opposite is expected for the “extensification processes”. We identified and characterized these processes considering the linkages between local habits and parameters such as e.g., the mechanization, the use of chemicals and fertilizers, and the amount of capital investments related to the different agricultural land uses.
According to the methodology proposed by Fattorini et al. [61] for the TSS scheme, the IUTI points were used to estimate the proportion of LUC processes from 1990 to 2008 (p), their surfaces ( a ^ ) and their relative standard errors (RSE) in the Abruzzo region, and within each of its SRs and LC classes. From IUTI sampling protocol, we calculated for every territorial system (region, SRs, and LC classes) the values of N, which represents the number of quadrats covering the study area, and A, which represents the surface of these networks (see Table S1 in the Supplementary Materials for their values).
The size of p is estimated as follow:
p = n / N
where p is the estimate of the portion of the area covered by the class or by the transformed territory (n), with respect to the network size N. The area covered by the land use classes or by the specific LUC ( a ^ ) is given by:
a ^ = A p
and its variance ( V ^ ) is estimated as follows:
V ^ = p ( 1 p ) N 1
From the variance estimator V ^ , it is then possible to calculate the relative standard error estimator (RSE), as follows:
R S E = 1 p p ( N 1 )
To evaluate the economic impact of LUC at the expense of agricultural lands referred to every AHD in the Abruzzo region, the MAVs were at first attributed to every IUTI point at both 1990 and 2008, and classified as AL, GRA and PC. A value of 0 was given to all the remaining land use classes, which were considered as non-agricultural classes in this study. It is worth noting that these values have a high variability depending on the AHDs where the IUTI points are located (see Table S2 in the Supplementary Materials for their values among the different territorial systems). Then, for every IUTI point, the difference (MAV90–08) between the MAVs at 2008 (MAV2008) and those at 1990 (MAV1990) were calculated, as follows:
M A V 90 08 = M A V 2008 M A V 1990
This difference represents the gain or loss of the economic agricultural value, due to the LUC occurred in the 1990−2008 period. Positive values of this difference means an increase of the agricultural economic value for a given piece of land, while negative values correspond to a net decrease of such value. In general, an increase of the agricultural economic value may be related to intensification processes (i.e., transitions from pastures to vineyards), and its decrease to both extensification processes (i.e., the transitions from vineyards to pastures), and transitions from agricultural land uses to others. The single MAV90–08 values calculated for all IUTI points, were then aggregated for the whole region and SRs in order to investigate how the gain or loss in economic value was distributed across the regional territory. In order to emphasize the importance of the spatial scale, and the use of accurate data, the same analysis was performed for the whole region without distinguishing the MAV for every AHD, but using only 3 MAVs for the AL, GRA and PC. In our opinion, this type of simulation is helpful to show the implications, in terms of under/over estimating certain phenomena, of using large scale statistics (e.g., national, continental, global) at finer scale.

3. Results

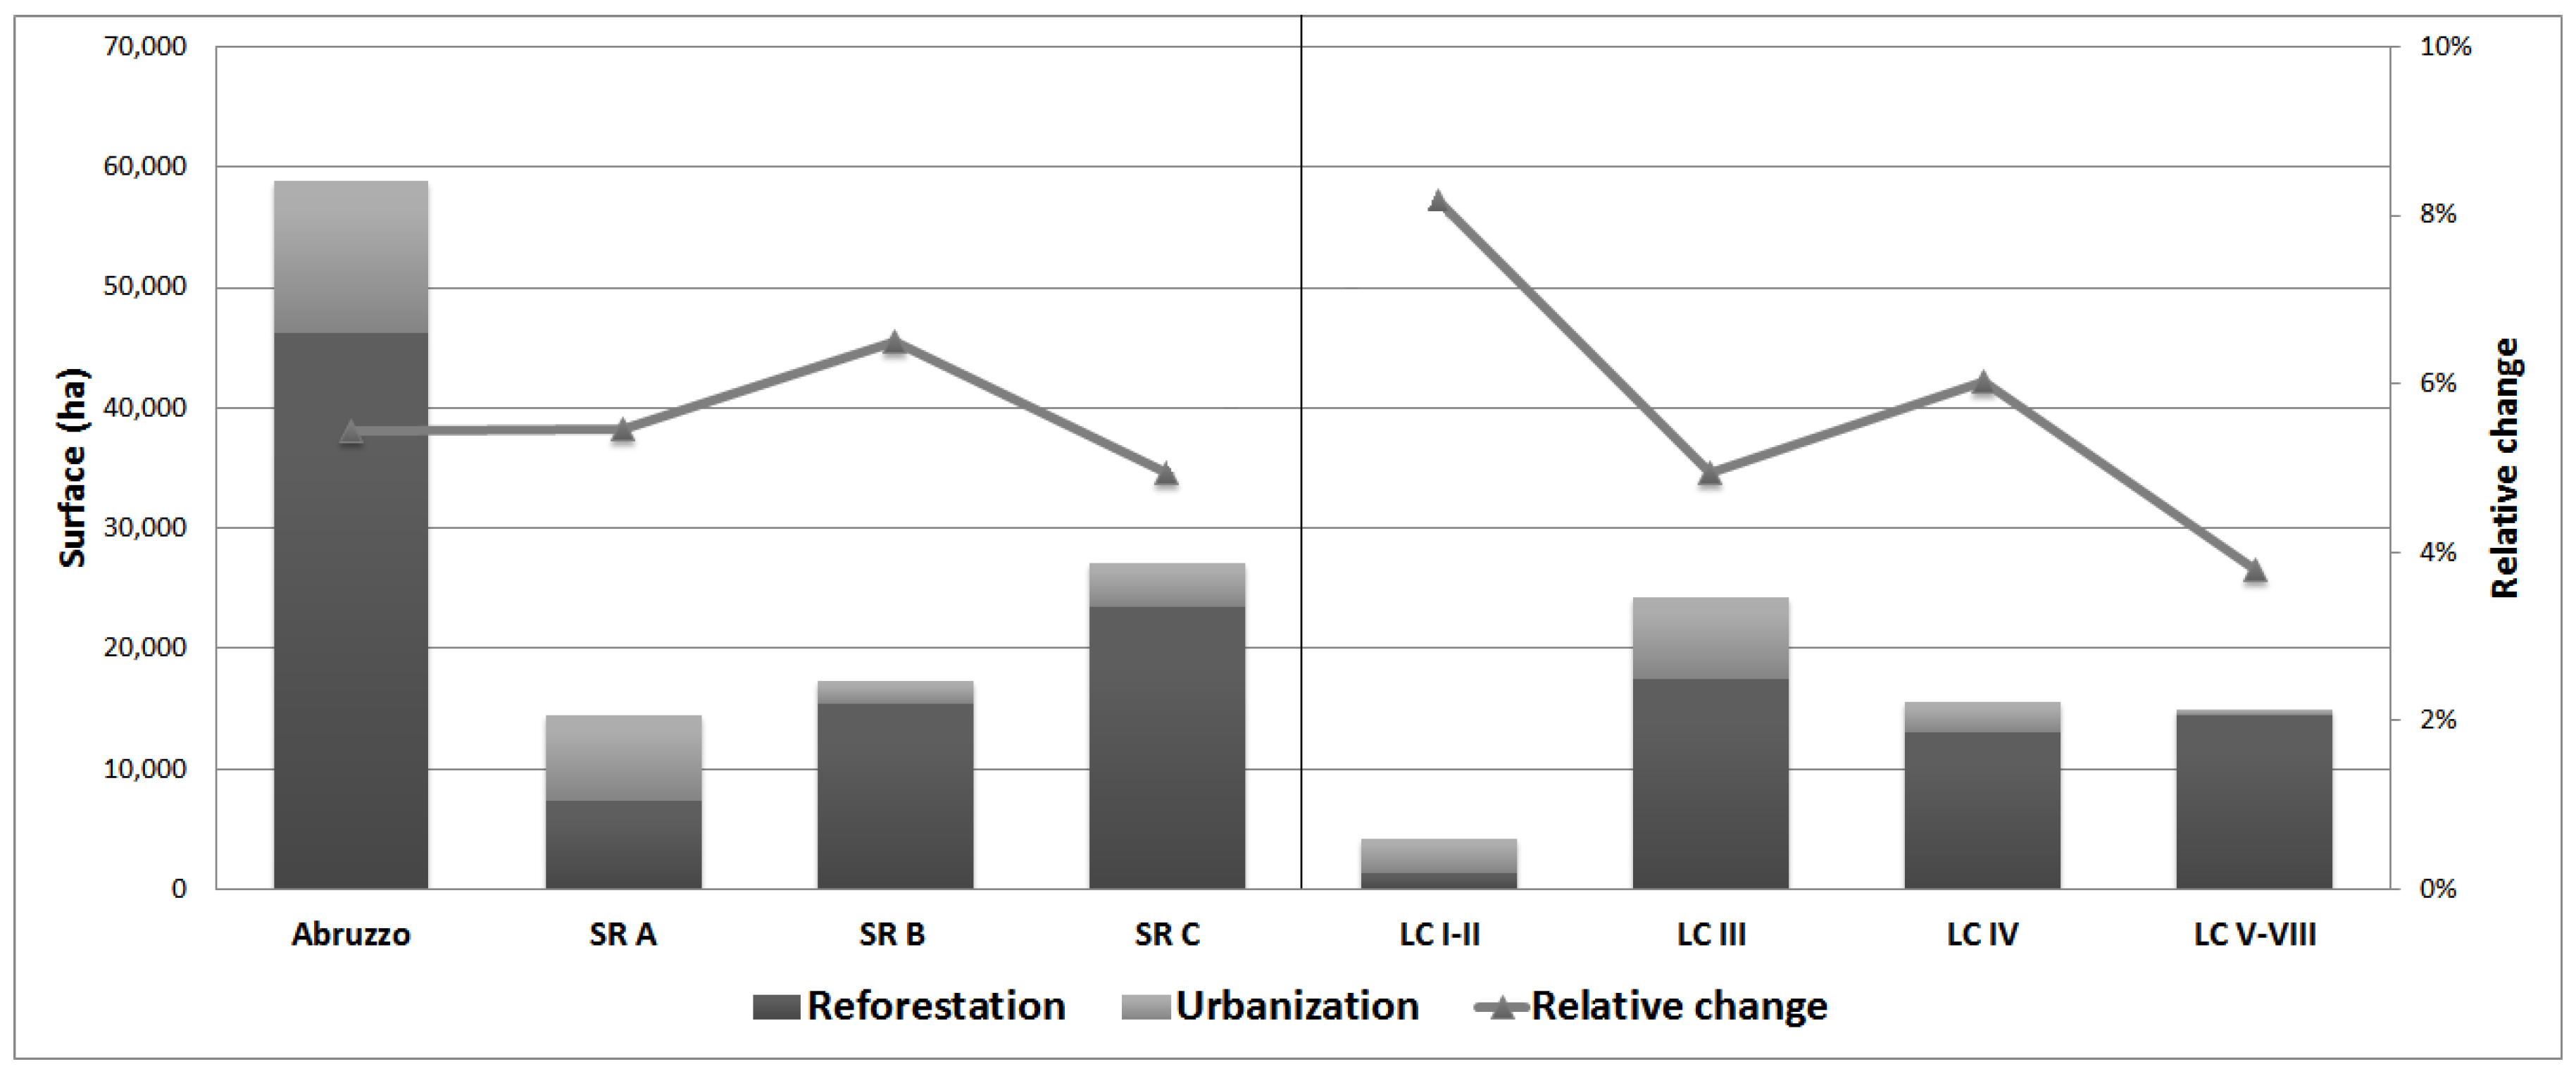
3.1. LUC Trend in the 1990–2008 Period

From 1990 to 2008, LUC occurred in 11.2% of the Abruzzo region (120,825 ha). This total regional LUC was distributed among the different territorial systems as follows: 40%, 29% and 31% in SR A, B and C, and 8%, 56%, 19% and 17% in I–II, III, I–V and V–VIII LC classes, respectively. The relative coverage of the LUC with respect to the surface of the territorial systems decreased from SR A to SR B and SR C (18.2%, 13.3% and 6.8%, respectively), and increased over the LC classes (from 21.6% to 5.8% in I–II and V–VIII LC classes, respectively) (Table 1). The SR A was dominated by the intensification processes, as well as the I–II and III LC classes, which represented 43%, 32% and 34% of their total changes, respectively. The SR B and C, as well as the IV and V–VIII LC classes, were widely dominated by the reforestation processes, which represented 43%, 63%, 56% and 69% of their total changes, respectively.
At the regional scale, reforestation was the dominant LUC process (4.3% of the total regional area), and mainly derived from the transitions from GRA to FO (2.7%). It is important to note that the coverages in this paragraph are expressed in relative terms with respect to the total area of the specific territorial systems. The intensification processes were more widespread (2.7%) than the extensification ones (1.9%). The former was primarily related to the AL-PC transition, representing almost 90% of the intensification processes, while the latter was primarily due to the AL-GRA transition, representing 88% of the extensification process. The magnitude of the urbanization (1.2%) was also not negligible and it mostly occurred at the expense of AL (77% of the total urbanization process). The reforestation process was particularly relevant in the cases of SR B and C (5.8% and 4.3% of their total area, respectively), and represented 68% of the total LUC occurred in the SR C from 1990 to 2008, generally at the expense of AL. Forest expansion was highest in IV and V–VIII LC classes (5.6% and 4% of their total area, respectively) and primarily occurred at the expense of GRA.
In the case of SR A, the intensification was the dominant LUC process (43% of the total changes in the SR), and mainly occurred at the expense of AL (94% of the intensification process in SR A). It represented almost 1/3 of the total changes in I–II and III LC classes, and it was not negligible even in LC class IV, where it represented the second most recurrent transition (1.1% of the total territorial system area). Although its low intensity, the extensification process followed almost the same distribution as that of the intensification process across the different SRs and LC classes. However, it is worth noting that in SR A and I–II LC class, the extensification process was mostly due to the PC-AL transitions, whereas the AL-GRA transitions were dominant in the remaining territorial systems.
The urbanization was higher in SR A (2.7% of the total territorial system area) than in SR B and SR C (0.7% for both), and it was preeminent in I–II LC class (6.1%). The forest succession process was relatively abundant in SR B (1.6% of the total territorial system area) and LC IV (1.1%).
RSEs of these estimates vary from 2.3% to 41% for the reforestation and other LUC processes. RSEs are always lower than 20% for the primary processes in all SRs, except for the other LUC processes in SR A. A similar trend is registered for the four LC groups, where the RSEs have highest values for the forest succession and deforestation processes, especially occurring in I–II and V–VIII LC classes.

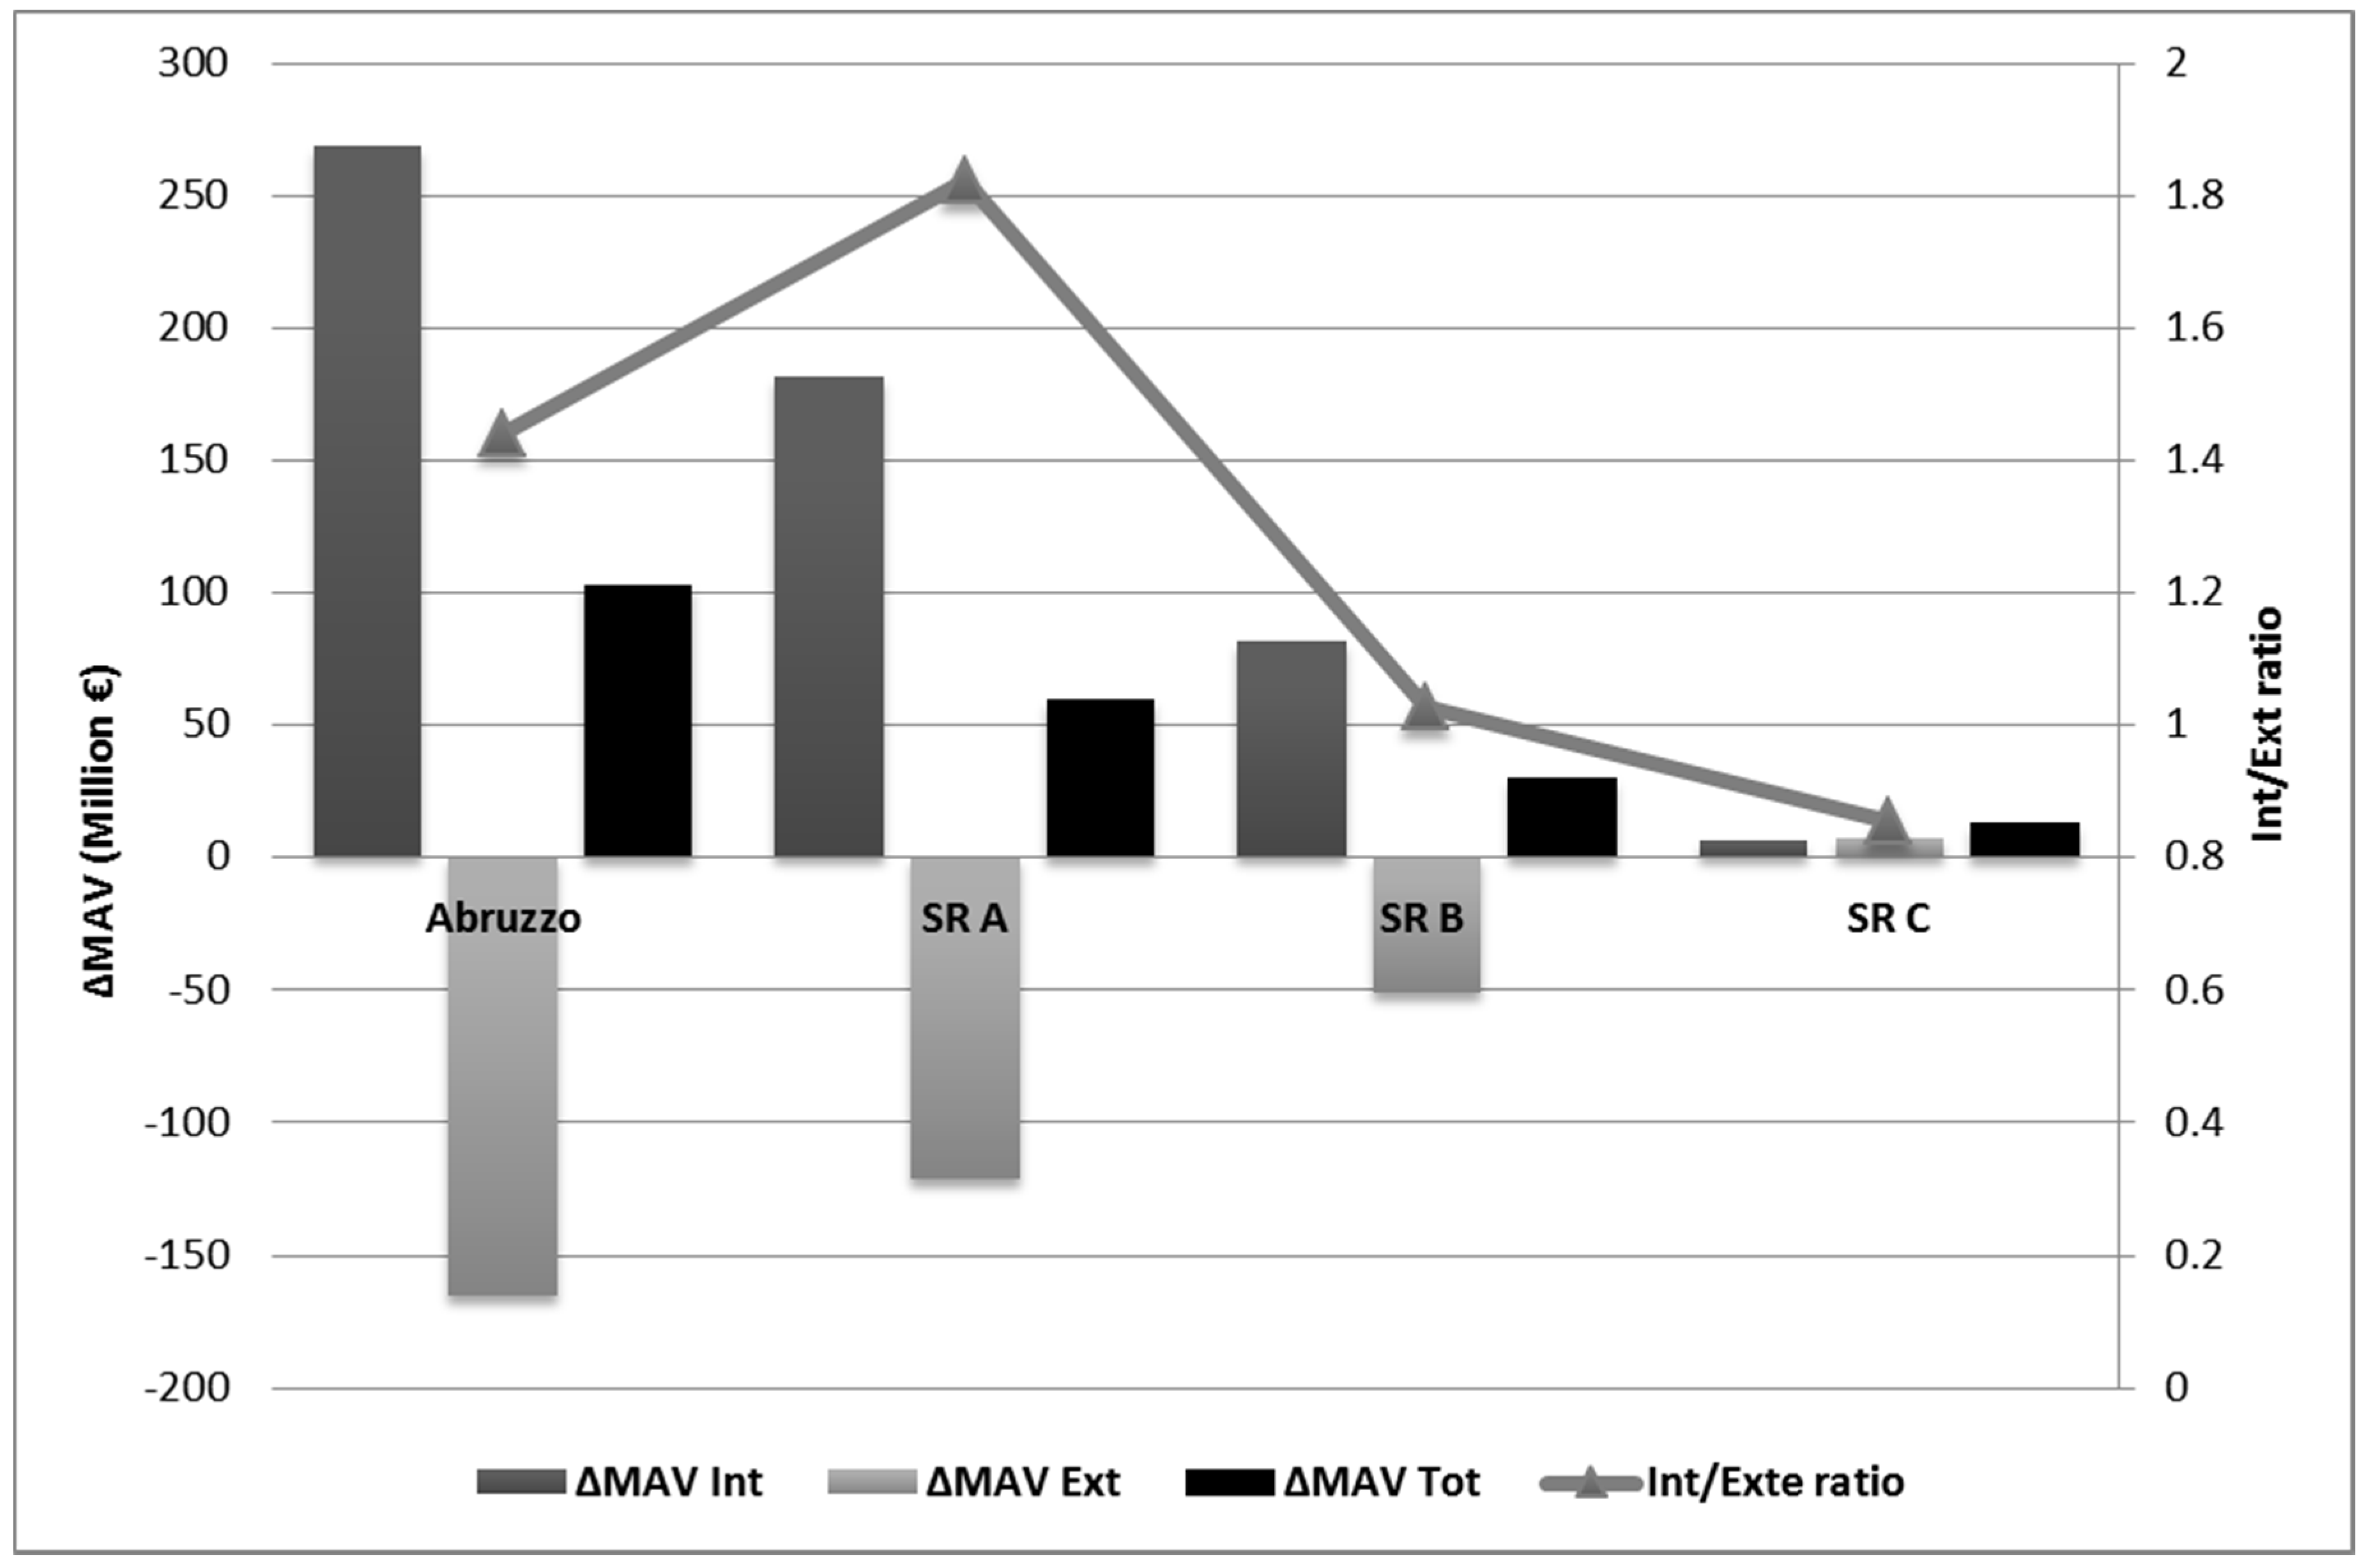
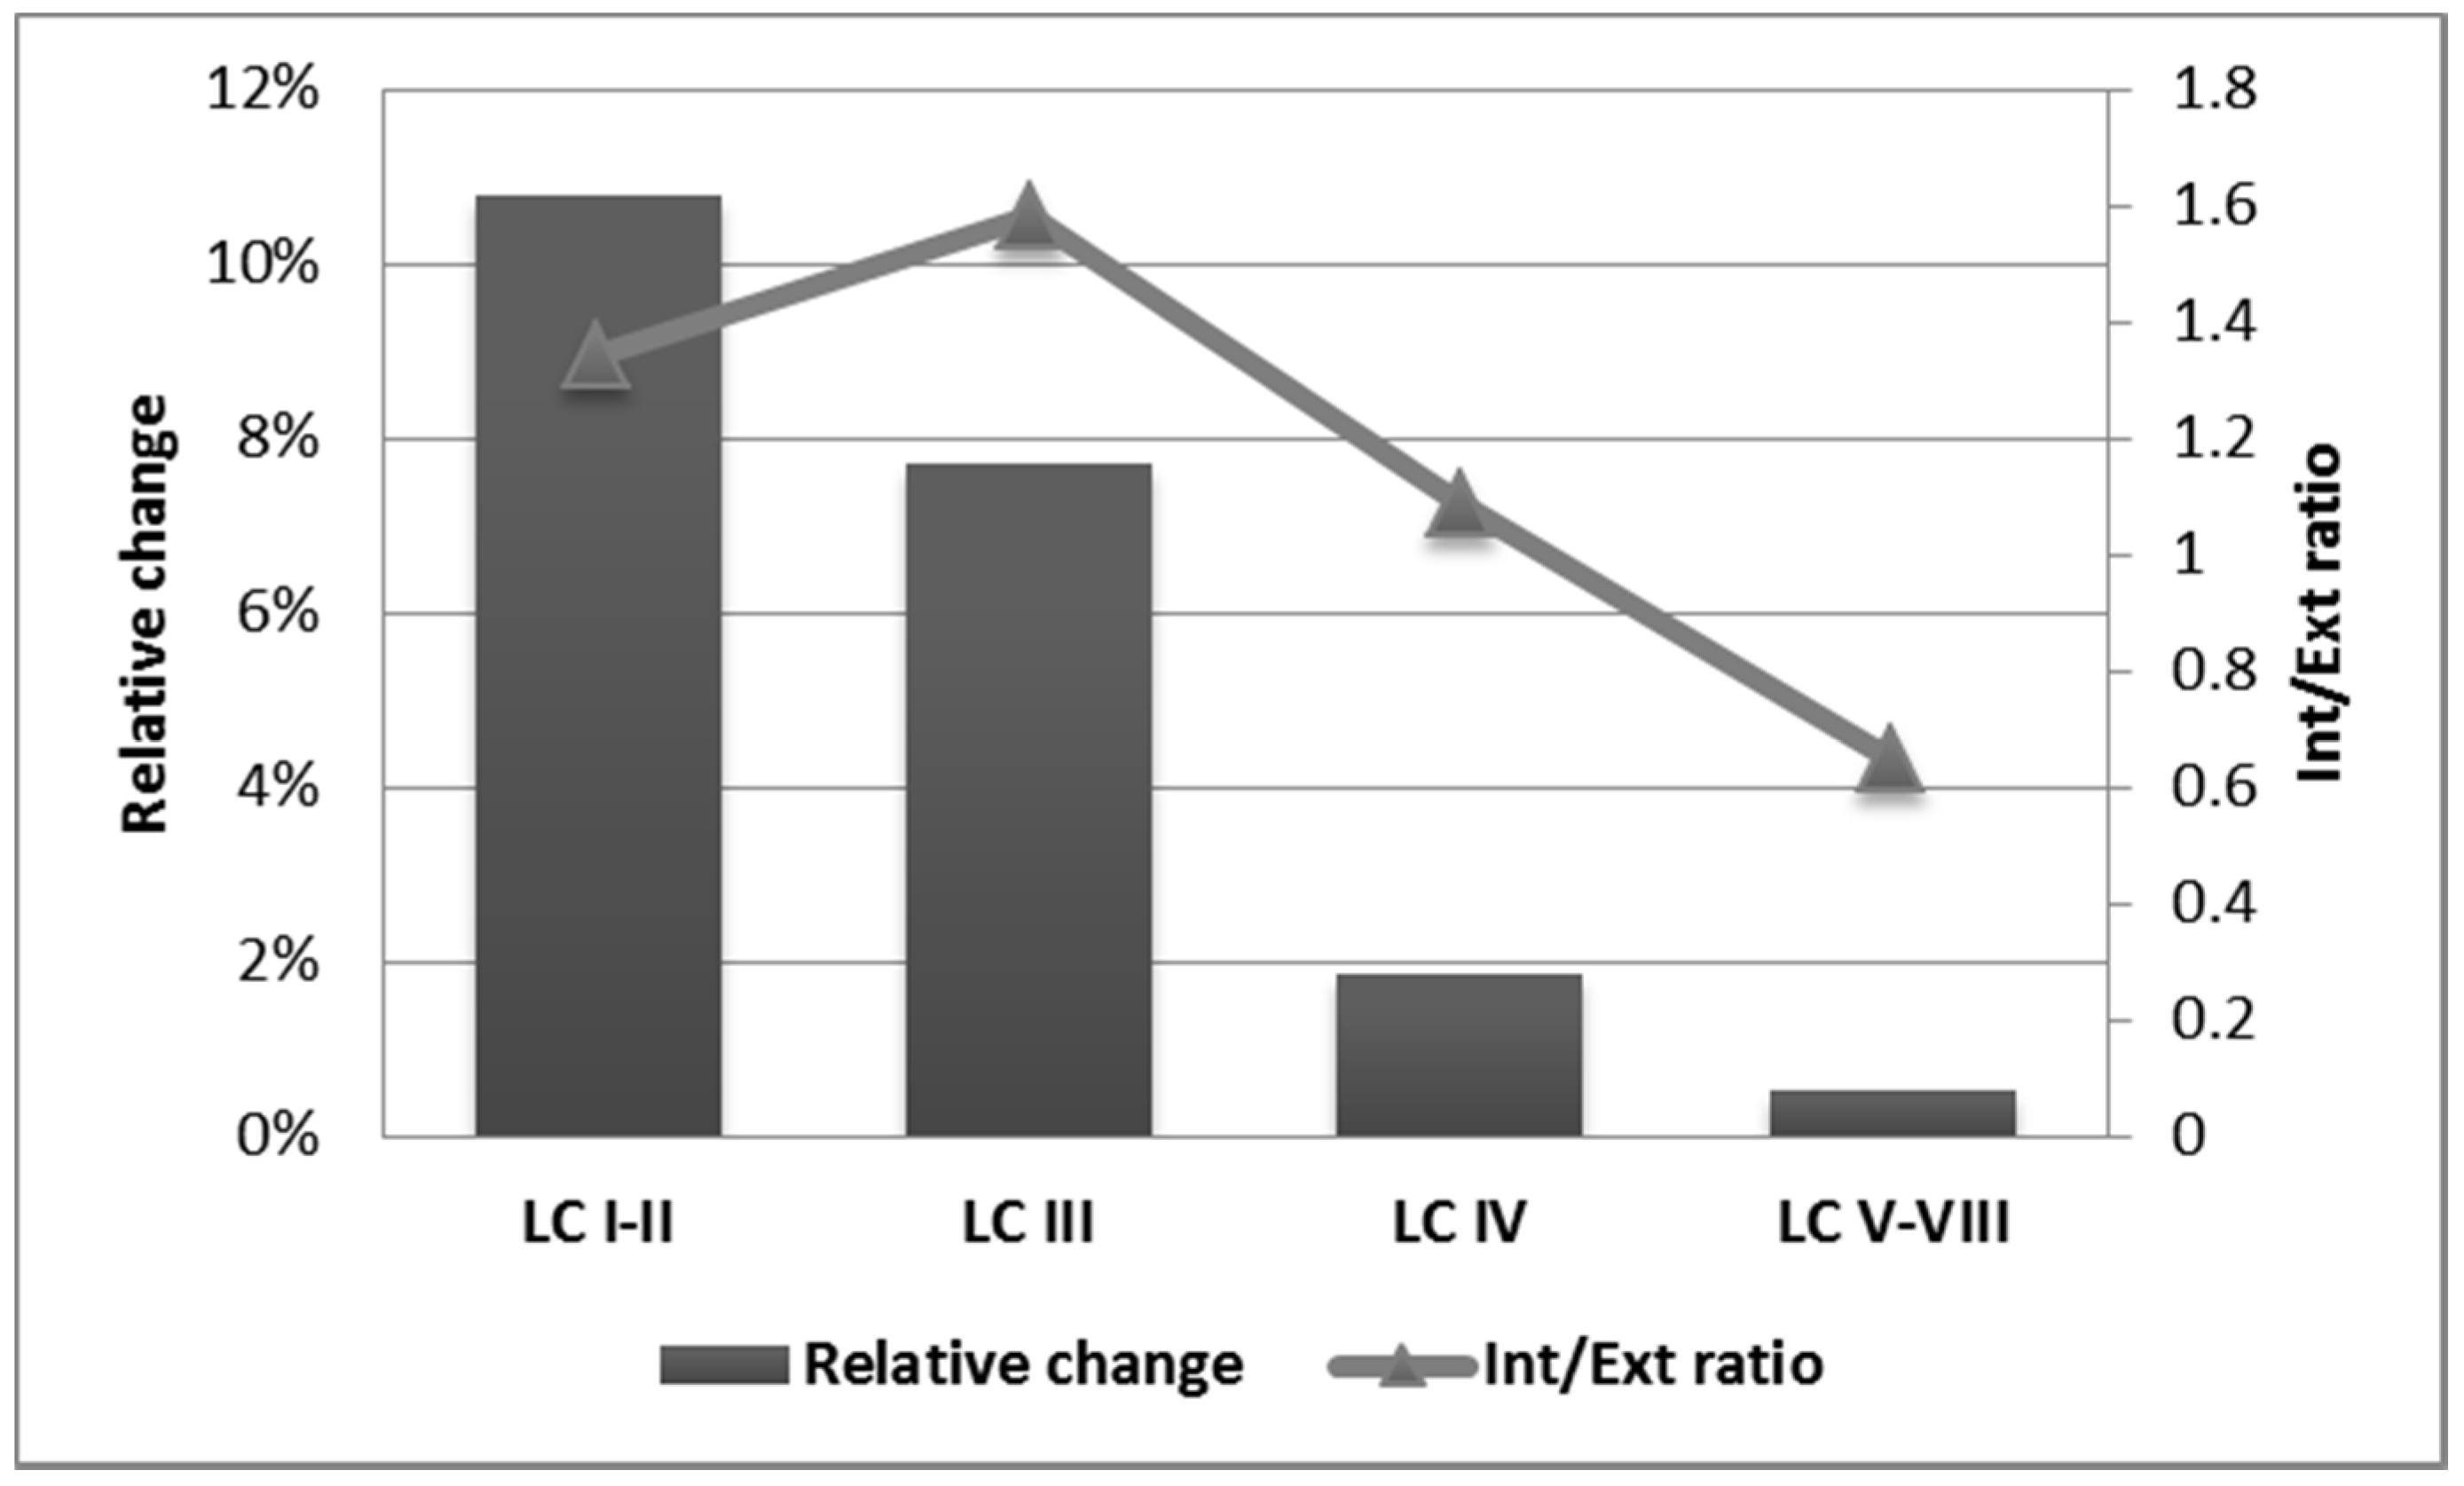
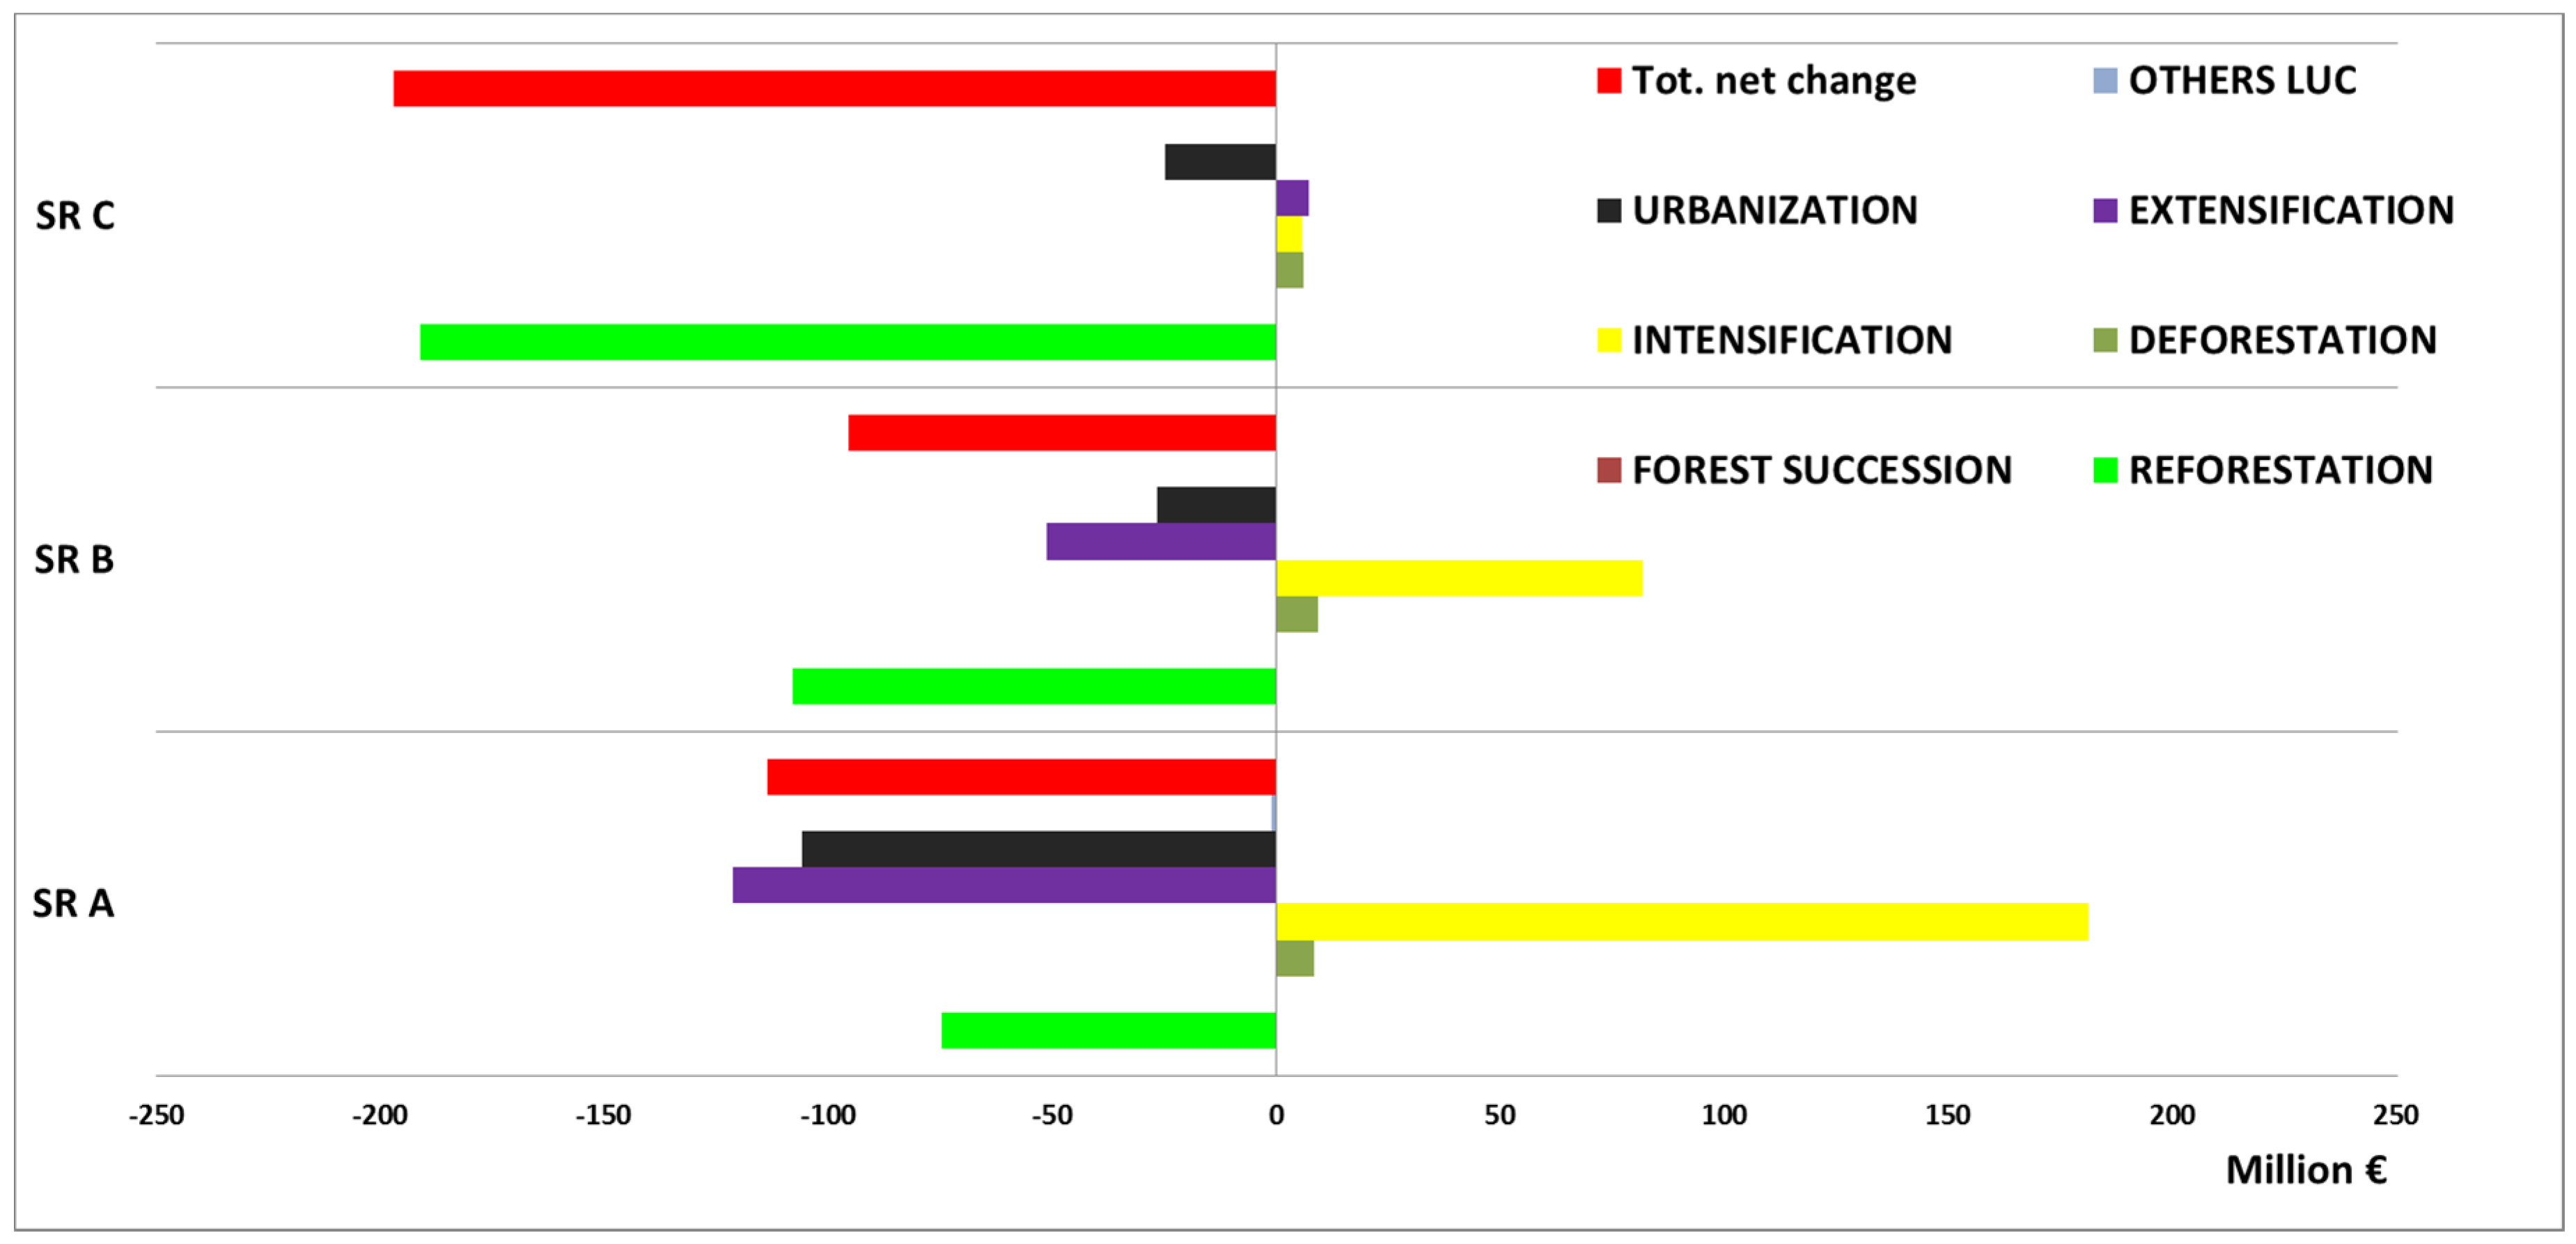
3.2. LUC Effects on the Agricultural Economics

In the 1990–2008 period, LUC in Abruzzo region caused an overall economic loss (MAV reduction over the 1990–2008 period) in the agricultural sector of approximately 406 M € (Table 2). Almost 48% of this economic loss was found in SR C, then in SR A and SR B (28% and 24% of the total economic loss, respectively). The net economic loss was originated by the negative MAVs’ change related to reforestation, extensification, urbanization and other LUC processes, in conjunction with the positive MAVs’ change from intensification and deforestation processes. Considering the focus on the agricultural sector, the forest succession processes (OWL-WO and WO-OWL) were not considered in the evaluation of the change in the agricultural economic value.
The major economic loss was related to the reforestation process (374 M €), and particularly to the GRA-FO transition in SR C (45% of the total economic loss due to the reforestation process), and to the AL-FO transition in SR A and SR B (13% and 14% of the total economic loss due to the reforestation process, respectively). The extensification process had a negative impact of 165 M € in Abruzzo region, especially in SR A and SR B, and a positive effect in SR C. In fact, although the PC-AL transition had always a negative impact in all the SRs, it resulted in an economic gain, especially for the AL-GRA transition in SR C (7.4 M €). The urbanization process had always a negative impact on MAV, and the associated total economic loss at regional scale (157 M €) was largely attributable to the urbanization process in SR A (67% of the total economic loss due to urbanization) at the expense of AL (76 M €).
The intensification process had a positive influence on MAV (approximately 269 M € for the whole region), particularly due to the AL-PC transition (86% of the total economic gain due to the intensification process) in SR A (163 M €).
The mean economic loss (MAV ha−1) in Abruzzo was 3362 €·ha−1, with the highest value in SR C (5291 €·ha−1). The highest losses for the whole region were 24,543, 19,512 and 20,022 €·ha−1 for the PC-URB, PC-GRA and PC-FO transitions, respectively. As a primary process, urbanization originated the highest unitary economic loss (12,418 €·ha−1), especially in SR A and SR B (14,698 and 14,588 €·ha−1, respectively). On the other hand, the highest economic gain correlated with the deforestation process (9814 €·ha−1), and probably referred to the creation of new agricultural lands. It is also worth noting that the intensification process had the highest unitary economic gain in SR B (12,558 €·ha−1).
Finally, using the average of all MAVs in the region for the different agricultural land use classes (without differentiation by AHDs), instead than using their distinct values, the overall economic loss was approximately 215 M €. This result represents an underestimation of the total economic loss of approximately 47% in comparison with the value obtained by differentiating the MAVs for every AHD.

4. Discussion

The results highlight that LUC processes in Abruzzo region mainly referred to (see Table 1): (i) the shrinkage of agricultural lands, due to both reforestation and urbanization processes; and (ii) the intensification/extensification of agricultural activities (changes in the intensity of the agricultural uses). Moreover, the results show that at regional scale, the main LUC processes were distributed among SRs and LC classes according to different spatial gradients, thus demonstrating the linkage between LUC processes, the soil characteristics (e.g., pedoclimate, geology, morphology, and soil type), and productivity. The main LUC processes are further analyzed in the next section.

4.1. Shrinkage of the Agricultural Lands

The shrinkage of the agricultural lands concerned almost 58,000 ha in Abruzzo region, and represented more than half of the total LUC in the 1990–2008 period. It is important to consider that the loss of agricultural lands was largely distributed in the Abruzzo region, according to SRs and LC classes. In fact, this process may be correlated to: (i) the abandonment of agricultural practices and consequent reforestation process in mountain and high-hilly, and less productive areas, i.e., SR B and C, and LC III, IV and V–VIII; and (ii) the urban growth along the coasts, and in lowlands and more productive areas, i.e., SR A, and LC I–II (see Figure 3). The reforestation represents one of the most relevant LUC process in the Abruzzo region during the 1990–2008 period, especially considering the implications due to the contractions of agricultural lands, and the lowering of related incomes. These results confirm the trends outlined in the Mediterranean region since 1950s [71]. Furthermore, it is worth highlighting that the relative incidence of the reforestation process (with respect to their respective total surfaces), was higher in SR B (5.8%) than in SR C (4.2%), thus reflecting the so-called “mountain effect”, which is already described for Southern French Alps [40] and Apennines, since the transhumance period is finished [15]. The “mountain effect” implies that there is less farm abandonment, and agricultural lands loss, in higher compared to medium mountains. In particular, the expansion of forests may derive from the depopulation of inland areas during the last decades, which in turn originated a sensible reduction of grasslands at higher elevations [14]. This aspect is connected with a widespread loss of economic incomes at regional scale and mainly it is associated with the loss of grasslands (GRA-FO transition) in less productive areas (SR B and C; see Table 1), as also demonstrated by Bucala [72]. Taking into account that semi-natural grasslands are considered biodiversity-rich ecosystems, their loss and degradation may compromise the long-term availability of other goods and services, such as forage production, soil carbon storage, aesthetic values, etc. [73]. Moreover, in high-hilly and mountain areas of Abruzzo region (SR B and C), the presence of large Protected Areas (e.g., three National Parks) has probably limited the urban growth and the intensification of agricultural practices [19,28,73]. In addition, several authors argued that the progressive abandonment of the transhumance practices in Abruzzo region led to a reforestation over grasslands and pastures in hilly and mountainous areas [74,75]. The loss of grasslands in mountain areas also threats the biodiversity conservation (e.g., High Conservation Value Farmlands [76]) and the so-called “relational value” [77]. The relational value refers to the non-material benefits derived through human-ecosystem interactions. With particular regard to mountain contexts the relational value seems to be helpful to highlight the cultural value of certain agricultural practices as well as to “link and enliven intrinsic and instrumental considerations” related to the sustainable management and use of natural resources [77]. The results showing urban growth on more productive lands are consistent with the trends that have occurred during the last decades, especially in flat zones and along the coastline of Italy [18]. The urban expansion has several implications other than the loss of the provisioning service, such as the land degradation processes due to soil sealing: the definite loss of agricultural lands over the medium-long period (Northern Italy [67]). This aspect is even more important looking at the relative change with respect to the total LC class’ surface (Figure 3). The highest relative change occurred in the I–II LC class (8%), and was mainly due to urbanization. If this trend will continue, the productive capacity of this territory will be strongly undermined. The overall not reversible economic loss generated by the shrinkage of agricultural lands due to urbanization is 157 of approximately 530 M €, and relatively higher in SR A, due to the high profitability of arable lands converted into urban areas. At the same time, the highest absolute economic loss of 216 M € in SR C may seriously undermine the livelihood and wellbeing of current and future local communities. The net overall economic loss of agricultural lands from 1990 to 2008 (406 M €) represents about 1.4% of the Gross Domestic Product (GDP) of the Abruzzo region at 2008 [78].

4.2. Changes in intensity of Agricultural Uses

Internal changes in agricultural lands (intensification and extensification) represent 41% of the total LUC in Abruzzo region, and are demonstrated to have important economic impacts, especially considering that they were concentrated in the most productive areas (SR A and LC I–II) (see Figure 4 and Figure 5). The shifting from crop productions to more specialized and profitable ones, such as vineyards and olive groves, represented the most important intensification dynamic (see AL-PC transition in Table 1). This phenomenon was also found in other Mediterranean contexts (e.g., vineyards conversion in Spain [79]). Results show that the intensification process increased the agricultural revenues in the whole region, particularly in SR A (see Figure 4), due to the co-occurrence of several positive factors, not only related to the suitable soil characteristics, but also to irrigation facilities and the proximity to large urban areas (short distribution chains). The polarization of the intensification and extensification processes is well visible by analyzing their ratio (Int/Ext ratio), which turned out to be >1 if the intensification was greater than extensification, and <1 in the opposite case. While the prevalence of the intensification process was clear in SR A (Figure 4) and in high-to-medium quality soils (Figure 5), this was less emphasized in SR B and medium-to-low quality soils, where the two processes were almost equal. On the contrary, the extensification process, mostly due to grasslands expansion (AL-GRA), was prevalent in SR C and in the less capable soil units, where the Int/Ext ratio results <1. The net MAV change due to agricultural intensification/extensification was positive for all the SRs, even though with different magnitudes (decreasing values from SR A to C, Figure 4).
The mean economic gain related to the intensification process results higher in SR B in comparison with SR A (Table 2). This is because, even though the productivity of mainly orchards and vineyards (PC), and the associated economic values, are rather similar in the SR B and the SR A, the productivity of the arable lands in SR B is lower than in SR A. Consequently, the economic gain due to the specialization of the agricultural uses was more emphasized in SR B and C (see Figure 4). This demonstrates that although the intensification process generally induces increased economic values in agriculture, its effects depend on the climate and pedological, as well as on socio-economic, features. Conversely, the extensification process originated high unitary economic loss in SR A, mainly due to the high profitability of the most specialized crops and, as a consequence, to the greater difference in economic terms with the other agricultural uses, such as e.g., grasslands. In general terms, and other than the pure economic aspects, the agricultural intensification is also of particular concern because it co-occurred where urban areas expanded, e.g. flat zones and high quality soils (Figure 4 and Figure 5), and may also be linked to land degradation dynamics [67,80]. Accordingly, this cumulative effect should be seriously considered for the future implementation of sustainable land management strategies [6].

4.3. Combined LUC effects: management and economic implications

The results generally describe a spatial LUC pattern in Abruzzo region during the 1990–2008 period, which in turn produced several implications, especially on the economic incomes from the agricultural sector. The major loss of agricultural revenues was primarily found in less productive, and then in more productive areas of the region (SR C and A, respectively) (Figure 6). In addition, the land abandonment due to out-migration has a high social impact, because it determines a further isolation of the communities living in such marginal territories. This in turn causes population ageing and a loss of traditional knowledge on land management [6]. From an ecological point of view, the land abandonment has both positive and negative impacts. On the one hand, it generally contributes to soils stabilization and carbon sequestration [81,82]. On the other hand, the abandonment of agricultural and forestry practices, and in turn the forest expansion, may oversimplify the landscape and reduce the ecosystem adaptation to increasing disturbances, such as climate-derived effects (e.g., landslides, wildfires) [83]. Furthermore, the economic losses due to urban expansion in high-quality soils are considered definitive and seriously undermine the agricultural sector, as well as its competitiveness with other markets. Moreover, both urban growth and intensification turn out to be strictly dependent on depopulation in marginal areas with fewer economic activities [38,84]. This emphasizes the need to further understand the strict correlation between different LUC processes and their distribution on different soilscapes [85] across the territory, in order to monitor over space and time their interconnected social, ecological and economic characteristics. Understanding the implications of LUC processes on the ecosystem services flows, and in turn on the economic gains and losses, is important for supporting future policy and planning [86]. This may be achieved by integrating the ecosystem services trade-offs with LUC analysis, thus helping the decision-makers and other relevant stakeholders in identifying specific areas for land use allocation, and, as a consequence, reducing the possible economic losses derived by certain LUC processes, such as e.g., reforestation, agricultural intensification or urbanization. In particular, the economic losses due to the LUC-derived reduction of the conservation of species and habitats (i.e., biodiversity) or other non-marketed services (climate change mitigation, tourism and recreation, etc.) should be compensated in other landscape portions. For example, Payments for Ecosystem Services (PES) or other compensation/offset mechanisms may be effectively adopted to reduce the impact of certain LUC processes on local economies and balance conservation with more productive strategies in land use planning [87]. In particular, the establishment of specific policy measures and economic incentives (Common Agricultural Policy in EU) to re-establish an integrated management of arable lands, grasslands and new formation forests, may reduce the economic losses due to reforestation processes, and further balance biodiversity conservation, climate change mitigation, and food and energy production, especially in mountain areas. The combination of spatial trade-offs analysis and land use management recommendations has been already tested in other Mediterranean contexts (e.g., the Doñana National Park in Spain [88]).
According to Figure 6, the development of the agricultural sector in Abruzzo region seems to be compromised in the future. In fact, considering the localization and pedological characteristics of the LUC processes, the compensation effects are unbalanced between the mountain and less productive areas (SR C), and the hilly and lowland ones (SR B and A), thus resulting in higher total economic loss (Figure 6). This negative pattern may be a consequence of the past occurrences of social-economic factors such as the industrialization and the out-migration of the rural communities and the scarce effectiveness of the land use-related policy instruments [89], which have been so far implemented in the Abruzzo region. Hence, much more efforts are required in order to both limit LUC over the region (particularly the irreversible processes in most productive soils and the reversible ones in already marginal areas), and guarantee a more sustainable use of lands through both time and space. This could be the case of trying to compensate the net economic losses in most favorable areas for agricultural purposes by stimulating, through economic incentives, road developments, brand management, etc., the net economic gain in other areas of the region. With specific regard to the urban growth, the re-use of artificial areas should be promoted [7].

5. Conclusions

This study highlighted the main implications of the combination between LUC processes, soil properties, and land productivity on agricultural revenues at regional scale. Considering the methodology, the use of the proposed inventory (i.e., IUTI) instead of low spatial resolution mapping (such as Corine Land Cover) approach, was proven to be effective to detect at relatively small cost and with high statistical accuracy, detailed LUC dynamics occurring at a lower scale, such as the reforestation gradient and the polarization of agricultural land losses. Although the adopted approach gave insights about the combined LUC-soil processes, further analyses are needed to unravel the underlining causes and effects of the linkages between LUC heterogeneity, soil properties (e.g., climate and pedoclimate, geology), land suitability (e.g., soil fertility), and economic incomes in agriculture. Moreover, the proposed approach seems to be suitable to deeply understand on the one hand, the magnitude of the LUC processes on the agricultural sector in monetary terms, and on the other hand, to detect in a spatially-explicit way those LUC processes that cause irreversible/reversible impacts on agricultural revenues. Understanding the combined LUC-soil effects on agricultural economics, and more in general on rural development, is extremely important to implement the sustainable land management principles towards e.g., food security. If correlated with scenario-based analysis, the proposed approach may be used by decision-makers in similar contexts (e.g., affected by irreversible LUC phenomena), specifically to prioritize policies and economic measures towards e.g., promoting agricultural uses in less favorable soils or limiting the urban growth in lowlands and coastal areas. Hence, this study offers a multi-scale and replicable support to assess and monitor both local LUC dynamics, in particular involving agricultural lands, and local policies, and handle them according to the implications of global unsustainable changes. Current perspectives are the extension to the entire country and the deep analysis of soil subsystems.
In particular, since Mediterranean agriculture is mainly driven by CAP (Common agricultural policy), this approach will be effective to understand the economic trends of rural lands, extremely important for marginal and inner areas especially for traditional landscape conservation, as from European Landscape Convention [90].

Supplementary Materials

The following are available online at www.mdpi.com/2071-1050/9/1/78/s1. Table S1. Values of the parameters N and A per each territorial system analyzed (the whole Abruzzo region, the 3 SRs and the 4 LC classes). Table S2. MAVs for the different SRs and agricultural land uses (Mean and CV %).

Author Contributions

Rosa Rivieccio substantially performed the analysis; Lorenzo Sallustio mainly wrote the paper; Matteo Vizzarri particularly contributed to the Introduction section and the discussion of the results; and Massimo Paolanti and Marco Marchetti contributed to review the main contents to improve the overall quality of the manuscript.

Conflicts of Interest

The authors declare no conflict of interest.

References

  1. Houet, T.; Verburg, P.H.; Loveland, T.R. Special Issue: Monitoring and modelling landscape dynamics. Spec. Issue Monit. Model. Landsc. Dyn. 2010, 25, 163–330. [Google Scholar]
  2. Foley, J.A.; Defries, R.; Asner, G.P.; Barford, C.; Bonan, G.; Carpenter, S.R.; Chapin, F.S.; Coe, M.T.; Daily, G.C.; Gibbs, H.K.; et al. Global consequences of land use. Science 2005, 309, 570–574. [Google Scholar] [CrossRef] [PubMed]
  3. Schröter, D.; Cramer, W.; Leemans, R.; Prentice, I.C.; Araújo, M.B.; Arnell, N.W.; Bondeau, A.; Bugmann, H.; Carter, T.R.; Gracia, C.A.; et al. Ecosystem service supply and vulnerability to global change in Europe. Science 2005, 310, 1333–1337. [Google Scholar] [CrossRef] [PubMed]
  4. Montanarella, L. The Global Soil Partnership. In IOP Conference Series: Earth and Environmental Science; IOP Publishing: Bristol, UK, 2015; Volume 25, p. 12001. [Google Scholar]
  5. Commission of the European Communities. Thematic Strategy for Soil Protection; Commission of the European Communities: Brussels, Belgium, 2006; Volume 12. [Google Scholar]
  6. Smiraglia, D.; Ceccarelli, T.; Bajocco, S.; Salvati, L.; Perini, L. Linking trajectories of land change, land degradation processes and ecosystem services. Environ. Res. 2015, 147, 590–600. [Google Scholar] [CrossRef] [PubMed]
  7. Gardi, C.; Panagos, P.; van Liedekerke, M.; Bosco, C.; de Brogniez, D. Land take and food security: Assessment of land take on the agricultural production in Europe. J. Environ. Plan. Manag. 2015, 58, 898–912. [Google Scholar] [CrossRef]
  8. Estoque, R.C.; Murayama, Y. Measuring Sustainability Based Upon Various Perspectives: A Case Study of a Hill Station in Southeast Asia. Ambio 2014, 43, 943–956. [Google Scholar] [CrossRef] [PubMed]
  9. Seto, K.C.; Güneralp, B.; Hutyra, L.R. Global forecasts of urban expansion to 2030 and direct impacts on biodiversity and carbon pools. Proc. Natl. Acad. Sci. USA 2012, 109, 16083–16088. [Google Scholar] [CrossRef] [PubMed]
  10. Elmqvist, T.; Redman, C.L.; Barthel, S.; Costanza, R. History of urbanization and the missing ecology. In Urbanization, Biodiversity and Ecosystem Services: Challenges and Opportunities: A Global Assessment; Springer: Dordrecht, The Netherlands, 2013; pp. 13–30. [Google Scholar]
  11. Sallustio, L.; Quatrini, V.; Geneletti, D.; Corona, P.; Marchetti, M. Assessing land take by urban development and its impact on carbon storage: Findings from two case studies in Italy. Environ. Impact Assess. Rev. 2015, 54, 80–90. [Google Scholar] [CrossRef] [Green Version]
  12. Li, R.Q.; Dong, M.; Cui, J.Y.; Zhang, L.L.; Cui, Q.G.; He, W.M. Quantification of the impact of land-use changes on ecosystem services: A case study in Pingbian County, China. Environ. Monit. Assess. 2007, 128, 503–510. [Google Scholar] [CrossRef] [PubMed]
  13. Beilin, R.; Lindborg, R.; Stenseke, M.; Pereira, H.M.; Llausàs, A.; Slätmo, E.; Cerqueira, Y.; Navarro, L.; Rodrigues, P.; Reichelt, N.; et al. Analysing how drivers of agricultural land abandonment affect biodiversity and cultural landscapes using case studies from Scandinavia, Iberia and Oceania. Land Use Policy 2014, 36, 60–72. [Google Scholar] [CrossRef]
  14. Marchetti, M.; Lasserre, B.; Pazzagli, R.; Sallustio, L. Rural areas and urbanization: Analysis of a change. Sci. Territ. 2014, 2, 239–258. [Google Scholar]
  15. Sallustio, L.; Simaptico, A.; Munafò, M.; Giancola, C.; Tognetti, R.; Vizzarri, M.; Marchetti, M. Recent trends in forest cover changes: Only positive implications? L’Italia For. Mont. 2015, 70, 273–294. [Google Scholar] [CrossRef]
  16. Italian National Institute for Environmental Protection and Research (ISPRA). Consumo di Suolo, Dinamiche Territoriali e Servizi Ecosistemici; 248/2016; ISPRA: Rome, Italy, 2016.
  17. Falcucci, A.; Maiorano, L.; Boitani, L. Changes in land-use/land-cover patterns in Italy and their implications for biodiversity conservation. Landsc. Ecol. 2007, 22, 617–631. [Google Scholar] [CrossRef]
  18. Romano, B.; Zullo, F. The urban transformation of Italy’s adriatic coastal strip: Fifty years of unsustainability. Land Use Policy 2014, 38, 26–36. [Google Scholar] [CrossRef]
  19. Marchetti, M.; Ottaviano, M.; Pazzagli, R.; Sallustio, L. Consumo di suolo e analisi dei cambiamenti del paesaggio nei Parchi nazionali d’Italia. Territorio 2013, 66, 121–131. [Google Scholar] [CrossRef]
  20. Agnoletti, M. The Italian Historical Rural Landscape. Cultural Values for the Environment and Rural Development; Springer: Dordrecht, The Netherlands, 2012. [Google Scholar]
  21. Sitzia, T.; Semenzato, P.; Trentanovi, G. Natural reforestation is changing spatial patterns of rural mountain and hill landscapes: A global overview. For. Ecol. Manag. 2010, 259, 1354–1362. [Google Scholar] [CrossRef]
  22. Scarascia-Mugnozza, G.; Oswald, H.; Piussi, P.; Radoglou, K. Forests of the Mediterranean region: Gaps in knowledge and research needs. For. Ecol. Manag. 2000, 132, 97–109. [Google Scholar] [CrossRef]
  23. Apollonio, C.; Balacco, G.; Novelli, A.; Tarantino, E.; Piccinni, A. Land Use Change Impact on Flooding Areas: The Case Study of Cervaro Basin (Italy). Sustainability 2016, 8, 996. [Google Scholar] [CrossRef]
  24. Amato, F.; Maimone, B.A.; Martellozzo, F.; Nolè, G.; Murgante, B. The Effects of Urban Policies on the Development of Urban Areas. Sustainability 2016, 8, 297. [Google Scholar] [CrossRef] [Green Version]
  25. Zitti, M.; Ferrara, C.; Perini, L.; Carlucci, M.; Salvati, L. Long-Term Urban Growth and Land Use Efficiency in Southern Europe: Implications for Sustainable Land Management. Sustainability 2015, 7, 3359–3385. [Google Scholar] [CrossRef]
  26. Navarro, L.M.; Pereira, H.M. Rewilding abandoned landscapes in Europe. In Rewilding European Landscapes; Springer: Berlin/Heidelberg, Germany, 2015; pp. 3–23. [Google Scholar]
  27. Marchetti, M.; Vizzarri, M.; Lasserre, B.; Sallustio, L.; Tavone, A. Natural capital and bioeconomy: Challenges and opportunities for forestry. Ann. Silvic. Res. 2014, 38, 62–73. [Google Scholar]
  28. Agnoletti, M. Rural landscape, nature conservation and culture: Some notes on research trends and management approaches from a (southern) European perspective. Landsc. Urban Plan. 2014, 126, 66–73. [Google Scholar] [CrossRef]
  29. Pisanelli, A.; Chiocchini, F.; Cherubini, L.; Lauteri, M. Combining demographic and land-use dynamics with local communities perceptions for analyzing socio-ecological systems: A case study in a mountain area of Italy. iForest 2012, 5, 163–170. [Google Scholar] [CrossRef]
  30. Gallant, L.A.; Loveland, R.T.; Sohl, L.T.; Napton, E.D. Using an Ecoregion Framework to Analyze Land-Cover and Land-Use Dynamics. Environ. Manag. 2004, 34, S89–S110. [Google Scholar] [CrossRef]
  31. Martínez-Fernández, J.; Ruiz-Benito, P.; Zavala, M.A. Recent land cover changes in Spain across biogeographical regions and protection levels: Implications for conservation policies. Land Use Policy 2015, 44, 62–75. [Google Scholar] [CrossRef]
  32. Pagliarella, M.C.; Sallustio, L.; Capobianco, G.; Conte, E.; Corona, P.; Fattorini, L.; Marchetti, M. From one- to two-phase sampling to reduce costs of remote sensing-based estimation of land-cover and land-use proportions and their changes. Remote Sens. Environ. 2016, 184, 410–417. [Google Scholar] [CrossRef]
  33. Lambin, E.F.; Geist, H. Land-Use and Land-Cover Change: Local Processes and Global Impacts; Springer: Berlin/Heidelberg, Germany, 2006; Volume 43. [Google Scholar]
  34. Loveland, T.R.; Sohl, T.; Sayler, K.; Gallant, A.; Dwyer, J.; Vogelmann, J.; Edmonds, C.M. Land Cover Trends: Rates, Causes, and Consequences of Late-Twentiethcentury US Land Cover Change; United States Environmental Protection Agency: Washington, DC, USA, 1999.
  35. Don, A.; Schumacher, J.; Freibauer, A. Impact of tropical land-use change on soil organic carbon stocks—A meta-analysis. Glob. Chang. Biol. 2011, 17, 1658–1670. [Google Scholar] [CrossRef]
  36. Newbold, T.; Hudson, L.N.; Hill, S.L.; Contu, S.; Lysenko, I.; Senior, R.A.; Börger, L.; Bennett, D.J.; Choimes, A.; Collen, B.; et al. Global effects of land use on local terrestrial biodiversity. Nature 2015, 520, 45–50. [Google Scholar] [CrossRef] [PubMed] [Green Version]
  37. Jin, G.; Li, Z.; Wang, Z.; Chu, X.; Li, Z. Impact of land-use induced changes on agricultural productivity in the Huang-Huai-Hai River Basin. Phys. Chem. Earth 2015, 79, 86–92. [Google Scholar] [CrossRef]
  38. Corbelle-Rico, E.; Crecente-Maseda, R. Evaluating IRENA indicator “Risk of Farmland Abandonment” on a low spatial scale level: The case of Galicia (Spain). Land Use Policy 2014, 38, 9–15. [Google Scholar] [CrossRef]
  39. Soulard, C.E.; Sleeter, B.M. Late twentieth century land-cover change in the basin and range ecoregions of the United States. Reg. Environ. Chang. 2012, 12, 813–823. [Google Scholar] [CrossRef]
  40. Hinojosa, L.; Napoléone, C.; Moulery, M.; Lambin, E.F. The “mountain effect” in the abandonment of grasslands: Insights from the French Southern Alps. Agric. Ecosyst. Environ. 2016, 221, 115–124. [Google Scholar] [CrossRef]
  41. Anaya-Romero, A.; Pino, R.; Moreira, J.M.; Munoz-Rojas, M.; de la Rosa, D. Analysis of soil capability versus land use change by using CORINE land cover and MicroLEIS. Int. Agrophys. 2011, 25, 395–398. [Google Scholar]
  42. Salvati, L. Agricultural Land-Use Changes and Soil Quality: Evaluating Long-Term Trends in a Rural Mediterranean Region. ISRN Soil Sci. 2013, 2013, 182402. [Google Scholar] [CrossRef]
  43. Adams, V.M.; Pressey, R.L.; Stoeckl, N. Navigating trade-offs in land-use planning: Integrating human well-being into objective setting. Ecol. Soc. 2014, 19, 53. [Google Scholar] [CrossRef]
  44. Samarasinghe, O.; Greenhalgh, S.; Eva-Terezia, V. Looking at Soils through the Natural Capital and Ecosystem Services Lens; Manaaki Whenua Landcare Research New Zealand: Lincoln, New Zeland, 2013. [Google Scholar]
  45. Doran, J.W.; Parkin, T.B. Defining and assessing soil quality. In Defining Soil Quality for a Sustainable Environment; SSSA Special Publication: Madison, WI, USA, 1994; pp. 3–21. [Google Scholar]
  46. Costantini, E.; Urbano, F.; L’Abate, G. Soil Regions of Italy. 2004. Available online: http://www.soilmaps.it/download/csi-BrochureSR_a4.pdf (accessed on 10 March 2016).
  47. Klingebiel, A.A.; Montgomery, P.H. Land Capability Classification; United States Department of Agriculture, Natural Resources Conservation Service: Fort Worth, TX, USA, 1961.
  48. Costantini, E.A.C. Metodi di Valutazione dei Suoli e Delle Terre; CRC Press: Boca Raton, FL, USA, 2006. [Google Scholar]
  49. Calzolari, C.; Ungaro, F.; Filippi, N.; Guermandi, M.; Malucelli, F.; Marchi, N.; Staffilani, F.; Tarocco, P. A methodological framework to assess the multiple contributions of soils to ecosystem services delivery at regional scale. Geoderma 2016, 261, 190–203. [Google Scholar] [CrossRef]
  50. Romero-Calcerrada, R.; Perry, G.L.W. The role of land abandonment in landscape dynamics in the SPA ’Encinares del río Alberche y Cofio, Central Spain, 1984–1999. Landsc. Urban Plan. 2004, 66, 217–232. [Google Scholar] [CrossRef]
  51. Grossi, J.L.; Chenavier, L.; Delcros, P.; Brun, J.J. Effects of landscape structure on vegetation and some animal groups after agriculture abandonment. Landsc. Urban Plan. 1995, 31, 291–301. [Google Scholar] [CrossRef]
  52. Frazer, L. Paving paradise: The peril of impervious surfaces. Environ. Health Perspect. 2005, 113, A456–A462. [Google Scholar] [CrossRef] [PubMed]
  53. European Commission. Poverty and Social Exclusion in Rural Areas; European Commission: Brussels, Belgium, 2008; Volume 187. [Google Scholar]
  54. Gnansounou, E.; Panichelli, L.; Dauriat, A.; David Villegas, J. Accounting for Indirect Land-Use Changes in GHG Balances of Biofuels; Global Bioenergy Partnership (GBEP): Rome, Italy, 2008. [Google Scholar]
  55. Plotkin, S. Property, policy and politics: Towards a theory of urban land-use conflict. Int. J. Urban Reg. Res. 1987, 11, 382–404. [Google Scholar] [CrossRef]
  56. Blum, W.E.H.; Büsing, J.; Montanarella, L. Research needs in support of the European thematic strategy for soil protection. Trends Anal. Chem. 2004, 23, 680–685. [Google Scholar] [CrossRef]
  57. European Commission. EC COMMUNICATION: Roadmap to a Resource Efficient Europe; European Commission: Brussels, Belgium, 2011; Volume 32. [Google Scholar]
  58. Vizzarri, M.; Chiavetta, U.; Chirici, G.; Garfì, V.; Bastrup-Birk, A.; Marchetti, M. Comparing multisource harmonized forest types mapping: A case study from central Italy. iForest Biogeosci. For. 2015, 8, 59–66. [Google Scholar] [CrossRef]
  59. IPCC. Good Practice Guidance for Land Use, Land-Use Change and Forestry. Practice 2003, 177, 576. [Google Scholar]
  60. Corona, P.; Barbati, A.; Tomao, A.; Bertani, R.; Valentini, R.; Marchetti, M.; Fattorini, L.; Perugini, L. Land use inventory as framework for environmental accounting: An application in Italy. iForest Biogeosci. For. 2012, 5, 204–209. [Google Scholar] [CrossRef] [Green Version]
  61. Fattorini, L.; Marcheselli, M.; Pisani, C. Two-phase estimation of coverages with second-phase corrections. Environmetrics 2004, 15, 357–368. [Google Scholar] [CrossRef]
  62. Jones, R.J.A.; Houšková, B.; Bullock, P.; Montanarella, L. Soil Resources of Europe, 2nd ed.; The European Soil Bureau: Luxembourg, 2005. [Google Scholar]
  63. Chiuchiarelli, I.; Paolanti, M.; Rivieccio, R.; Santucci, S. Soils and Landscape of Abruzzo—Environment and Territory, Soil Atlas and Soil Map of Abruzzo Region; Global Bioenergy Partnership: Avezzano, Italy, 2006. [Google Scholar]
  64. Costantini, E.; Barbetti, R.; Fantappiè, M.; L’Abate, G.; Lorenzetti, R.; Napoli, R.; Marchetti, A.; Rivieccio, R. The soil map of Italy: A hierarchy of geodatabases, from soil regions to sub-systems. In Global Soil Map; Taylor & Francis: London, UK, 2014; pp. 109–112. [Google Scholar]
  65. IUSS Working Group WRB. World Reference Base for Soil Resources 2014. International Soil Classification System for Naming Soils and Creating Legends for Soil Maps; Food and Agriculture Organization of the United Nations: Rome, Italy, 2014. [Google Scholar]
  66. Costantini, E.A.C. The Land Capability Classification. In Manual of Methods for Soil and Land Evaluation; Science Publishers: Enfield, NH, USA, 2009; p. 564. [Google Scholar]
  67. Ceccarelli, T.; Bajocco, S. Urbanisation and Land Take of High Quality Agricultural Soils-Exploring Long-term Land Use Changes and Land Capability in Northern Italy. Int. J. Environ. Res. 2014, 8, 181–192. [Google Scholar]
  68. Recanatesi, F.; Clemente, M.; Grigoriadis, E.; Ranalli, F.; Zitti, M.; Salvati, L. A Fifty-Year Sustainability Assessment of Italian Agro-Forest Districts. Sustainability 2016, 8, 32. [Google Scholar] [CrossRef]
  69. Pontius, R.G.; Shusas, E.; McEachern, M. Detecting important categorical land changes while accounting for persistence. Agric. Ecosyst. Environ. 2004, 101, 251–268. [Google Scholar] [CrossRef]
  70. European Environment Agency (EEA). Land Accounts for Europe 1990–2000: Towards Integrated Land and Ecosystem Accounting; European Environment Agency: Copenhagen, Denmark, 2006; Volume 11. [Google Scholar]
  71. Moreira, F.; Viedma, O.; Arianoutsou, M.; Curt, T.; Koutsias, N.; Rigolot, E.; Barbati, A.; Corona, P.; Vaz, P.; Xanthopoulos, G.; et al. Landscape—Wildfire interactions in southern Europe: Implications for landscape management. J. Environ. Manag. 2011, 92, 2389–2402. [Google Scholar] [CrossRef] [PubMed] [Green Version]
  72. Bucała, A. The impact of human activities on land use and land cover changes and environmental processes in the Gorce Mountains (Western Polish Carpathians) in the past 50 years. J. Environ. Manag. 2014, 138, 4–14. [Google Scholar] [CrossRef] [PubMed]
  73. Brooks, T.M.; Bakarr, M.I.; Boucher, T.; Da Fonseca, G.A.B.; Hilton-Taylor, C.; Hoekstra, J.M.; Moritz, T.; Olivieri, S.; Parrish, J.; Pressey, R.L.; et al. Coverage Provided by the Global Protected-Area System: Is It Enough? BioScience 2004, 54, 1081–1091. [Google Scholar] [CrossRef]
  74. Palombo, C.; Chirici, G.; Tognetti, R.; Marchetti, M. Is land abandonment affecting forest dynamics at high elevation in Mediterranean mountains more than climate change? Plant Biosyst. 2013, 147, 1–11. [Google Scholar] [CrossRef]
  75. Cimini, D.; Tomao, A.; Mattioli, W.; Barbati, A.; Corona, P. Assessing impact of forest cover change dynamics on high nature value farmland in Mediterranean mountain landscape. Ann. Silvic. Res. 2013, 37, 29–37. [Google Scholar]
  76. Paracchini, M.L.; Petersen, J.; Hoogeveen, Y.; Bamps, C.; Burfield, I.; van Swaay, C. High Nature Value Farmland in Europe—An Estimate of the Distribution Patterns on the Basis of Land Cover and Biodiversity Data; European Commission: Brussels, Belgium, 2008. [Google Scholar]
  77. Chan, K.M.A.; Balvanera, P.; Benessaiah, K.; Chapman, M.; Díaz, S.; Gómez-Baggethun, E.; Gould, R.; Hannahs, N.; Jax, K.; Klain, S.; et al. Opinion: Why protect nature? Rethinking values and the environment. Proc. Natl. Acad. Sci. USA 2016, 113, 1462–1465. [Google Scholar] [CrossRef] [PubMed]
  78. Italian Statistical Bureau (ISTAT). Italian National Census. 2011. Available online: http://dati.istat.it/Index.aspx?DataSetCode=DCCN_PILPRODT# (accessed on 10 March 2016).
  79. Cots-Folch, R.; Martínez-Casasnovas, J.A.; Ramos, M.C. Agricultural trajectories in a mediterranean mountain region (Priorat, Ne Spain) as a consequence of vineyard conversion plans. Land Degrad. Dev. 2009, 20, 1–13. [Google Scholar] [CrossRef]
  80. Goulart, F.F.; Salles, P.; Saito, C.H. Assessing the Ecological Impacts of Agriculture intensification through Qualitative Reasoning. In Proceedings of the 24th Int. Work. Qual. Reason., Brasilia, Brazil, 22 June 2009; Available online: http://www.qrg.northwestern.edu/papers/Files/qr-workshops/QR09/Goulart_Salles_Saito.pdf (accessed on 10 March 2016).
  81. Laiolo, P.; Dondero, F.; Ciliento, E.; Rolando, A. Consequences of pastoral abandonment for the structure and diversity of the alpine avifauna. J. Appl. Ecol. 2004, 41, 294–304. [Google Scholar] [CrossRef]
  82. Tasser, E.; Mader, M.; Tappeiner, U. Effects of land use in alpine grasslands on the probability of landslides. Basic Appl. Ecol. 2003, 4, 271–280. [Google Scholar] [CrossRef]
  83. MacDonald, D.; Crabtree, J.; Wiesinger, G.; Dax, T.; Stamou, N.; Fleury, P.; Gutierrez Lazpita, J.; Gibon, A. Agricultural abandonment in mountain areas of Europe: Environmental consequences and policy response. J. Environ. Manag. 2000, 59, 47–69. [Google Scholar] [CrossRef]
  84. Sluiter, R.; de Jong, S.M. Spatial patterns of Mediterranean land abandonment and related land cover transitions. Landsc. Ecol. 2007, 22, 559–576. [Google Scholar] [CrossRef]
  85. Hewitt, A.E.; Barringer, J.R.F.; Forrester, G.J.; McNeill, S.J. Soilscapes Basis for Digital Soil Mapping in New Zealand BT—Digital Soil Mapping: Bridging Research, Environmental Application, and Operation; Boettinger, J.L., Howell, D.W., Moore, A.C., Hartemink, A.E., Kienast-Brown, S., Eds.; Springer: Dordrecht, The Netherlands, 2010; pp. 297–307. [Google Scholar]
  86. Goldstein, J.H.; Caldarone, G.; Duarte, T.K.; Ennaanay, D.; Hannahs, N.; Mendoza, G.; Polasky, S.; Wolny, S.; Daily, G.C. Integrating ecosystem-service tradeoffs into land-use decisions. Proc. Natl. Acad. Sci. USA 2012, 109, 7565–7570. [Google Scholar] [CrossRef] [PubMed]
  87. Pagiola, S.; Platais, G. Payments for Environmental Services; Center for International Forestry Research (CIFOR): Bogor, Indonesia, 2002; Volume 4. [Google Scholar]
  88. Palomo, I.; Martín-López, B.; Zorrilla-Miras, P.; García Del Amo, D.; Montes, C. Deliberative mapping of ecosystem services within and around Doñana National Park (SW Spain) in relation to land use change. Reg. Environ. Chang. 2014, 14, 237–251. [Google Scholar] [CrossRef]
  89. Van Vliet, J.; de Groot, H.L.F.; Rietveld, P.; Verburg, P.H. Manifestations and underlying drivers of agricultural land use change in Europe. Landsc. Urban Plan. 2015, 133, 24–36. [Google Scholar] [CrossRef]
  90. Council of Europe. Landscape and Sustainable Development: Challenges of the European Landscape Convention; Council of Europe Publishing: Strasbourg, France, 2006; Volume 213. [Google Scholar]
Figure 1. The geographical location of the study area and the spatial distribution of the 3 Soil Regions (SRs) (a); and Land Capability (LC) classes (b).
Sustainability 09 00078 g001
Figure 2. The aggregation of the 64 possible land use flows into the 16 secondary processes (described by the land use classes acronym combination within the cells) and the 8 primary processes (identified by different colors). WO (Woodlands); AL (Arable lands and other herbaceous crops); PC (Permanent crops); GRA (Pastures and grasslands); OWL (Other woodlands); WAT (Humid and water areas); URB (Settlements); OTH (Other lands).
Sustainability 09 00078 g002
Figure 3. The shrinkage of the agricultural lands within the different territorial systems (SRs and LC classes) due to reforestation and urbanization processes expressed in absolute (histograms) and in relative terms with respect to their total surfaces (the dark line on the secondary axes).
Sustainability 09 00078 g003
Figure 4. The change in the Mean Agricultural Value (MAV) related to intensification and extensification processes (ΔMAV Int and ΔMAV Ext, respectively) and their net balance (ΔMAV Tot) (in million €) in Abruzzo and in the three SRs. The dark line on the secondary axes represents their respective Intensification/Extensification ratio.
Sustainability 09 00078 g004
Figure 5. The surface changed due to the intensification and extensification processes within the different LC classes expressed in relative terms with respect to their total surfaces. The dark line on the secondary axes represents their respective Intensification/Extensification ratio.
Sustainability 09 00078 g005
Figure 6. MAVs’ changes due to LUC from 1990 to 2008 in Abruzzo region and for the three SRs.
Sustainability 09 00078 g006
Table 1. Size estimates of the Land Use Change (LUC) processes that occurred from 1990 to 2008 in Abruzzo region and within the different territorial systems (SRs and LC classes), expressed as relative coverage, pi (%) and surface, a ^ (ha), with their RSEs (%) (in italic, the RSEs greater than 20%). * refer to LUC estimates greater than 2%, while ** refer to those between 1% and 2%.
AbruzzoSR ASR BSR CLC I–IILC IIILC IVLC V–VIII
pi (%) a ^ (ha)RSE (%)pi (%) a ^ (ha)RSE (%)pi (%) a ^ (ha)RSE (%)pi (%) a ^ (ha)RSE (%)pi (%) a ^ (ha)RSE (%)pi (%) a ^ (ha)RSE (%)pi (%) a ^ (ha)RSE (%)pi (%) a ^ (ha)RSE (%)
PERSISTENCE88.8 *959,8500.281.8 *216,4250.586.7 *230,4250.593.2 *511,0500.278.4 *36,3001.484.9 *375,5250.490.0 *209,7000.594.2 *336,2750.3
CHANGES11.2 *120,8251.418.2 *48,1502.113.3 *35,4252.56.8 *37,2502.521.6 *99754.515.1 *67,0501.810.0 *23,2253.15.8 *20,5753.4
REFORESTATION4.3 *46,2002.32.7 *72755.85.8 *15,4753.94.3 *23,4503.23.0 *137513.43.9 *17,4003.75.6 *12,9754.34.0 *14,4504.1
AL-FO1.2 **13,4504.31.5 **40257.82.1 *55756.60.738508.02.0 **92516.41.7 **74755.81.6 **37008.20.4135013.7
PC-FO0.225759.90.5132513.70.497516.00.127530.10.420035.50.5202511.10.127530.30.07558.0
GRA-FO2.7 *29,3002.90.5140013.33.3 *87505.33.5 *19,1503.60.522533.41.6 **72755.83.8 *88505.23.6 *12,9504.3
Others REF0.187517.00.252521.80.117537.80.017537.80.125100.50.162520.10.115041.00.07558.0
FOREST SUCCESSION0.993755.20.4105015.41.6 **43257.50.740007.90.210050.20.836758.31.1 **247510.10.931259.0
DEFORESTATION0.2240010.20.265019.60.497516.00.177517.90.417537.90.3135013.70.250022.40.137525.9
INTENSIFICATION2.7 *29,5252.97.8 *20,5503.42.4 *65006.10.5247510.06.8 *31508.75.2 *23,0753.21.1 **247510.10.282517.5
AL-PC2.4 *25,4503.17.3 *19,4003.51.7 **44757.40.3157512.66.2 *28509.14.6 *20,5753.40.7160012.50.142524.4
GRA-PC0.1132513.80.132527.70.372518.50.127530.10.15071.00.275018.30.235026.80.017538.0
GRA-AL0.227009.70.380017.70.5130013.80.160020.40.525031.70.4172512.10.250022.40.122533.5
Others INT0.05071.00.025100.00.000.00.025100.00.000.00.025100.50.025100.50.000.0
EXTENSIFICATION1.9 **20,5003.54.3 *11,2754.62.4 *63256.20.529009.35.1 *235010.13.3 *14,6004.11.0 **227510.50.4127514.0
AL-GRA1.1 **12,2004.51.8 **48757.12.0 **52256.90.4210010.92.3 *105015.31.9 **84755.40.7167512.20.3100015.9
PC-GRA0.1120014.50.495016.20.120035.30.05070.70.312544.90.297516.10.07558.00.025100.5
PC-AL0.667006.12.0 *53256.80.382517.40.155021.32.5115014.71.1 **50257.10.242524.40.010050.2
Others EXT0.040025.10.012544.70.07557.70.020035.30.125100.50.012544.90.010050.20.015041.0
URBANIZATION1.2 **12,6754.42.7 *72005.80.7182511.70.736508.26.1 *28009.21.5 **68256.01.1 **25259.90.152521.9
AL-URB0.888755.32.0 **52256.90.5125014.10.4240010.24.8 *220010.51.1 **46757.30.7172512.10.127530.3
PC-URB0.1150013.00.5122514.30.125031.60.025100.00.942524.30.2105015.50.025100.50.000.0
GRA-URB0.1140013.40.245023.60.117537.80.177517.90.312544.90.267519.30.250022.40.010050.2
Others URB0.190016.70.130028.90.115040.80.145023.60.15071.00.142524.40.127530.30.015041.0
OTHERS LUC0.015041.00.115040.80.000.00.000.00.125100.50.012544.90.000.00.000.0
Table 2. Economic effects of the LUC from 1990 to 2008 in Abruzzo region and in the three SRs expressed as change in the MAV (Mean Agricultural Value), both in absolute (€) and relative (€·ha−1) terms. * refer to LUC with a RSE greater than 20%.
MAV (€)MAV (€·ha−1)
AbruzzoSR ASR BSR CAbruzzoSR ASR BSR C
PERSISTENCE00000000
CHANGES−406,176,750−113,565,825−95,537,550−197,073,375−3362−2359−2697−5291
REFORESTATION−374,129,600−74,818,600−108,136,700−191,174,300−8098−10,284−6988−8152
AL-FO−119,245,075−46,922,625−53,397,125−18,925,325−8866−11,658−9578−4916
PC-FO−51,557,825−24,053,475−24,295,250−3,209,100 *−20,022−18,154−24,918−11,669 *
GRA-FO−203,326,700−3,842,500−30,444,325−169,039,875−6939−2745−3479−8827
Others REF0 *0 *0 *0 *0 *0 *0 *0 *
FOREST SUCCESSION00000000
DEFORESTATION23,552,4008,276,9509,159,6256,115,825981412,73493947891
INTENSIFICATION268,597,600181,212,32581,624,3755,760,9009097881812,5582328
AL-PC232,115,000163,536,20061,208,6257,370,1759120843013,6784679
GRA-PC21,432,5008,674,625 *12,197,625560,250 *16,17526,691 *16,8242037 *
GRA-AL14,261,2259,001,5007,688,000−2,428,275 *528211,2525914−4047 *
Others INT788,875 *0 *530,125258,750 *15,778 *0 *00 *
EXTENSIFICATION−165,341,200−121,258,125−51,262,2257,179,150−8065−10,755−81052476
AL-GRA−79,382,200−55,886,625−29,930,4256,434,850−6507−11,464−57283064
PC-GRA−23,414,625−16,229,750−7,230,875 *46,000 *−19,512−17,084−36,154 *920 *
PC-AL−64,966,975−49,406,750−14,483,750−1,076,475−9697−9278−17,556−1957 *
Others EXT2,422,600 *265,000 *382,825 *1,774,775 *6057 *2120 *5104 *8874 *
URBANIZATION−157,400,825−105,822,750−26,623,125−24,954,950−12,418−14,698−14,588−6837
AL-URB−112,465,900−75,785,375−19,140,125−17,540,400−12,672−14,504−15,312−7309
PC-URB−36,814,975−29,176,125−6,459,000 *−1,179,850 *−24,543−23,817−25,836 *−47,194 *
GRA-URB−8,119,950−861,250 *−1,024,000 *−6,234,700−5800−1914 *−5851 *−8045
Others URB0 *0 *0 *0 *0 *0 *0 *0 *
OTHERS LUC−1,455,125−1,155,625−299,5000−9701−770400

