Article

A Fuzzy Expression Way for Air Quality Index with More Comprehensive Information

School of Management, Shanghai University, Shanghai 200444, China
*
Author to whom correspondence should be addressed.
Sustainability 2017, 9(1), 83; https://doi.org/10.3390/su9010083
Submission received: 28 October 2016 / Revised: 25 December 2016 / Accepted: 4 January 2017 / Published: 9 January 2017

Abstract

:
The Air Quality Index (AQI) is an evaluating indicator for the atmospheric environment released by various environmental monitoring centers to communicate the present air quality status to the public, which is calculated by the aid of the monitored concentrations of six common air pollutants and relevant computational formulae. Considering that the historical data of daily overall AQI illustrated by the traditional expression way merely contain limited information about the original data, this paper puts forward a more concrete and intuitive way to express the air quality in the past day. By analyzing the data concerning individual air quality indices of pollutants gathered from five cities of China for six consecutive months and conducting the curve fitting, each sub-index is recommended to be set as a Gaussian fuzzy number. Accordingly, taking advantage of the novel operational law for fuzzy numbers, the fuzzy distribution and membership function of the daily overall AQI can be deduced immediately, which as a reference contributes to the users acquiring the information more intuitively and facilitates making plans or decisions. Subsequently, a case study taking Shanghai as a background is conducted to elaborate the application of the proposed approach. Furthermore, the line chart reflecting the overall air quality status in a past period is depicted, based on which an example of selecting a tourist destination is given to demonstrate its utilization.

1. Introduction

With the rapid development of the social economy and the remarkable improvement of people’s living standard, a healthy and comfortable life has gradually become the mainstream that more and more people chase. Meanwhile, environmental problems especially air pollution have gotten increasing attention, which are threatening the public health in a potential way across the world. Therefore, it is necessary for environmental protection departments to take some realistic effective measures to make the public know about the current air quality status, as well as associated health effects clearly. So far, many indices have been adopted to qualify the air quality level, so as to release the real-time air quality by the authority more conveniently. Such indices were firstly suggested by Lyndon and Babcock [1] in the early 1970s and had been vigorously developing since then. Among them, the Air Quality Index (AQI) has become the most widely employed index since it was pioneered in 1993, which is deemed to be a standardized summary measure of ambient air quality in many countries. Nowadays, the AQIs put forward by different scholars or organizations remain diverse, one of which gets more recognition, that proposed by the United States Environmental Protection Agency (USEPA) in 1998 that is calculated in terms of the concentrations of several representative pollutants. At present, the constitution of the criteria pollutants adopted by most countries in the world is ground-level ozone (O 3 ), PM 2.5 , PM 10 , carbon monoxide (CO), sulfur dioxide (SO 2 ) and nitrogen dioxide (NO 2 ).
In the past decades, in order to conduct an integrated assessment for different pollutants, Hamekoski [2] built a simple AQI model on account of the Pollutant Standard Index (PSI) developed by the U.S. EPA. Afterwards, Ott and Hunt [3] proposed a non-linear standardization to quantify the impact of each pollutant on air quality, whose transformation was used by the U.S. EPA later. In addition, Swamee and Tyagi [4] put forward its linear standardization. Based on their research, these methods were diffusely applied into the practical air quality evaluation. For instance, Nagendra et al. [5] carried out an empirical study on the air quality evaluation not only at the residential, but also at curbside monitoring stations in some specific cities or countries. More practical applications of the AQI can be referred to [6,7,8,9,10,11].
Subsequently, a great deal of studies on alternative indices was largely performed. According to the suggestions put forward by Swamee and Tyagi [4], Kyrkilis et al. [12] developed an aggregate AQI for Athens, Greece. Since the aggregate AQI does not clearly explain the established exposure-response relationships among the pollutants, Cairncross et al. [13] proposed a health-risk-based AQI. Wong et al. [14] and Hu et al. [15] respectively applied the aggregate AQI and the health-risk-based AQI to different regions to characterize the multi-pollutant air pollution. From the perspective of time span, Mayer et al. [16] set forth the daily AQI, and it was successfully utilized by Kumar and Goyal [17] to predict the daily air quality status. After that, Mayer and Kalberlah [18] presented a specific computational formula for long-term AQI, which was similar to the formulation of the daily AQI. Mayer et al. [19] analyzed the evolution of the integral long-term air pollution in SW Germany in terms of long-term AQI. Furthermore, taking the variety of the standard pollution concentration levels among different countries into consideration, Cheng et al. [20] discussed the optimal method to evaluate the air quality in Taiwan via the revised AQI initiated by Cheng et al. [21], which is an alternative system of the PSI and AQI system.
On the whole, most of the literature adopts the maximum operator to obtain the overall AQI. The intraday AQI depends on the pollutant with the highest Individual Air Quality Index (IAQI). Clearly, this method overlooks the impacts exerted by other pollutants on the air quality. Consequently, to obtain an integrated AQI and reflect the influence of each pollutant on air quality comprehensively, the weighted arithmetic mean function is suggested. Mandal et al. [22] brought up a method that calculates the weighted average of IAQIs as the overall AQI, in which the weights are usually obtained by using the analytical hierarchy process (AHP). Kone and Buke [23] performed the air quality evaluation of Turkey in terms of the air pollution index, which was also derived from the weighted value of four different environmental threat categories. Additionally, Li et al. [24] studied the weighted combined air pollution index to communicate the health risks in Guangdong, China. Apart from the above research methods, some novel AQIs based on the fuzzy synthetic evaluation [25,26] and fuzzy inference system [27,28,29] have been discussed from the point of view of theoretical studies.
As an index of reporting the daily air quality, the AQI has been adopted by many countries currently. In China, the environmental monitoring centers situated in different cities or provinces will release the real-time AQI, the corresponding air quality level and health guidelines to the public via their official websites or other media, which contribute to people realizing the air quality in the region where they are located. In practice, when making a tourism plan, people usually choose several cities as alternatives. However, which one will be chosen as the final destination sometimes relies on other relevant factors, such as local customs, climate, air quality status, and so on. There is no doubt that all people prefer a place with a good air quality to relax. Thus, it can be seen that the AQI as an index of measuring the air quality status plays a critical part in the process of making a travel plan. However, when the public wants to look up the historical data about the AQI (i.e., the AQI values exceeding 24 h or more), the information that they can acquire is just a total intraday AQI denoted by a mean value. It is somewhat one-sided to use the mean value to represent the AQI of the whole day, because the information about raw data illustrated by the mean value is fairly limited. Additionally, in many cases, people may want to know not only the numerical values, but also the overall fluctuation or change of air quality during a certain period of time when they formulate a travel plan. Normally, the AQI with a smaller fluctuation range indicates that the air quality is more stable. If several cities have a similar air quality level, the one with a smaller fluctuation will be considered first for most people, especially the groups who are extremely sensitive to the air. Therefore, if the historical data of the day-by-day AQI are displayed in a more comprehensive way, this can surely help the users gain more information and also is conducive to the succeeding research about the AQI for scholars. In this paper, according to the characteristics of these data, we recommend an innovative and comparatively rational way to express the everyday AQI, regarding it as a Gaussian fuzzy number. Some numerical characteristics of the fuzzy AQI involving the expectation and the standard deviation as additional messages are also provided. Finally, the application of the proposed method is interpreted in detail on account of the real data gathered from Shanghai, China.
The rest of this paper is arranged as follows. Some of the most commonly-used calculation formulae for the AQI are reviewed in Section 2. Section 3 sets forth the fuzzy expression of AQI and provides the calculation formulae of some representative numerical characteristics. Some numerical experiments based on real data are implemented to reveal the utilization and efficiency of our method in Section 4. Finally, some conclusions are summarized in Section 5.

2. Computing Methods of AQI

At present, the AQI gets increasing attention and, as an effective index to measure air quality, has been widely recognized in the world. Simultaneously, the computing methods of AQI are also being studied and improved constantly from different angles. This section is used to review some common calculating methods of the AQI.

2.1. Method of Maximum Operator for the Fraction of Concentration

In the process of determining the AQI, we need to consider all kinds of pollutants synthetically. Owning to the different geographical environment conditions and other factors, the chosen pollutants vary from country to country. In this paper, we refer to the guidelines for the reporting of daily air quality suggested by the U.S. EPA and China’s Ministry of Environmental Protection (CMEP), taking six common air pollutants into consideration: O 3 , PM 2.5 , PM 10 , CO, SO 2 and NO 2 .
This method to get the AQI is quite simple. At first, the IAQI of various pollutants can be calculated through a ratio as follows:
I A Q I i = C i S i × 100 ,
where i indicates the pollutant, I A Q I i is the individual air quality index of pollutant i, C i is the monitored concentration of pollutant i and S i is the concentration limit value of pollutant i given by the authority. Note that in Equation (1), 100 is a parameter that has no practical significance, just in order to make the value of index more intuitive. In [26], the parameter of the formula is set as 500.
Then, the value of the AQI can be obtained as:
A Q I = max ( I A Q I i ) ,
where A Q I indicates the overall air quality index.
According to the Technical Regulation on Ambient Air Quality Index (on trial) issued by the CMEP, we know that when the AQI is less than or equal to 50, the air quality is considered to be excellent and the air pollution poses little or no risk. In contrast, when the AQI is greater than 50, the air quality is not considered to be perfect at all, and the pollutant with the highest IAQI will be regarded as the primary pollutant. If the greatest IAQI corresponds to two or more pollutants, these pollutants are all primary pollutants. Moreover, the pollutant whose IAQI is more than 100 belongs to the excessive pollutant.
The purpose of citing AQI is to help people understand what local air quality means to their health. To make it easier to understand, the AQI is divided into six categories with the respective range, level and color representation. Table 1 aggregates the information of six categories and their corresponding guidance for health, which is utilized as the reference standard implemented in China and contains more abundant information than that carried out in the U.S. Then, taking Table 1 as a reference, after judging the range where the AQI value is, the official department will release the current air quality status and provide health guidance for the public with the aid of various media.

2.2. Method of Maximum Operator for the Linear Function

The basic idea of this method is calculating the sub-index values of pollutants by a linear function, but the method is initially used aiming at obtaining the PSI, which is a daily air pollution index for use by states and local air pollution control agencies in the U.S. Subsequently, in 1998, the U.S. EPA introduced the AQI still in use today, which is a revision of PSI, and this method is further applied to calculate the IAQIs of six common pollutants as follows:
I A Q I i = I A Q I H i I A Q I L o B P H i B P L o × ( C i B P L o ) + I A Q I L o ,
where C i is the monitored concentration of pollutant i and the values of other parameters (i.e., B P H i , B P L o , I A Q I H i and I A Q I L o ) can be determined via a reference table offered by the authority that will be introduced in the following part.
In 2012, the CMEP replaced the Air Polluted Index (API) with AQI to evaluate the air quality, and Equation (3) as a formula to calculate the IAQI came into use formally in China. Apart from the formula, a new reference table with regard to IAQIs and the breakpoints of the concentration mean for different pollutants in a fixed cycle (see Table 2) emerged as the times require, which is in accord with the real air quality situation of China. In Table 2, the concentration unit of SO 2 , NO 2 , PM 10 , O 3 , and PM 2.5 is μ g/m 3 , while the concentration unit of CO is mg/m 3 . Then, by referring to Table 2, the relevant parameters in Equation (3) can be identified, where B P H i is the breakpoint of concentration for pollutant i whose value is nearest and greater than or equal to the monitored concentration, B P L o is the breakpoint of the concentration for pollutant i whose value is nearest and less than or equal to the monitored concentration and I A Q I H i and I A Q I L o are the IAQI values corresponding to B P H i and B P L o , respectively. Subsequently, the AQI can be obtained directly with the help of Equation (2) similarly by the maximum operator.
By comparing the above two methods of calculating the IAQI, the second one taking advantage of the linear function to solve has gotten more attention and been used more extensively. In addition, since the parameters in Equation (3) can be ascertained easily based on a given reference table, such as Table 2, whereas the specific concentration limit values ( S i ) in Equation (1) have not been found in all of the relevant literature that we can find, we propose to adopt Equation (3) to figure out the IAQI in the following study.

2.3. Method of the Weighted Arithmetic Mean Function

The methods of calculating the AQI mentioned above have a common process, that is calculating the IAQIs of various pollutants first and then taking the maximum IAQI as the overall AQI. As we all know, the AQI is a representative index evaluating the air quality. By taking the maximum IAQI value as the overall AQI, it is obvious that the outcome has one-sidedness, which cannot synthetically reflect the integrated air quality status. In this way, the overall AQI merely depends on the primary pollutant, and the effects produced by other pollutants are neglected. To overcome the deficiencies existing in aforementioned methods and taking all pollutants into consideration, the weighted arithmetic mean function is suggested to calculate the AQI. In [22], the formula used to determine the integrated AQI is expressed as:
A Q I = i = 1 n W i I A Q I i ,
where n is the number of pollutants considered and W i is the importance weight of pollutant i that implies the degree to influence on the air quality.
When it comes to the weighted arithmetic mean function, an essential part that needs to be concerned is the respective weights of pollutants considered. Clearly, it is fairly unreasonable to assign the same weight to each air pollutant subjectively; since different air pollutants have varying health impacts and hence the corresponding weights of air pollutants are different in the determination of the overall AQI. For the sake of determining the weights of various pollutants, the AHP was applied into subsequent research by Mandal et al. [22], Khan and Sadiq [30] and Upadhyay et al. [31]. Meanwhile, other substitutable methods, such as expert scoring, fuzzy synthetic evaluation, and so on, can also be used to ascertain the weights of different pollutants.
On account of the above research and analyses, we will identify the weights of air pollutants by virtue of the AHP method and make use of the weighted arithmetic mean function to calculate the overall AQI in the following context, whose result produced in this way is generally recognized to be more reasonable and persuasive than that acquired by employing the maximum operator. Besides, considering that the AHP applied in this paper does not involve innovation and improvement in the aspect of the method, we have not interpreted the specific computing processes of determining the importance weights. Interested readers can refer to correlative literature for further understanding.

3. Fuzzy Air Quality Index

In order to let people realize the latest air quality conditions, the environmental monitoring centers located in most cities or provinces will duly broadcast the real-time AQI and the current air quality level, some of which may release more specific information, such as respective average concentrations, the IAQIs of six common pollutants, and so on.
In Section 2, we have already described the concrete computing methods of the real-time AQI in detail and explained how the monitoring centers publish the current air quality status on the basis of the foregoing computing results and relevant reference tables given by the authority. As is known to us all, the AQI is updated every hour, which means it has 24 values released in one day, which can reflect the air quality status of each hour separately. For most users, when they glance over the historical data of the AQI more than 24 h, what they may want to know more is the integrated AQI with comprehensive information of a whole day or a variation tendency of everyday AQI rather than the real-time AQI released every hour in the past day or over the past certain period of time. If the environmental monitoring centers release all 24 real-time AQIs of each passing day in the process of the subsequent information release, it is pretty difficult for the users to extract the key information they need rapidly from such data. In such a case, the mean value of 24 real-time AQIs is adopted by monitoring centers to indicate the intraday AQI and offered to the users as a reference. However, since the information illustrated by the mean value only contains a few characteristics of the raw data and it is extremely vulnerable to extreme values, it cannot reveal the intraday air quality status sufficiently. In other words, the mean value is not an utterly suitable way in expressing the daily AQI. Therefore, it is necessary to find a more appropriate and intuitive way to describe the integrated AQI of a whole day better.
Considering that the AQI is obtained by calculation of the IAQIs, before exploring a proper way to describe the daily AQI, it is logical to express the IAQI in a suitable way first. Consequently, we gather plenty of data about the concentrations of six common pollutants from five cities in China (i.e., Beijing, Shanghai, Guangzhou, Wuhan and Chengdu) since January–June in 2016 and then calculate their corresponding IAQIs according to Equation (3). From the perspective of forming mechanisms, it is somewhat inappropriate to assume the everyday IAQI to be a random variable due to the vagueness in the process of monitoring pollutant concentrations. It may be comparatively rational to depict the intraday IAQI of each pollutant by means of an interval number. However, interval numbers barely specifying a general range where the data are cannot portray the characteristics of this type of data entirely, and the practical distribution of the real-time IAQIs for each pollutant is not exhibited by it. For instance, the concentrations of PM 2.5 gathered in Shanghai and the corresponding IAQIs calculated by Equation (3) are shown in Table 3. In terms of the data summarized in Table 3, we can easily find an interval including all IAQIs, i.e., ( 41 , 59 ) , but we cannot distinguish the number of IAQIs exceeding 50 or less than 50 in light of this interval. That is, the particular distribution of these IAQIs is not obtainable.
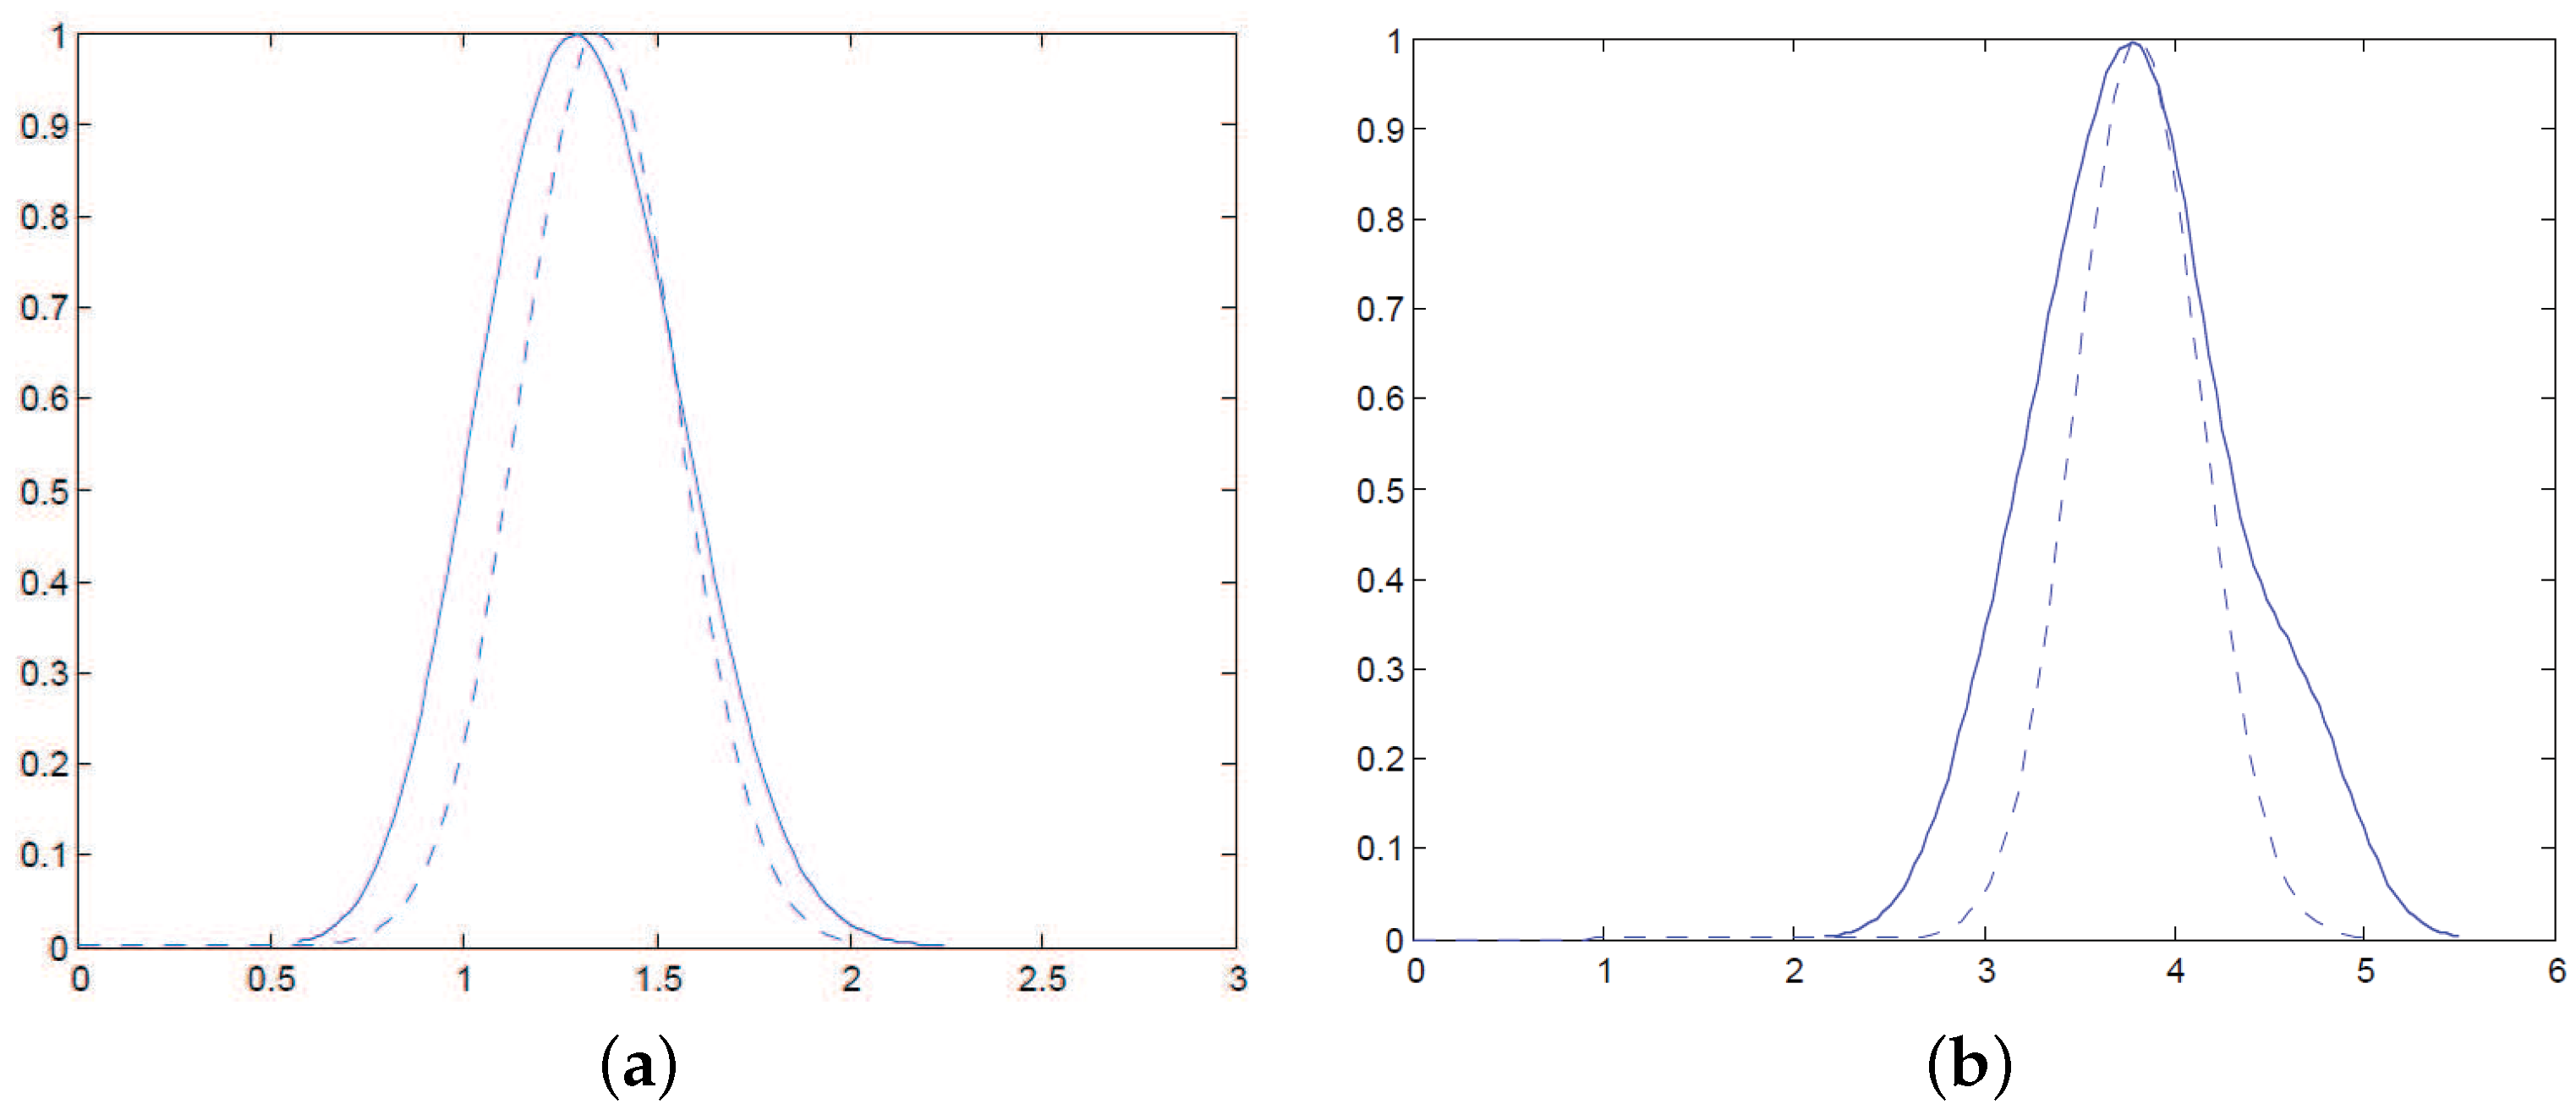
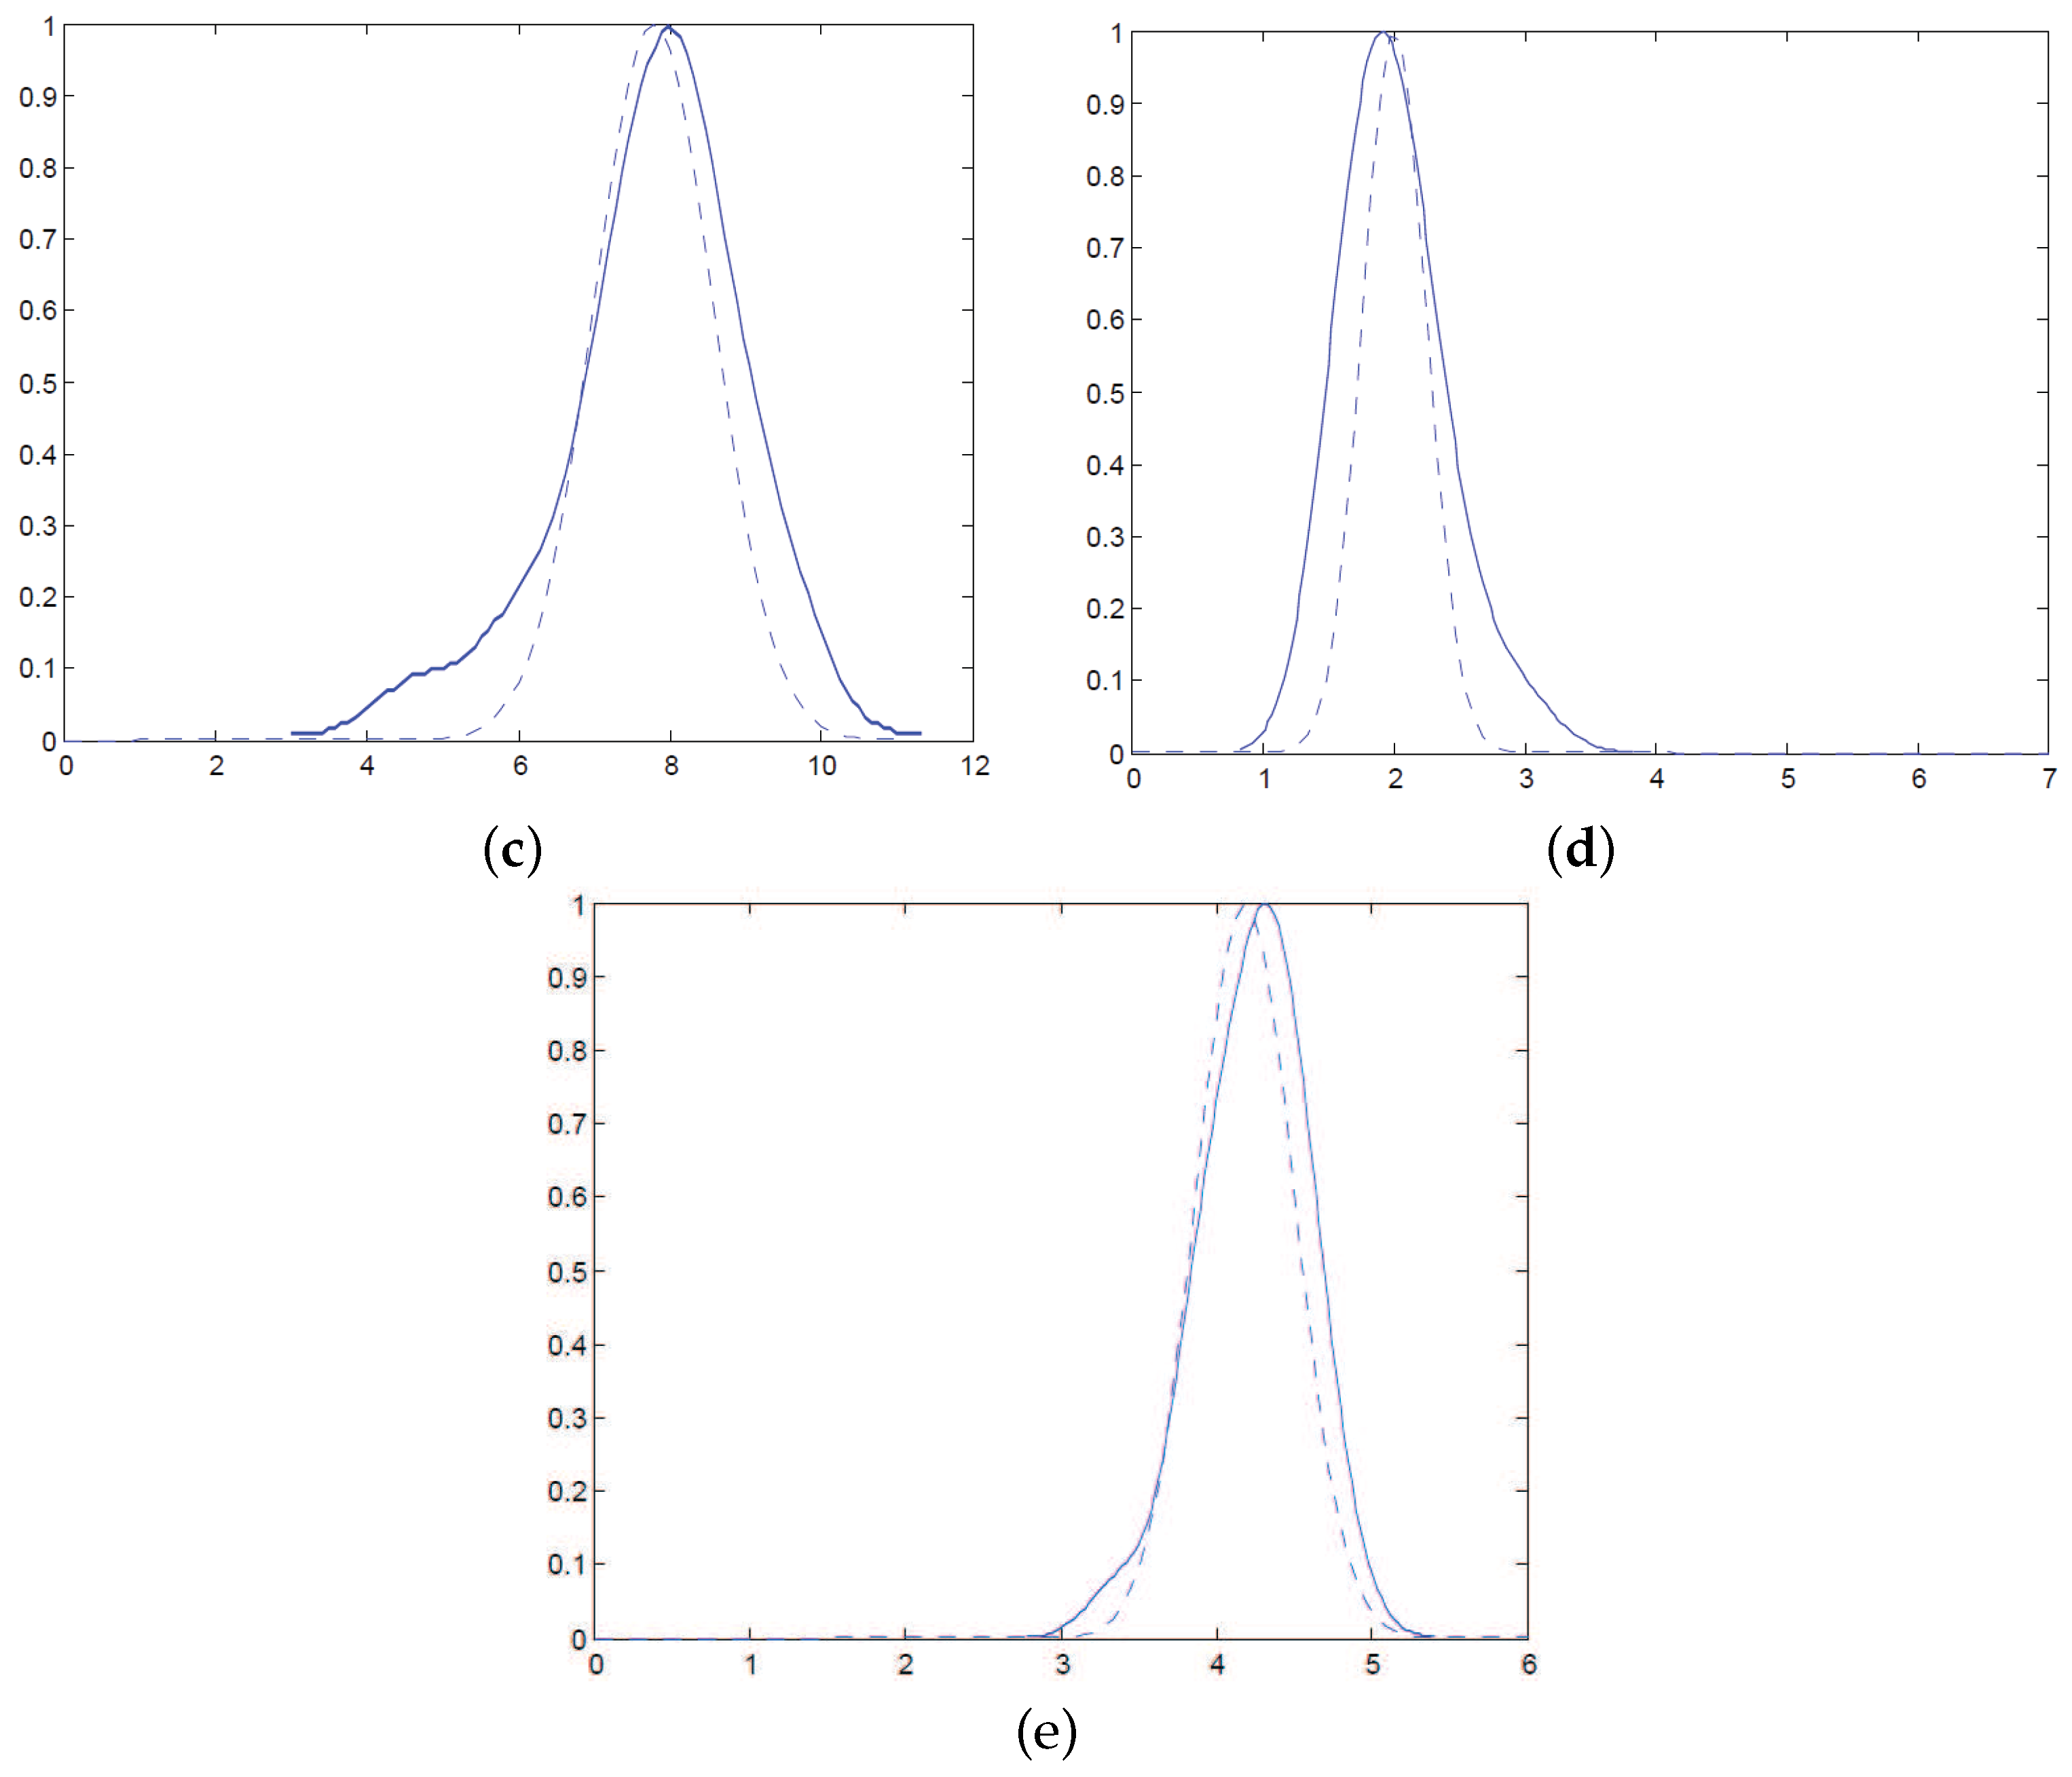
Therefore, in order to display the information of the raw data fully, after taking all circumstances mentioned above into account, we recommend using the fuzzy number to represent this type of sub-index data for completely and actually communicating the information about AQI every day. To further explore what sort of fuzzy number it belongs to, we draw a great deal of frequency distribution curves of daily 24 IAQIs for each pollutant. For simplicity, we take the IAQIs of SO 2 of one day in six months that are figured out based on the raw concentrations gathered from the environmental monitoring centers and Equation (3) as a sample (see Table 4) to show the specific frequency distributions of these data as the solid lines shown in Figure 1. Certainly, the similar distribution curves can be also obtained for other types of pollutants at different moments.
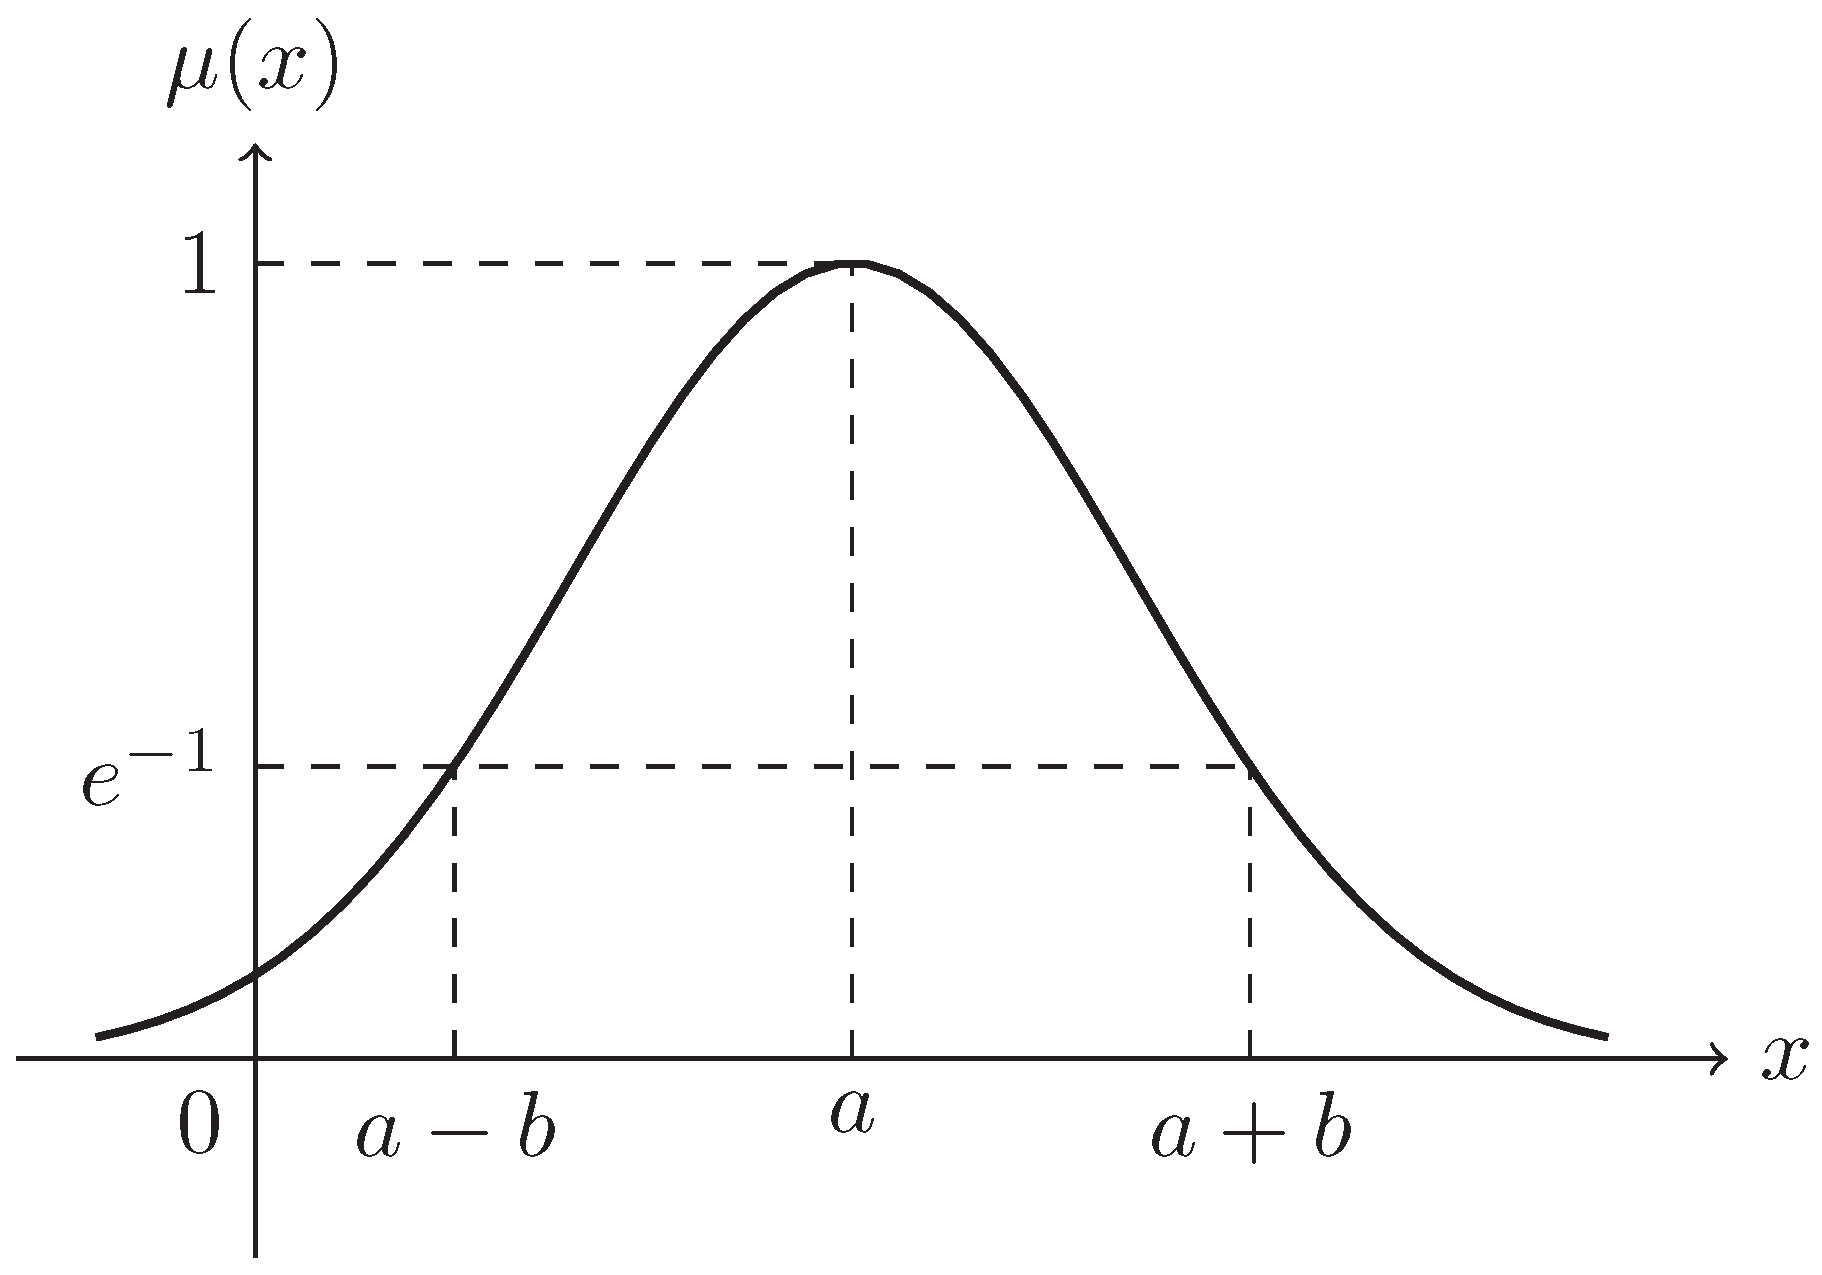
Then, the primary task is to conduct the curve fitting, that is search an appropriate membership function of the fuzzy number to approximate the frequency distribution curve of the IAQI of a whole day. By observing these frequency distribution curves, it can be seen that their variation trends are similar to the membership function diagram of the Gaussian fuzzy number (see Figure 2), whose membership function is expressed as:
μ ( x ) = e ( x a b ) 2 , x , b > 0 ,
where a is the expectation and b is the standard deviation. Accordingly, a Gaussian fuzzy number can be denoted as G ( a , b ) . On this ground, we suggest to assume the everyday IAQI to be a Gaussian fuzzy number and then inspect this assumption through the degree of curve fitting. In accordance with Equation (5), we know that a specific Gaussian fuzzy number is determined by means of the expectation and the standard deviation. It is natural and intuitive to derive the expectation and the standard deviation of the everyday IAQI for each pollutant from 24 IAQIs calculated each hour. In that way, making use of the data aggregated in Table 4, we can figure out the expectation and the standard deviation of the IAQIs of SO 2 for each city respectively. Following that, the crisp expressions of membership functions are obtained, which are also depicted in Figure 1 using the dotted lines. Through the comparative analysis for the solid lines and dotted lines displayed in Figure 1, it can be concluded that the frequency distribution curves can be fitted with the membership functions of the Gaussian fuzzy number well. In other words, the everyday IAQI of SO 2 roughly follows the fuzzy Gaussian distribution. Moreover, the same conclusions can be also drawn for other types of pollutants in those five cities on any day of six months. Therefore, the assumption has been verified, and the daily IAQI is then supposed to be a Gaussian fuzzy number.
In this way, daily IAQIs of six pollutants can be expressed as six Gaussian fuzzy numbers, and the daily overall AQI is calculated by:
A Q I = i = 1 6 W i I A Q I i ,
where W i is the importance weight of each pollutant determined by the AHP and I A Q I i is the fuzzy individual air quality index of pollutant i. It is apparent that the overall AQI is also a fuzzy number. In order to achieve the concrete distribution of this fuzzy number, we introduce the following operational law put forward by Zhou et al. [32].
Let ξ 1 , ξ 2 , , ξ n be independent regular LRfuzzy numbers with credibility distributions Φ 1 , Φ 2 , ,   Φ n , respectively. If the function f ( x 1 , x 2 , , x n ) is strictly increasing with respect to x 1 , x 2 , , x n , then ξ = f ( ξ 1 , ξ 2 , , ξ n ) is a regular LR fuzzy number with inverse credibility distribution:
Ψ 1 ( α ) = f ( Φ 1 1 ( α ) , Φ 2 1 ( α ) , , Φ n 1 ( α ) ) .
Assume that intraday IAQIs of air pollutants considered are Gaussian fuzzy numbers denoted by G ( a i , b i ) with credibility distributions Φ i , i = 1 , 2 , , 6 . According to the mathematical characteristics of Gaussian fuzzy numbers, we can arrive at a conclusion that all of them are independent regular LR fuzzy number, whose inverse credibility distribution can be expressed as:
Φ i 1 ( α ) = a i b i ln ( 2 α ) , if   α 0.5 a 1 + b i ln ( 2 2 α ) , if   α > 0.5 .
Since the weights of each pollutant W i , i = 1 , 2 , , 6 , are positive real numbers, the function of solving the daily overall AQI, i.e., Equation (6), is strictly increasing with regard to each IAQI. Then, it can be concluded that the daily overall AQI is also a regular LR fuzzy number, on account of Equation (7), the inverse credibility distribution of which can be written as:
Ψ 1 ( α ) = i = 1 6 W i Φ i 1 ( α ) = W 1 a 1 b 1 ln ( 2 α ) + + W 6 a 6 b 6 ln ( 2 α ) , if   α 0.5 W 1 a 1 + b 1 ln ( 2 2 α ) + + W 6 a 6 + b 6 ln ( 2 ( 1 α ) ) , if   α > 0.5 = i = 1 6 W i a i i = 1 6 W i b i ln ( 2 α ) , if   α 0.5 i = 1 6 W i a i + i = 1 6 W i b i ln ( 2 2 α ) , if   α > 0.5 .
Referring to Equation (8), we can deduce that the daily overall AQI is a Gaussian fuzzy number, as well, that follows G ( i = 1 6 W i a i , i = 1 6 W i b i ) , in which i = 1 6 W i a i is its expectation and i = 1 6 W i b i is the standard deviation. At the same time, we can get the membership function of intraday AQI directly, whose corresponding graph can be also portrayed.
On the whole, the processes for the determination of the fuzzy AQI can be summarized as follows: Firstly, calculate the real-time IAQIs of each pollutant based on the raw concentrations from environmental monitoring centers and Equation (3). Secondly, calculate the expectation a i and the standard deviation b i of 24 real-time IAQIs for each pollutant respectively to obtain the fuzzy I A Q I i G ( a i , b i ) ,   i = 1 , 2 , , 6 . Thirdly, take advantage of the importance weights W i determined by the AHP and a i and b i obtained by the last step to calculate the expectation i = 1 6 W i a i and the standard deviation i = 1 6 W i b i , i = 1 , 2 , , 6 , of the fuzzy AQI that follows G ( i = 1 6 W i a i , i = 1 6 W i b i ) . Finally, write out the membership function expression of the fuzzy AQI and draw its functional image.
Until now, the overall AQI of a whole day has been redescribed in a fuzzy expression way with some numerical characteristics and the membership function. Comparing with the traditional means of expression merely demonstrating the expectation of AQI, the membership function of the fuzzy AQI together with its numerical characteristics to interpret the daily overall AQI can provide more abundant information for the users so that they are able to know about the air quality status better. The usage of this new expression way will be illustrated in detail in the next section.

4. Case Study

A novel way of describing daily overall AQI has been presented in the last section. In order to demonstrate the practical application of the fuzzy AQI, in this section, we take a typical city, Shanghai, as a subject to be investigated and assemble partial historical data from the official website of the Shanghai environmental monitoring center to illustrate it. In addition, we utilize the numerical characteristics of fuzzy AQI to draw some line charts to show the integrated air quality status in an intuitive way.

4.1. Area Description

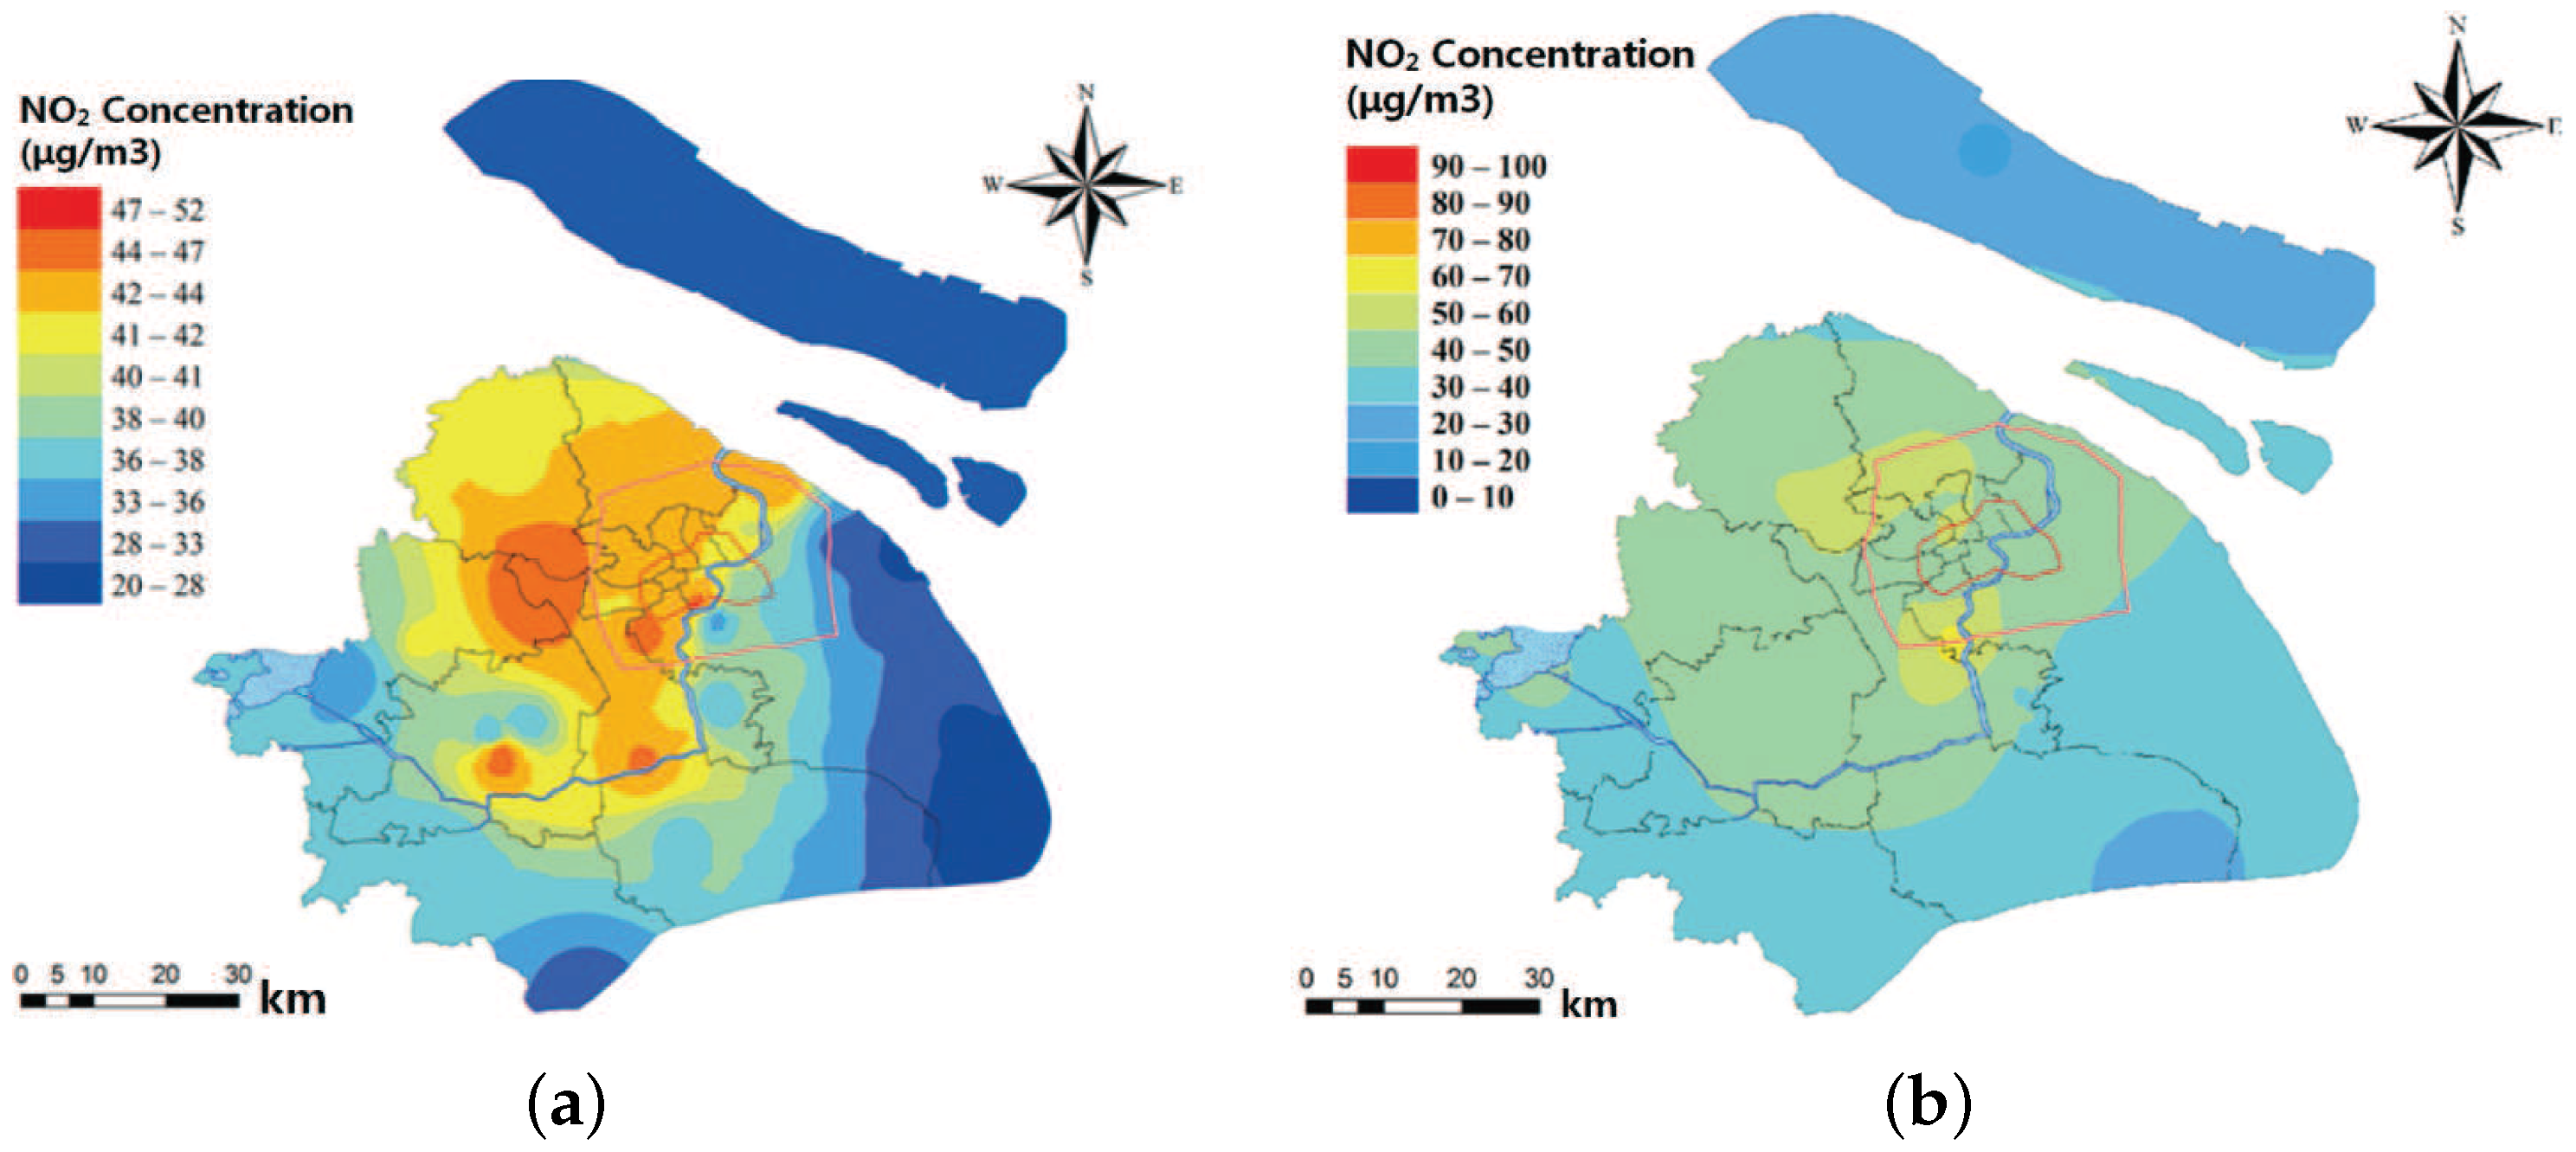
It is universally acknowledged that Shanghai is an increasing powerful city that is considered as an important international port city and the largest commercial and financial center in China, which plays an essential role in the process of China’s economy heading for prosperity. At the end of 2015, the resident population in Shanghai was more than 14 million, most of whom were external population. Along with the large population, the ownership of motor vehicles had reached 3,340,400, published by the Traffic Police Corps of Shanghai Public Security Bureau, and the published statistics had not included a large number of external vehicles yet. It is undeniable that the huge population density and the amount of car ownership will inevitably bring great pressure to the urban environment. According to the rank of AQI for China’s 74 cities released by an institute of Tianjin University in February 2016, Shanghai ranked 31. Obviously, the air quality in Shanghai is not very good comparing with other cities. In addition, by referring to the Shanghai Environmental Bulletin of the past two years [33,34], it is not difficult to find that some air pollutants gradually show signs of deterioration. To further interpret this phenomenon, take the spatial distributions of NO 2 concentrations in 2014 and 2015 (shown in Figure 3a [33] and Figure 3b [34]) as an example. As displayed in these two figures, the distributions decreased gradually beginning from downtown towards all directions. Furthermore, the data monitored in the past two years were rising on the whole, which means the pollution level of NO 2 mainly originating from emissions of industry and vehicle exhaust is deepening. However, the economy is still flourishing, and people’s demand for cars continues to grow, as well. Therefore, it is necessary for the relevant departments to pay more attention to monitoring the air pollutants so as to avoid causing worse effects on the atmospheric environment.

4.2. Data Sources

Theoretically speaking, for the sake of reflecting the city’s integrated air quality status, the monitoring stations are usually set in scattered regions. Nowadays, there are 10 monitoring stations in Shanghai recognized by the CMEP, which are respectively located in Putuo, Jingan, Pudong and other places and nearly cover all of the downtown. Since the positions of these monitoring stations and the methods to monitor the concentrations of various pollutants are consistent with the requirements proposed by the authority, the monitored concentration data gathered from these 10 stations can represent the overall air quality status of this city to a certain degree, which is released by the Shanghai environmental monitoring center on the official website. Besides the real-time concentration of each pollutant, other information can also be found on its official website, such as the current primary pollutant, the value of the overall AQI, corresponding health effects and recommendations. Meanwhile, the histogram in the past 30 days and a line chart in the past 24 h related to the intraday AQI are also depicted on the website. Whereas, when the users search the historical data about the AQI in a past period of time, a variety of data containing the daily concentration mean value, the IAQI for each pollutant and the intraday AQI are all listed in a table that is not intuitive for the users to achieve holistic information.
Therefore, in order to demonstrate how to express the intraday air quality with the help of a fuzzy AQI and enrich the form of showing the historical data, respectively, we collect the concentration value of each pollutant on 24 August 2016 and the historical data of January 2015 from the official website.

4.3. Practical Application

Up to now, we have gathered 24-h raw concentration data of six common pollutants on 24 August 2016 from the official website of the Shanghai environmental monitoring center and obtained the corresponding IAQIs based on Equation (3) and Table 2 as shown in the first 24 lines of Table 5. Additionally, since the daily IAQI of each pollutant is supposed to be a Gaussian fuzzy number and its expectation and standard deviation can be easily ascertained on the basis of 24 real-time IAQIs, then we can denote it by G ( a i , b i ) with a i and b i representing the expectation and standard deviation of pollutant i, respectively, whose fuzzy expression is listed in the second to last row of Table 5. Additionally, the weight of each pollutant W i determined via the AHP is also summarized in the last line of Table 5. As mentioned in Section 3, we know that the daily overall AQI is a Gaussian fuzzy number, as well, and it can be expressed as G ( i = 1 6 W i a i , i = 1 6 W i b i ) , i = 1 , 2 , , 6 . Based on previous results, we calculate that the expectation of intraday AQI is 27.809, and the standard deviation is 4.068. Therein, the expectation indicates the integrated level of intraday air quality, while the standard deviation indicates the degree of deviation. The expectation plus the positive and negative standard deviations can produce the range of fluctuation for the intraday overall AQI that implies a possible change of intraday air quality. In this paper, the expectation plus the positive standard deviation is called the upper bound of the intraday AQI, while the expectation plus the negative standard deviation is called the lower bound of the intraday AQI.
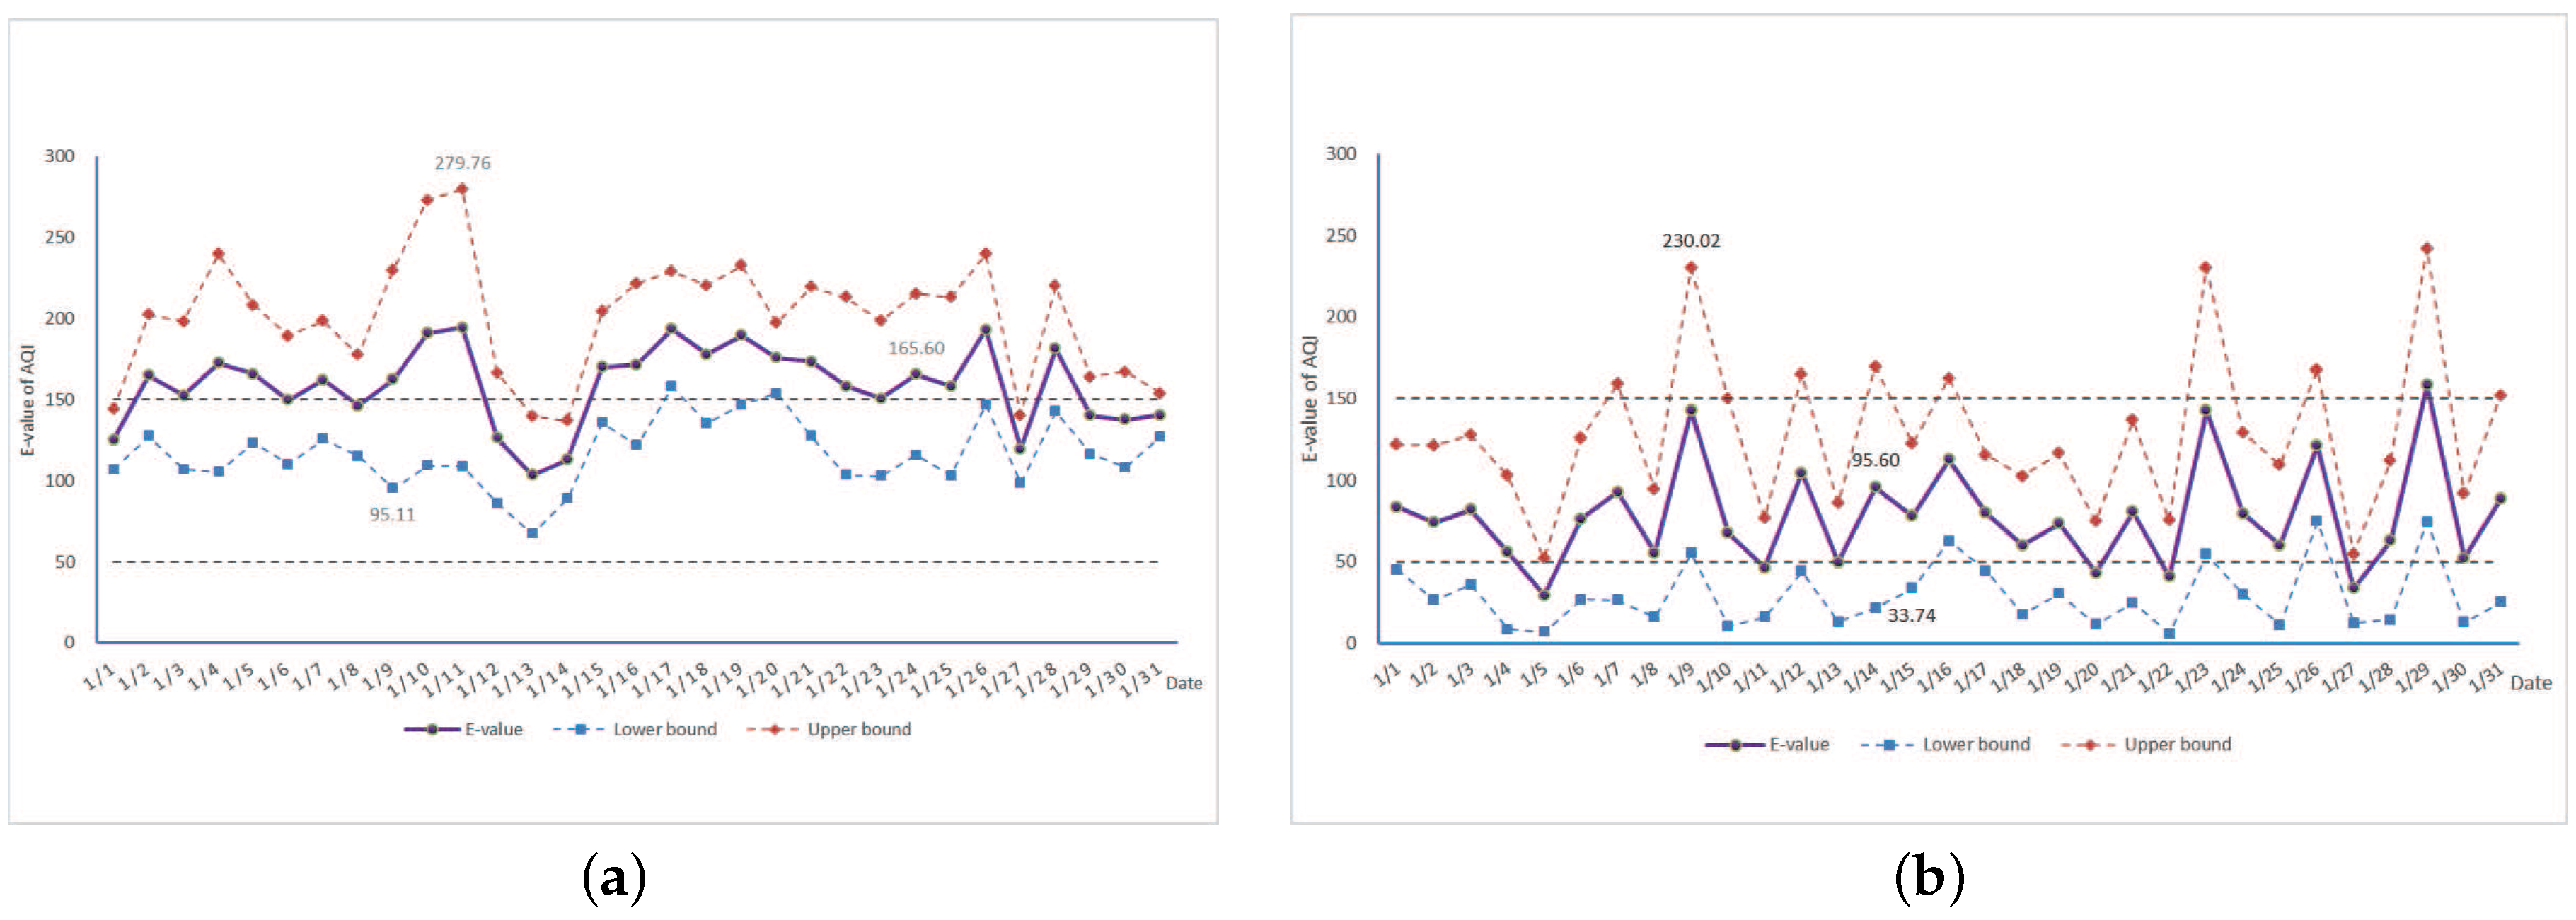
Likewise, making use of the aforementioned method to dispose the historical data gathered from the official website, we can figure out the expectation and the standard deviation of the daily AQI during January 2015 (see 
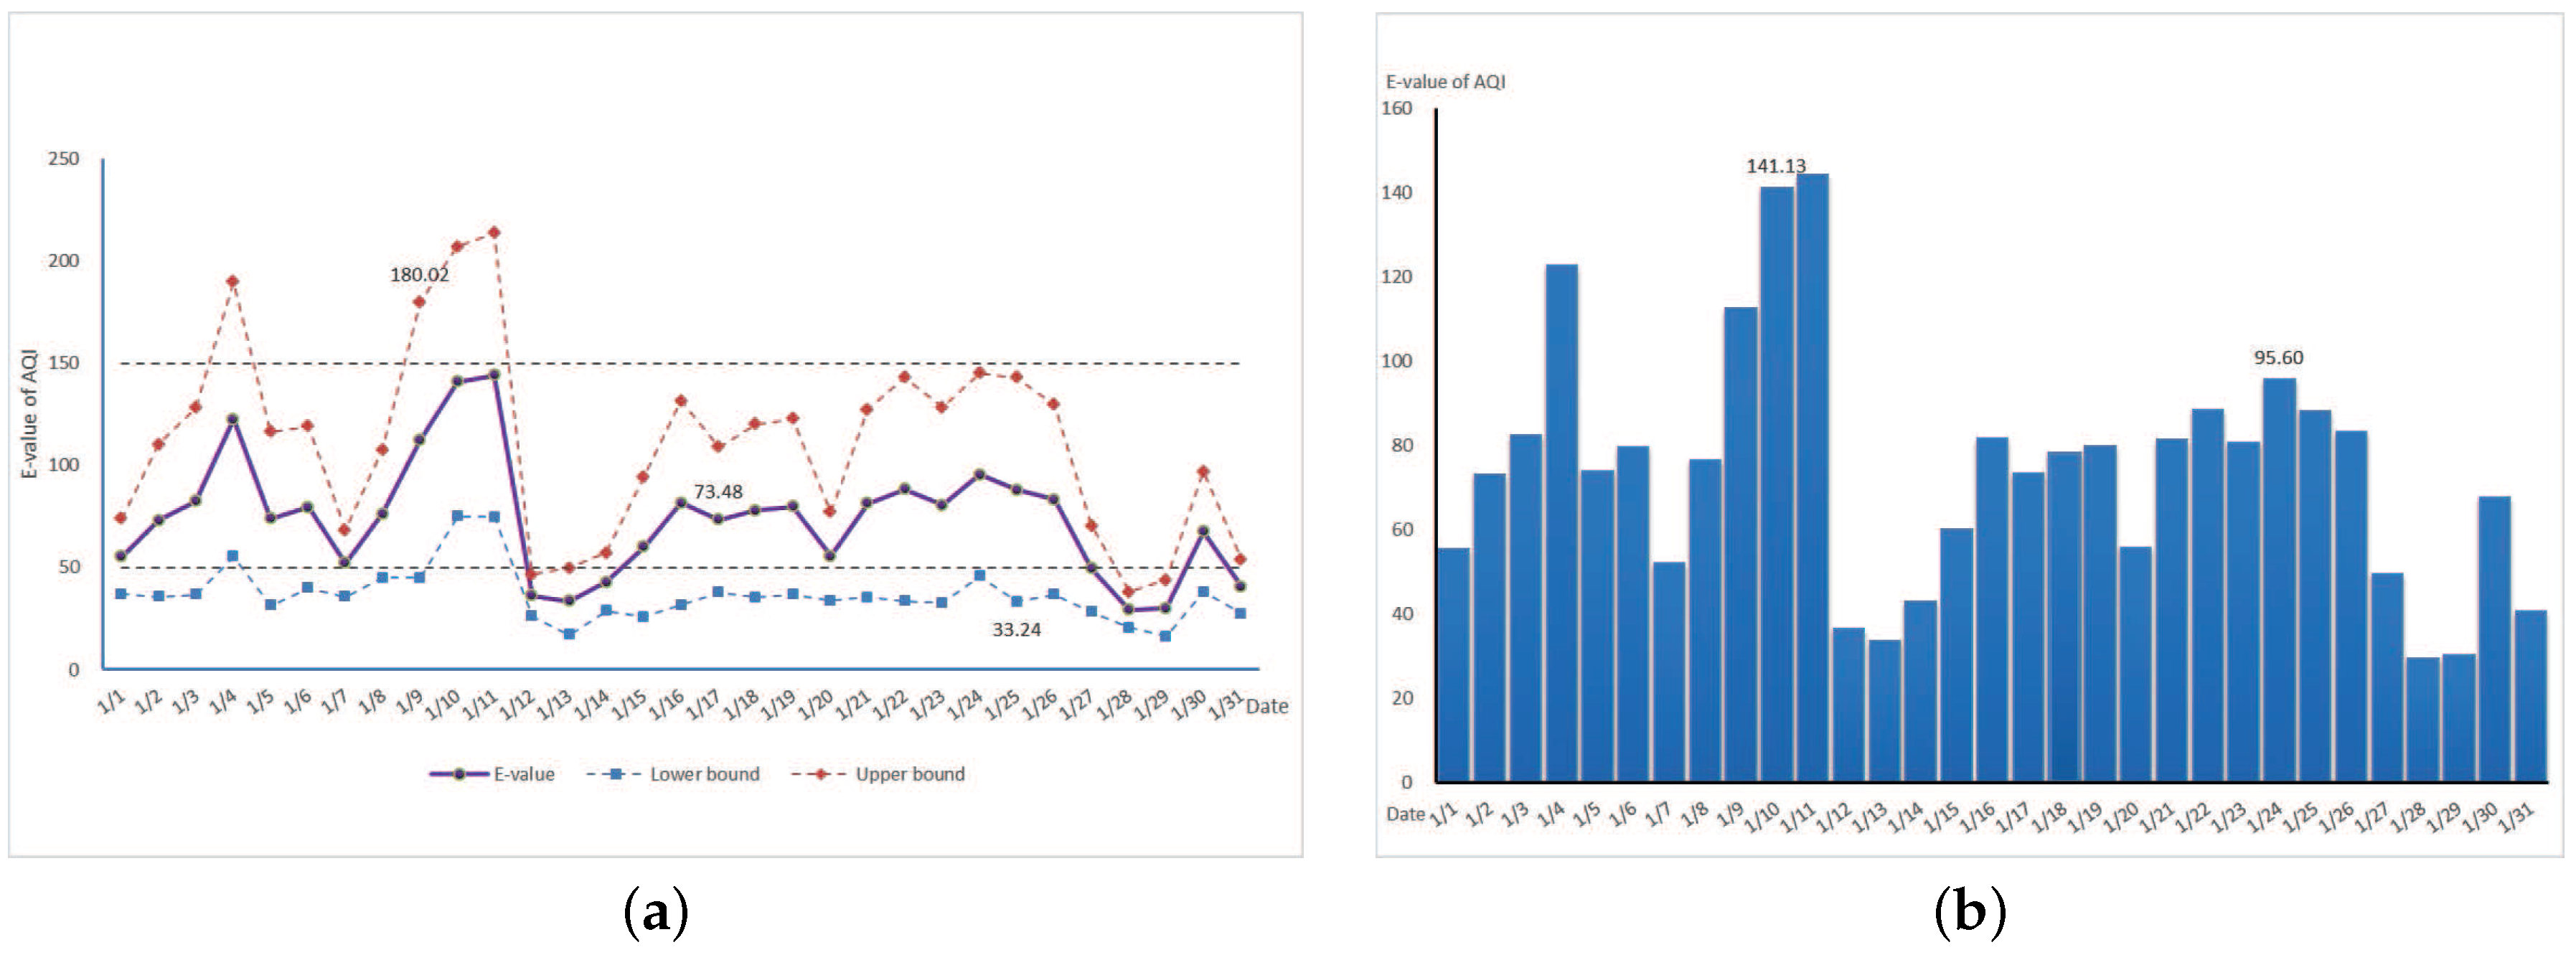
Table 6). For the sake of making the historical data look more intuitive and contributing to the users accessing the relevant information from it more expediently, the expectation line, the upper and lower bound lines are all depicted as a line chart, like Figure 4a, in which the solid line is connected by the points representing expectations, and another two dotted lines, i.e., the upper and lower bound lines, are severally composed by the results of the expectation plus the positive and negative standard deviations. The new line charts can be posted on the website, where the coordinates of all points appear dynamically when the users move their mouse pointer to them. Here, in order to make the line charts look more concise and clear, we mark the coordinates of three points as a demonstration. Moreover, to increase the readability of the line charts, two horizontal lines representing different air quality levels are drawn in these line charts, whose values are 50 and 150, respectively, based on which the users can identify the overall air quality status preliminarily. The points on the lines below the horizontal line whose value is 50 imply that the air quality is excellent, and the air pollution poses little or no risk, while the points on the lines above the horizontal line whose value is 150 imply that the air quality is moderately polluted and everyone may begin to experience some adverse health effects. Generally speaking, the expectation line with a smaller fluctuation signifies that the air quality in this period is more stable. Additionally, ordinarily, the larger the space between the point on the solid line and the corresponding point on the dotted line is, the more volatile the air quality of the day is. Comparing with Figure 4b shown on the official website currently, the line chart presented by us contains more ample information, not only the integrated air quality status, but also the stability of air quality in a day or a certain period of time, which is more intuitive and helpful for the users to acquire the information and make decisions. Certainly, the time span of the historical data displayed by the aid of the line charts can be also extended for more than a month.
In practice, while making a long-term travel plan in February 2015, suppose that the decision maker had chosen three cities (e.g., Shanghai, City A and City B) as the alternative travel destinations. As far as how to choose a more appropriate city as the destination to tour, the AQI as an influencing factor could be taken into account. According to the historical data of last month, the line charts with some mathematical characteristic values of fuzzy AQIs of these cities have been depicted as Figure 4a and Figure 5a,b. By contrast, we can observe that the expectations of AQIs mainly fluctuate between 100 and 200 in Figure 5a, and the position of the solid line is the highest on the whole. Then, referring to the classifications of AQI in Table 1, we conclude that the overall air quality levels in Shanghai and City B during this period are similar and better than that in City A. Moreover, the air quality status of Shanghai is considered to be more steady due to the expectation line of AQI, namely the solid line, with a smaller fluctuation in Figure 4a. Additionally, the number of points on the upper bound line above the horizontal line whose value is 150 is less than that of City B. Therefore, Shanghai is deemed to be more comfortable for travelers who belong to the sensitive group and has a greater chance of being chosen as a tourist destination among these alternative cities. On occasion, the decision makers merely want to set a short-term travel plan, and the focus they concentrate on usually lies in the everyday air quality fluctuations. The space between the point on the solid line and the points on the dotted lines can reveal the range of fluctuation for everyday air quality to some extent. With the space narrowing, it means that everyday, air quality is becoming progressively more stable.
To sum up, based on the concentration data gathered from the Shanghai monitoring centers, we have described how to make use of the new approach to interpret the overall AQI of a whole day. Following the new expression, a more intuitive line chart is presented. Similarly, the line charts of IAQIs for each pollutant can also be drawn, which can be utilized by the environmental protection departments to observe the treatment effects of air pollutants, and so on, in the future.

5. Conclusions

In this paper, we applied the fuzzy set theory to the air quality assessment and put forward the fuzzy AQI after comprehensive analysis for IAQIs of each air pollutant considered. On account of the novel fuzzy expression way, the overall AQI in a past certain day can be described by a Gaussian fuzzy number with its corresponding membership function, while the overall AQI in a past certain period can be illustrated by the line charts portrayed with the help of mathematical characteristic values of the fuzzy AQI. To further interpret the utilization of the approach we proposed, a practical example of selecting the final tourist destination between Shanghai and another two cities was cited.
The AQI is an important index for reporting the air quality status that is published once per hour. In the present paper, an exploration based on the fuzzy AQI was performed to describe the past air quality conditions in a more applicable way. As for the future research: (1) It is also exercisable if the evaluating indicator is extended to forecast the future information under the condition that the daily AQI is assumed to be a fuzzy number. Therefore, the quantitative study on the relationship between the fuzzy AQI and a number of indices, such as temperature, humidity, etc., can be done with the aid of the fuzzy regression method. (2) In consideration of the vagueness and inaccuracy of linguistic descriptions when conducting pair-wise comparisons to construct the judgment matrix in the AHP, the weight of each air pollutant considered in the weighted arithmetic mean function can be also set as a fuzzy number in the future research. (3) To improve the usefulness of the fuzzy AQI for the end users, an exploration for interpreting the relevant information summarized from the novel expression way in a popular and easy-to-understand text description language can be implemented.

Acknowledgments

This work was sponsored by “Shuguang Program” supported by Shanghai Education Development Foundation and Shanghai Municipal Education Commission (Grant No. 15SG36).

Author Contributions

Jian Zhou conceived and designed the experiments. Yujie Wang collected the related experimental data, performed the experiments and wrote the draft of the paper. Mingxuan Zhao conducted the literature review and completed the analytical results. Yulin Han helped Yujie Wang to improve the English expression of the paper. All authors read and approved the final manuscript.

Conflicts of Interest

The authors declare no conflict of interest.

References

  1. Lyndon, R.; Babcock, J. A combined pollution index for measurement of total air pollution. J. Air Pollut. Control Assoc. 1970, 20, 653–659. [Google Scholar]
  2. Hamekoski, K. The use of a simple air quality index in the Helsinki area, Finland. Environ. Manag. 1998, 22, 517–520. [Google Scholar] [CrossRef]
  3. Ott, W.R.; Hunt, J.W.F. A quantitative evaluation of the pollutant standards index. J. Air Pollut. Control Assoc. 1976, 26, 1050–1054. [Google Scholar] [CrossRef] [PubMed]
  4. Swamee, P.K.; Tyagi, A. Formation of an air pollution index. J. Air Waste Manag. Assoc. 1999, 49, 88–91. [Google Scholar] [CrossRef] [PubMed]
  5. Nagendra, S.M.S.; Venugopal, K.; Jones, S.L. Assessment of air quality near traffic intersections in Bangalore city using air quality indices. Transp. Res. Part D Transp. Environ. 2007, 12, 167–176. [Google Scholar] [CrossRef]
  6. Chauhan, A.; Pawar, M.; Kumar, R.; Joshi, P.C. Ambient air quality status in uttarakhand (India): A case study of haridwar and dehradun using air quality index. J. Am. Sci. 2010, 6, 565–574. [Google Scholar]
  7. Chen, B.; Lu, S.; Li, S.; Wang, B. Impact of fine particulate fluctuation and other variables on Beijing’s air quality index. Environ. Sci. Pollut. Res. 2015, 22, 5139–5151. [Google Scholar] [CrossRef] [PubMed]
  8. Eder, B.; Kang, D.; Rao, S.T.; Mathur, R.; Yu, S.; Otte, T.; Schere, K.; Wayland, R.; Jackson, S.; Davidson, P.; et al. Using national air quality forecast guidance to develop local air quality index forecasts. Bull. Am. Meteorol. Soc. 2010, 91, 313–326. [Google Scholar] [CrossRef]
  9. Genc, D.D.; Yesilyurt, C.; Tuncel, G. Air pollution forecasting in Ankara, Turkey using air pollution index and its relation to assimilative capacity of the atmosphere. Environ. Monit. Assess. 2009, 166, 11–27. [Google Scholar] [CrossRef] [PubMed]
  10. Hajek, P.; Olej, V. Predicting common air quality index-the case of czech microregions. Aerosol Air Qual. Res. 2015, 15, 544–555. [Google Scholar] [CrossRef]
  11. Kassomenos, P.A.; Kelessis, A.; Petrakakis, M.; Zoumakis, N.; Christidis, T.; Paschalidou, A.K. Air quality assessment in a heavily polluted urban Mediterranean environment through air quality indices. Ecol. Indic. 2012, 18, 259–268. [Google Scholar] [CrossRef]
  12. Kyrkilis, G.; Chaloulakou, A.; Kassomenos, P.A. Development of an aggregate AQI for an urban Mediterranean agglomeration: Relation to potential health effects. Environ. Int. 2007, 33, 670–676. [Google Scholar] [CrossRef] [PubMed]
  13. Cairncross, E.K.; John, J.; Zunckel, M. A novel air pollution index based on the relative risk of daily mortality associated with short-term exposure to common air pollutants. Atmos. Environ. 2007, 41, 8442–8454. [Google Scholar] [CrossRef]
  14. Wong, T.W.; San, T.W.W.; Yu, I.T.S.; Lau, A.K.; Pang, S.W.; Wong, A.H. Developing a risk-based air quality health index. Atmos. Environ. 2013, 76, 52–58. [Google Scholar] [CrossRef]
  15. Hu, J.; Ying, Q.; Wang, Y.; Zhang, H. Characterizing multi-pollutant air pollution in China: Comparison of three air quality indices. Environ. Int. 2015, 84, 17–25. [Google Scholar] [CrossRef] [PubMed]
  16. Mayer, H.; Makra, L.; Kalberlah, F.; Ahrens, D.; Reuter, U. Air stress and air quality indices. Meteorol. Z. 2004, 13, 395–403. [Google Scholar] [CrossRef]
  17. Kumar, A.; Goyal, P. Forecasting of daily air quality index in Delhi. Sci. Total Environ. 2011, 409, 5517–5523. [Google Scholar] [CrossRef] [PubMed]
  18. Mayer, H.; Kalberlah, F. Two impact related air quality indices as tools to assess the daily and long-term air pollution. Int. J. Environ. Pollut. 2009, 409, 19–29. [Google Scholar] [CrossRef]
  19. Mayer, H.; Holst, J.; Schindler, D.; Ahrens, D. Evolution of the air pollution in SW Germany evaluated by the long-term air quality index LAQx. Atmos. Environ. 2008, 42, 5071–5078. [Google Scholar] [CrossRef]
  20. Cheng, W.L.; Chen, Y.S.; Zhang, J.; Lyons, T.J.; Pai, J.L.; Chang, S.H. Comparison of the revised air quality index with the PSI and AQI indices. Sci. Total Environ. 2007, 382, 191–198. [Google Scholar] [CrossRef] [PubMed]
  21. Cheng, W.L.; Kuo, Y.C.; Lin, P.L.; Chang, K.H.; Chen, Y.S.; Lin, T.M.; Huang, R. Revised air quality index derived from an entropy function. Atmos. Environ. 2004, 38, 383–391. [Google Scholar] [CrossRef]
  22. Mandal, T.; Gorai, A.K.; Pathak, G. Development of fuzzy air quality index using soft computing approach. Environ. Monit. Assess. 2012, 184, 6187–6196. [Google Scholar] [CrossRef] [PubMed]
  23. Kone, A.C.; Buke, T. The evaluation of the air pollution index in Turkey. Ecol. Indic. 2014, 45, 350–354. [Google Scholar] [CrossRef]
  24. Li, L.; Lin, G.; Liu, H.; Guo, Y.; Ou, C.; Chen, P. Can the air pollution index be used to communicate the health risks of air pollution? Environ. Pollut. 2015, 205, 153–160. [Google Scholar] [CrossRef] [PubMed]
  25. Abdullah, L.; Khalid, N.D. Classification of air quality using fuzzy synthetic multiplication. Environ. Monit. Assess. 2012, 184, 6957–6965. [Google Scholar] [CrossRef] [PubMed]
  26. Onkal-Engin, G.; Demir, I.; Hiz, H. Assessment of urban air quality in Istanbul using fuzzy synthetic evaluation. Atmos. Environ. 2004, 38, 3809–3815. [Google Scholar] [CrossRef]
  27. Carbajal-Hernandez, J.J.; Sanchez-Fernandez, L.P.; Carrasco-Ochoa, J.A.; Martinez-Trinidad, J.F. Assessment and prediction of air quality using fuzzy logic and autoregressive models. Atmos. Environ. 2012, 60, 37–50. [Google Scholar] [CrossRef]
  28. Yadav, J.; Kharat, V.; Deshpande, A. Fuzzy description of air quality using fuzzy inference system with degree of match via computing with words: A case study. Air Qual. Atmos. Health 2014, 7, 325–334. [Google Scholar] [CrossRef]
  29. Sowlat, M.H.; Gharibi, H.; Yunesian, M.; Mahmoudi, M.T.; Lotfi, S. A novel, fuzzy-based air quality index (FAQI) for air quality assessment. Atmos. Environ. 2011, 45, 2050–2059. [Google Scholar] [CrossRef]
  30. Khan, F.I.; Sadiq, R. Risk-based prioritization of air pollution monitoring using fuzzy synthetic evaluation technique. Environ. Monit. Assess. 2005, 105, 261–283. [Google Scholar] [CrossRef] [PubMed]
  31. Upadhyay, A.; Kanchan, P.G.; Yerramilli, A.; Gorai, A.K. Development of fuzzy pattern recognition model for air quality assessment of Howrah city. Aerosol Air Qual. Res. 2014, 14, 1639–1652. [Google Scholar] [CrossRef]
  32. Zhou, J.; Yang, F.; Wang, K. Fuzzy arithmetic on LR fuzzy numbers with applications to fuzzy programming. J. Intell. Fuzzy Syst. 2016, 30, 71–87. [Google Scholar] [CrossRef]
  33. Shanghai Environmental Protection Bureau. Shanghai Environmental Bulletin. 2014. Available online: http://www.sepb.gov.cn/fa/cms/upload/uploadFiles/2015-06-02/file2002.pdf (accessed on 1 October 2016). [Google Scholar]
  34. Shanghai Environmental Protection Bureau. Shanghai Environmental Bulletin. 2015. Available online: http://www.sepb.gov.cn/fa/cms/upload/uploadFiles/2016-03-30/file2323.pdf (accessed on 1 October 2016). [Google Scholar]
Figure 1. The frequency distribution curves of IAQIs for SO 2 and corresponding membership function diagrams of Gaussian fuzzy numbers in five cities of China: (a) Beijing; (b) Shanghai; (c) Guangzhou; (d) Wuhan; (e) Chengdu.
Sustainability 09 00083 g001aSustainability 09 00083 g001b
Figure 2. The membership function of a Gaussian fuzzy number.
Sustainability 09 00083 g002
Figure 3. (a) The spatial distribution of NO 2 concentrations in Shanghai in 2014; (b) the spatial distribution of NO 2 concentrations in Shanghai in 2015.
Sustainability 09 00083 g003
Figure 4. (a) The expectation line, the upper and lower bound lines of the AQI in January 2015 in Shanghai; (b) the histogram of the expectation for AQI in January 2015 in Shanghai.
Sustainability 09 00083 g004
Figure 5. The expectation line, the upper and lower bound lines of the AQI in January 2015 in City A (a) and City B (b).
Sustainability 09 00083 g005
Table 1. Classifications of the Air Quality Index (AQI) and corresponding guidance for health.
Air Quality Index (AQI)LevelCategoryColorHealth EffectRecommendation
0–50Class AExcellentGreenAir quality is considered satisfactory, and air pollution poses little or no risk.People can carry out various kinds of activities casually.
51–100Class BGoodYellowAir quality is acceptable; however, some pollutants may have a little effect on the health for a minority of people who are extremely sensitive to the air.People who are extremely sensitive to the air should reduce the time for outdoor activities.
101–150Class CLightly PollutedOrangeMembers of sensitive groups may experience health effects, and the general public is likely to be affected slightly.Children, older adults and people with respiratory disease or heart disease should avoid prolonged or high-intensity outdoor activities.
151–200Class DModerately PollutedRedEveryone may begin to experience some adverse health effects, and members of the sensitive groups may experience more serious effects.Children, older adults and people with respiratory disease or heart disease should avoid prolonged or high-intensity outdoor activities. Furthermore, everyone else also needs to reduce the outdoor activities moderately.
201–300Class EHeavily PollutedPurpleIt would trigger a health alert signifying that everyone may experience more serious health effects.Children, older adults and people with lung disease or heart disease should stay indoors and everyone else reduce the outdoor activities.
>300Class FSeverely PollutedMarnoonIt would trigger health warnings of emergency conditions. The entire population is even more likely to be affected by serious health effects.Children, older adults and patients should stay indoors and everyone else avoid outdoor activities.
Table 2. Individual AQIs (IAQIs) and the breakpoints for the concentration mean of different pollutants in a fixed cycle.
IAQISO 2 24-h MeanSO 2 1-h Mean ( 1 ) NO 2 24-h MeanNO 2 1-h Mean (1)PM 10 24-h MeanCO 24-h MeanCO 1-h Mean (1)O 3 1-h MeanO 3 8-h MeanPM 2.5 24-h Mean
00000000000
505015040100502516010035
1001505008020015041020016075
1504756501807002501435300215115
20080080028012003502460400265150
3001600(2)56523404203690800800250
4002100(2)7503090500481201000(3)350
5002620(2)9403840600601501200(3)500
(1) the concentration means of 1-h SO 2 , NO 2 and CO just adapt to the real-time calculation for IAQI, but the concentration means of 24-h SO 2 , NO 2 and CO are used to calculate for a whole day; (2) the concentration mean of 1-h SO 2 higher than 800 μg/m 3 is calculated with the concentration mean of 24-h SO 2 ; (3) the concentration mean of 8-h O 3 higher than 800 μg/m 3 is calculated with the concentration mean of 1-h O 3 .
Table 3. Concentrations and IAQIs of PM 2.5 per hour in a day.
Time0:001:002:003:004:005:006:007:00
Concentration2932342931303237
IAQI41.4345.7148.5741.4344.2942.8645.7152.50
Time8:009:0010:0011:0012:0013:0014:0015:00
Concentration3334323033303534
IAQI47.1448.5745.7142.8647.1442.8650.0048.57
Time16:0017:0018:0019:0020:0021:0022:0023:00
Concentration3735384139423633
IAQI52.5050.0053.7557.5055.7158.7551.2547.14
Table 4. IAQIs of SO 2 per hour of one day among the six months for five cities.
Time0:001:002:003:004:005:006:007:008:009:0010:0011:00
Beijing1.331.331.331.002.001.001.671.001.001.671.331.33
Shanghai4.673.333.333.674.004.674.674.674.334.004.004.00
Guangzhou7.337.338.008.008.678.339.009.008.009.678.009.33
Wuhan1.672.332.003.002.001.671.671.672.332.002.332.67
Chengdu4.333.004.002.673.003.673.674.004.334.674.674.33
Time12:0013:0014:0015:0016:0017:0018:0019:0020:0021:0022:0023:00
Beijing1.331.671.331.671.331.001.001.331.331.001.671.67
Shanghai4.004.003.673.673.674.003.673.673.333.003.003.33
Guangzhou8.007.008.337.338.007.334.676.008.336.008.007.00
Wuhan2.331.671.672.002.001.672.002.001.672.002.002.00
Chengdu4.676.004.674.334.334.004.003.674.004.334.334.67
Table 5. The real-time concentrations with corresponding IAQIs, fuzzy expressions and weights of six pollutants on 24 August 2016 in Shanghai.
Time PM 2.5 IAQI of PM 2.5 PM 10 IAQI of PM 10 SO 2 IAQI of SO 2 NO 2 IAQI of NO 2 O 3 IAQI of O 3 CO IAQI of CO
00 : 00 1724.292929103.332211.010856.670.656.5
01 : 00 1825.713434134.332010.011764.170.666.6
02 : 00 1724.29313193.002211.011764.170.757.5
03 : 00 1622.86353593.00199.510150.830.666.6
04 : 00 1724.293535103.332110.511764.170.676.7
05 : 00 1724.293030113.672412.010552.500.696.9
06 : 00 1825.713434134.332010.010856.670.666.6
07 : 00 1825.713737134.333517.59346.500.747.4
08 : 00 2028.573333134.332914.510150.830.747.4
09 : 00 1927.143535124.002412.010856.670.747.4
10 : 00 2028.573434113.672311.510352.500.767.6
11 : 00 2130.003131113.672010.010352.500.747.4
12 : 00 1927.143333113.67199.513276.670.757.5
13 : 00 1825.713434113.67189.011764.170.737.3
14 : 00 1622.863535113.67178.513276.670.707.0
15 : 00 2028.573737113.67178.512772.500.696.9
16 : 00 2130.004747113.67189.012772.500.717.1
17 : 00 1825.714646113.672010.015091.670.707.0
18 : 00 1927.143737113.672311.513276.670.737.3
19 : 00 1825.714141113.672613.014486.670.727.2
20 : 00 1724.293030103.332211.012772.500.727.2
21 : 00 1825.71414193.002211.012772.500.747.4
22 : 00 1825.71343493.002311.511764.170.747.4
23 : 00 1927.14333393.002211.014486.670.727.2
Fuzzy Expression G ( 26.13 , 2.00 ) G ( 35.25 , 4.58 ) G ( 3.61 , 0.44 ) G ( 10.96 , 1.98 ) G ( 65.90 , 12.66 ) G ( 7.13 , 0.33 )
Weight0.30.10.10.20.20.1
Table 6. The expectation and standard deviation for the daily AQI in January 2015.
DateExpectationStandard DeviationDateExpectationStandard Deviation
1 / 1 40.4318.47 1 / 17 58.4835.62
1 / 2 68.1037.42 1 / 18 70.9842.40
1 / 3 77.5845.77 1 / 19 74.8343.06
1 / 4 107.6667.17 1 / 20 40.6121.72
1 / 5 68.9842.53 1 / 21 76.4345.99
1 / 6 64.6839.58 1 / 22 81.3654.78
1 / 7 37.1116.35 1 / 23 75.6347.85
1 / 8 61.4031.30 1 / 24 80.6049.67
1 / 9 107.5667.45 1 / 25 83.2555.01
1 / 10 126.1382.08 1 / 26 68.3546.45
1 / 11 129.3585.41 1 / 27 42.4821.21
1 / 12 29.3810.32 1 / 28 24.418.71
1 / 13 28.5916.34 1 / 29 23.1413.73
1 / 14 27.9814.17 1 / 30 52.6329.44
1 / 15 55.1534.24 1 / 31 35.7013.32
1 / 16 74.7349.97

