1. Introduction
With the rapid development of China’s economy, the situation of safety and production has led to an increasing number of serious problems. A variety of major accidents occur frequently. In the professional activities of the mining industry, the number of patients with diseases caused by exposure to dust, noise, radioactive materials, other toxic and harmful substances, and other factors has gradually increased [
1]. China has increased occupational safety and health legislation, increasing in turn the number of strict requirements on safety for enterprises and introducing a large number of safety regulations. In July 2016, the “occupational disease prevention law” [
2] was revised, which put forward mandatory regulatory requirements and standards for safety and health. “People oriented and paying attention to employee health and safety” has increasingly become an important symbol and a good image of modern enterprises, which is also the focus of the occupational health and safety management system OHSAS18001 [
3]. OHSAS18001 is a kind of advanced modern safety management method, which has been widely adopted by a majority of the countries in the world. It mainly emphasizes the principle of systematic health and safety management. Through the establishment of a set of occupational health and safety assurance mechanisms, the aim is to control and reduce occupational health and safety risks and to reduce production accidents and occupational diseases.
Because of the geographical position and natural conditions, the mining industry is quite different from other industries and is usually affected by many complex factors. While occupational disease can be detected by physical examination, those long-term latent diseases that are difficult (if not impossible) to cure (e.g., silicosis) can only be symptomatically treated without any special therapy. Thus, the later the disease is found, the worse the curative effect will be. Consequently, the feasible failure mode and effects analysis (FMEA) and the improved analytic hierarchy process (AHP) [
4] are used in a case study on the occupation health assessment (OHSAS18001) of the mining industry of the southwest of Hubei, China, which could provide valuable guidance for the sustainable and healthy development of the mining industry.
2. Description of FMEA and the Improved AHP
2.1. Failure Mode and Effect Analysis (FMEA)
FMEA (failure mode and effect analysis) is an effective method for analyzing product design, development, and so on [
5], for analyzing potential problems (or failure modes) in the process, for evaluating the possibility of these potential problems and their impact and severity, and for taking effective preventive measures in time to avoid or reduce these problems [
6]. FMEA emphasizes “before-the-event” rather than “after-the-fact”. Thus, it can avoid consuming a large amount of manpower and material resources to deal with the problem, improve the quality of products, reduce production and development costs, minimize fallout to a maximum extent, and increase efficiency [
7]. The basic idea of “prevention first” of FMEA is consistent with ISO standards.
2.2. Failure Mode and Effect Analysis (FMEA) Workflow
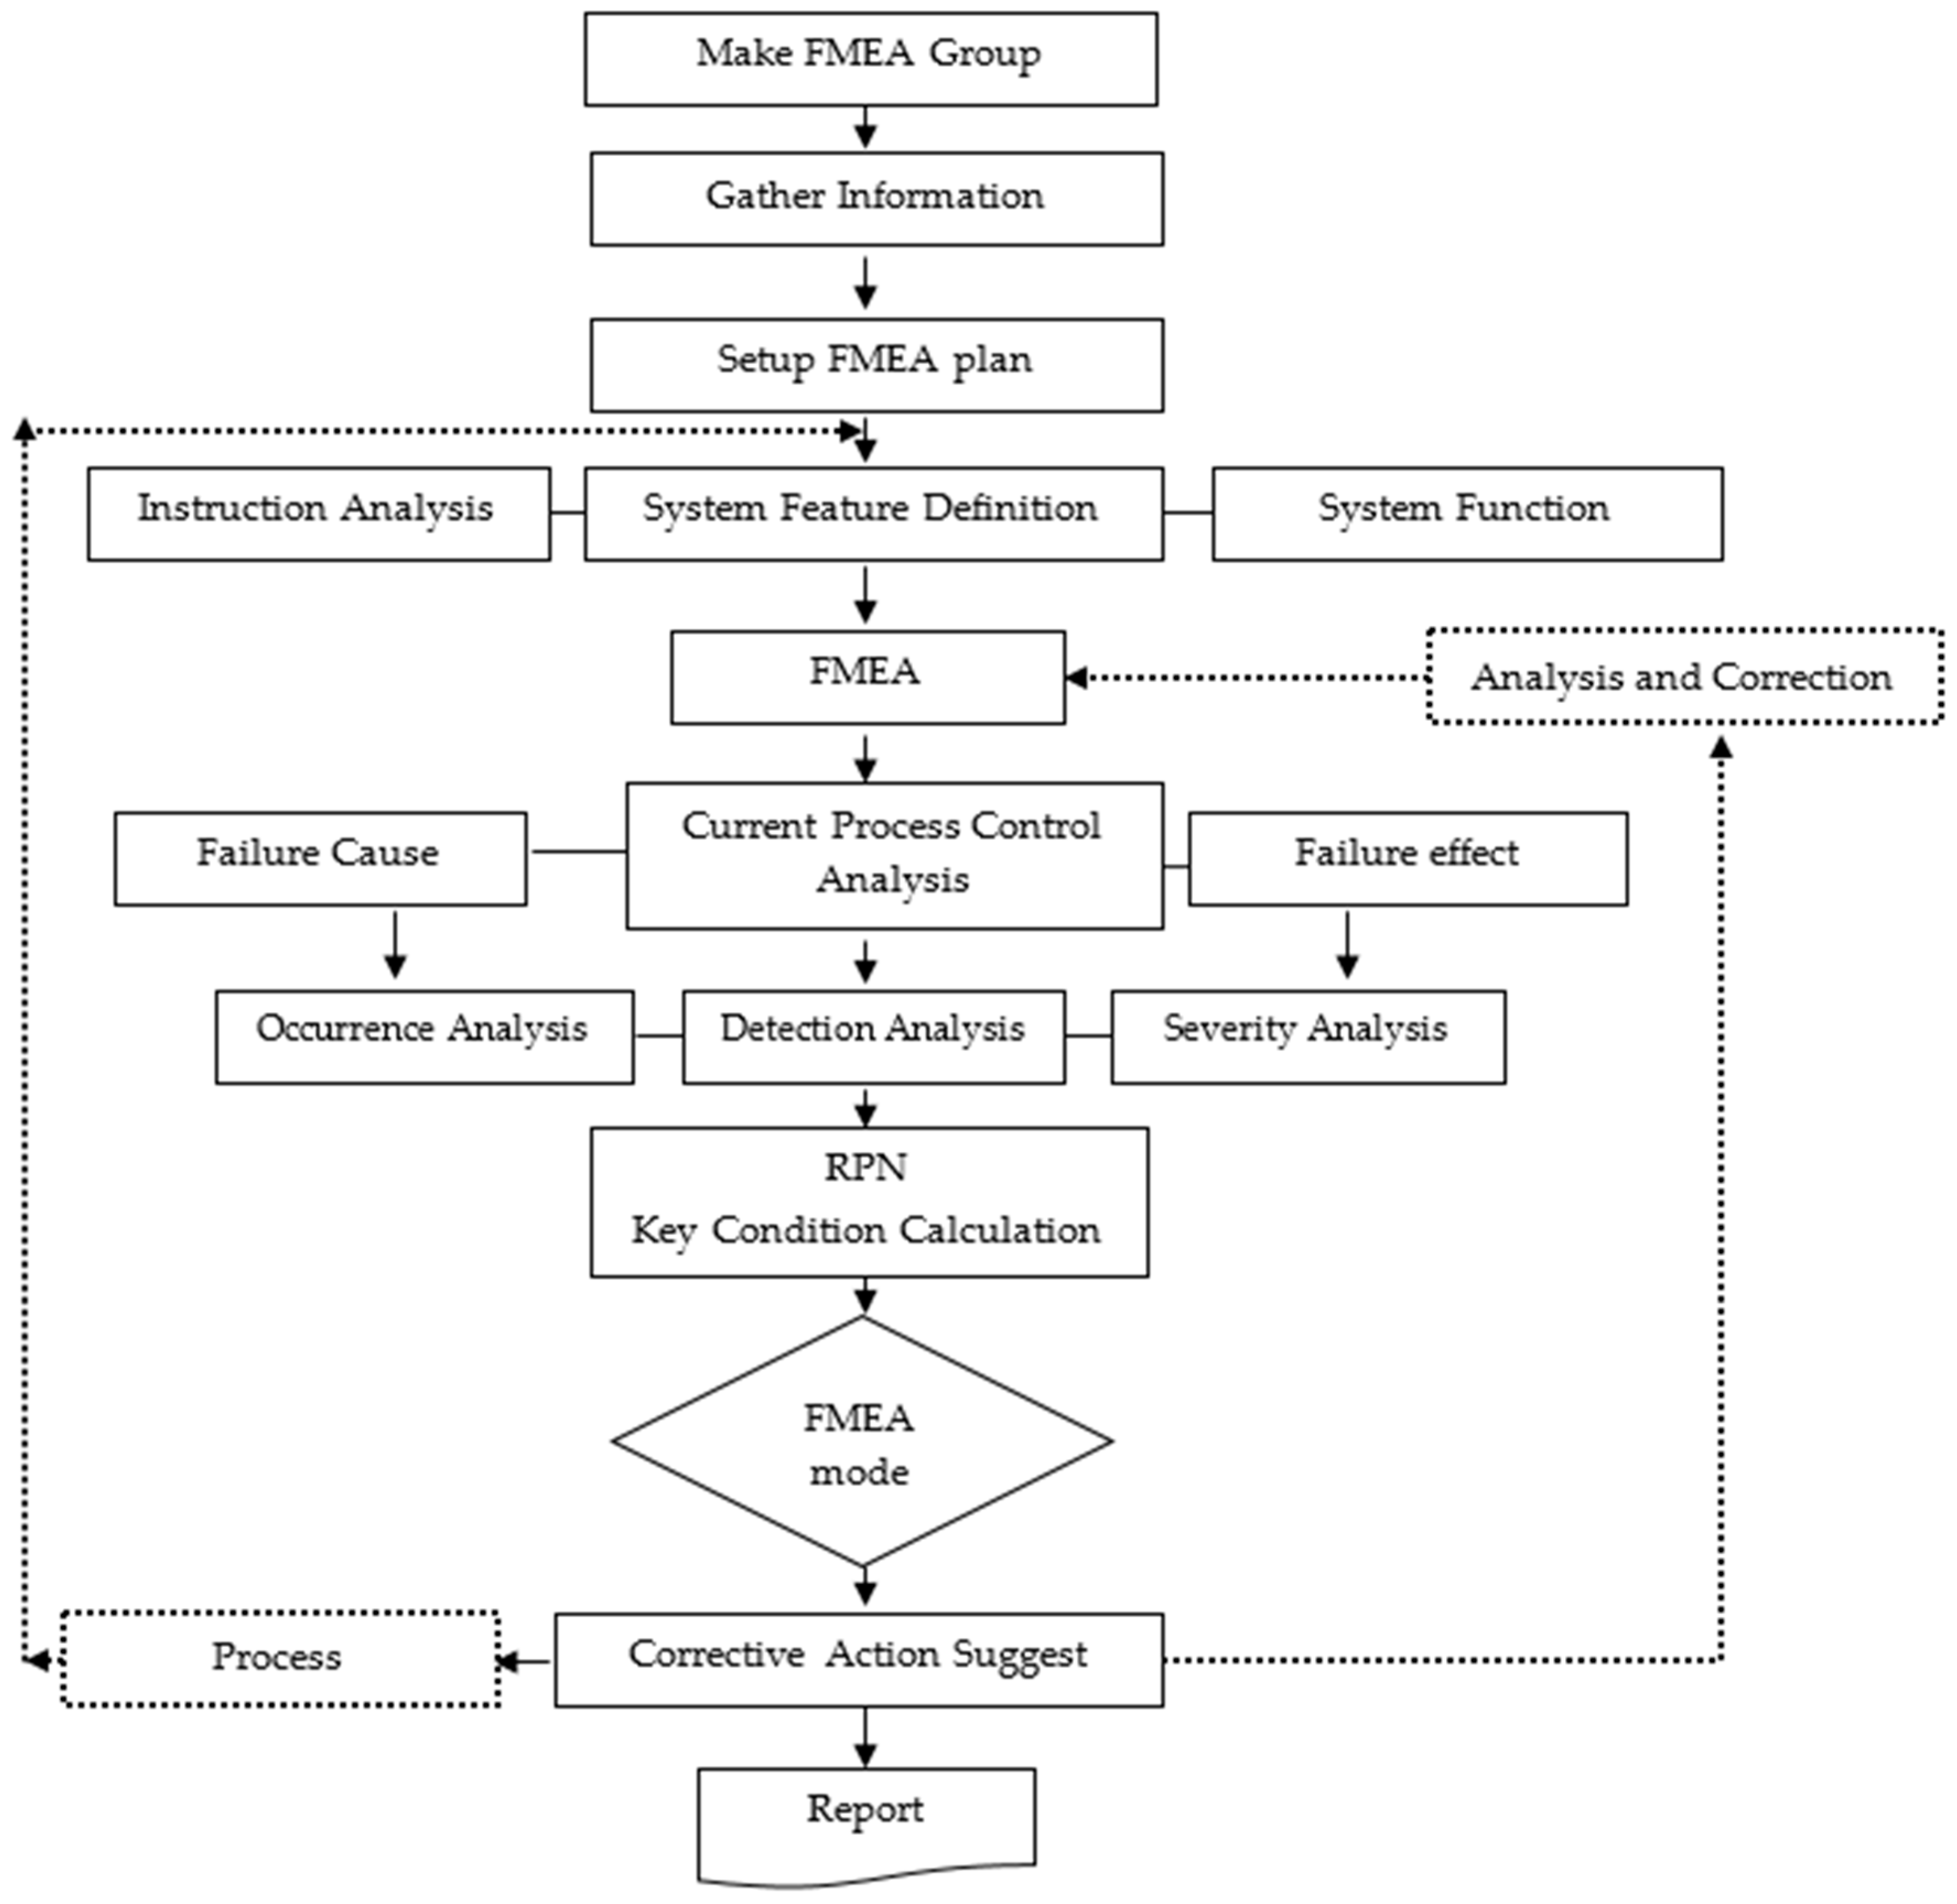
The FMEA method proceeds according to the principle of plan-do-check-action (PDCA), which focuses on occurrence analysis, detection analysis, and severity analysis [
8]. The RPN (risk priority number) value determines the FMEA mode and which kind of correction action to take. Failure mode and effect analysis (FMEA) workflow is shown in
Figure 1.
2.3. Improved Analytic Hierarchy Process (AHP)
The improved analytic hierarchy process (AHP) is based on fuzzy mathematics with the principle of fuzzy relation synthesis. It is a method for making certain unclear boundaries and non-quantitative factors quantifiable and then comprehensively evaluated [
9]. It is quantified by constructing a fuzzy set of hierarchical fuzzy subsets to reflect the fuzzy indicators being evaluated (that is to determine the membership degree), then each indicator is evaluated by the principle of fuzzy transformation [
10].
2.4. Description of FMEA and Improved AHP
The FMEA method analyzes the cause and effect of system failure, where the RPN can solve risk projects or problems by helping in planning limited resources [
11]. The FMEA method can provide information for risk management decision and is widely used in the aerospace, machinery, automotive, medical equipment, and services industry [
12,
13,
14]. Although the traditional FMEA method is considered the most effective before-the-event prevention method, the method of calculating RPN has been widely questioned [
15,
16,
17] for the following reasons [
18]:
It does not consider the relative importance of the risk factors S (severity), O (occurrence), and D (detection), but consider them to be of the same importance.
Different products of the risk factors S, O, and D may get exactly the same RPN value, but entails different risk connotations.
The risk factors S, O, and D are evaluated using exact values to represent their magnitude, which cannot objectively reflect the complexity and uncertainty of things.
RPN values lack reliability, as it is obtained by the product of the risk factor S, O, and D.
At present, the integrated application and research of the traditional FMEA method and fuzzy theory method are widely concerned [
19]. Common methods are as follows. Braglia et al. [
19] put forward a technique for order preference by similarity to the ideal solution to improve the FMEA method to evaluate risk factors and relative weights by a triangular fuzzy number. Chang et al. [
20] put forward an intuitionistic fuzzy set ranking technique to calculate the failed RPN value. Chang et al. [
21] adopted an ordered weighted averaging method and decision-making trial and evaluation laboratory method to solve the failure mode risk problems. Kutlu et al. [
22] used the analytic hierarchy process and TOPSIS methods integrated with FMEA to obtain the ranking of the potential failure modes. Geng et al. [
23] introduced a fault cause-and-effect chain concept into the FMEA method and improved the calculation formula for risk priority. Wang et al. [
24] put forward a dependent linguistic ordered weighted geometric FMEA risk assessment method. Lolli et al. [
25] put forward a novel multi-criteria decision-making (MCDM) method named FlowSort-GDSS, which was proposed to sort the failure modes into priority classes by involving multiple decision-makers.
There are many factors affecting mine safety, in which some indicators can be accurately described with quantity values. Others are difficult to accurately analyze quantitatively with the fuzzy concept. These factors have the following characteristics:
Many factors are involved in the evaluation.
The factors affecting mine safety restrict and influence each other, which makes them hard to integrate and make a closer to a comprehensive evaluation.
Many fuzzy concepts are involved in the evaluation.
The fuzzy concept normally includes very good, very bad, good, and bad. The experience and advice of an expert is often adopted, which entails much fuzziness. Therefore, according to the defects of the traditional FMEA in mine safety assessment and the characteristics of the safety factors, a fuzzy mathematics analysis method is adopted to improve the method. It aims to change the risk data into adaptive fuzzy sets and to analyze the weighted RPN value of risk contribution.
3. Occupational Disease Assessment of Mining Industry OHSAS18001 Based on FMEA and an Improved AHP Model
The common occupational hazards in the mining industry are dust, noise, vibration, harmful gas, heat radiation, occupational injury, and so on, where dust, noise, and gas have caused great harm to people’s health. These three common risk factors are analyzed and evaluated in this paper.
3.1. Assessment Factor Sets
This occupational disease assessment of OHSAS18001 includes 3 first-grade indicators and 10 second-grade indicators. The 3 first-grade indicators can be expressed as: , where U = occupational disease risk factors, U1 = dust, U2 = noise, and U3 = gas. The factors are further refined as follows: , , , where U11 = not wearing a dust mask, U12 =not operating normatively, U13 = not opening the dust model, U14 = mask not regularly replaced with filtration membrane; U21 = not maintaining equipment periodically, U22 = not wearing earplugs, U23 = not setting sound insulation equipment; U31 = fan not running well, U32 = insufficient ventilation system, and U33 = insufficient individual protection.
3.2. Assessment Decision Sets
The occupational disease assessment of OHSAS18001 can be divided into four grades: very good, relatively good, general, and not good [
26]. Thus, the assessment decision sets can be expressed as:
, where
V1 = very good,
V2 = relatively good,
V3 = general, and
V4 = not good.
3.3. Assessment Weight Sets
The importance among indicators is assessed and scored by experts. The weight value [
27] of each indicator is determined, and the specific values are constructed, referring to the 1–9 scale method proposed by Saaty for the judgment matrix. If the parameter on the horizontal axis is less important than the parameter on the vertical axis, it carries a value between 1 and 9. Oppositely, it carries the value between the reciprocals of 1/2 and 1/9 [
28]. Jian Shi et al. [
29] pointed out that the ”1–9” scales method of AHP by Saaty was used to construct the comparison matrix whose consistent effect was insufficient. The traditional AHP method was thought to be only for specific qualitative indicators. On the other hand, the issues for both qualitative and quantitative indicators are not discussed enough [
30]. The traditional AHP method talked more about the consistency of the judgment matrix than its rationality [
31,
32]. Lolli et al. [
33] provided a clearly higher clustering validity index than previous sorting methods on benchmarking data, which meant that an item scoring badly on one or more key criteria may still be placed in the best class because these bad scores are compensated. Shuang Chen et al. [
34] preliminarily applied the improved “9/9–9/1” AHP method to weight sorting. In this paper, the improved AHP method integrated with FEMA is used to assess occupational disease of a mine to provide a more scientific and accurate decision basis.
The traditional AHP method has some shortcomings about the experts scoring:
The “1–9” scales method would make the accuracy rate low.
The method would make the connection of levels confused.
The method would make data processing cumbersome.
The method is optimized and improved with a new “9/9–9/1” scale as shown in the following.
3.4. Consistency Checking
The test indicator for the consistency of judgment is as follows:
, where
, and
n is the order of the judgment matrix [
35].
RI is the random consistency indicator of judgment matrix. If
, the matrix is consistent and the AHP can be continued. If
, it requires revising as the matrix is not consistent. In this paper, the root mean square method is used to construct the consistency test. The calculation procedure is as follows: (1) Multiply the elements of B by line
; (2) Let the resultant product be the
nth root
; (3) Normalize the root mean square vector and get the feature vector
; (4) Calculate the largest eigenvalue of the judgment matrix
; (5) Calculate
.
3.5. Fuzzy Comprehensive Assessment Matrix
The membership degree in this case is obtained by probability statistics. The failure mode questionnaire (
Table 1) was distributed and then recovered.
O1,
O2,
O3,
O4, and
O5 (probability) in the table are defined as 10 points, 8 points, 6 points, 4 points and 2 points, respectively;
S1,
S2,
S3, and
S4 (fault severity) are defined as 10 points, 7.5 points, 5 points and 1.5 points, respectively;
D1,
D2,
D3,
D4,
D5 and
D6 (fault detection difficulty degree) are defined as 10 points, 8 points, 6 points, 4 points, 2 points and 1 points, respectively. The number of RPN [
36] can be calculated by RPN =
O ×
S ×
D, which means that it is an important parameter for evaluating the security level. The higher the score is, the lower the security level will be. Moreover, 1000 points are divided into 7 grades averagely as shown in
Table 2.
For the
i indicator; the membership degree of each occupational disease assessment is the fuzzy subset
; the fuzzy comprehensive judgment matrix of each indicator is as follows [
37]:
.
3.6. Comprehensive Fuzzy Assessment
The model for occupational disease assessment is based on the improved AHP and FMEA and follows the principle of calculation step by step to obtain the membership vectors of each layer, which combines the weight set and factor into the assessment matrix to make the fuzzy matrix synthesis operation [
38].The assessment results of each level are obtained according to the principle of fuzzy comprehensive assessment:
.
4. Case Study
The mining industry in the southwest of Hubei Province lies in the central part of China with general hydrogeological conditions. OHSAS18001 has been managed in the mining industry for more than three years and has a good reputation in the society and local community. This mining industry is taken as an example to assess the occupational disease in a mine using OHSAS18001.
4.1. The Consistency Test of Indicator Weight
In order to keep the validity and consistency of the assessment model, the indicators need to be tested for consistency. Thirty people, including 2 auditors who are familiar with OHSAS18001 and employees with at least 5 years of working in the mine and who are very familiar with mining operations, were invited to judge the importance of the indicators of the improved AHP method [
39]. All 30 people needed to be trained to use the improved AHP method. In this paper, the consistency test is carried out in the way of the root mean square. The calculation procedure is as follows.
U layer subordinate indicators weight and consistency calculating result are: and according to the formula . Thus the result has passed the consistency test.
In
Table 3, it can be seen that the weight of the dust and noise assessment indicators of OHSAS is as follows:
.
In the same way, the indicators all pass the consistency test. The corresponding weights of U1, U2 and U3 are as follows: , and .
4.2. Single Factor Assessment Matrix
According to the actual operation of mine industry OHSAS18001 and relevant information, the result from the second grade indicators scored by the experts is shown in
Table 4,
Table 5 and
Table 6 [
40].
The data of
R1,
R2 and
R3 of the membership matrix is shown as follows.
4.3. Fuzzy Comprehensive Assessment
The first grade fuzzy comprehensive assessment is carried out through each second grade indicator weight
Wi and corresponding single factor matrix
Ri.
The fuzzy comprehensive assessment is carried out by using the result of the first grade fuzzy assessment.
According to the comprehensive assessment result, the occupational health assessment result of OHSAS18001 achieves a probability of “very good” (0), “relatively good” (0.1774), “general” (0.5505) and “not good” (0.2721). Thus, according to the maximum membership degree [
41], the occupational health assessment result of OHSAS18001 belongs to “general” grade, which still needs further improvement.
5. Suggestion
Concluded from the results, the occupational health assessment results of dust, noise, and gas all belong to the “general” grade. Some suggestions for corrective action are given as follows.
5.1. Dust Control Suggestions
Technology should be reformed and production equipment should be innovated.
Wet working methods and isolation of dust sources should be adopted.
Exhaustion and dust elimination while establishing a variety of maintenance and management systems should be undertaken.
Individual protection and publicity and education should be carried out.
Timely inspection, evaluation, summaries, and health examinations should be conducted.
5.2. Noise Control Suggestions
Silent or low-noise equipment should be preferred instead of high-noise equipment.
Isolation and noise elimination measures should be adopted.
Individual protection and earplugs should be considered.
Hearing tests should be conducted regularly to the people who are exposed to noise, and pre-job and off-job hearing examinations of staff engaged in noisy operations should be carried out.
Reasonable arrangement of labor and rest should be arranged, and noise exposure time to staff engaged in noisy operations should be reduced.
5.3. Gas Control Suggestions
Ventilation and personal protection should be improved.
First aid measures should be taken.
Regular detection of toxic and harmful gases should be adopted.
Water should be sprayed to reduce the harmful gas content.
5.4. Continuous Improvement Plan
The staff should continuously improve OHSAS18001 according to the principle of plan-do-check-action (PDCA). The awareness and performance of occupational health and safety should also be continuously improved to satisfy the expected demand of OHSAS18001 through internal audits and management reviews.
In the actual work, the staff can develop continuous improvement plans based on such assessment models. The occupational disease can be assessed, analyzed, and improved monthly to control and ameliorate the incidence of occupational disease and to satisfy the requirement of “people oriented and paying attention to employee health and safety”.
6. Conclusions
In accordance with 10 laws, including the Occupational Disease Prevention Law of the People’s Republic of China, Diagnostic Criteria of Pneumoconiosis, and Diagnostic Criteria of Occupational Noise induced Deafness etc., the Center for Disease Control and Prevention of Ezhou City performed physical examinations from 15 May 2015 to 14 June 2015, and the results show that 5 people were affected by obstructive pulmonary ventilation among the dust operation personnel, 6 people had hearing problems among noise operation personnel, 4 people had abnormal blood indicators among the gas operation personnel, and 23 people were proposed reexamination. The results of this examination are consistent with the ones of the assessment based on the improved AHP and FMEA model, which all belong to the general grade and all of which need improvement. The feasibility of the comprehensive assessment model of occupational disease in the mining industry is thus proved. Additionally, the knowledge of different domestic personnel and the natural conditions of different mining industries are not the same. Thus, necessary adjustments should be carried out according to the actual situation in the selection of assessment indicators and assessment personnel. For future work, research and training in this area should be strengthened, and the constructed model should be optimized continuously.
Acknowledgments
All authors thank the statistical personnel of the case study area for their cooperation in the study and leaders of the mining industry for the guidance. The Research Center for Environment and Health of Zhongnan University of Economics and Law in China funded the work reported in this paper. Special thanks to Joel Lööw for his proof reading.
Author Contributions
All authors contributed to design, method, and analysis reported in the paper. Jingdong Zhang conducted the fieldwork and collected and processed the data reported in the paper. Jan Johansson and Jiangdong Bao conducted the analysis and led the writing of the manuscript. Jiangdong Bao developed and prepared all tables and figures. All authors commented on the manuscript, providing insights used in the analysis and discussion.
Conflicts of Interest
The authors declare no conflict of interest.
References
- Occupational Disease. Hubei Provincial Safety Production Supervision Authority. Available online: http://www.hubeisafety.gov.cn/ajj_new/index_test1.asp?topnav=%D6%F7%D2%B3 (accessed on 18 July 2016).
- Occupational Disease Prevention Law. Hubei Provincial Safety Production Supervision Authority. Available online: http://www.hubeisafety.gov.cn/ajj_new/shuxingcaidan/articlemore.asp?menuid=152 &menu1=%D6%B0%D2%B5%CE%C0%C9%FA (accessed on 18 July 2016).
- General Administration of Quality Supervision; Inspection and Quarantine of People’s Republic of China. National Standards of the People’s Republic of China; GB/T28001-2011 Occupational Health and Safety Management Systems Requirements; General Administration of Quality Supervision; Inspection and Quarantine of People’s Republic of China: Beijing, China, 2001.
- Stamatis, D.H. Failure Mode and Effect Analysis: FMEA from Theory to Execution; ASQ Quality Press: Milwaukee, WI, USA, 2003. [Google Scholar]
- Wilsonnhm, O.; Dell, S.W. Optimal real-time control strategies for rail transit operations during disruptions. In Computer-Aided Scheduling; Springer: Berlin, Germany, 1999. [Google Scholar]
- Dağsuyu, C.; Göçmen, E.; Narlı, M.; Kokangül, A. Classical and fuzzy FMEA risk analysis in a sterilization unit. Comput. Ind. Eng. 2016, 101, 286–294. [Google Scholar] [CrossRef]
- Wang, G.F. The application of FMEA in quality management. Qual. Process. 2002, 11, 60–63. [Google Scholar]
- Hu, Y.Y.; He, E.H. Comprehensive Evaluation Method; Science Press: Beijing, China, 2000; pp. 167–188. [Google Scholar]
- Wang, X.Z. Fuzzy Spatial Information Processing; Wuhan University Press: Wuhan, China, 2003; pp. 130–131. [Google Scholar]
- Cui, W.B.; Wu, G.T.; Sun, P.T.; Zhang, Y.Q. Ship safety assessment based on FMEA and fuzzy comprehensive evaluation methods. J. Harbin Eng. Univ. 2007, 28, 263–268. [Google Scholar]
- Chin, K.S.; Chan, A.; Yang, J.B. Development of a fuzzy FMEA based product design system. Int. J. Adv. Manuf. Technol. 2008, 36, 633–649. [Google Scholar] [CrossRef]
- Geum, Y.J.; Cho, Y.; Park, Y. A systematic approach for diagnosing service failure: Service-specific FMEA and grey relational analysis approach. Math. Comput. Model. 2011, 54, 3126–3142. [Google Scholar] [CrossRef]
- Li, G.; Gao, J.M.; Jiang, H.Q. Modeling and reasoning technique of multiple failures based on polychromatic sets. Comput. Integr. Manuf. Syst. 2007, 13, 643–648. [Google Scholar]
- Gilchrist, W. Modeling failure mode and effect analysis. Int. J. Qual. Reliab. Manag. 1993, 10, 16–23. [Google Scholar] [CrossRef]
- Wang, Y.M.; Chin, K.S.; Poon, G.K.K.; Yang, J.B. Risk evaluation in failure mode and effects analysis using fuzzy weighted geometric mean. Expert Syst. Appl. 2009, 36, 1195–1207. [Google Scholar] [CrossRef]
- Bowles, J.B. An assessment of PRN prioritization in a failure modes effects and criticality analysis. J. IEST 2004, 47, 51–56. [Google Scholar] [CrossRef]
- Wu, X.R.; Qiu, L.M.; Zhang, S.Y. Correlated FMEA method of complex system with linguistic vagueness. J. Zhejiang Univ. Eng. Sci. 2013, 47, 782–789. [Google Scholar]
- Liu, H.C.; Liu, L.; Liu, N. Risk evaluation approaches in failure mode and effects analysis: A literature review. Expert Syst. Appl. 2013, 40, 828–838. [Google Scholar] [CrossRef]
- Braglia, M.; Frosolini, M.; Montanari, R. Fuzzy TOPSIS approach for failure mode, effects and criticality analysis. Qual. Reliab. Eng. Int. 2003, 19, 425–443. [Google Scholar] [CrossRef]
- Chang, K.H.; Cheng, C.H.; Chang, Y.C. Reprioritization of failures in a silane supply system using an intuitionistic fuzzy set ranking technique. Soft. Comput. 2010, 14, 285–298. [Google Scholar] [CrossRef]
- Chang, K.H.; Cheng, C.H. Evaluating the risk of failure using the fuzzy OWA and DEMATEL method. J. Intell. Manuf. 2011, 22, 113–129. [Google Scholar] [CrossRef]
- Kutlu, A.C.; Ekmekcioglu, M. Fuzzy failure modes and effects analysis by using fuzzy TOPSIS-based fuzzy AHP. Expert Syst. Appl. 2012, 39, 61–67. [Google Scholar] [CrossRef]
- Geng, X.L.; Chu, X.N. Risk evaluation method in failure mode and effects analysis based on failure cause-effect chain. Comput. Integr. Manuf. Syst. 2009, 15, 2473–2480. [Google Scholar]
- Wang, X.T.; Xiong, W. Risk evaluation method in FMEA based on dependent linguistic ordered weighted geometric operator. J. Zhejiang Univ. Eng. Sci. 2012, 46, 182–188. [Google Scholar]
- Lolli, F.; Ishizaka, A.; Gamberini, R.; Rimini, B.; Messori, M. FLOWSORT-GDSS—A novel group multi-criteria decision support system for sorting problems with application to FMEA. Expert Syst. Appl. 2015, 42, 6342–6349. [Google Scholar] [CrossRef] [Green Version]
- Tang, Y.; Li, G.C. An approach to budget allocation for an aerospace company—Fuzzy analytic hierarchy process and artificial neural network. Neurocomputing 2009, 7, 3477–3489. [Google Scholar] [CrossRef]
- Zhang, H.; Zou, S.P.; Su, F. Fuzzy Mathematics and Its Application; Coal Industry Press: Beijing, China, 1992. [Google Scholar]
- Azadeh, A.; Zadeh, S.A. An integrated fuzzy analytic hierarchy process and fuzzy multiple-criteria decision-making simulation approach for maintenance policy selection. Simulation 2016, 1, 3–18. [Google Scholar] [CrossRef]
- Guo, S.J.; Hua, Y. AHP on the basis of index number scale and its usage. J. Nantong Inst. Technol. (Nat. Sci.) 2004, 3, 4–7. [Google Scholar]
- Wu, D.T.; Li, D.F. Shortcomings of analytical hierarchy process and the path to improve the method. J. Beijing Norm. Univ. (Nat. Sci.) 2004, 2, 264–267. [Google Scholar]
- Wei, C.P.; Zhang, Z.M. An algorithm to improve the consistency of a comparison matrix. Syst. Eng. Theory Pract. 2000, 20, 62. [Google Scholar]
- Wang, Y.M. An overview of priority methods of comparison matrix. J. Manag. Sci. China 1995, 5, 101. [Google Scholar]
- Lolli, F.; Ishizaka, A.; Gamberini, R. New AHP-based approaches for multi-criteria inventory classification. Int. J. Prod. Econ. 2014, 156, 62–74. [Google Scholar] [CrossRef] [Green Version]
- Chen, S.; Yang, G.F. Eco-environmental quality appraisal of yellow river delta wetland using the improved AHP method. South-to-North Water Divers. Water Sci. Technol. 2011, 9, 99–101. [Google Scholar] [CrossRef]
- Nguyen le, T.; Quyen, H.A.; Nguyen, N.A. Application of fuzzy-analytic hierarchy process algorithm and fuzzy load profile for load shedding in power systems. Int. J. Electr. Power Energy Syst. 2016, 77, 178–184. [Google Scholar]
- Wang, S.Y. Failure Mode and Effect Analysis (FMEA); Zhongshan University Press: Guangdong, China, 2003. [Google Scholar]
- Dağdeviren, M.; Yüksel, I. Developing a fuzzy analytic hierarchy process (AHP) model for behavior-based safety management. Inf. Sci. 2008, 178, 1717–1733. [Google Scholar] [CrossRef]
- Shumon, R.H.; Ahmed, S.; Ahmed, S. Fuzzy analytical hierarchy process extent analysis for selection of end of life electronic products collection system in a reverse supply chain. Proc. Inst. Mech. Eng. Part B J. Eng. Manuf. 2016, 1, 157–168. [Google Scholar] [CrossRef]
- Bhatt, R.; Macwan, J.E.M. Fuzzy logic and analytic hierarchy process–based conceptual model for sustainable commercial building assessment for India. J. Archit. Eng. 2016, 22. [Google Scholar] [CrossRef]
- Sen, C.G.; Sen, S.; Başlıgil, H. Pre-selection of suppliers through an integrated fuzzy analytic hierarchy process and max-min methodology. Int. J. Prod. Res. 2010, 6, 1603–1625. [Google Scholar] [CrossRef]
- Ashtiani, M.; Azgomi, M.A. Trust modeling based on a combination of fuzzy analytic hierarchy process and fuzzy VIKOR. Soft Comput. 2016, 1, 399–421. [Google Scholar] [CrossRef]
© 2017 by the authors; licensee MDPI, Basel, Switzerland. This article is an open access article distributed under the terms and conditions of the Creative Commons Attribution (CC-BY) license (http://creativecommons.org/licenses/by/4.0/).


