Article

Quality Perspective on the Dynamic Balance of Cultivated Land in Wenzhou, China

College of Environmental and Resource Sciences, Zhejiang University, Hangzhou 310058, China
*
Authors to whom correspondence should be addressed.
Sustainability 2017, 9(1), 95; https://doi.org/10.3390/su9010095
Submission received: 20 November 2016 / Revised: 5 January 2017 / Accepted: 7 January 2017 / Published: 12 January 2017

Abstract

:
Cultivated land in China has faced severe challenges in recent years due to rapid urbanization. In 1997, the “cultivated land requisition-compensation balance” policy was implemented by the government to maintain the quantity and quality of cultivated land. Previous studies mainly focused on the quantity changes of cultivated land. In this study, from a quality perspective, we characterized the occupation and compensation of cultivated land in Wenzhou City utilizing remote sensing and geographic information systems during 2005–2010 and 2010–2014. Our results indicated that although the quantity balance of cultivated land has been achieved in Wenzhou, there was a trend of consuming prime cultivated land for urbanization while compensating with less productive land. It was also found that topography, water resources, and accessibility play important roles in cultivated land changes, with urbanization occurring on the eastern coastal plain where high quality lands are prevalent. Less than 60% of the gained lands were under cultivation, with the majority of reclaimed land from forests and coastal areas and located in remote regions. Therefore, we suggest that a “cultivated land protection red line” policy should be implemented to protect the best cultivated lands, while preventing random land reclamation to secure agricultural and environmental sustainability.

1. Introduction

Cultivated land plays a critical role not only in human livelihoods but also in the development of human civilization. However, due to the continuously increasing demands for urban expansion and the overexploitation of natural resources, cultivated land is shrinking rapidly in many regions of the world [1,2,3,4,5]. China, the largest developing country in the world, is now facing the issue of having insufficient cultivated land resources for its growing population, which makes conserving cultivated land particularly important for China’s continued development [1,6,7]. Since the implementation of the Reform and Opening-Up Policy in 1978, China has been experiencing unprecedented economic growth and profound social transformation [8]. The economic boom has dramatically increased the amount of residential, commercial, and industrial built-up areas, with the scarification of cultivated land [9]. It has been shown that there were 4.73 million hectares of cultivated land lost during 1978–1996, mainly in the eastern coastal and central provinces of China [10]. Meanwhile, the population of China increased from 0.96 billion in 1978 [11] to 1.22 billion in 1996 [12], accounting for over one-fifth of the world population at that time. The increasing population but shrinking cultivated land made the use of cultivated land under mounting pressure.
Having realized the magnitude of cultivated land loss in China, in 1997, the State Council proposed the “cultivated land requisition-compensation balance” policy in order to maintain the existing amount of cultivated land nationally [13]. Subsequently, in 1998, the policy was written into “land management law”. The policy stipulated that in a provincial governmental unit, any occupation of cultivated land for construction purposes must compensate at least the equal amount of cultivated land, which was called “dynamic balance of cultivated land” [14]. A local government (city or county) can pay fees to another region within the same province to accomplish the compensation, if it is difficult to achieve the quantity balance. The means to compensate cultivated land include the exploitation of natural land such as grassland, forestry and unused land, the rehabilitation of damaged land and the consolidation of small farm plots into larger ones. However, several problems have taken place during the process, such as the continued loss of fertile and productive cultivated land and low quality cultivated land compensation. Similar loss of high quality cultivated land to urban and industrial development is prevalent worldwide. Imhoff et al. [15] indicated that the prime cultivated land acted as the first victim of urban expansion in the USA. In northern Italy, there were 41% of the high quality soils consumed by urban development during 1954–2008 [16]. Moreover, about half of the new urban area occurred on high quality farmland in Canada between 1971 and 1996 [17]. Therefore, the Chinese government further issued the “Decision on the Deepening Reform and Tightening Land Administration” in 2004, claiming that the quality of the gained cultivated land should be equal to the quality of lost cultivated land. This shifted the emphasis of the policy to the importance of both quantity and quality balances.
Cultivated land conversion and food security have always been an important research topic for governments and scholars in order to deliver continued growth and development. Remote sensing and geographic information systems (GIS) provide important tools for analyzing cultivating land, with many studies utilizing these low-cost applications to examine the quantity and landscape pattern changes of cultivated land and the driving forces behind them. Tania et al. [18] assessed the relationships between population growth, socioeconomic changes and the losses of cultivated land in Puerto Rico, USA. Deng et al. [19] analyzed the cropland loss trajectory induced by urban sprawl and found that cropland had undergone considerable loss and become fragmented in Hangzhou, China. Zhong et al. [20] assessed the amount of agricultural land loss and the driving factors using logistic regression models. Su et al. [21] identified the key urbanization factors and studied the relationships between agricultural landscape pattern changes and urbanization on the eco-regional scale. However, few studies have focused on the quality changes of cultivated land dynamics, especially losing the most productive land, which will profoundly influence agricultural productivity. Additionally, previous studies have primarily focused on the loss of cultivated land while paying little attention to the characteristics of cultivated land gain as well as the utilization of the gained land. Furthermore, agricultural policies usually have a great influence on both land use and the environment [22,23]. Therefore, a full assessment of cultivated land dynamic balance from a quality perspective is critical for the management and preservation of cultivated land.
In this study, Wenzhou City was selected for analysis because it is an economically developed region on the eastern coast of China, and its cultivated land per capita is extremely limited. To investigate the quality dynamics of cultivated land, we combined multiple research approaches, including the utilization of remote sensing and GIS. The objectives of the study are to: (1) characterize the qualitative and quantitative balance of cultivated land in Wenzhou City; (2) analyze the effectiveness and influence of the cultivated land requisition-compensation balance policy; and (3) provide some suggestions for policy makers to promote the cultivated land protection.

2. Materials and Methods
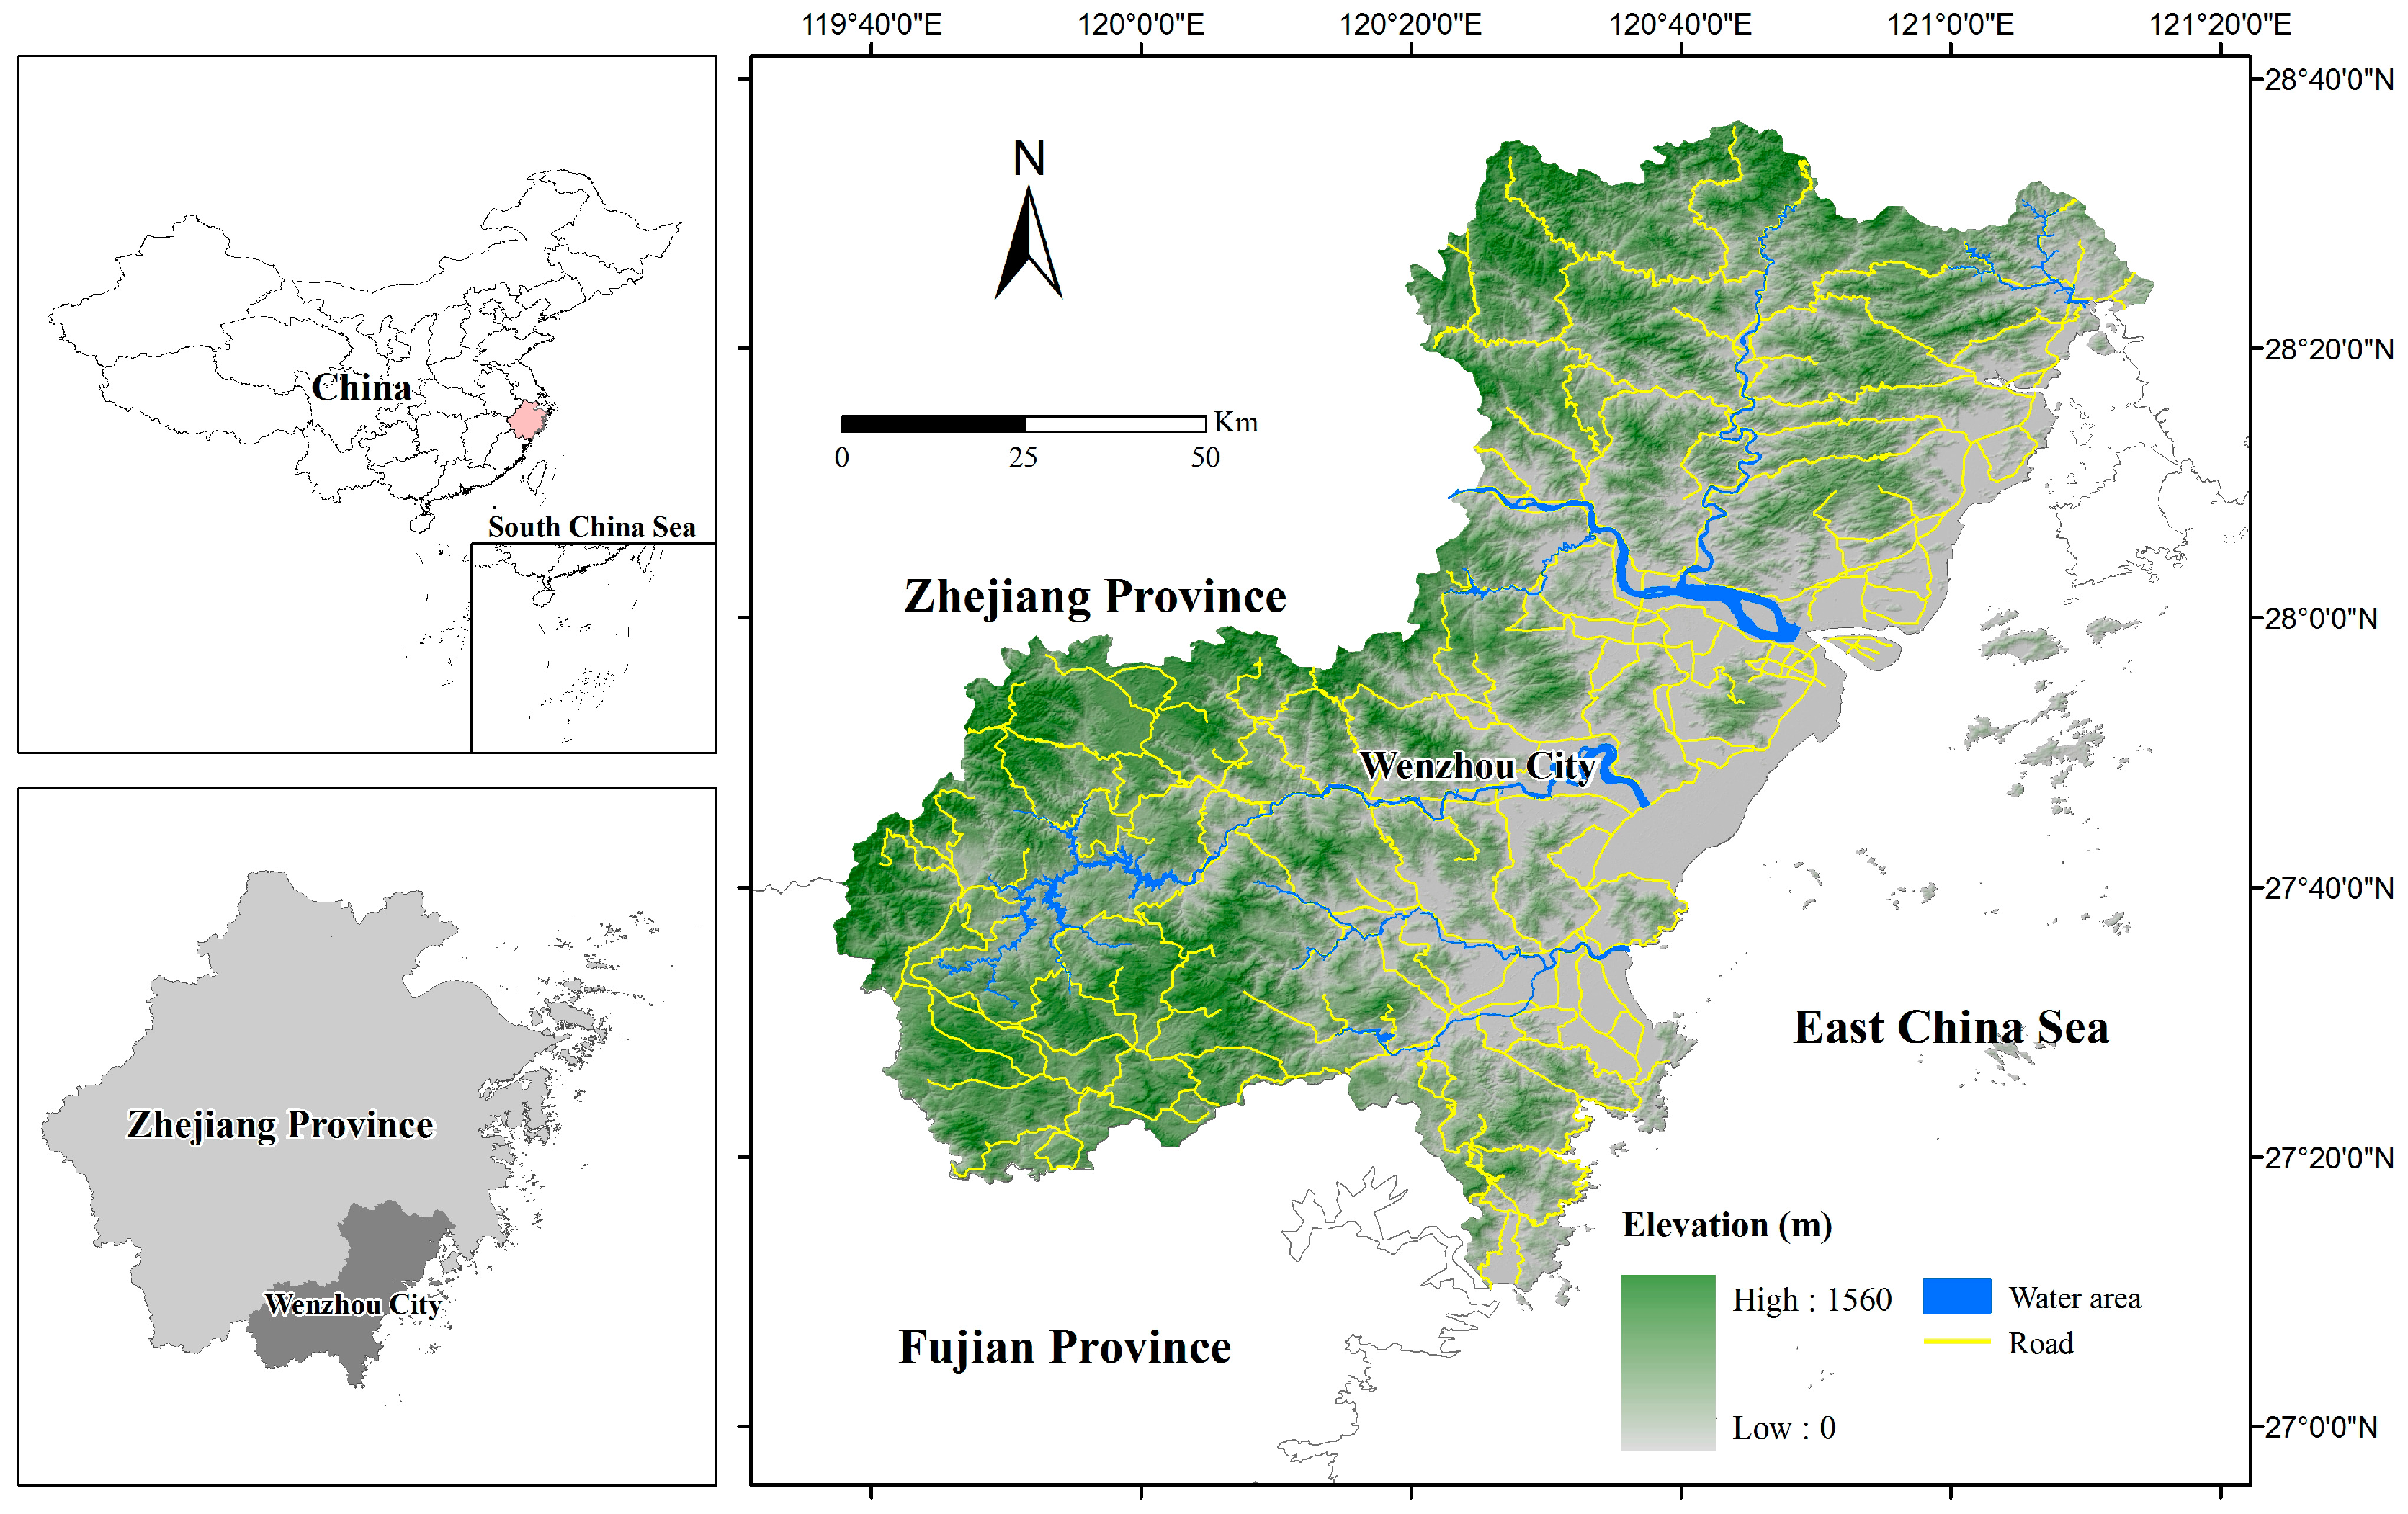
2.1. Study Area

Situated on the southeastern coast of China, Wenzhou City is one of the most economically developed regions in Zhejiang Province. It has a total area of 12,065 km2, of which 80% is occupied by hills and the rest by plains (Figure 1). The entire terrain tilts from the southwest to the northeast, and the main soil types are yellow red soil and paddy soil. With a humid subtropical monsoon climate, Wenzhou has an annual average temperature of 18–20 °C and an annual rainfall of about 1818 mm. The heat- and moisture-rich climate makes Wenzhou a suitable place for growing rice.
Since China’s reform and opening-up, Wenzhou has made great progress in its social and economic development. Its total population increased from 5.8 million in 1980 to 9.1 million in 2014. The past three decades have witnessed the emergence and prosperity of private enterprises in Wenzhou City, resulting in a number of industries, such as electric, leather, shoe, and clothing manufacturers, creating the so-called “Wenzhou model”, an epitome of China’s market orientation. In 2014, Wenzhou’s Gross Domestic Product (GDP) amounted to 430.30 billion Yuan (RMB), compared to only 1.80 billion Yuan in 1980. Such rapid social and economic development has caused expansions of urban areas, leading to a significant loss of cultivated land. When compared to China and the United States, cultivated land in Wenzhou is considered a scarce resource, with only 0.028 ha per capita, compared to 0.08 and 0.47 ha, respectively. Wenzhou City, therefore, provides an ideal location for studying the spatio-temporal dynamics of cultivated land in cities that have scarce land resources while facing rapid urbanization.

2.2. Data Sources

Digital land use data in 2005, 2010 and 2014 were used in this study to analyze land use and conversion (Figure 2). The land use data with a scale of 1:10,000 were obtained from the Bureau of Land and Resources of Wenzhou. These land use data were extracted from the yearly updating data based on the second national land investigation in China which was conducted by the Ministry of Land Resources and local governments. The outcomes of the second national land investigation were interpreted using high-resolution remote sensing images and aerial photos with sub-meter spatial resolution, and were then modified by extensive field survey to improve accuracy. According to the Land Administration Law, the county-level land use administration carries out an annual land use change survey which includes occupation and compensation of cultivated land after the second national land investigation. These conversions will be updated in the land use data to form the yearly digital land use map. General land use plan (2006–2020) which firmly restricts land use changes in Wenzhou City during this period, was also provided by the Bureau of Land and Resources of Wenzhou.
Moreover, digital elevation model (DEM) data with a spatial resolution of 30 m were downloaded from the International Scientific Data Service Platform to determine the area’s elevation and slope. Demographic and socio-economic data (2005–2014) were obtained from the Wenzhou Statistical Yearbook.

2.3. Methods

In this study, we comprehensively analyzed the dynamic balance of cultivated land (cultivated land occupation and compensation) in Wenzhou City, focusing on four aspects: quantity, quality, composition and spatial variation. We further examined the utilization of cultivated land using Google Earth. Since the cultivated land, once converted to built-up area, will be unlikely to become available again for agriculture [24], and the policy only requires the cultivated land occupied by construction to compensate. Thus, in this study, we only analyzed this kind of permanent cultivated land loss, where “cultivated land loss” refers to the cultivated land converted to construction land. The specific methods of analysis were as follows:

2.3.1. Assessment of Cultivated Land Quality

In order to analyze the cultivated land quality changes, the natural quality grade obtained from China’s Agricultural Land Classification and Gradation (ALCG) [25] was applied to represent the sustainable crop production under natural conditions. To evaluate the potential productivity of cultivated land in China, the Ministry of Land and Resources (MLRC) conducted a nation-wide investigation of farmlands’ natural conditions and utilization over a period (1998–2008) in which the quality values were stored in the Agricultural Land Classification database originating from the second national land investigation data in China.
Based on the recent regulation of the ALCG (GB/T 28407-2012), the natural quality in Wenzhou was assessed by six indicators, soil fertility, soil texture, organic matter content, topsoil thickness, irrigation condition, and elevation. The scores and weights are in reference to the regulation described in Table 1. Therefore, the score of the cultivated land quality can be calculated as:
CLQ = i = 1 n w i × f i
where CLQ represents the score of the cultivated land quality, n is the number of indicators, and wi and fi are the weight and score of the indicator i, respectively. A higher CLQ value indicates higher cultivated land quality.
Based on the CLQ value, the cultivated lands in China were graded into 15 categories with equal interval, among which Grade 1 represents the highest quality and Grade 15 represents the worst. The natural quality grades of cultivated land in Wenzhou were between 5 and 11. The quality map of cultivated land obtained from the local government (Figure 3), contains three categories: “High” (Grade 5 and 6), “Medium” (Grade 7, 8 and 9), and “Low” (Grade 10 and 11), which accounted for 19.27%, 73.77% and 6.96% of the entire area of the cultivated land in 2005, respectively. We assumed that the natural quality grade of the cultivated land of a given patch in Wenzhou did not change from 2005 to 2014. This is because the indicators affecting the land quality are usually invariant in a period of a few years [26].

2.3.2. Relative Loss and Gain Rate of Cultivated Land of Different Quality

To assess the dynamics of cultivated land of different quality, we developed two indicators, relative loss rate (2) and relative gain rate (3):
R L i = L i / L a W i / W a
R G i = G i / G a W i / W a
where RLi refers to the relative loss rate of the cultivated land of quality i; Li is the lost area of cultivated land of quality i to built-up land; La is the whole lost cultivated land area; Li/La refers to the proportion of quality i land in the total lost cultivated land; Wi is the area of cultivated land of quality i in the study area; Wa is the whole cultivated land area in the study area; and Wi/Wa refers to the proportion of quality i land in the whole cultivated land in the study area.
RGi refers to the relative gain rate of cultivated land of quality i. Gi and Ga are the gained area of the cultivated land of quality i and the whole gained area, respectively; and Gi/Ga refers to the proportion of quality i land in the total gained cultivated land.
RLi > 1 means that cultivated land in quality i is lost more rapidly compared to other land qualities. The larger the value of RLi, the stronger this trend is. Conversely, 0 < RLi < 1 means just the opposite. Similarly, RGi > 1 indicates that the land compensation tends to supply cultivated land of quality i, while 0 < RGi < 1 implies the opposite. RLi = 1 or RGi = 1 means that land quality i is reduced/increased in the same proportion than all the area.

3. Results

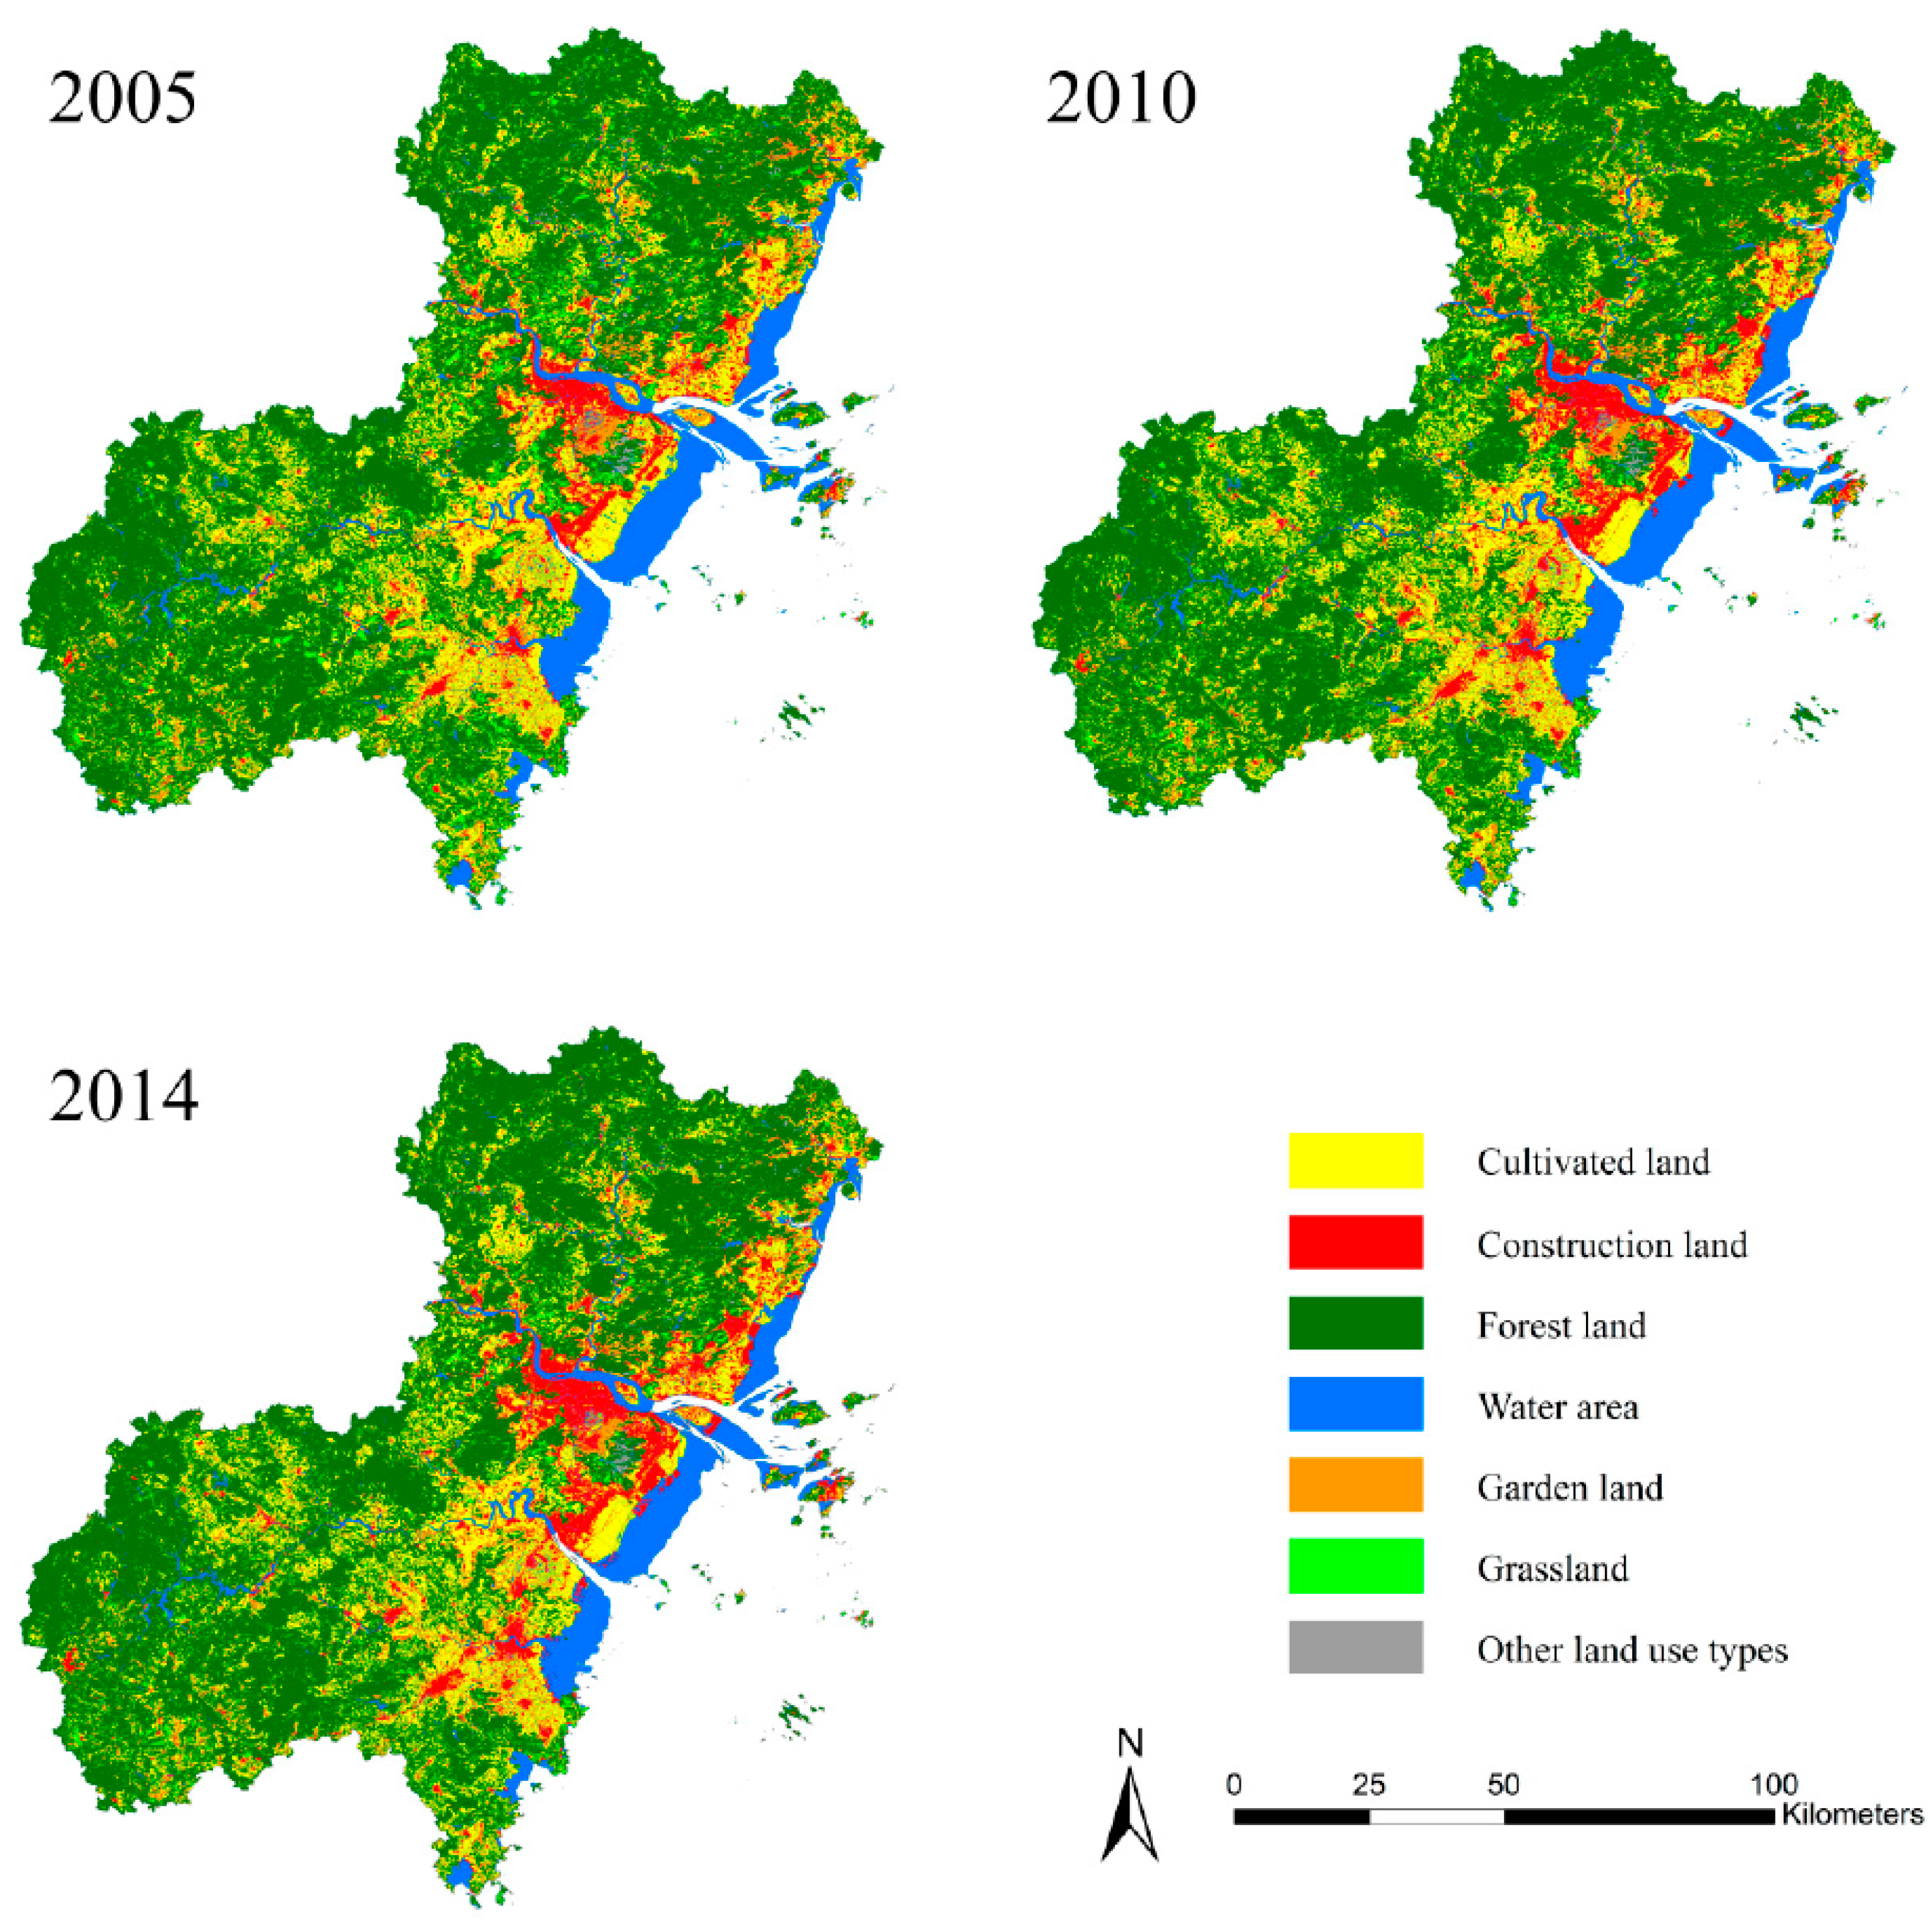
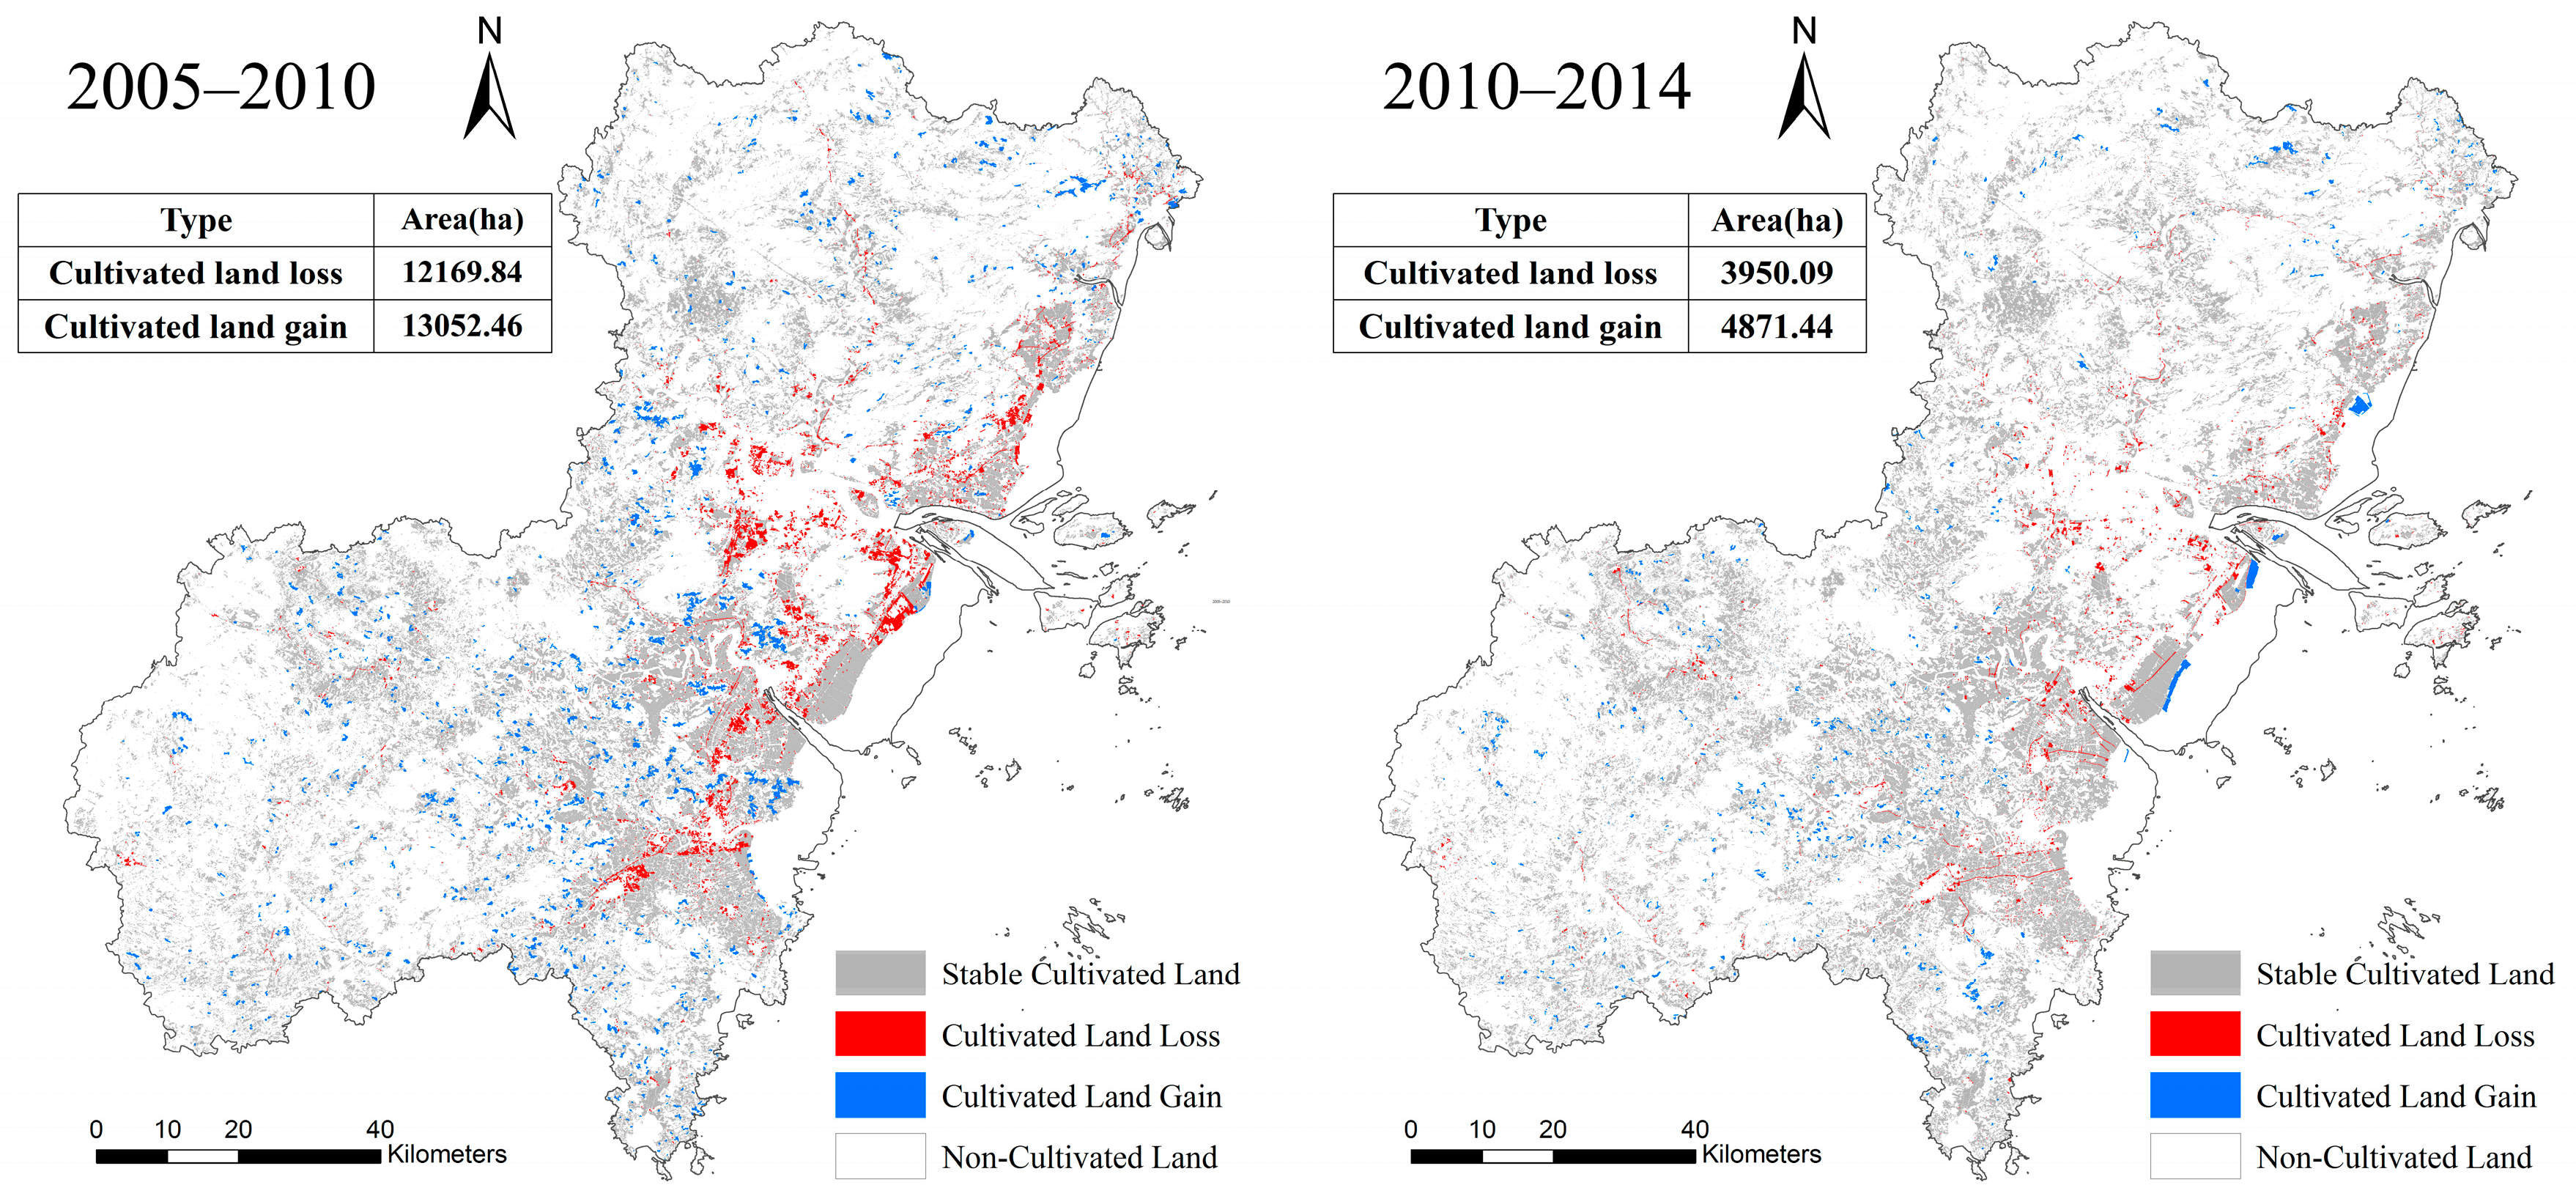
3.1. Quantity Changes of Lost/Gained Cultivated Lands

The spatial and temporal distribution of cultivated land changes in Wenzhou City is shown in Figure 4. Overall, Wenzhou City has achieved the goal of “quantity balance” of cultivated land within the two periods. During the period 2005–2010, 12,169.84 ha of cultivated land were lost due to development while 13,052.46 ha of cultivated land were gained. Correspondingly, there were 3950.09 ha of cultivated land occupation and 4871.44 ha of cultivated land compensation in the second period. Spatially, the cultivated land loss was significant in the traditional agricultural regions such as the Yueqing, Wencheng-Ruian, and the Ruian-Pingyang plains, which were also the most economically developed regions in Wenzhou. The spatial distribution of gained lands was more scattered in both time periods compared to that of the cultivated land loss.
Based on the statistics from the Land Resource Bureau of Wenzhou, the top three sources of cultivated land gain between 2005 and 2010 were forest land, grass land, and garden land, which accounted for 50.41%, 29.19%, and 16.65% of the total compensation, respectively (Table 2). In the period 2010–2014, forest land was still the primary source of land compensation, followed by both water area and coastal land with a total contribution of 25.75%. Therefore, cultivated land compensation was at the expense of natural land in Wenzhou City.

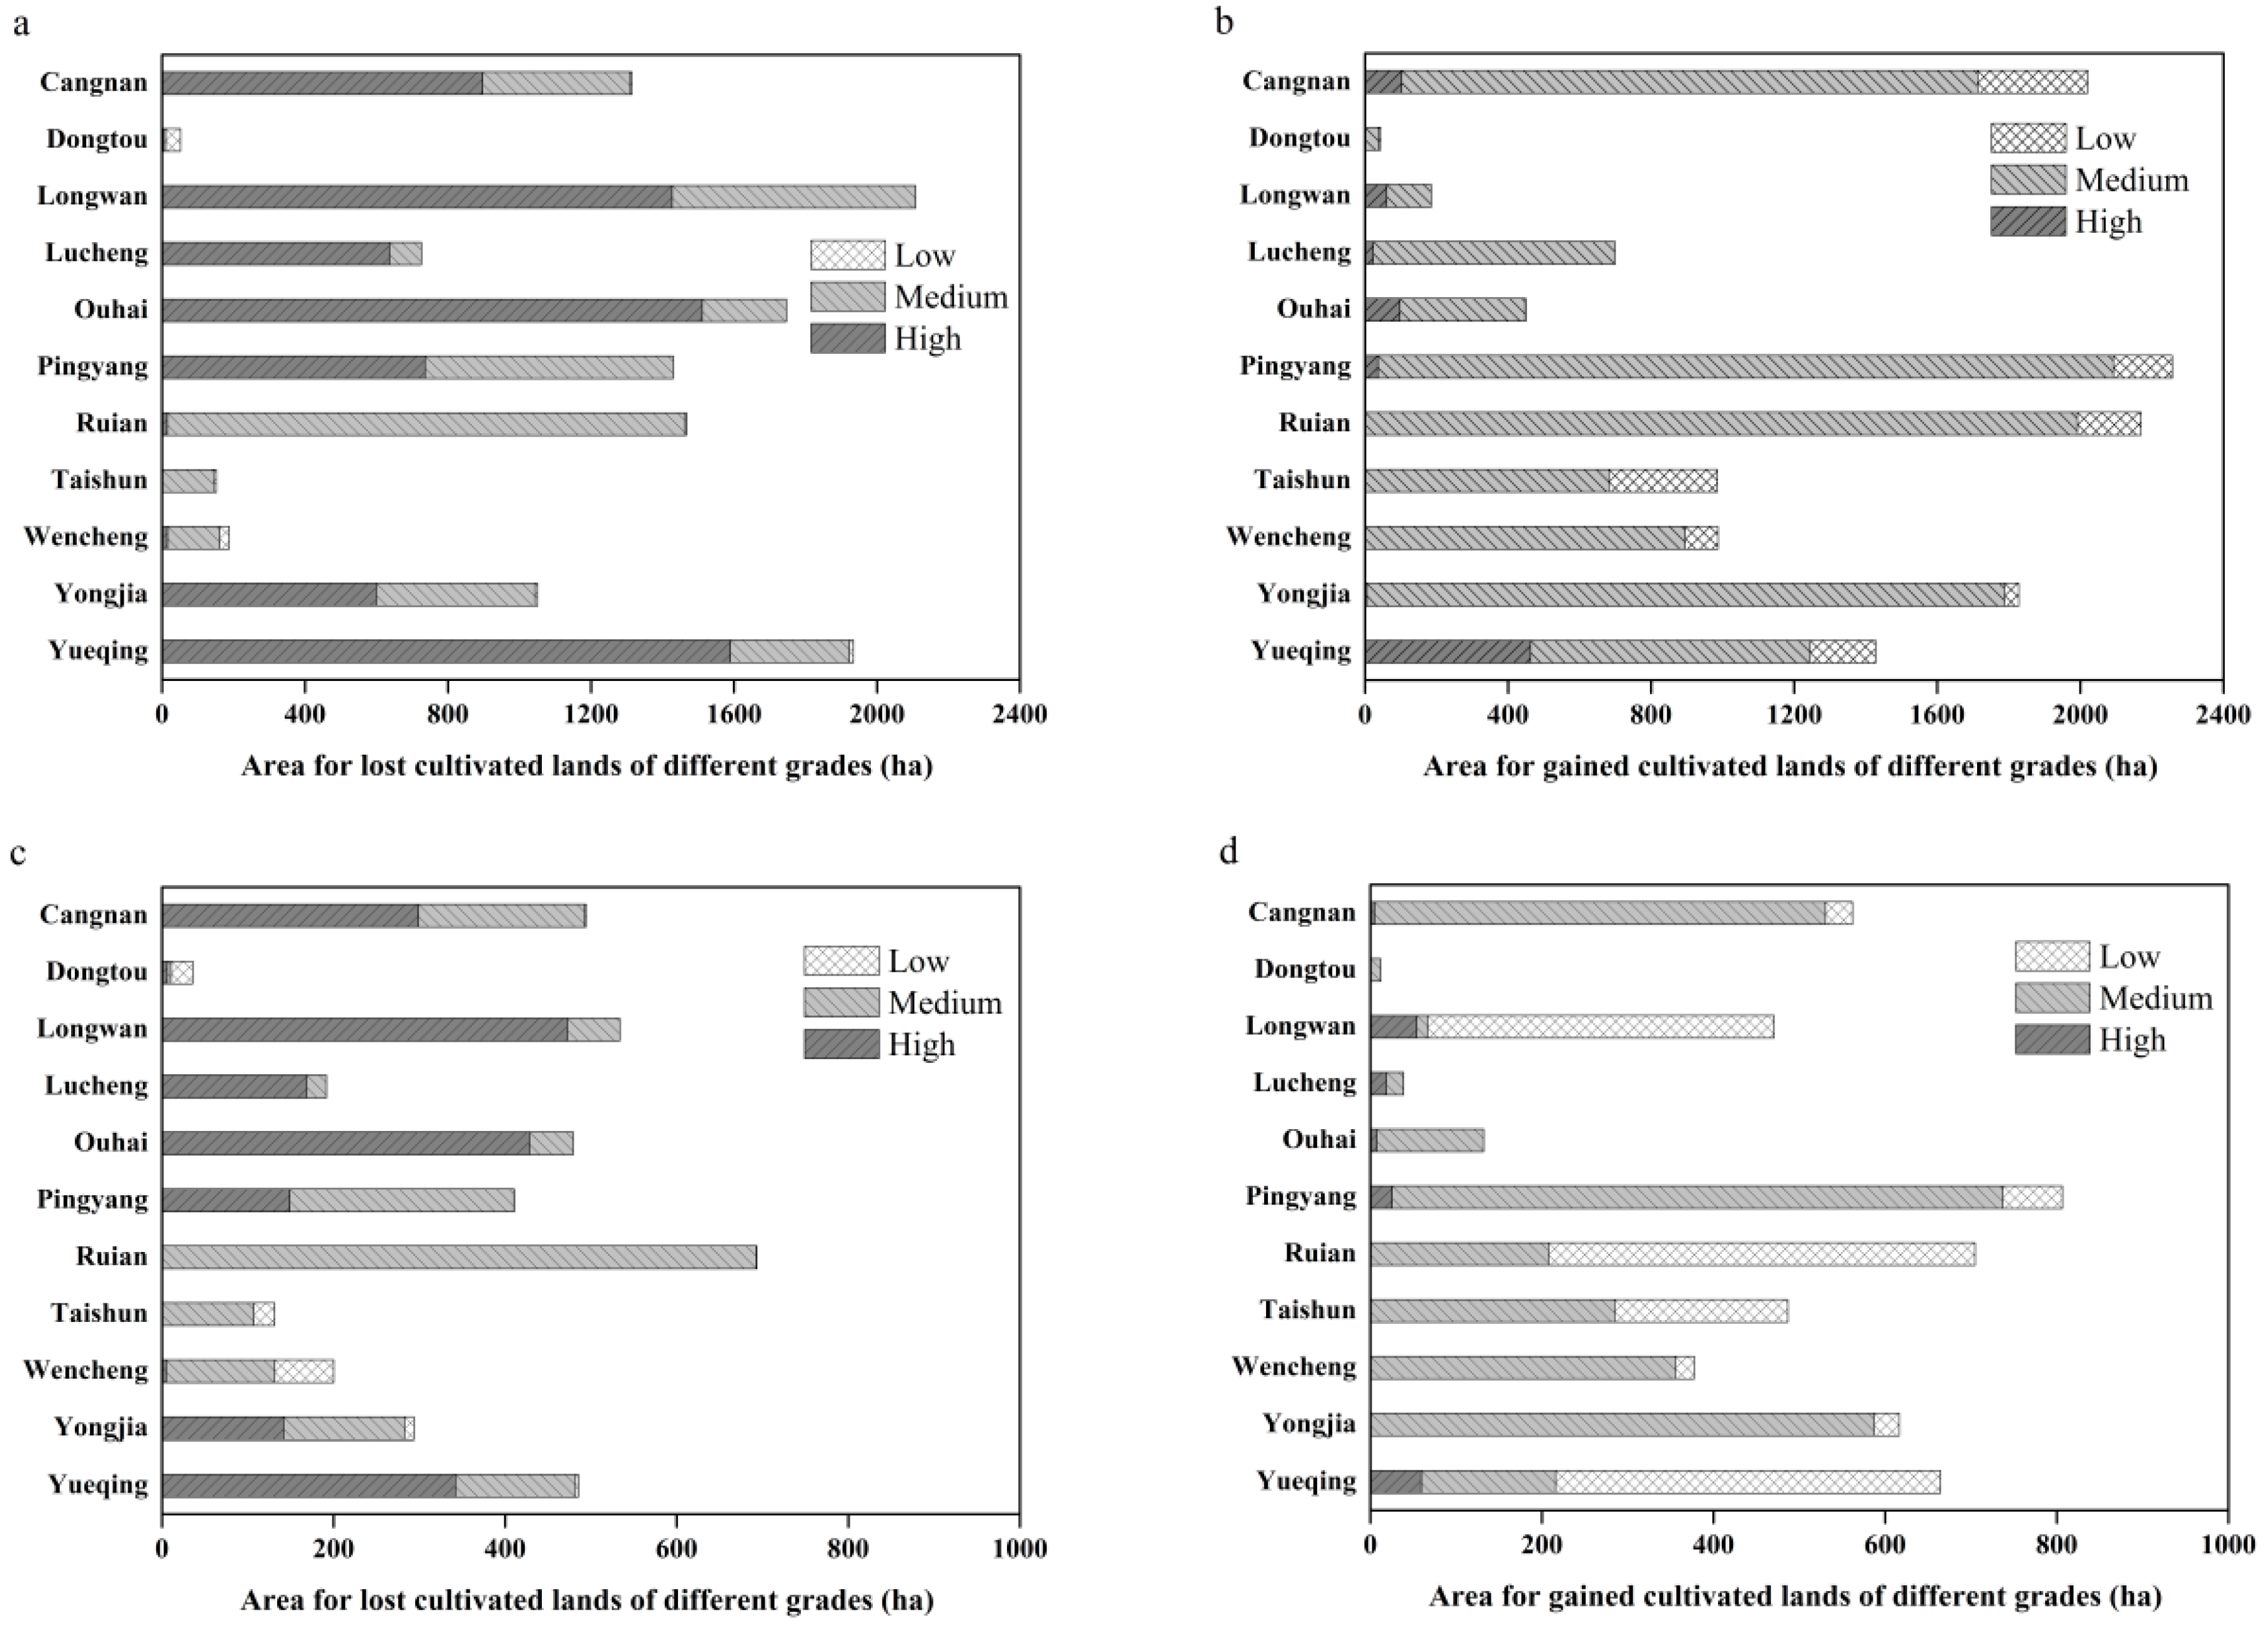
3.2. Quality Changes of Lost/Gained Cultivated Lands

The area of cultivated land changes of different quality grades and the relative change rate are shown in Table 3. High quality lands were the major contributor to the occupied cultivated lands in Wenzhou City (Figure 5), accounting for 58.58% of the total during the two periods. Meanwhile, 84.20% of the gained cultivated lands between 2005 and 2010 had medium quality, and the fraction of low quality land gain increased significantly during 2010–2014. The Rlh values in these two periods were calculated to be much higher than 1 (3.17 and 2.75, respectively), but the Rlm and Rll values were smaller than 1, revealing that high quality cultivated lands are the most vulnerable to being occupied with substantial relative consumption. When comparing the relative gain rate of cultivated land, we calculated the Rgm and Rgl values to be 1.14 and 1.40, respectively, during 2005–2010, with an Rgh value of 0.31. However, after 2010, the Rgl value increased sharply from 1.40 to 4.96, implying that the trend of supplementing higher quality cultivated land with lower quality land in Wenzhou was aggravated as time progressed.

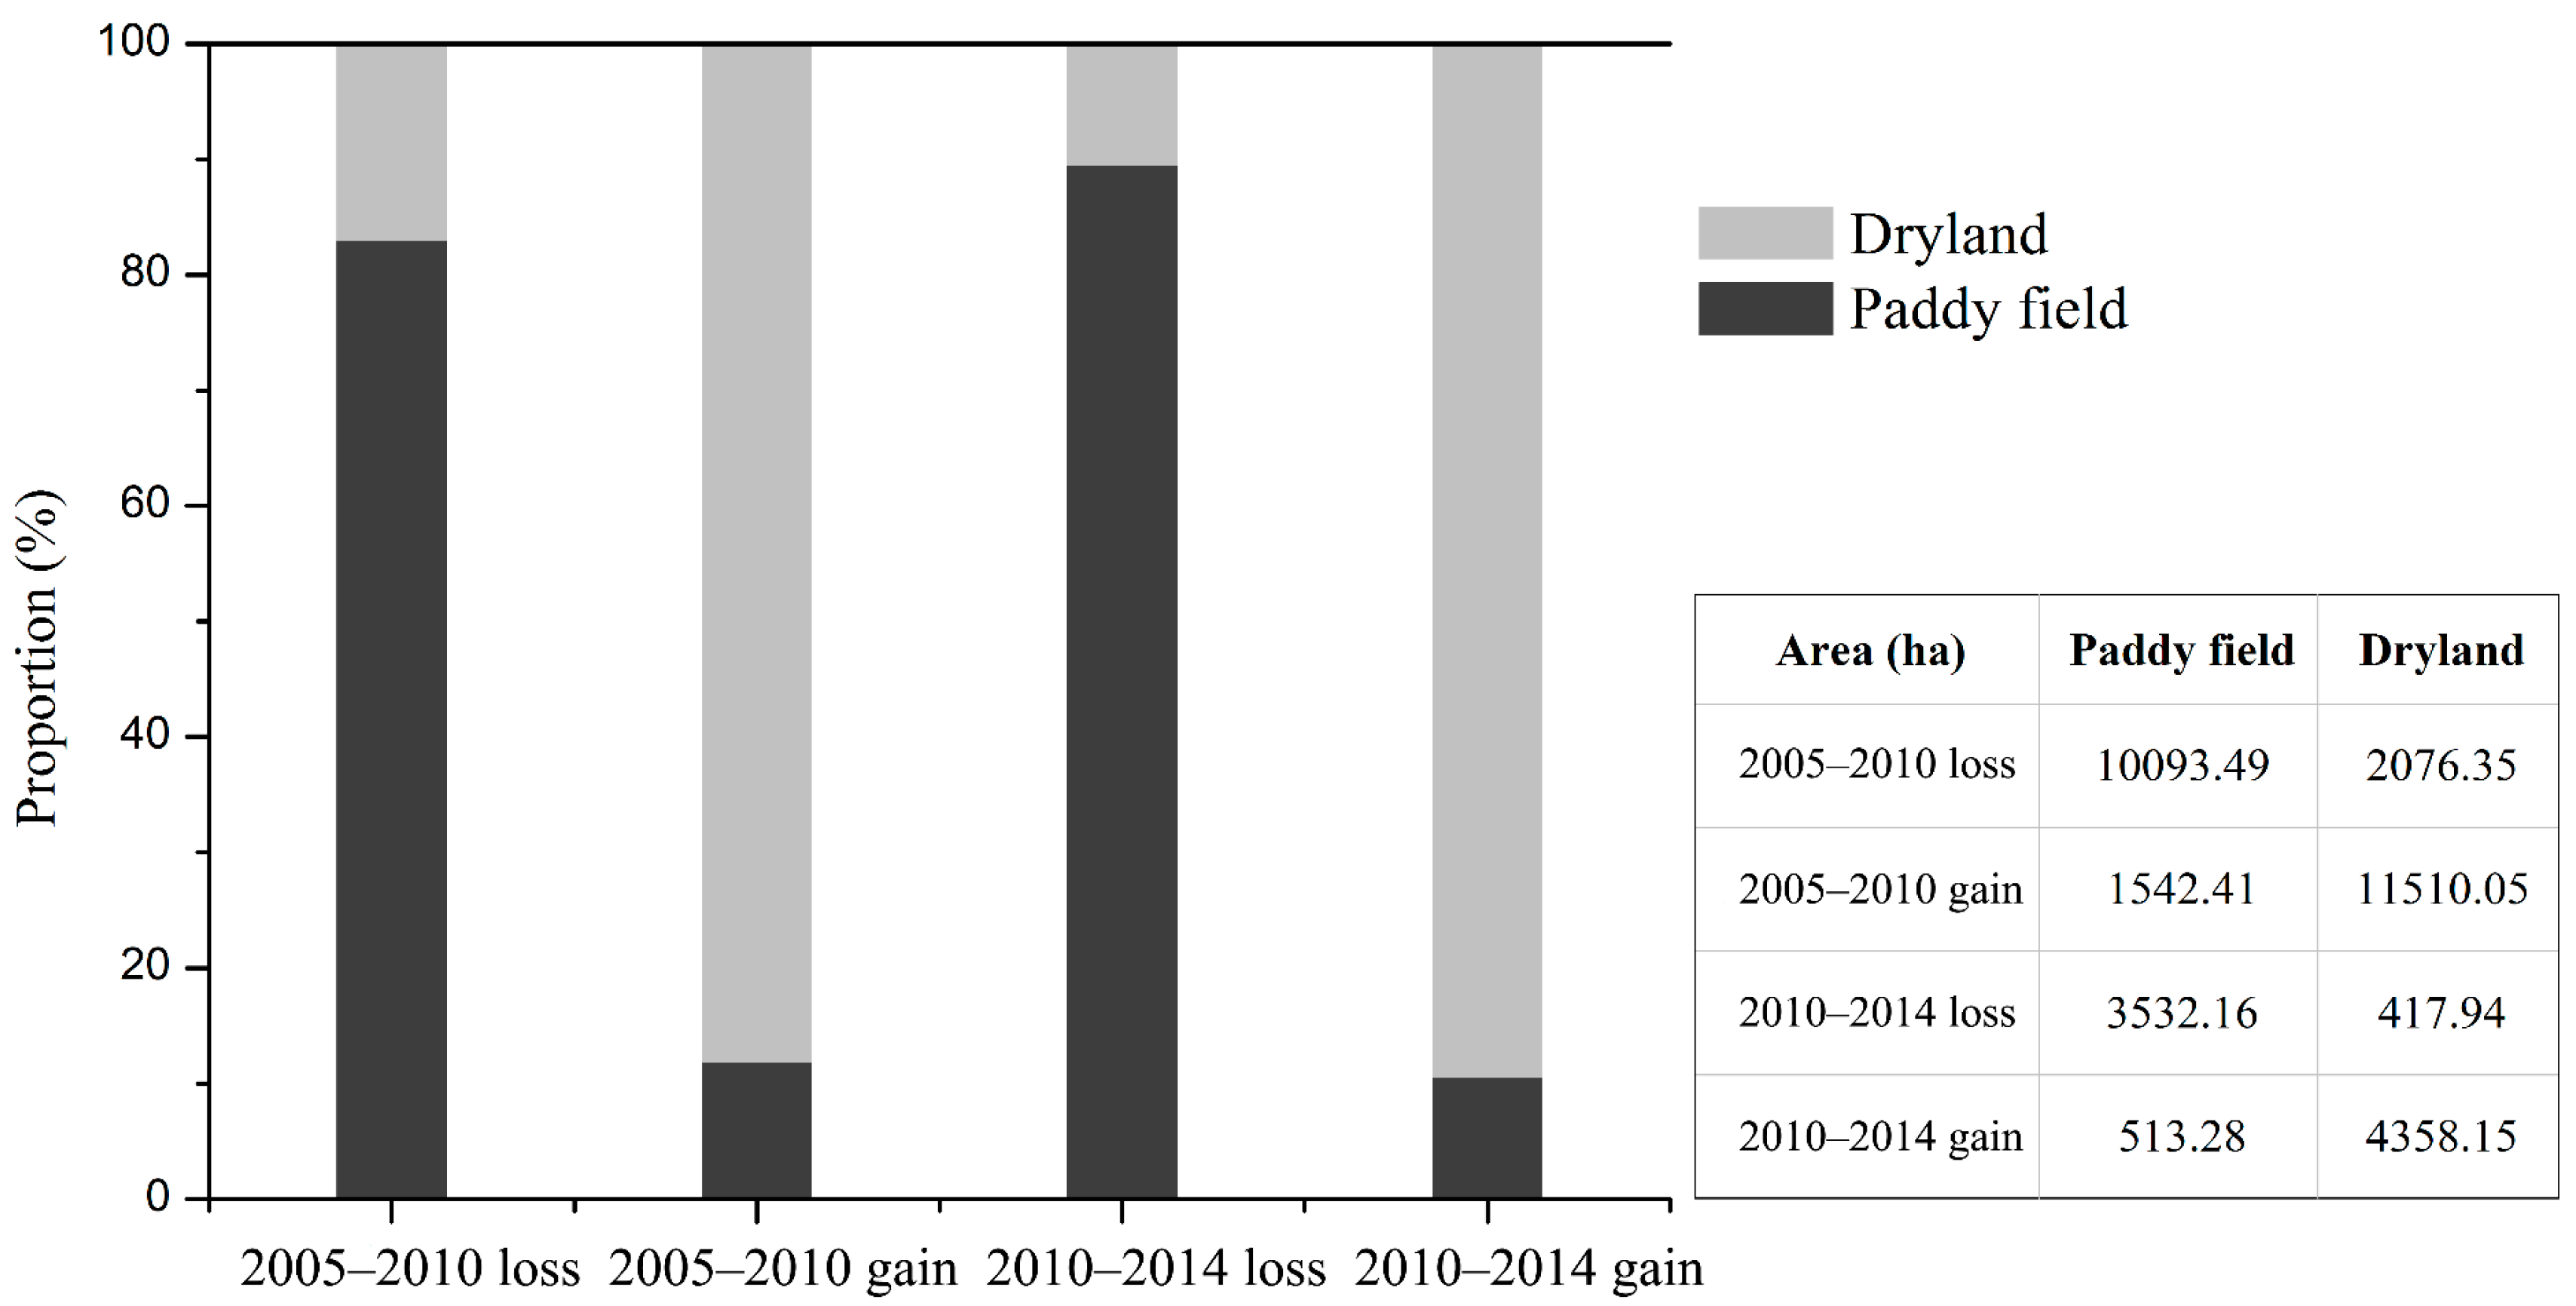
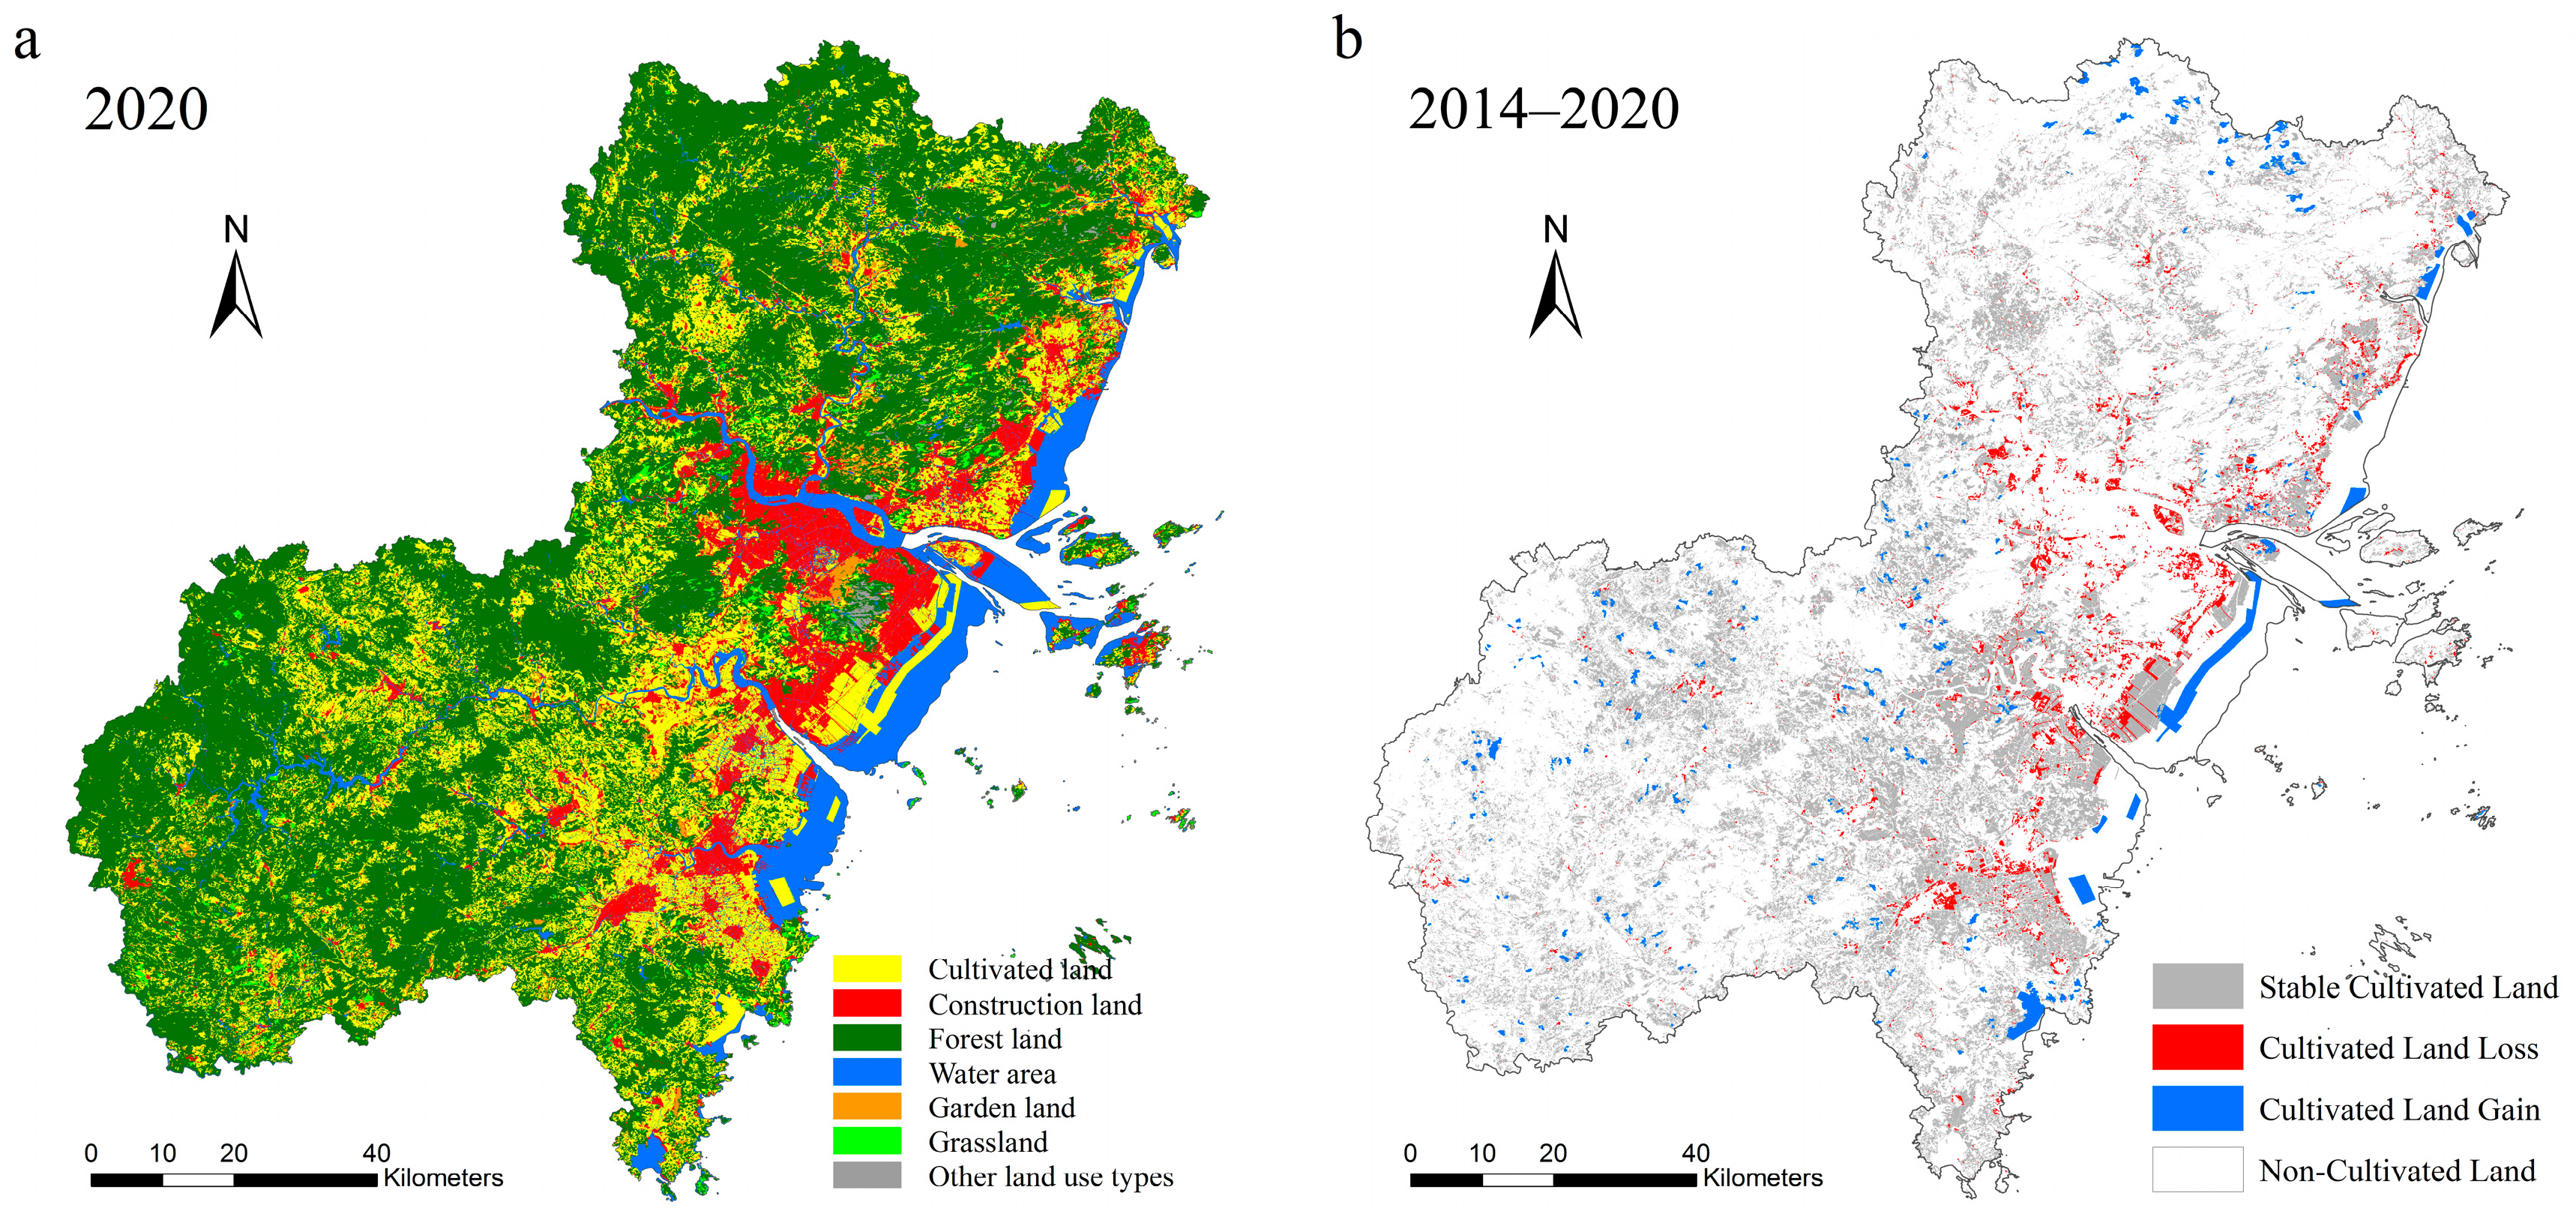
3.3. Composition of Lost/Gained Cultivated Lands

There are noticeable variations in changes among different cultivated land compositions in 2005–2010 and 2010–2014 (Figure 6). Paddy fields witnessed the most significant loss in the two periods, with 13,625.64 ha of paddy fields depleted for construction land, while only 2055.69 ha of paddy fields were gained. In contrast, there were 11,510.05 and 4358.15 ha of dryland gained from reclamation during these two periods, respectively, with the amount gained being much larger than the amount of dryland lost. Paddy fields should be considered an important resource, because not only do they support rice production, but they also provide multiple ecosystem services [27]. In this study area, however, paddy fields were more vulnerable to being sealed, accounting for 82.94% of the total lost cultivated lands between 2005 and 2010, and this proportion increased to 89.42% during 2010–2014. Dryland comprised the majority of cultivated lands gained, which contributed 88.18% of the land supplement during 2005–2010, and the trend continued during the next period.

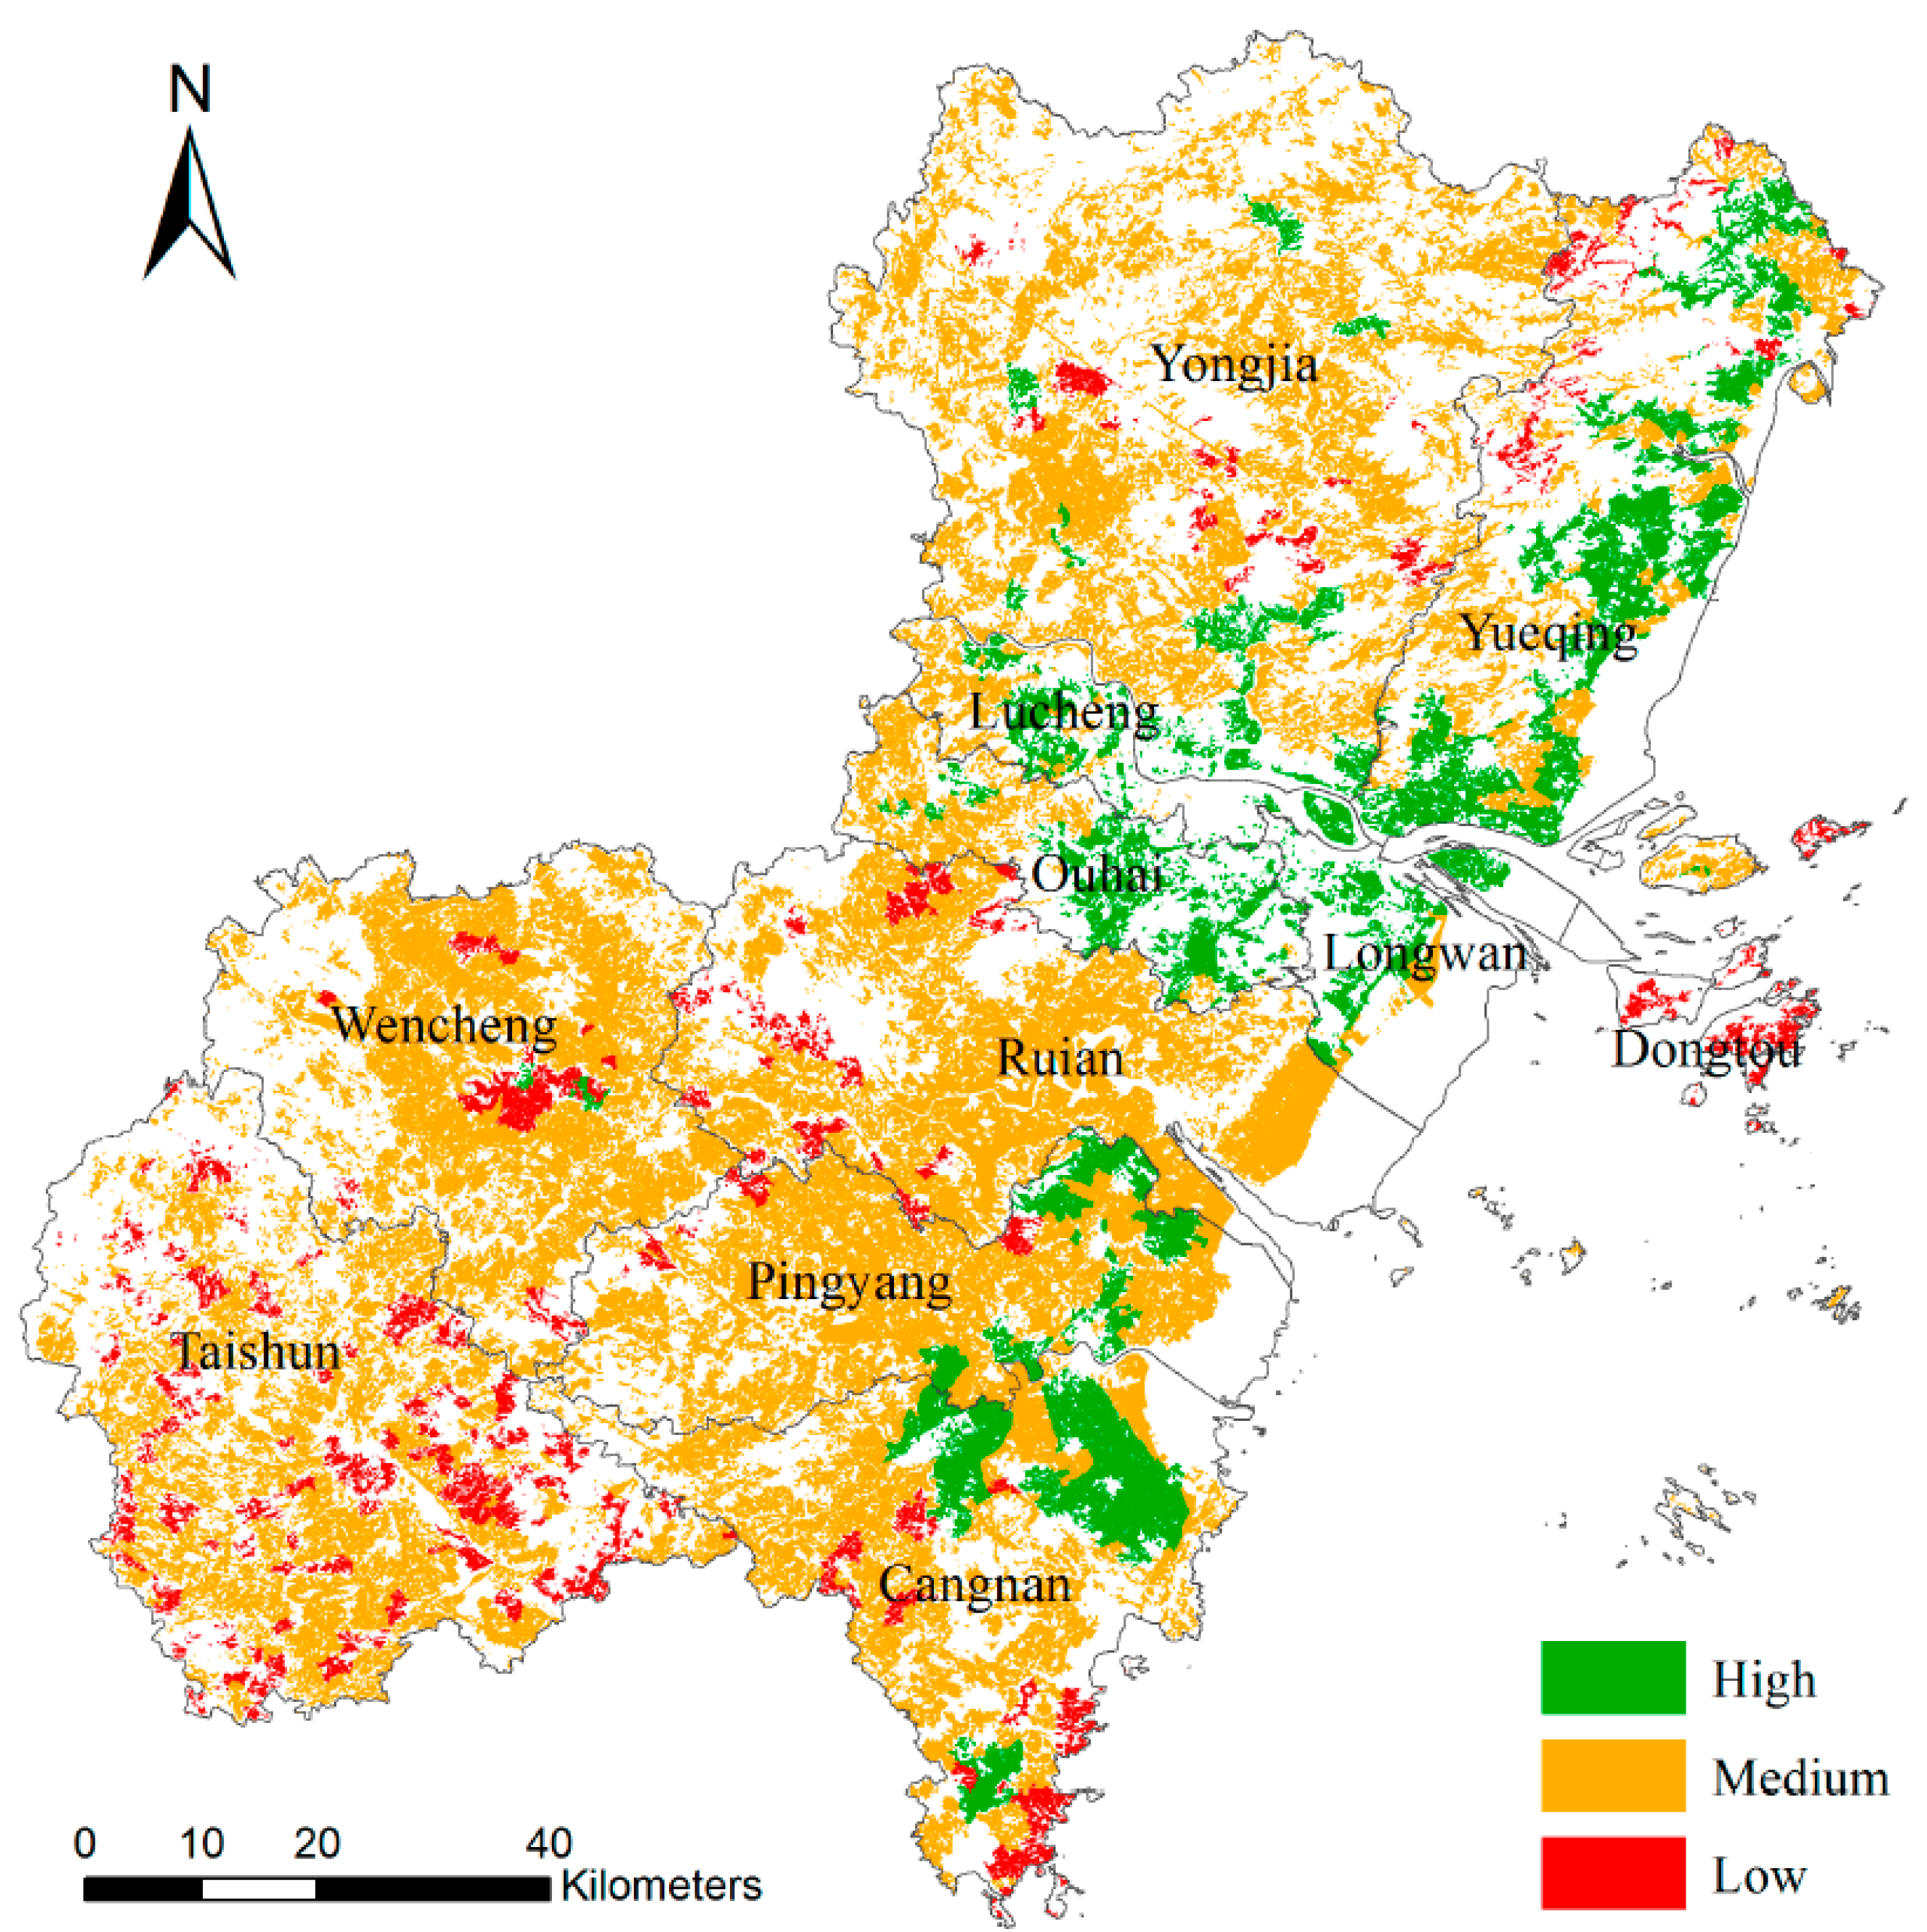
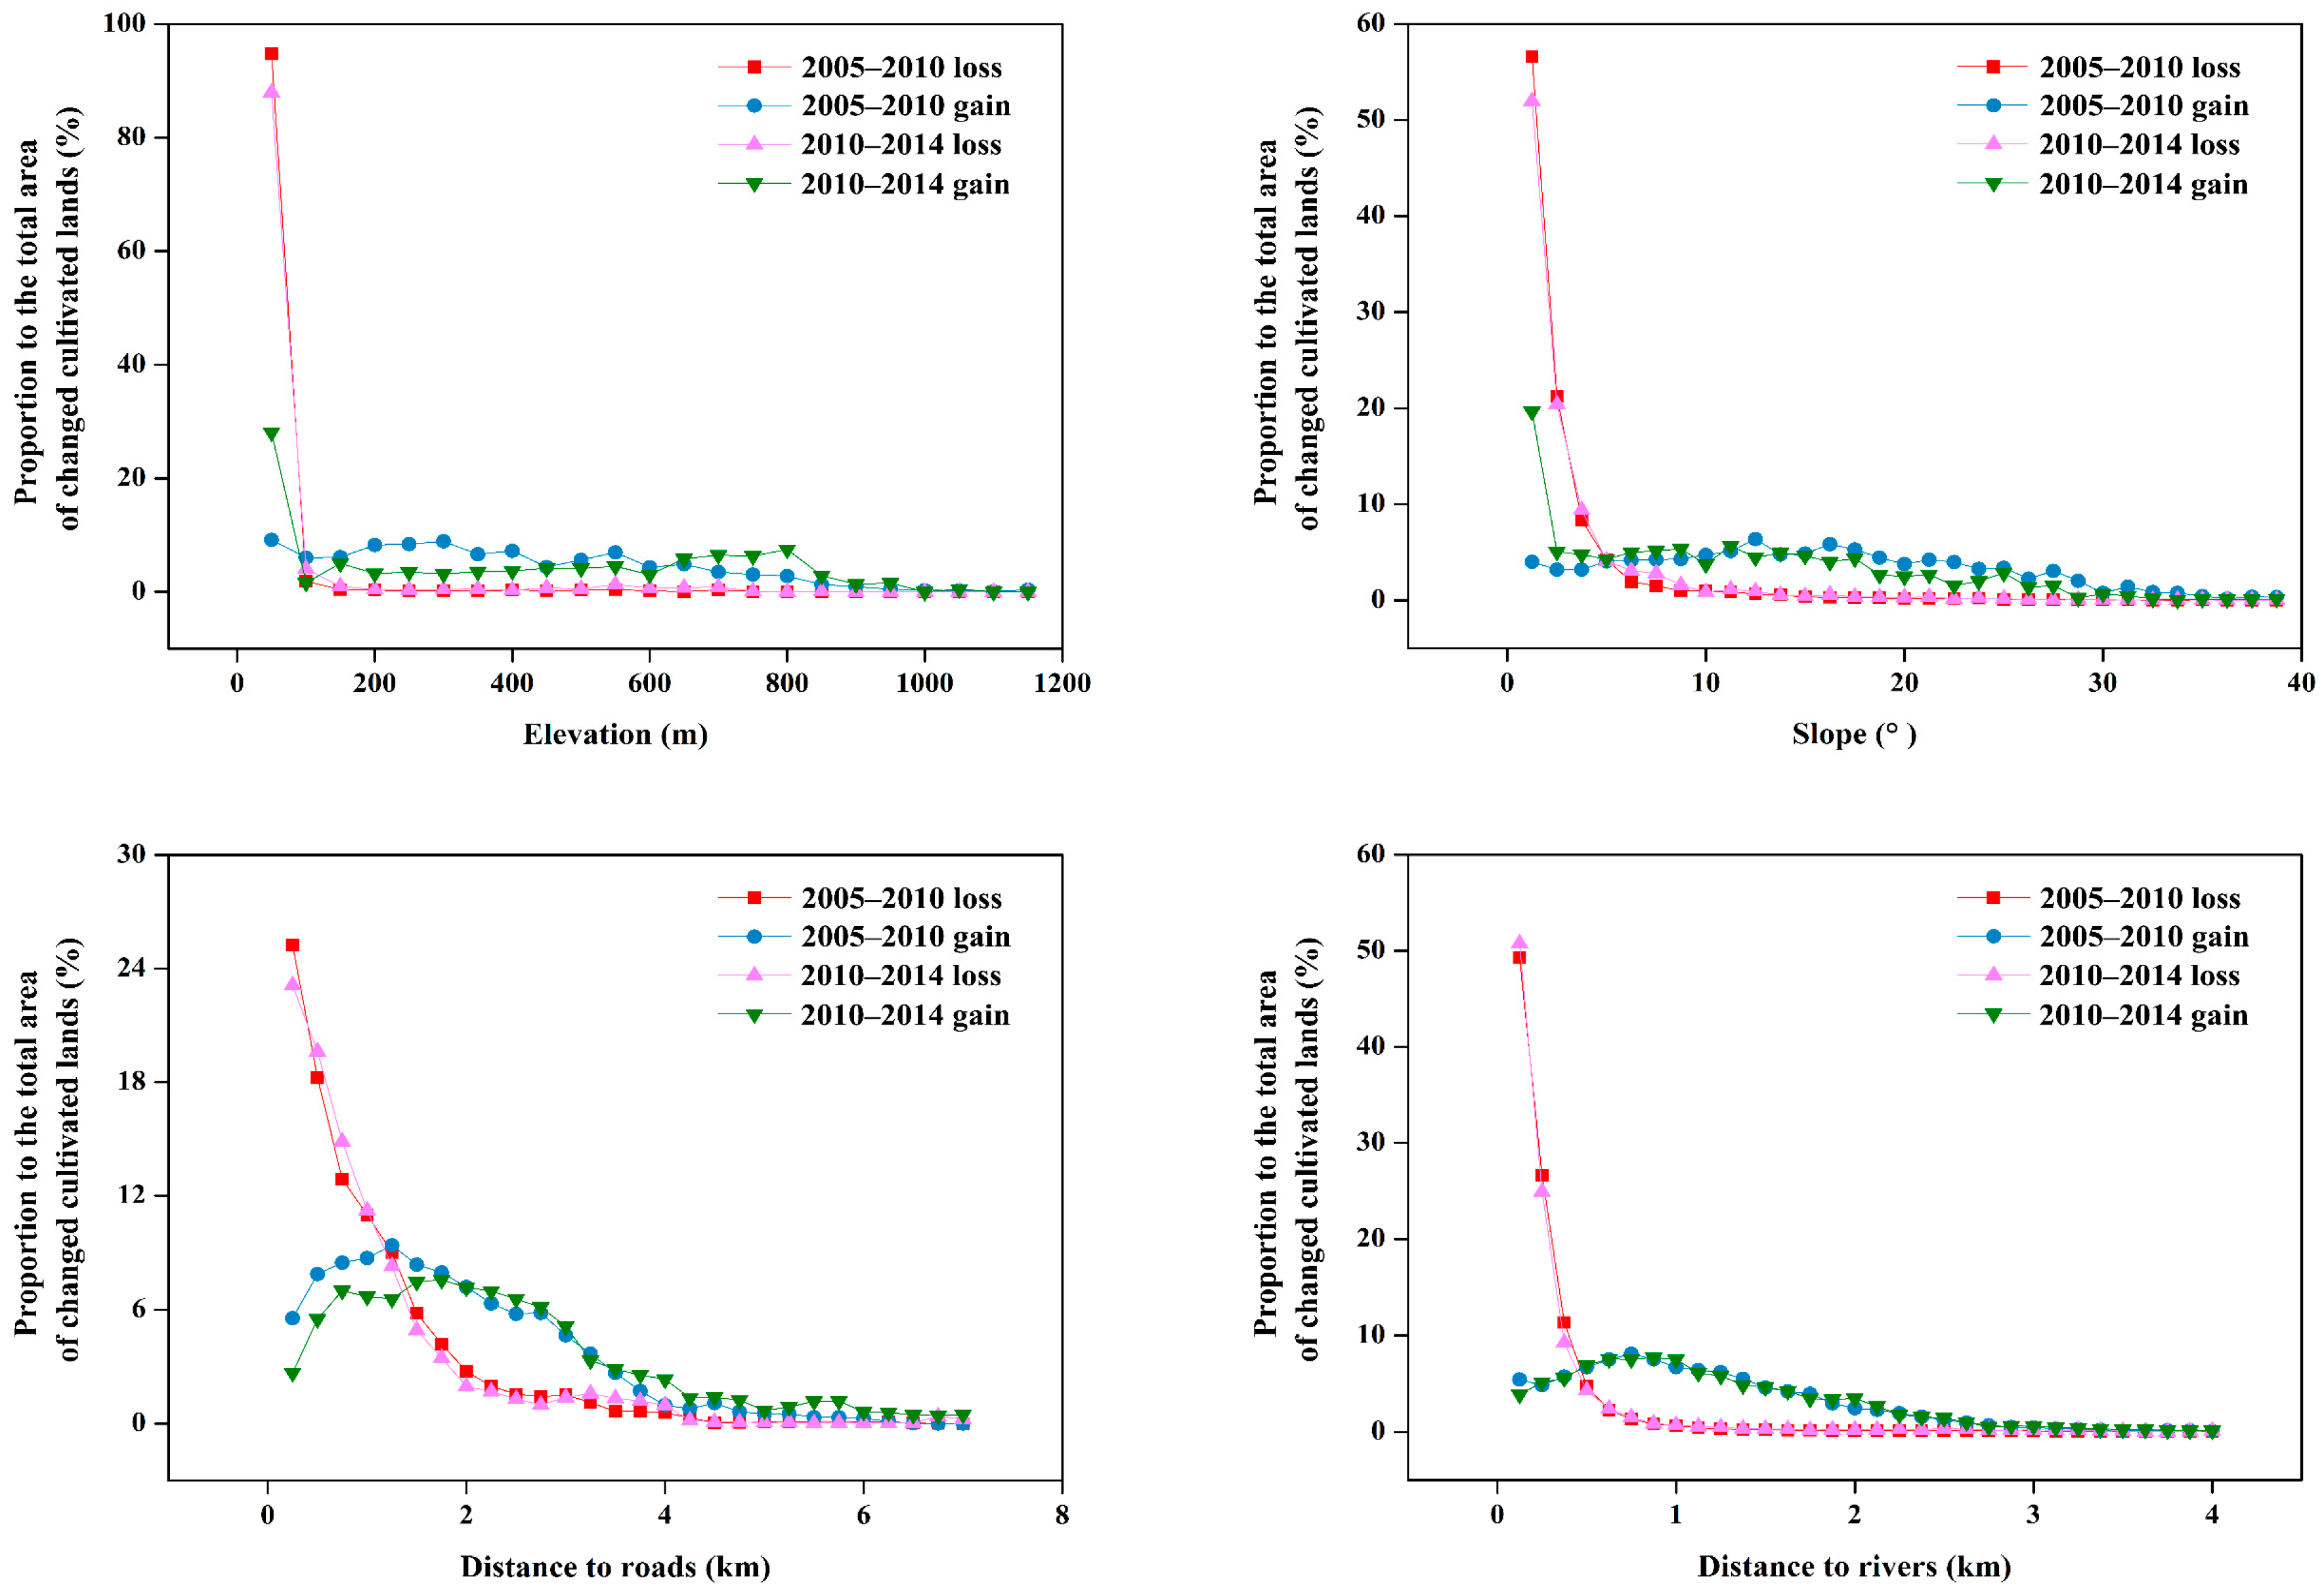
3.4. Trends of Cultivated Land Changes across Time and Space

The analysis of cultivated land loss (to construction) showed a significant preference for distance to roads and rivers, elevation and slope (Figure 7). Areas with elevations lower than 100 m were hotspots for cultivated land consumption, and over 50% of the cultivated land loss occurred in flat areas. Moreover, the tendency of cultivated land occupation decreased, with the distance to roads and rivers increased. Comparing the two periods studied, it was found that the trends of cultivated land loss were almost the same. This was easy to understand, because these areas are located near cities with convenient transportation, and low construction costs. This result is consistent with the opinion that urban land and cultivated land have a strong relationship in terms of spatial distribution [6].
The characteristics of spatial distribution of cultivated land gain were quite different compared to that of cultivated land loss. At elevations higher than 500 m, 30% of the cultivated land compensation during 2005–2010 still existed, and the fraction increased to 40% between 2010 and 2014. This demonstrated that the reserve resources of cultivated land at medium elevation were exhausted in the period 2005–2010, as was cultivated land at higher elevations after 2010. Meanwhile, it was found that the fraction of gained lands at lower elevations and in flat areas increased sharply in the second period, since there were a large number of coastal lands transformed into cultivated land during 2005–2010. The fraction of gained lands found with a slope larger than 15° was substantial, and exhibited little change within the two periods studied, and were highly vulnerable to erosion. Additionally, our findings showed an inverted U-shaped trend for land compensation associated with the distance to important networks such as roads and rivers, indicating that the new gained lands had a relatively poor potential for irrigation and, therefore, are considered unsuitable for farming [28].

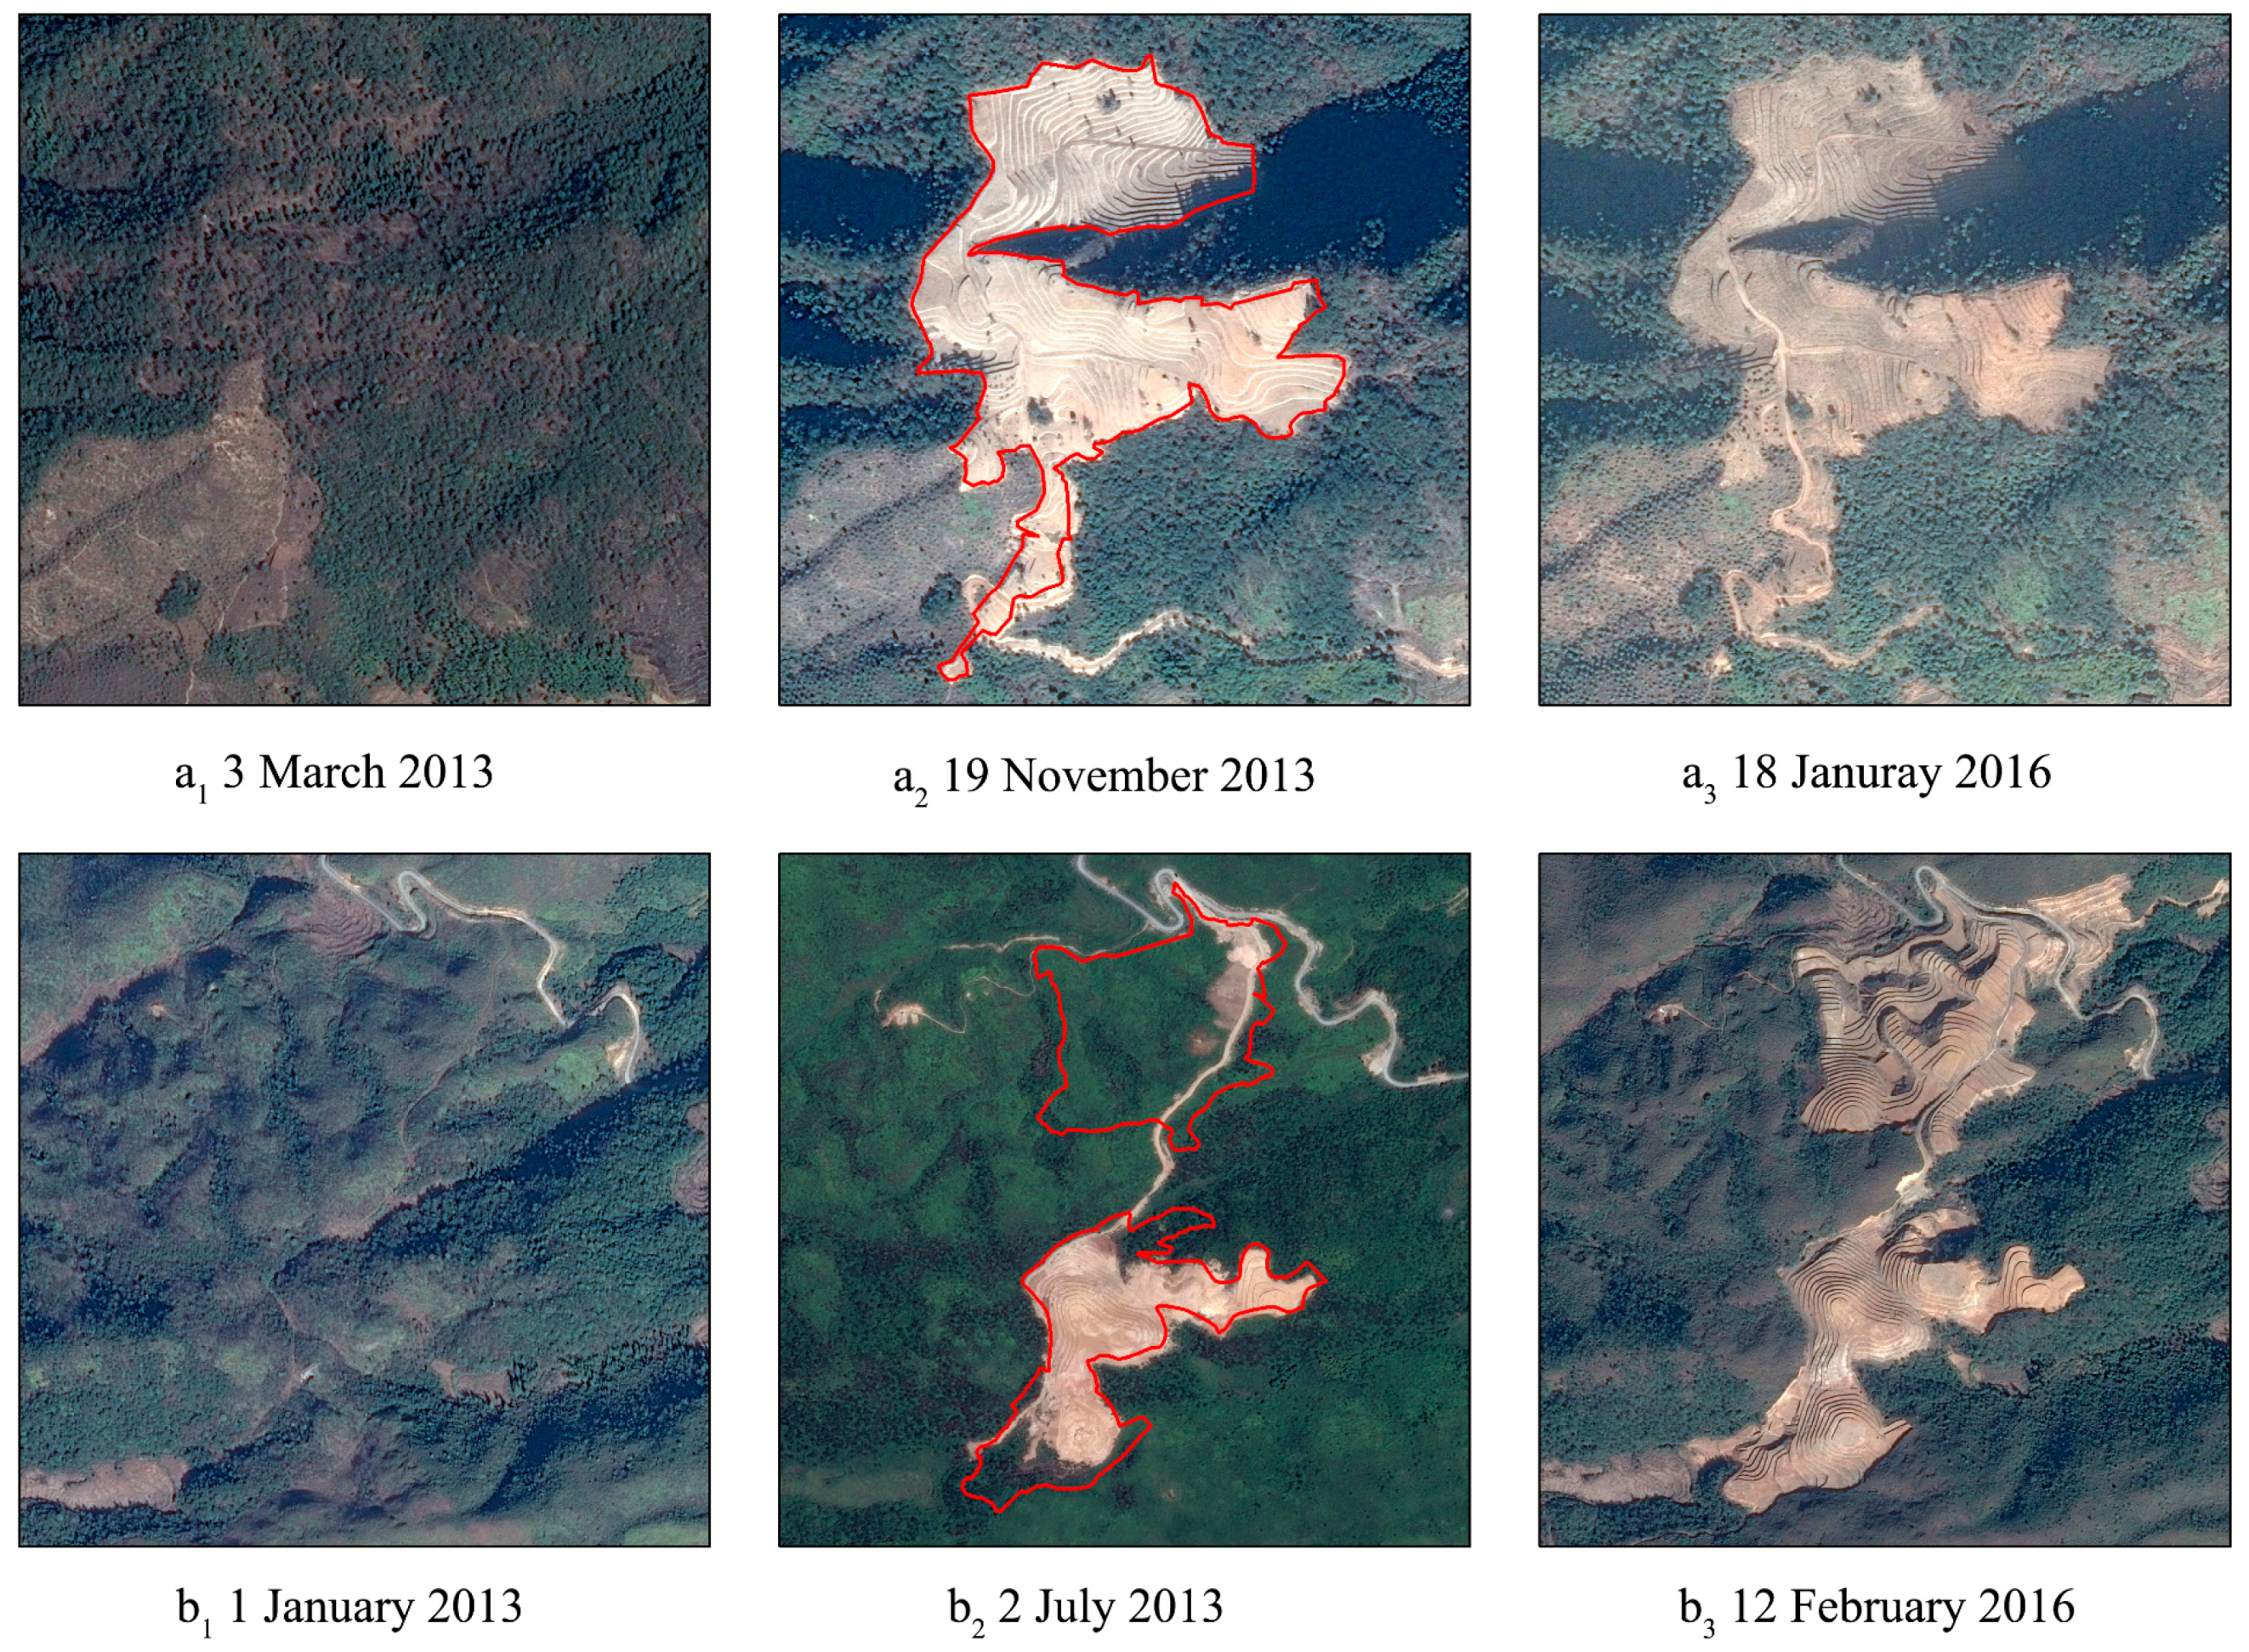
3.5. Utilization of Gained Cultivated Land Based on Remote-Sensing Images

Google Earth was used to understand cultivated lands in 2016 by providing further insight of different years for cultivated areas in Wenzhou City (Figure 8). As indicated by the data shown in Figure 8, a1 and b1 are images captured before reclamation was undertaken. The red line in a2 and b2 represents the newly added cultivated land patches. a3 and b3 in Figure 8 show that the gained lands, which were still bare in 2016, were generally reclaimed on the hills, surrounded by the forest, and were not connected with the previous cultivated lands. Land cover analysis using the imagery indicated that for the entirety of Wenzhou City, only 54% of the lands gained during 2010–2014 were under cultivation in 2016, 38% were still bare and 5% were used for aquaculture. The lands gained between 2005 and 2010 showed a similar situation, with 42% of the newly added lands remaining unused and an additional 15% converted to forest. Therefore, a large number of gained cultivated lands were indicated to be not farmable, consequently wasting a great number of investments and natural resources.

4. Discussion

4.1. Characterization of Quality and Quantity for Cultivated Land

During the period studied, land compensation in Wenzhou did meet the amount of lost cultivated lands, but the quality was decreased, because the lost high quality lands were compensated by lands with lower quality. Our results revealed that the decline (loss to construction) mainly occurred in the eastern plain where cultivated land quality is relatively high. Most of the gained cultivated lands, however, were distributed either in places with poor soil fertility or in the hilly areas with little agricultural facility. Moreover, we found that paddy fields were more vulnerable to be occupied, while the compensation activities preferred dryland. Therefore, in terms of food security, loss of the most productive cultivated land in Wenzhou City means that there could be future problems in terms of self-sufficient food production. This possibility has been supported by additional studies that show there has been a tendency in China to shift the best cultivated lands away from the prosperous eastern-coastal cities, and compensate less productive land in marginal provinces [27].
This study provides possible explanations of why high quality lands are more vulnerable to be occupation. Our results indicate that land loss in Wenzhou was concentrated in areas of low elevation with gentle slope, near rivers and roads, which is consistent with previous research that show that factors such as elevation and distance are important driving forces for farmland occupation [20,29,30,31,32]. Indeed, topography, water resources and accessibility substantially influence the spatial distribution of both construction lands and high quality farmlands. Farming was originally practiced near roads and rivers, in plains and level valleys, because of the accessibility of irrigation and cultivation. As a result of the long history of cultivation, the fertile soils produced high quality lands [33]. These factors also contributed to early settlements, and these areas were preferred for urban development, consequently reducing the amount of surrounding high quality cultivated lands as population growth and urban expansion continued [34,35,36].

4.2. Efficiency of Gained Cultivated Land

This study shows that a serious future problem is the low utilization ratio of newly added cultivated land. As indicated by our results, less than 60% of the total gained land areas were under cultivation in the period studied, while others were still bare or had been converted to forest land. Comparing the source of cultivated land gain, we found that forest land and grassland accounted for 80% of the total area between 2005 and 2010, however, due to the thin arable layer and low soil fertility, the lands gained from forest land and grassland are considered to have poor productivity [37]. Moreover, the land acquired from coastal land often suffers from soil salinization, and so is not suitable for farming [38]. From the spatial distribution, a number of the gained lands were in areas that were remote from rivers and roads, or in mountains with large slopes. The low land quality and inconvenient location often leave farmers with no alternative but to fallow cultivated land or abandon it completely. This may lead to a vicious circle of “exploitation–degradation–abandonment–exploitation”, with studies indicating that over time abandoned land may revert to forest land, and be completely lost as cultivated land [9,39].
The driving force behind this problem is incoherent communication between central and local government. Unlike cultivated land occupation, which mainly occurred in the eastern coastal area, land compensation was scattered over the entire city and very limited in the eastern plain. Nowadays, land finance has become an important source of local financial revenue. Local government acquired cultivated lands from farmers in the most prosperous regions at low costs, and sold these lands to developers for construction for great economic profit. As the policy maker and supervisor, central government is more concerned with food security for China, and puts forward mandatory requirements to maintain the dynamic balance of cultivated land. Under the pressure from the cultivated land requisition-compensation balance policy, the local government had to seek land replacement in the border areas, and explored grasslands, forest land, and coastal lands to replace the lost cultivated lands. Of these, the hilly and relatively underdeveloped regions are willing to accept the replacement for the economic compensation.

4.3. Prediction of Future Cultivated Land Changes

In Wenzhou City, the pace of cultivated land occupation was shown to slow down in the second period, concluding with previous studies that show that socio-economic development plays a key role in farmland loss [4,19,40,41,42]. It is widely recognized that the vitality of small private enterprises is the prime mover of the substantial economic growth in Wenzhou [43], with the city experiencing huge amounts of growth due to the prosperity of private enterprises in the period of 2005–2010. However, since Wenzhou’s sustained economic development relies heavily on exports, the global economic crisis triggered in 2008 strongly affected the development of foreign-oriented enterprises; this, therefore, could explain why the quantity of cultivated land loss to construction during 2010–2014 was much smaller.
Furthermore, such relative reduction does not mean that cultivated land conversion is under control. It is expected that Wenzhou will witness large amounts of land use change in the next few years because of the ongoing construction of the Hangzhou–Wenzhou high-speed railway and the promotion of ocean economy [44]. This has been projected in the Wenzhou General Land Use Plan (2006–2020) (Figure 9), and in Wang et al. [45], which indicated high amounts of development along the eastern coast of China, including Zhejiang Province. In accordance with the plan, we estimated future land use change, with predictions showing that construction lands are expected to expand by 19,964.91 ha, leading to a loss of 15,703.88 ha of cultivated lands from 2014 to 2020. In the meantime, 16,379.61 ha of cultivated lands will be gained by reclaiming coastal lands and forests, with the spatial distribution of the future cultivated land change being similar to that in previous years. This should be a concern for Wenzhou City, as the loss of the most productive cultivated land, and reclamation of more marginal land may lead to a reduction in cultivated production in the future.
Undoubtedly, factories, real estate, commercial malls, and other construction uses, can result in immediate economic returns. However, the long-term agricultural and environmental consequences of cultivated land conversion are immeasurable [46]. High quality cultivated land, as a scarce resource, was formed under the conditions of a series of limitations, such as topography, climate, irrigation level, and soil quality [47]. Once converted to construction, it would be difficult for prime land to be converted back since the unique soil properties have been removed. Given this fact, the preferential consumption of high quality cultivated lands may cause production loss, increase the input costs in less productive lands, and even affect long-term food sustainability. From the aspect of environmental protection, the blind conversion of forests and grasslands to cultivated lands can cause soil erosion and land degradation. The coastal land region is a vulnerable eco-environmental zone; its reclamation involves filling shoals and destroying wetlands, which can cause a decrease in the biodiversity along the coast and the reduction of self-adjusting functions of the ecosystem. Therefore, reclaiming more remote land can only cause more abandonment of damaged land, which may aggravate environmental degradation.

4.4. Policy and Management Implications

China’s requisition-compensation balance policy has experienced continuous evolution in the years studied in order to protect important cultivated land resources [48,49]. The policy was implemented in 1997 to maintain the amount of existing cultivated land. The development of this policy from simple quantity balance (1997) to quantity-quality balance (2004), where quality balance was emphasized, has not seen the expected effect due to the lack of valid quality judgment standards and test mechanisms for the gained cultivated land. In response, the MLRC implemented the policy of “occupied paddy, supplemented paddy” in 2014 to protect productive lands, which requires the administrations to compensate the equivalent amount of paddy field, if the paddy field was occupied by construction [50]. The goal and object of this policy is understandable, however, both its positive and negative consequences have been shown in this study. Our studies confirm that the requisition-compensation balance policy did achieve the quantity balance during 2005–2014. However, the depletion of high quality cultivated lands, recession of the traditional agriculture, and negative impacts on the environment, such as deforestation and the abandonment of gained cultivated lands, have not been considered in these policies. Furthermore, even if the quality balance had been achieved, fragmentation of cultivated land would be an issue due to the cultivated land being divided into smaller patches [51].
The limitation of this policy lies mainly in its one-size-fits-all approach, which requires the same level of land protection in all regions and at all administrative levels [52]. Cultivated land is a resource that has spatial-temporal variation, and therefore this should be taken into account especially in terms of quantity, quality and spatial distribution. Oregon, USA has the experience of more than 40 years on its land-use planning program, and is often cited as an exemplary approach to farmland conservation [53]. While compared with the neighboring Washington State where the land use restrictions had not been imposed, Oregon showed more effective in concentrating development and preserving forest and cultivated lands [54]. The implementation of urban growth boundary and exclusive farm use zoning provide several major implications for cultivated land protection in China. Therefore, in terms of future management practices, we suggest that a “cultivated land protection red line” is needed to strengthen the protection of high quality cultivated land. To devise the protection red line, we should first evaluate the agricultural value and promote different levels of agricultural zoning. Then, the continuous and high quality cultivated lands need to be protected by the “red line”, and urban expansion needs to be prohibited in the long term. Additionally, in ecologically fragile areas, land exploitation must be forbidden, and efforts should be taken to recover vegetation and to control soil erosion, along with a scientific land compensation plan avoiding randomly adding cultivated land is also needed.
The demonstrated methodological framework is not restricted to Wenzhou City, and it can be applicable to the whole China. The required data include the land use data of China in a certain period, the ALCG data of China, DEM, river and road data. Further study is therefore believed to advance in a large study area.

5. Conclusions

This study examined cultivated land changes under the requisition-compensation balance policy in Wenzhou City in eastern China over two past time periods comprising 2005–2014. To improve the understanding of quality changes for the cultivated land dynamic balance, we comprehensively analyzed cultivated land occupation and compensation based on remote sensing and geographic information systems in terms of four aspects: quantity, quality, composition, and spatial variation. To evaluate the effectiveness of this policy, which is considered important for future management strategies, the utilization of gained cultivated land was examined further.
During the period studied, the goal of quantity balance of cultivated land was achieved. However in terms of spatial variations a remarkable loss of cultivated land occurred in the eastern plain of Wenzhou City, near rivers and roads where the land quality is relatively high. In contrast, the gained cultivated lands were scattered in the less productive border regions where poor natural conditions are prevalent. Moreover, our study found that paddy fields were more vulnerable to occupation, while the compensation lands were almost drylands. In addition, and more importantly, less than 60% of the gained lands were under cultivation, with a large number of lands still bare, or converted to forests or fish ponds.
The results of this study suggest that the preferential occupation of high quality lands but compensation with low quality lands has become a serious problem. Moreover, the low utilization ratio of newly added lands also requires immediate attention. Topography, water resources and accessibility may contribute to the quality dynamics of cultivated land, while the driving force behind it is the confrontation between the local government’s interests and the central government’s mandatory requirements. It should be noted that the depletion of high quality lands and the blind exploitation of forest land and coastal land have a detrimental impact on food security and environmental sustainability. The requisition-compensation balance policy, which aims at improving the protection of cultivated land, has experienced continuous evolution in the years studied. However, more is required with our research findings indicating that there are limitations of this policy, especially from a quality perspective. Therefore, to simultaneously protect high quality cultivated land and encourage intensive urban land use, we suggest that a “cultivated land protection red line” be implemented to improve the current cultivated land balance policy and, additionally, prohibit land exploitation in ecologically fragile areas to prevent further environmental damage.

Acknowledgments

This research was funded by the National Natural Science Foundation of China (Grant No. 41401595), the National Science-technology Support Projects (Grant No. 2015BAC02B00), Science Technology Department of Zhejiang Province (Grant No. 2015F50056) and the Natural Science Foundation of Zhejiang Province (Grant No. LQ17D010003). The authors thank the Editor and two anonymous reviewers for their constructive comments, suggestions and help in enhancing the manuscript.

Author Contributions

Lin Lin, Ke Wang, and Shenggao Lu had the original idea for the study, and all of the co-authors conceived and designed the methodology. Lin Lin and Ziran Ye analyzed the data. Lin Lin wrote the paper, which was revised by Muye Gan, Amir Reza Shahtahmassebi, Melanie Weston, and Ke Wang. All authors read and approved the final manuscript.

Conflicts of Interest

The authors declare no conflicts of interest.

References

  1. Antón, J.; Cattaneo, A.; Kimura, S.; Lankoski, J. Agricultural risk management policies under climate uncertainty. Glob. Environ. Chang. 2013, 23, 1726–1736. [Google Scholar] [CrossRef]
  2. Liu, Y.S.; Wang, J.Y.; Long, H.L. Analysis of arable land loss and its impact on rural sustainability in Southern Jiangsu Province of China. J. Environ. Manag. 2010, 91, 646–653. [Google Scholar] [CrossRef] [PubMed]
  3. Su, S.; Zhang, Q.; Zhang, Z.; Zhi, J.; Wu, J. Rural settlement expansion and paddy soil loss across an ex-urbanizing watershed in eastern coastal China during market transition. Reg. Environ. Chang. 2011, 11, 651–662. [Google Scholar] [CrossRef]
  4. Van vliet, J.; de Groot, H.L.F.; Rietveld, P.; Verburg, P.H. Manifestations and underlying drivers of agricultural land use change in Europe. Landsc. Urban Plan. 2015, 133, 24–36. [Google Scholar] [CrossRef]
  5. Houghton, R.A.; Hackler, J.L. Sources and sinks of carbon from land-use change in China. Glob. Biogeochem. Cycles 2003, 17, 1–3. [Google Scholar] [CrossRef]
  6. Tan, M.; Li, X.; Xie, H.; Lu, C. Urban land expansion and arable land loss in China—A case study of Beijing–Tianjin–Hebei region. Land Use Policy 2005, 22, 187–196. [Google Scholar] [CrossRef]
  7. Albersen, P.; Fischer, G.; Keyzer, M.; Sun, L.; Jernelv, A. Estimation of agricultural production relations in the LUC Model for China. Nucleic Acids Res. 2001, 37, e107. [Google Scholar]
  8. Ramankutty, N.; Foley, J.A.; Olejniczak, N.J. People on the Land: Changes in Global Population and Croplands during the 20th Century. AMBIO J. Hum. Environ. 2002, 31, 251–257. [Google Scholar] [CrossRef]
  9. Yang, H.; Li, X. Cultivated land and food supply in China. Land Use Policy 2000, 17, 73–88. [Google Scholar] [CrossRef]
  10. Ho, S.P.S.; Lin, G.C.S. Converting land to nonagricultural use in China’s coastal provinces: Evidence from Jiangsu. Mod. China 2004, 30, 81–112. [Google Scholar] [CrossRef]
  11. National Bureau of Statistical of China. China Statistical Yearbook, 1979; China Statistics Press: Beijing, China, 1979. (In Chinese) [Google Scholar]
  12. National Bureau of Statistical of China. China Statistical Yearbook, 1997; China Statistics Press: Beijing, China, 1997. (In Chinese) [Google Scholar]
  13. Liu, Y.; Liu, Y.; Jiao, L.; Zhang, Y. Analysis on the dynamic balance between cultivated land supply and demand at multimeasures based on RS data. Proc. SPIE Int. Soc. Opt. Eng. 2004, 5232, 173–183. [Google Scholar]
  14. Xiao, L.; Yang, X.; Cai, H.; Zhang, D. Cultivated Land Changes and Agricultural Potential Productivity in Mainland China. Sustainability 2015, 7, 11893–11908. [Google Scholar] [CrossRef]
  15. Imhoff, M.L.; Lawerence, W.T.; Stutzer, D.; Elvidge, C. Assessing the Impact of Urban Sprawl on Soil Resources in the United States Using Nighttime “City Lights” Satellite Images and Digital Soils Maps. Available online: http://biology.usgs.gov/luhna/chap3.html (accessed on 30 December 2016).
  16. Francis, C.A.; Hansen, T.E.; Fox, A.A.; Hesje, P.J.; Nelson, H.E.; Lawseth, A.E.; English, A. Farmland conversion to non-agricultural uses in the US and Canada: Current impacts and concerns for the future. Int. J. Agric. Sustain. 2012, 10, 8–24. [Google Scholar] [CrossRef]
  17. Ceccarelli, T.; Bajocco, S.; Perini, L.; Salvati, L. Urbanisation and Land Take of High Quality Agricultural Soils—Exploring Long-term Land Use Changes and Land Capability in Northern Italy. Int. J. Environ. Res. 2013, 8, 181–192. [Google Scholar]
  18. Del Mar López, T.; Aide, T.M.; Thomlinson, J.R. Urban Expansion and the Loss of Prime Agricultural Lands in Puerto Rico. AMBIO J. Hum. Environ. 2001, 30, 49–54. [Google Scholar] [CrossRef]
  19. Deng, J.S.; Qiu, L.F.; Wang, K.; Yang, H.; Shi, Y.Y. An integrated analysis of urbanization-triggered cropland loss trajectory and implications for sustainable land management. Cities 2011, 28, 127–137. [Google Scholar] [CrossRef]
  20. Zhong, T.; Huang, X.; Zhang, X.; Wang, K. Temporal and spatial variability of agricultural land loss in relation to policy and accessibility in a low hilly region of southeast China. Land Use Policy 2011, 28, 762–769. [Google Scholar] [CrossRef]
  21. Su, S.; Ma, X.; Xiao, R. Agricultural landscape pattern changes in response to urbanization at ecoregional scale. Ecol. Indic. 2014, 40, 10–18. [Google Scholar] [CrossRef]
  22. Morelli, S.; Segoni, S.; Manzo, G.; Ermini, L.; Catani, F. Urban planning, flood risk and public policy: The case of the Arno River, Firenze, Italy. Appl. Geogr. 2012, 34, 205–218. [Google Scholar] [CrossRef]
  23. Munroe, D.K.; Croissant, C.; York, A.M. Land use policy and landscape fragmentation in an urbanizing region: Assessing the impact of zoning. Appl. Geogr. 2005, 25, 121–141. [Google Scholar] [CrossRef]
  24. Thompson, A.W.; Prokopy, L.S. Tracking urban sprawl: Using spatial data to inform farmland preservation policy. Land Use Policy 2009, 26, 194–202. [Google Scholar] [CrossRef]
  25. Feng, C.; Hongbo, W.; Wenju, Y. Study on Investigation and Assessment of Cultivated Land Quality Grade in China. China Land Sci. 2014, 75, 75–82. [Google Scholar]
  26. Song, W.; Pijanowski, B.C. The effects of China’s cultivated land balance program on potential land productivity at a national scale. Appl. Geogr. 2014, 46, 158–170. [Google Scholar] [CrossRef]
  27. Natuhara, Y. Ecosystem services by paddy fields as substitutes of natural wetlands in Japan. Ecol. Eng. 2013, 56, 97–106. [Google Scholar] [CrossRef]
  28. Walters, S.A.; Groninger, J.W. Water distribution systems and on-farm irrigation practices: Limitations and consequences for Afghanistan’s agricultural productivity. Water Int. 2014, 39, 348–359. [Google Scholar] [CrossRef]
  29. Linke, J.; Franklin, S.E.; Huettmann, F.; Stenhouse, G.B. Seismic Cutlines, Changing Landscape Metrics and Grizzly Bear Landscape use in Alberta. Landsc. Ecol. 2005, 20, 811–826. [Google Scholar] [CrossRef]
  30. Su, S.; Zhou, X.; Wan, C.; Li, Y.; Kong, W. Land use changes to cash crop plantations: Crop types, multilevel determinants and policy implications. Land Use Policy 2016, 50, 379–389. [Google Scholar] [CrossRef]
  31. Zhang, Z.; Su, S.; Xiao, R.; Jiang, D.; Wu, J. Identifying determinants of urban growth from a multi-scale perspective: A case study of the urban agglomeration around Hangzhou Bay, China. Appl. Geogr. 2013, 45, 193–202. [Google Scholar] [CrossRef]
  32. Huang, D.; Jin, H.; Zhao, X.; Liu, S. Factors Influencing the Conversion of Arable Land to Urban Use and Policy Implications in Beijing, China. Sustainability 2015, 7, 180–194. [Google Scholar] [CrossRef]
  33. Xiao, R.; Su, S.; Zhang, Z.; Qi, J.; Jiang, D.; Wu, J. Dynamics of soil sealing and soil landscape patterns under rapid urbanization. Catena 2013, 109, 1–12. [Google Scholar] [CrossRef]
  34. Pan, X.; Zhao, Q. Measurement of urbanization process and the paddy soil loss in Yixing city, China between 1949 and 2000. Catena 2007, 69, 65–73. [Google Scholar] [CrossRef]
  35. Song, W.; Pijanowski, B.C.; Tayyebi, A. Urban expansion and its consumption of high-quality farmland in Beijing, China. Ecol. Indic. 2015, 54, 60–70. [Google Scholar] [CrossRef]
  36. Thapa, R.B.; Murayama, Y. Drivers of urban growth in the Kathmandu valley, Nepal: Examining the efficacy of the analytic hierarchy process. Appl. Geogr. 2010, 30, 70–83. [Google Scholar] [CrossRef]
  37. Zhen, G.; Wu, Y. Basic farmland protection system should be priority in dynamic balance system of total arable land. J. Hunan Financ. Econ. Univ. 2016, 32, 54–62. [Google Scholar]
  38. Alexakis, D.; Gotsis, D.; Giakoumakis, S. Evaluation of soil salinization in a Mediterranean site (Agoulinitsa district—West Greece). Arab. J. Geosci. 2015, 8, 1373–1383. [Google Scholar] [CrossRef]
  39. Lichtenberg, E.; Ding, C. Assessing farmland protection policy in China. Land Use Policy 2008, 25, 59–68. [Google Scholar] [CrossRef]
  40. Su, S.; Xiao, R. Spatially Varying Determinants of Farmland Conversion across Qiantang Watershed, China. Environ. Manag. 2013, 52, 907–916. [Google Scholar] [CrossRef] [PubMed]
  41. Cardille, J. Agricultural land-use change in Brazilian Amazônia between 1980 and 1995: Evidence from integrated satellite and census data. Remote Sens. Environ. 2003, 87, 551–562. [Google Scholar] [CrossRef]
  42. Su, S.; Xiao, R.; Zhang, Y. Multi-scale analysis of spatially varying relationships between agricultural landscape patterns and urbanization using geographically weighted regression. Appl. Geogr. 2012, 32, 360–375. [Google Scholar] [CrossRef]
  43. Sonobe, T.; Hu, D.; Otsuka, K. From inferior to superior products: An inquiry into the Wenzhou model of industrial development in China. J. Comp. Econ. 2004, 32, 542–563. [Google Scholar] [CrossRef] [Green Version]
  44. Wenzhou Municipal People’s Government. In 13th Five-Year Plan for Economic and Social Development of Wenzhou City. Available online: http://www.wenzhou.gov.cn/art/2016/3/22/art_1217830_1520814.html (accessed on 15 November 2016).
  45. Wang, J.; Chen, Y.; Shao, X.; Zhang, Y.; Cao, Y. Land-use changes and policy dimension driving forces in China: Present, trend and future. Land Use Policy 2012, 29, 737–749. [Google Scholar] [CrossRef]
  46. Su, S.; Li, D.; Hu, Y.N.; Xiao, R.; Zhang, Y. Spatially non-stationary response of ecosystem service value changes to urbanization in Shanghai, China. Ecol. Indic. 2014, 45, 332–339. [Google Scholar] [CrossRef]
  47. Hofmann, N.; Filoso, G.; Schofield, M.; Statistics, Canada. The loss of dependable agricultural land in Canada. Rural Small Town Can. Anal. Bull. 2005, 6, 1–16. [Google Scholar]
  48. Liu, Y.; Fang, F.; Li, Y. Key issues of land use in China and implications for policy making. Land Use Policy 2014, 40, 6–12. [Google Scholar] [CrossRef]
  49. Zhong, T.; Mitchell, B.; Huang, X. Success or failure: Evaluating the implementation of China’s National General Land Use Plan (1997–2010). Habitat Int. 2014, 44, 93–101. [Google Scholar] [CrossRef]
  50. Song, J.; Cai, D.; Deng, J.; Wang, K.; Shen, Z. Dynamics of Paddy Field Patterns in Response to Urbanization: A Case Study of the Hang-Jia-Hu Plain. Sustainability 2015, 7, 13813–13835. [Google Scholar] [CrossRef]
  51. Su, S.; Hu, Y.N.; Luo, F.; Mai, G.; Wang, Y. Farmland fragmentation due to anthropogenic activity in rapidly developing region. Agric. Syst. 2014, 131, 87–93. [Google Scholar] [CrossRef]
  52. Lichtenberg, E.; Ding, C. Local officials as land developers: Urban spatial expansion in China. J. Urban Econ. 2009, 66, 57–64. [Google Scholar] [CrossRef]
  53. Gosnell, H.; Kline, J.D.; Chrostek, G.; Duncan, J. Is Oregon’s land use planning program conserving forest and farm land? A review of the evidence. Land Use Policy 2011, 28, 185–192. [Google Scholar] [CrossRef]
  54. Kline, J.D.; Thiers, P.; Ozawa, C.P.; Yeakley, A.J.; Gordon, S.N. How well has land-use planning worked under different governance regimes? A case study in the Portland, OR-Vancouver, WA metropolitan area, USA. Landsc. Urban Plan. 2014, 131, 51–63. [Google Scholar] [CrossRef]
Figure 1. Location of Wenzhou City.
Sustainability 09 00095 g001
Figure 2. Land use maps in Wenzhou City for 2005, 2010, and 2014.
Sustainability 09 00095 g002
Figure 3. Spatial distribution of the natural quality grades in 2005.
Sustainability 09 00095 g003
Figure 4. Cultivated land change for two time periods in Wenzhou City.
Sustainability 09 00095 g004
Figure 5. Area for lost cultivated lands of different quality categories during: (a) 2005–2010; and (c) 2010–2014; area for gained cultivated lands of different grades during: (b) 2005–2010; and (d) 2010–2014 in each district/county of Wenzhou.
Sustainability 09 00095 g005
Figure 6. Area and proportion of changed cultivated land composition in two periods.
Sustainability 09 00095 g006
Figure 7. Spatial patterns of cultivated land of different types in two periods.
Sustainability 09 00095 g007
Figure 8. Observation of gained cultivated land in patch (a) and (b) for different years in Wenzhou City.
Sustainability 09 00095 g008
Figure 9. Future land use in Wenzhou City: (a) general land use plan for 2020; and (b) cultivated land change between 2014 and 2020.
Sustainability 09 00095 g009
Table 1. Assessment system for cultivated land quality index.
Score (fi)Soil Fertility (%)Soil TextureOrganic Matter Content (%)Topsoil Thickness (cm)Irrigation Condition (d)Elevation (m)
100≥80Loam≥3≥20≥70≤10
95 18–20 10–50
90 Silt loam/clay loam2.5–3.015–18 50–150
8570–80 50–70
80 Loamy clay/sandy loam2.0–2.5 150–300
75
7060–70 1.5–2.010–15 300–500
65
60 Clay1.0–1.5 30–50
5550–60
50 <10 500–800
45
40 Sand0.5–1.0
3540–50
30 <30800–1000
20 <0.5
15<40
10 >1000
Weight (wi)0.250.10.20.10.20.15
Table 2. Main source of cultivated land gained.
PeriodMain SourceArea (ha)Proportion (%)
2005–2010Forest land6580.9450.42
Grassland3809.7129.19
Garden land2173.7916.65
Water area192.851.48
Bare land161.901.24
Construction land97.080.74
Coastal land36.180.28
Total13,052.45100
2010–2014Forest land3032.6262.25
Water area641.8713.18
Coastal land612.4312.57
Garden land390.308.01
Grassland184.003.78
Construction land9.540.20
Bare land0.670.01
Total4871.43100
Table 3. Cultivated land area variation and relative change rate in each category.
Period Changed Area (ha)Relative Change Rate
HighMediumLowHighMediumLow
2005–2010Loss7431.844634.00104.003.170.520.12
Gain787.7410,989.701275.020.311.141.40
2010–2014Loss2011.901802.84135.352.750.610.49
Gain169.382999.001703.060.190.834.96

