1. Introduction
Nowadays, wave energy conversion is continuously gaining popularity among renewable energy sources. If compared with conventional renewable sources, several advantages are brought by wave energy. Wave energy is truly unlimited, since it is based on waves crashing. The involved conversion phenomenon is really environment-friendly, without harmful byproducts. Furthermore, the chance of producing hydrogen from salt water appoints ocean wave energy as the most promising solution for electricity generation, including hydrogen production and storage. Unfortunately, most of the projects developed to date have presented major failures due mostly to mechanical problems and disruption of the electrical connection.
The phenomenon of primary conversion of wave energy may be described as follows. The wave force acts on a movable absorbing member, which reacts against a fixed point (land or sea-bed-based structure), or against another movable, but force-resisting structure [
1]. On the basis of this general principle, we can obtain a wide variety of wave energy plants and technologies that can be differently classified. A classification can be based on the different ways in which energy can be absorbed from the waves, but also of the water depth and of the location (shoreline, near-shore, offshore).
Another classification can be based mostly on working principle. According to this classification, many combinations of absorber, energy converter, and structure type are possible:
Oscillating water column (OWC), which consists of a partially submerged hollow structure, open to the sea below the water line and equipped with air turbine.
Point absorbers (floating or submerged), which usually provide a heave motion that is converted by mechanical and/or hydraulic systems in linear or rotational motion for driving electrical generators.
Overtopping devices (fixed or floating) that collect the water of incident waves to drive one or more low-head turbines and that are equipped with a hydraulic turbine.
Surging devices that exploit the horizontal particle velocity in a wave to drive a deflector or to generate a pumping effect of a flexible bag facing the wave front.
Moreover, there are important developments that do not fall under the above categories [
1,
2,
3].
In the literature, more than 100 projects on wave energy conversion systems have been reported and presented [
1,
2]. The key advantage to all these kind of systems is certainly the high level of predictability, since wave height and velocity is easily predictable information. Concerning disadvantages, high actual costs and safety-related issues and faults are the most obstructive to full development. Several marine installations have experienced fault conditions. By investigating faults and failures of existing marine installations, a robust and reliable device could be efficiently designed and sized.
In this paper, we intend to propose a design of wave energy conversion (WEC) useful for the production of hydrogen in a sheltered water area, like the Mediterranean Sea.
The choice of the hydrogen as energy carrier is aimed to avoid a fixed submarine connection and to potentially enhance the overall reliability. The same reliability approach has been followed in the design of the electrical generator by choosing a device that can avoid any external moving parts. The mechanical structure of the proposed buoyant, with its intrinsic symmetrical structure, is immune to rotation and flip events and ensure that the designed WEC is well suited to face with storms and rough weather conditions. As a result, the intellectual path that has been followed in this paper is based on a preliminary analysis of the faults that occurred for the previous installations, which has led to some potential improvements of the design. In what follows, it is shown that the main weak points of the existing projects can be identified in the fact that the existing technologies use mechanical converters that have parts in relative motion that are directly exposed to the sea and submarine cable connections. These elements are the parts where most of the failures occur, and this fact has led to an innovative design.
Section 2 and
Section 3 present an overview of faults and failures of WEC devices, finalized to identify weak elements of this system. In
Section 4, the design of the proposed WEC aimed to enhance the system reliability—reducing the initial and maintenance cost—is shown. To this objective, a standalone floating point absorber structure was chosen. To avoid failures and faults in the electrical connection system (submarine cables), the WEC is grid off, and hydrogen production from salt water and hydrogen accumulation on site is foreseen. In
Section 4, the experimental results of the laboratory prototype are shown and discussed to highlight the benefits brought by the proposed design strategy. Based on the analysis of experimental results, the suited configuration of the modular architecture for the forecast marine installation is investigated. The hydrogen production has been confirmed from a low-power fuel cell stack directly connected to the hydrogen output from the electrolyzer. Finally, in
Section 5 the conclusions are drawn.
2. Overview of Existing Marine Plants Failures
Most systems at the early stage of development and design, such as many WEC topologies, are subjected to subtle weaknesses with potential catastrophic effects, which can have extreme consequences. This problem is more evident for novel systems, due to their high level of innovation and lack of experience. Hence, the need for systematic identification of these flaws is essential at the very beginning of the process.
In the literature, several harmful events are reported.
In 1980, the Department of Physics in the Norwegian University of Science and Technology (NTNU) developed two shoreline wave converters: the Multi-Resonant Oscillating Water Column (OWC) and the Tapered Channel (Tapchan) of 500 and 350 kW, respectively. In 1985, the OWC was built by Kvaener Brug A/S and the Tapchan by Norwave A/S in Toftestallen about 35 km northwest of Bergen. The plants were seriously damaged during storms in 1988 and 1991 [
3].
The Muroran Institute of Technology, Hokkaido, developed a caisson-based, pivoting flap device named the “Pendulor” system [
4]. In April 1983, a 5 kW (hydraulic motor rating) onshore prototype was installed at Muroran Port on the south coast of Hokkaido. The prototype caisson was situated in front of an existing seawall in a water depth ranging from 2.5 m at low tide to 4 m at high tide. Two capture chambers were built into the caisson, but only one was fitted with a Pendulor. Twenty months after its installation, the Pendulor was bent during a severe storm; as a result, the shock absorbers for the end-stops, which prevent over-stroking of the cylinder, had to be redesigned. A new Pendulor was installed in November 1985, which survived several severe storms without damage.
In addition, another small Pendulor system of 20 kW rated power, for the generation of electric power, was deployed in 1981 at Mashike Harbor on Hokkaido's west coast. However, this Pendulor was also damaged by a storm. It was replaced by a shorter Pendulor in 1983, which left a considerable gap at the bottom of the capture chamber, and while this has prevented further damage, it has also lowered the system’s conversion efficiency. Nevertheless, the plant has operated for very long time [
1].
In 1995, an OWC named OSPREY (Ocean Swell Powered Renewable Energy)—for installation up to 1 km away from the coast on the seabed with depths up to 15 m—was settled in Dounreay in northern Scotland. During the installation, a wave irreparably damaged the system.
Some years later, in 2001, another OWC was installed in the northern coast of Pico, the largest of the central group of Azores islands. The area is characterized by a high energy potential and favored by the shape of the coast, which acts as a natural energy concentrator. The plant, designed as a test unit in scale 1:1, has a total power of 400 kW and uses Wells turbines. Due to some flood damage to electrical equipment and control, the start of production has taken place, with a delay, in 2001 [
5].
Another 300 kW demonstration OWC was installed at 200 m off at the port of Kembla, about 100 km south of Sydney. It has a harbor breakwater structure with mooring lines and support legs on the seabed. It uses a bidirectional Denniss–Auld turbine. The plant began producing electricity at the end of 2004. In 2009, the plant was refurbished to 450 kW with the name MK1. In 2010, on the same scheme, a third plant of 2.5 MW was made (called MK3PC), but after 3 months of operation, it was sunk by a storm [
5].
In 2007, a wave energy point absorber device
AquaBuOY, which has been developed by Aalborg University, was initially installed off of the Swedish coast [
6,
7]. After almost two weeks after the marine installation, a structural failure was registered. The device was found stranded on the beach and a structural failure in the upper flange connecting the float to the tube had taken place. The float had tilted to a horizontal position. The failure was charged to the placement of a sand ballast and the light weight of the polyvinyl chloride (PVC) structure.
The SeaGen is a free-stream tidal energy device commissioned in Northern Ireland’s Strangford Lough [
8,
9]. Two turbine blades were damaged. The blade damage has been charged to a control system fault.
In 2009, in the frame of a major marine energy project, three Pelamis wave energy converters were installed off the Portuguese coast [
10,
11,
12,
13]. Several months later, the three converters were removed following leaks in the buoyancy tanks. Several technical problems followed, and Pelamis lost its financial backing.
In 2014, a wave energy device developed by the Oceanlinx marine energy company was accidentally towed by a tugboat [
14].
The preliminary analysis highlights that main causes of destructive failures can be ascribed to mechanical or electronic faults. Structural failures are mainly related to the mechanical robustness of the gathering structure and the wave energy converter itself. However, several recorded failure events are related to faults in the power conversion subsystem.
3. Risk-Based Approach for the Identification of the Topology of WEC Prototype
A high degree of robustness is required for marine installation. The previous analysis shows how the choice of WEC topology and, at the same time, of all its subsystems, can influence the reliability of the entire converter.
As reported in the previous paragraph, in the literature, many recorded faults and even failures of marine installations are due to structural issues. The WEC should be able to face rough weather, avoiding damages and structural failures as well. For this reason, between the different WEC topologies, a floating point absorber has been chosen to convert linear heave motion for driving electrical generators. This kind of solution seems to be less subject to faults linked to structural problems, because it does not need complex anchor systems, thus reducing the use of mechanical components.
As reported in the literature, several faults can be traced back to flip and rotation events that have interrupted the power generation or even led to the damage of the mechanical structure. Therefore, the proposed mechanical structure is immune to rotation and flip events. In particular, the proposed buoyant, with its intrinsic symmetrical structure, ensures that the designed WEC is well suited to face storms and rough weather conditions.
As for the relative motion between the parts, the proposed WEC system is based on a linear electrical generator, thus minimizing relative motion between the parts.
Several faults are traced back to electronics section faults. Consequently, an enhanced reliability and robustness of the power electronics section is required to avoid control and electronics faults. Furthermore, low cost in terms of both initial capital and maintenance is a key feature for practical installations.
The maintenance cost is usually related to the fault probability and to the cost of the faulted section. Since this is a prototype designed for marine installation, in this case, the analysis of maintenance cost should also account for the costs of transport, which can be very relevant.
In order to efficiently lower the maintenance cost, robust, low-cost, and simple topologies for the power electronics section have to be adopted.
Since marine installation is forecast, routing of the generated power towards the land is usually considered a hindrance to practical installations. Safety-related issues concerning the power routing should be accurately addressed. In the proposed system, hydrogen production and storage is addressed. The proposed WEC will be equipped with a hydrogen storage tank to avoid transfer-related issues. The proposed WEC could be conceived as a hydrogen marine plant for fuel-cell-based ships.
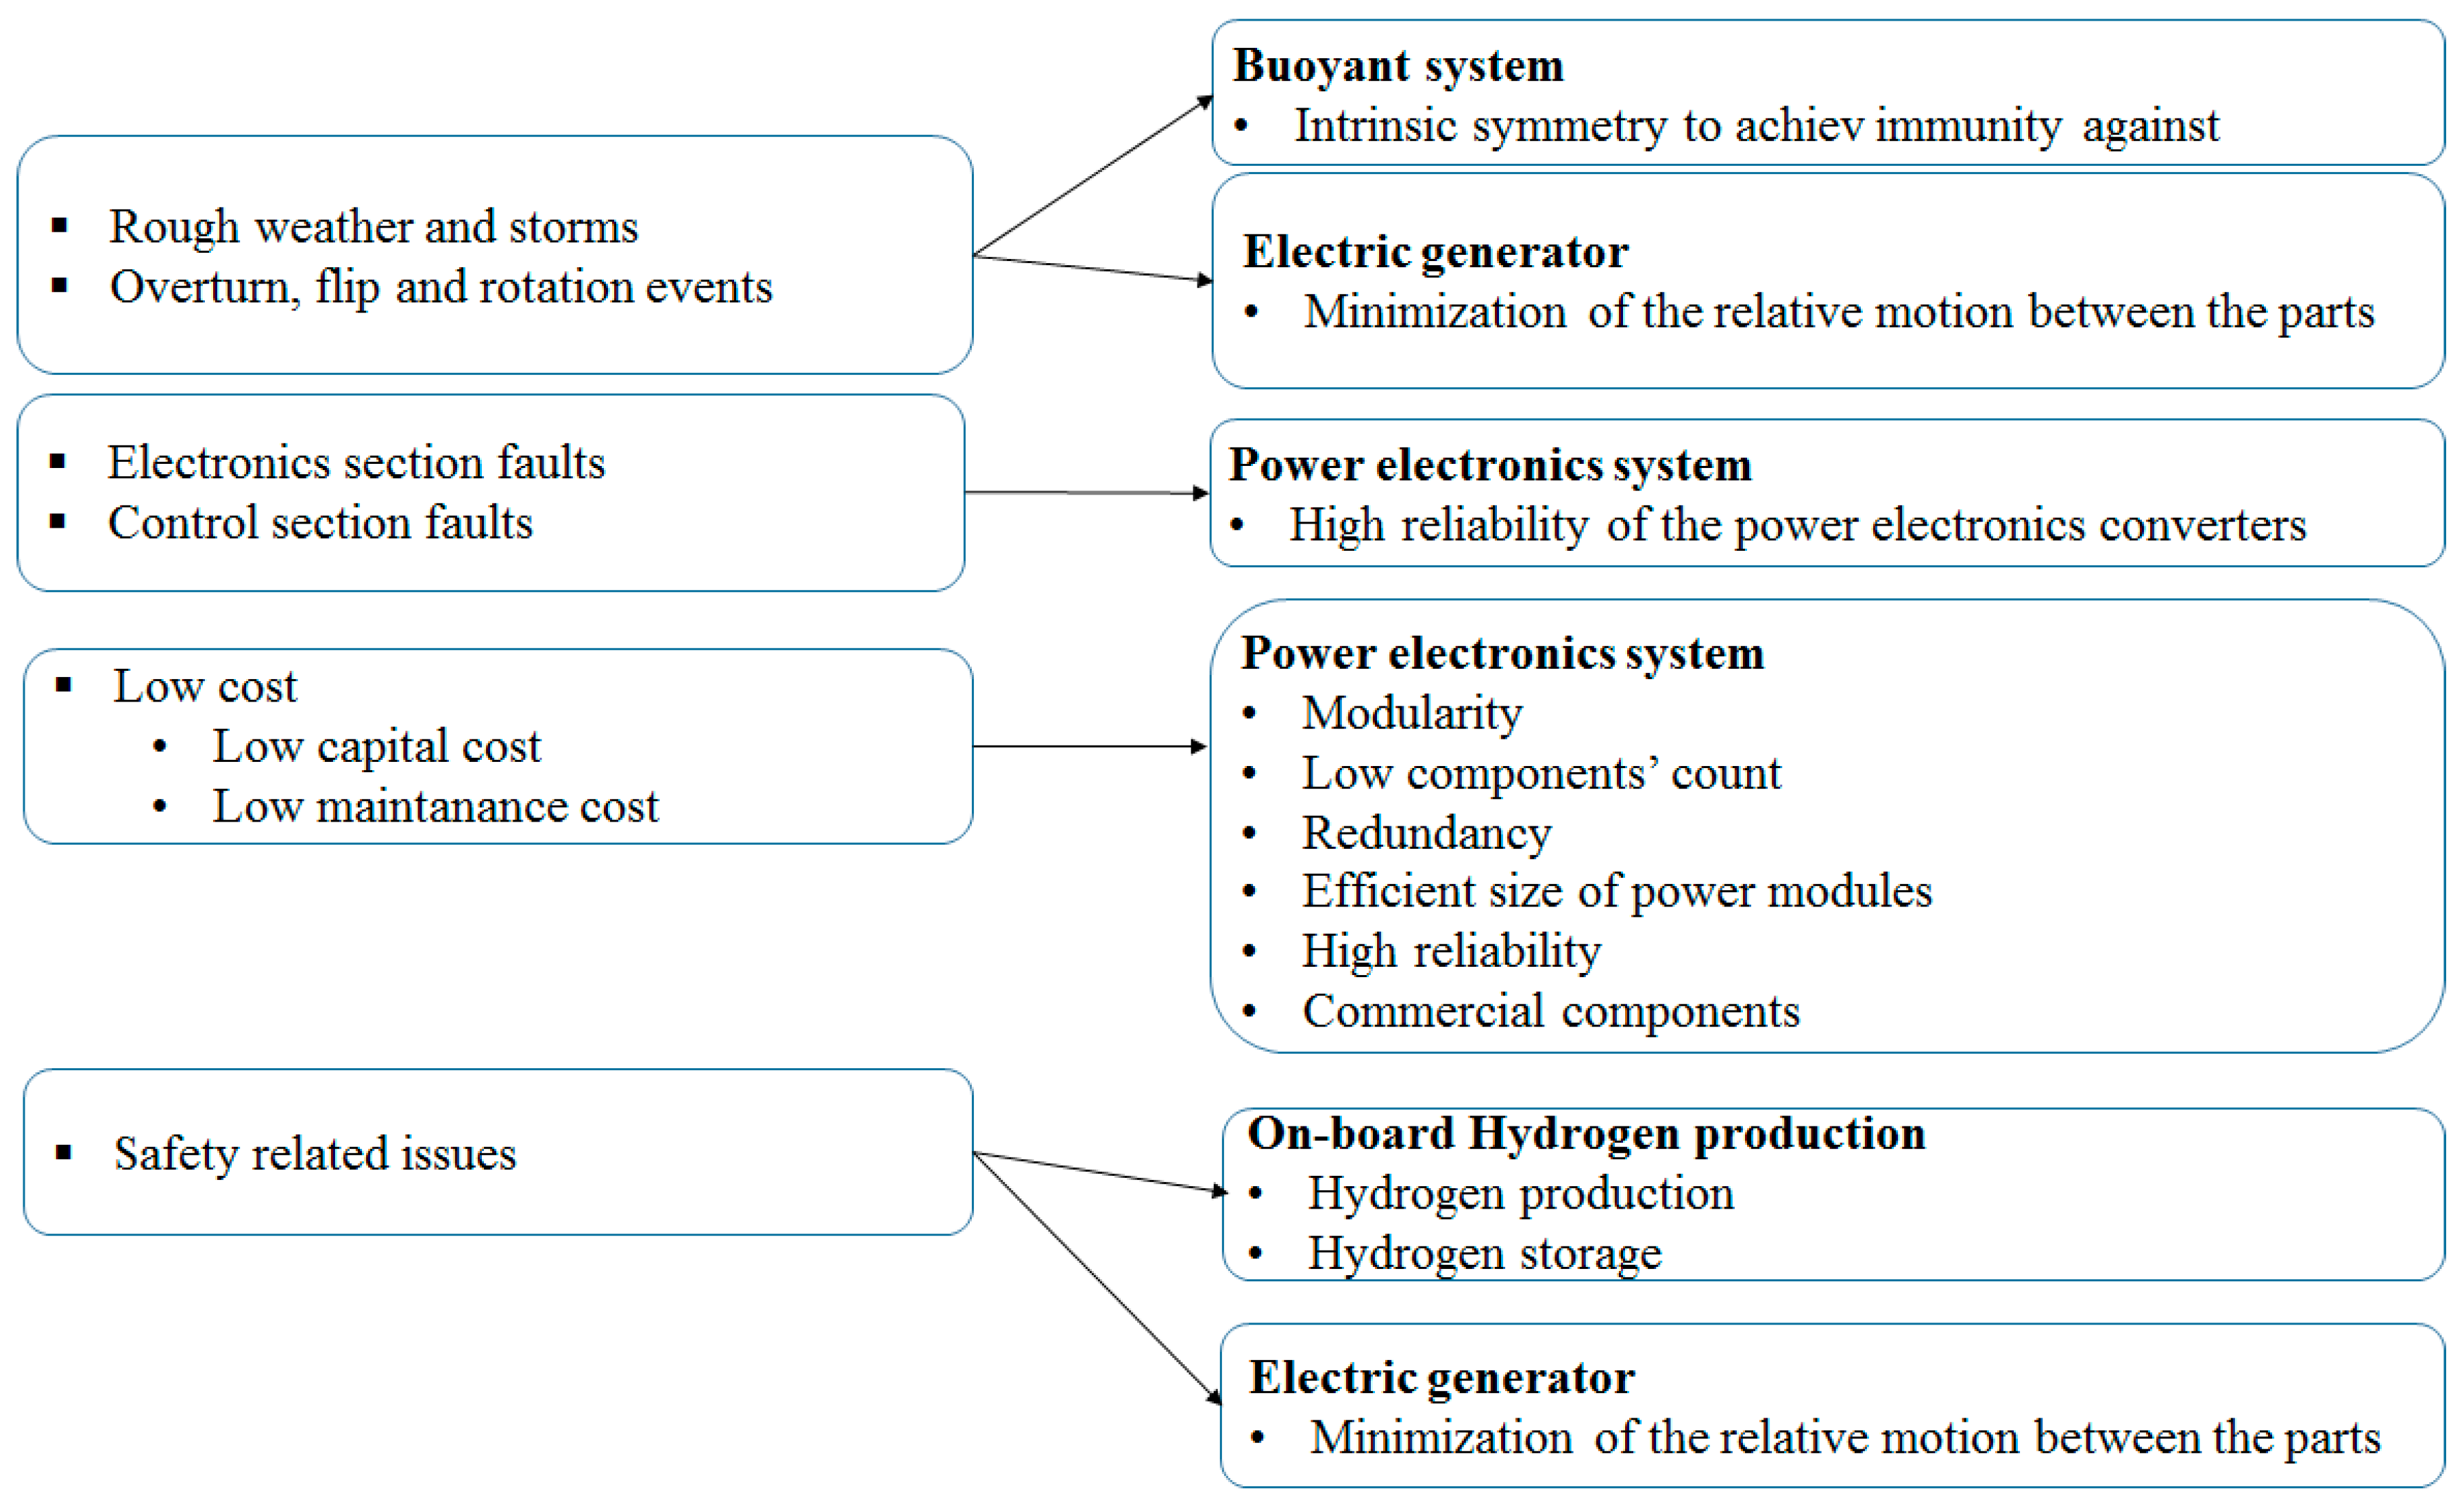
In
Figure 1, according to the results of authors’ investigations on problems, damages, and failures of existing marine installations, a diagram of resulting design constraints is shown. For each WEC subsystem, design constraints are summed up.
4. Design of the WEC Prototype
The WEC system includes a linear generator converting wave energy to electricity, a power electronics interface, and a sea-water electrolyzer. Performances of each component are discussed and analyzed through experimental results.
Since installation of the buoyant system is forecast, a preliminary analysis of the plant productivity into the Mediterranean Sea has been carried out. The wave energy flux per unit crest of several installation sites has been compared to investigate the one best suited for marine installation. In [
10], a comprehensive analysis of Italian coast power capability is given and discussed. In
Table 1, data of some Sicilian sites, which are derived from [
10], are listed. On the northwestern coast of Palermo, values peaks at 4–5 kW/m. The least productive area is located in the southern Sicilian coast, reaching peak values as low as 2.5 kW/m. The marine installation is forecast in the northwestern Sicilian coast close to Palermo. Average values of 4–5 kW/m are considered to size the generator.
In order to increase the reliability of the whole system and to lower the maintenance cost, a highly modular architecture is required. The system power capability could be easily extended by adding power modules.
In order to limit the cost of installation, a unique front-end power converter is conceived. The modular architecture is demanded to point-of-load power converters and a sea-water electrolyzer for hydrogen production and storage. Therefore, each power module includes a nonisolated DC–DC converter and a sea-water electrolyzer. The power module design is presented. Simulation and experimental results are shown and discussed.
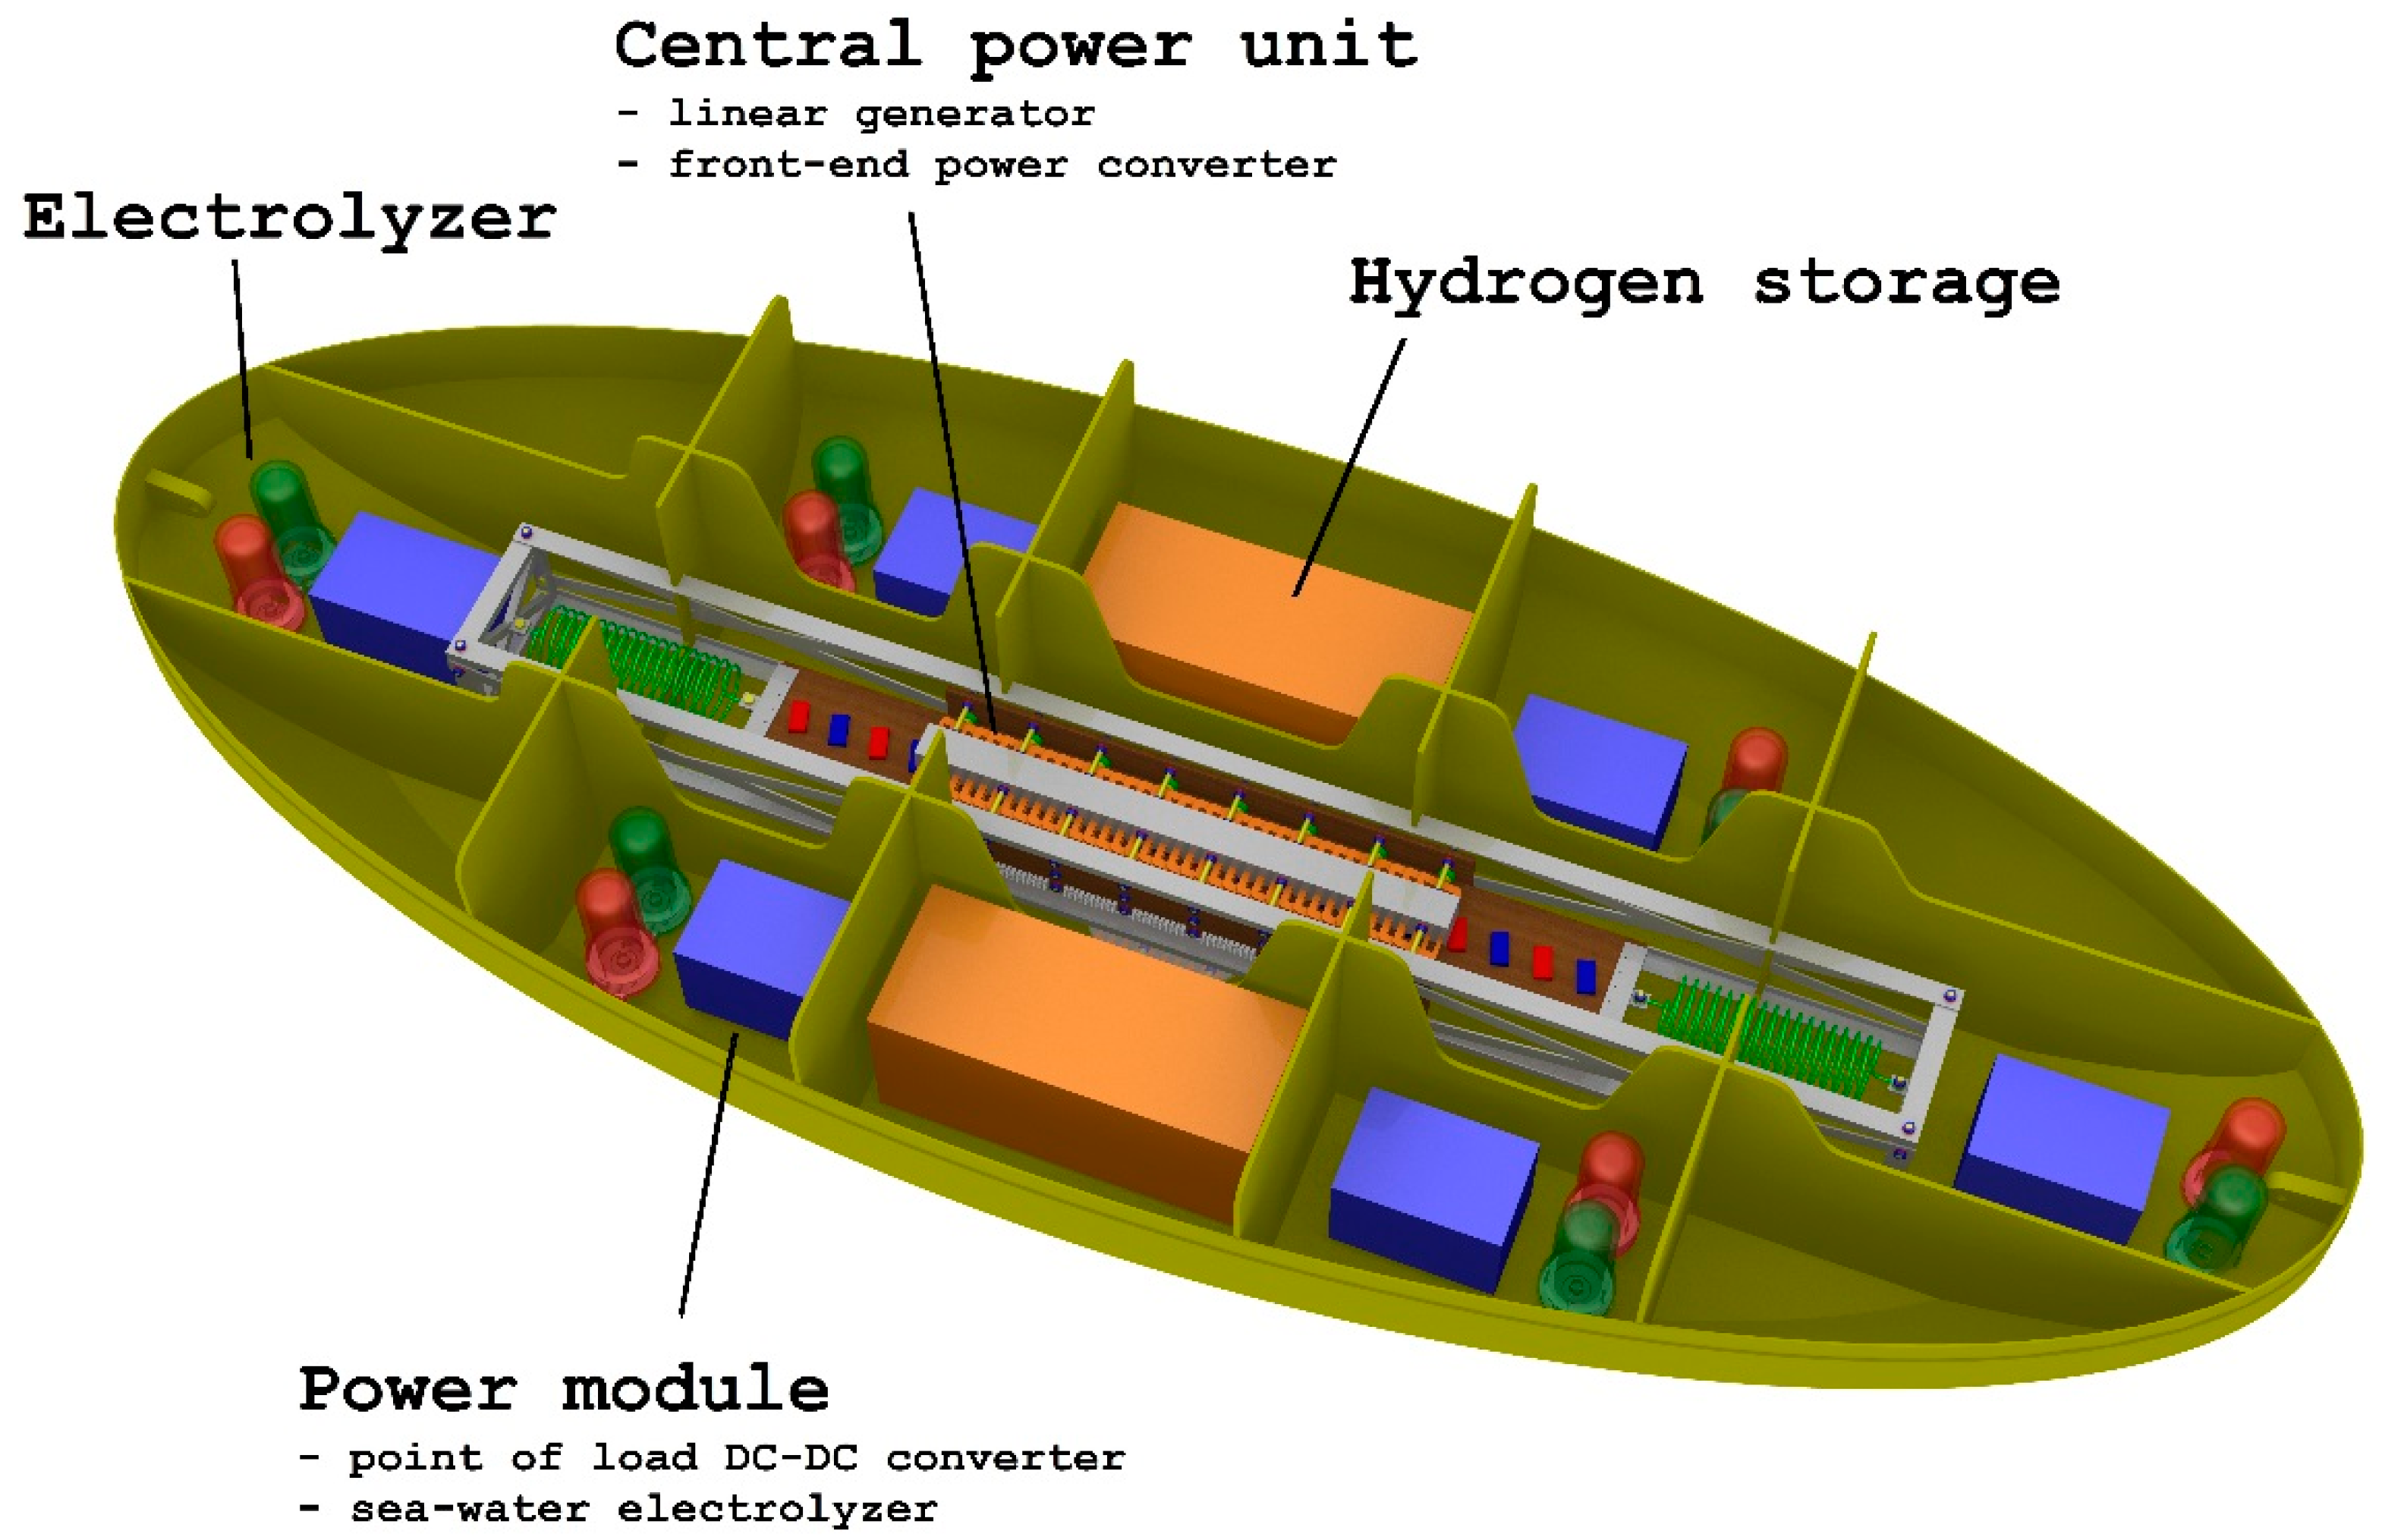
Figure 2 shows a schematic diagram of the buoyant system architecture [
15]. Thanks to the intrinsic axis-symmetry, the proposed buoyant structure is immune to rotation and flip events. The analysis of experimental results on the linear generator and the front-end converter allows the designer to choose the best-suited configuration of the modular unit. As it will be shown in the next section, the best-suited number of modules will be sized according to the analysis of experimental results.
Continuous and a pulsed power management schemes are discussed and compared in order to investigate the best-suited solution for hydrogen production and storage. The proposed experimental analysis is the key step for sea installation.
4.1. The Linear Generator
In this section, the size of the linear generator is discussed. Assuming marine installation in the Mediterranean Sea along the Sicilian coast, a maximum wave height of 1 m, 4 s period, and 1 m/s typical speed are fixed as design parameters. Wave energy can be obtained as:
where g is the gravitational acceleration,
is the water density, and A the wave amplitude.
The power per meter of crest is given by:
where c
g is the wave group velocity. In deep water, the group velocity is given by:
where T is the wave period and ω the angular speed.
The wave power per meter crest is obtained by substituting Equation (3) into Equation (2):
where
is the water density (equal to 1025 kg/m
3) and H is the wave height (equal to twice the wave amplitude, A).
In the proposed Sicilian case study, 3.9 kW/m wave power per meter is obtained by substituting numerical values into Equation (4). The laboratory prototype is equipped with a mover whose length is equal to 160 cm and a stator of 97.1 cm length. Therefore, 62.9 cm is considered to size the power rating of the generator. Assuming a 50% efficiency, the power rating of the generator is equal to 1.22 kW, according to Equation (4).
The sizing method is based on the maximization of the force, F, that can be experienced by the mover at the maximum electrical load and the maximum mover speed. By neglecting belt and slot harmonics and therefore assuming a pure sinusoidal electrical loading, the force, F, is given by:
where D
int is the inner shaft diameter, τ the slider poles pitch, τ
f the iron core rings thickness, and K the rated electrical loading. The K coefficient can be computed by thermal limit and depends on the outer and the inner shaft diameters and the flux density. The electric loading was computed by assuming the typical frequencies of sea waves.
The laboratory prototype realization and the size procedure itself are carried out accounting for commercial products only. These commercial constraints are dictated by the low-cost requirement for low volumes of production. Magnets available on the market are selected, avoiding to optimize the shape for this specific application. The tradeoff between conflicting requirements of system performance and cost is therefore solved in favor of a reduction of the first prototype capital cost. Advanced sizing criteria and choice of magnets could be further applied for high production volumes.
The linear generator is the WEC core subsystem. A permanent magnet generator (PMG) was chosen, and its design and size ensure an efficient, reliable, and robust marine installation.
In the proposed PMG, in order to avoid sliding contacts and limit Joule losses, magnets are housed in the mover [
16,
17,
18].
The PMG is a bilateral generator equipped with two stators [
18]. In order to minimize eddy currents, 126 iron sheets of 0.5 mm thickness are overlapped. Each 60 × 972 × 65 (mm) stator includes 39 slots and 8 holes featuring a 10.5 mm diameter. Each internal slot feature a 12 mm width to house two windings. External three slot feature a 8 mm width. Teeth sized 13.5 mm are built, except the first and last tooth, which measure 7 mm. The stator is assembled by two tables of Bakelite, thus achieving a size of 970 × 160 × 11 mm.
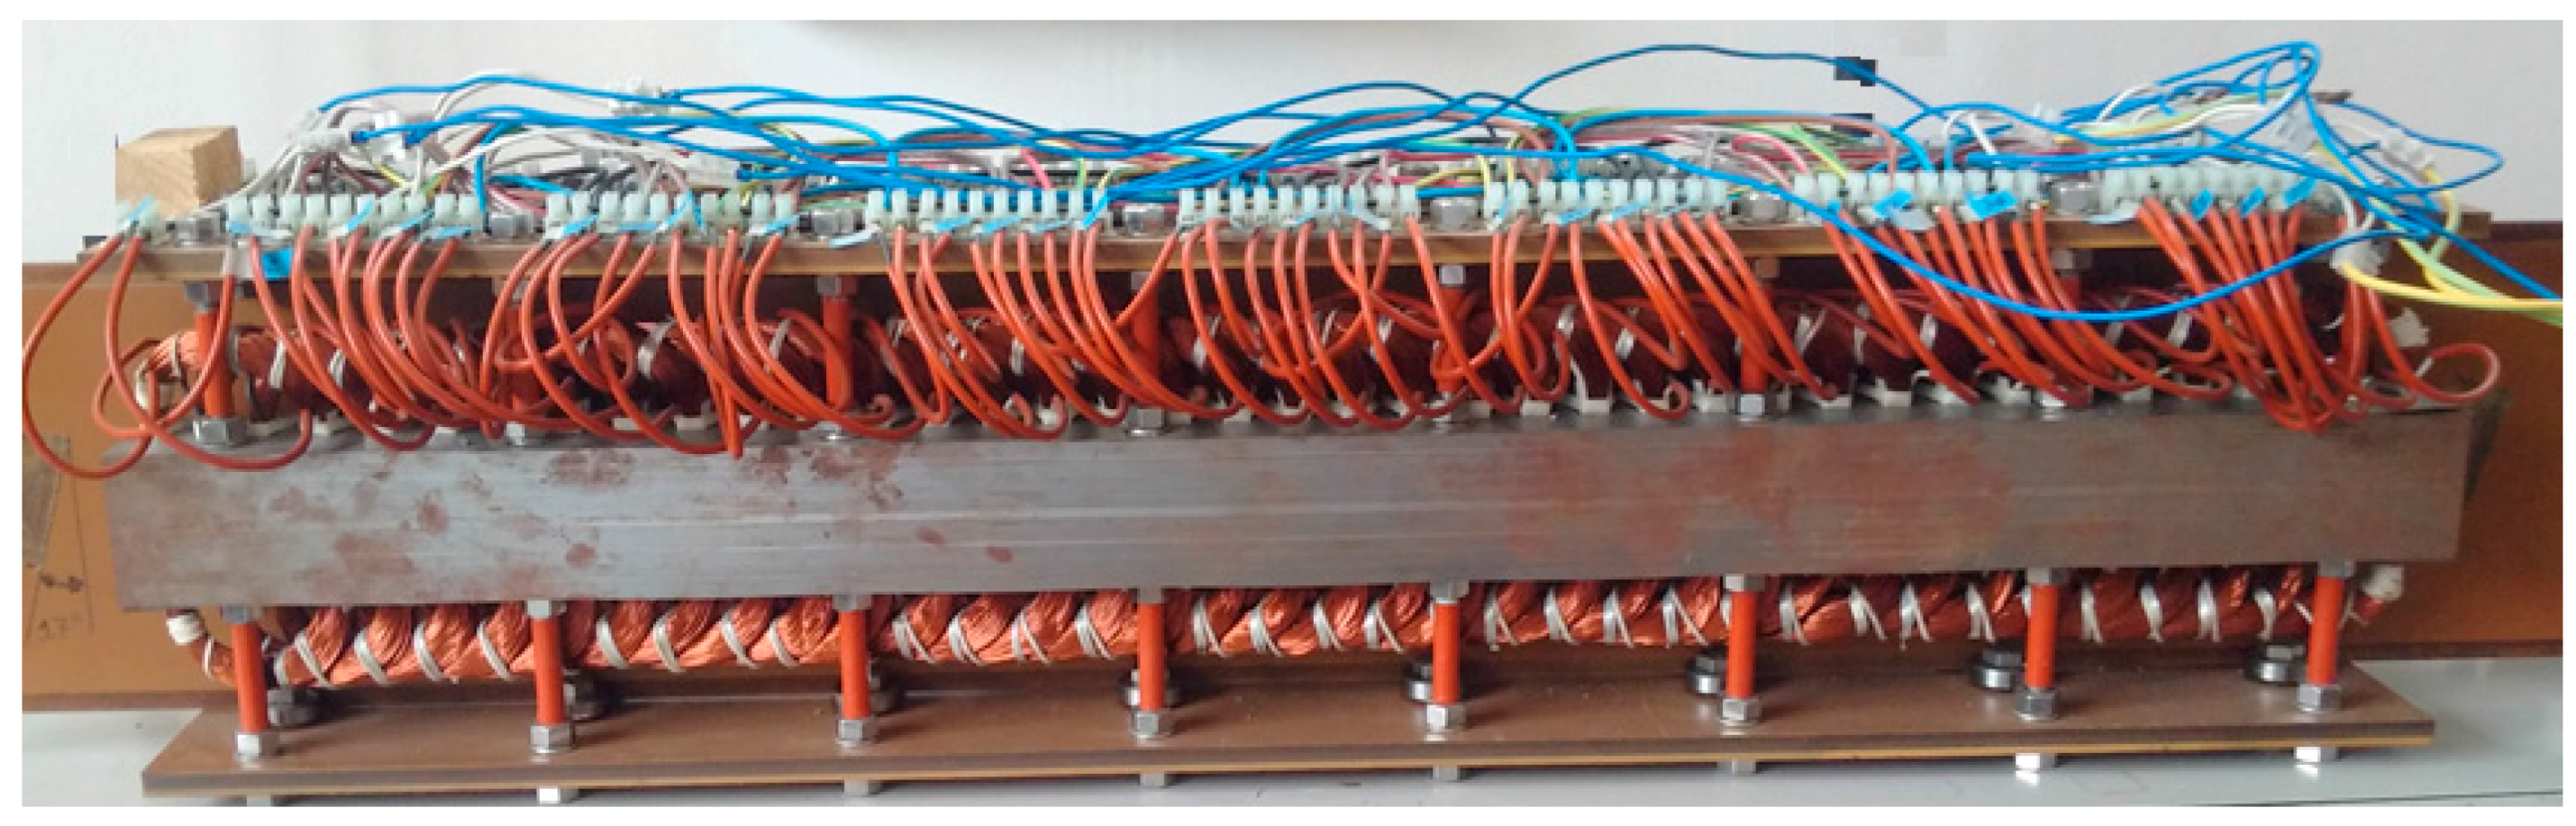
The mover is assembled by alternating 40 Neodymium–Iron–Boron (Nd–Fe–B) permanent magnets (see
Figure 3), interspersed with soft iron pole pieces mounted on a Bakelite sheet. The magnets are stacked in pairs. Consequently, opposing magnetomotive forces (mmfs) drive the flux through the soft iron. Each magnet is protected by nickel coating, and measures 60 × 30 × 15 (mm) and weighs 205.2 g. The Bakelite sheet size is 1600 × 11 × 206 mm and includes 40 hollows for magnet housing.
Copper coils, featuring 375 turns in a rectangular shape with an average size of 85 × 135 mm, are manufactured by enameled copper wire of 0.5 mm diameter. Each coil weighs 278 g. In each side of the armature, 36 coils are arranged for a total number of 72 coils.
Figure 4 shows the PMG prototype.
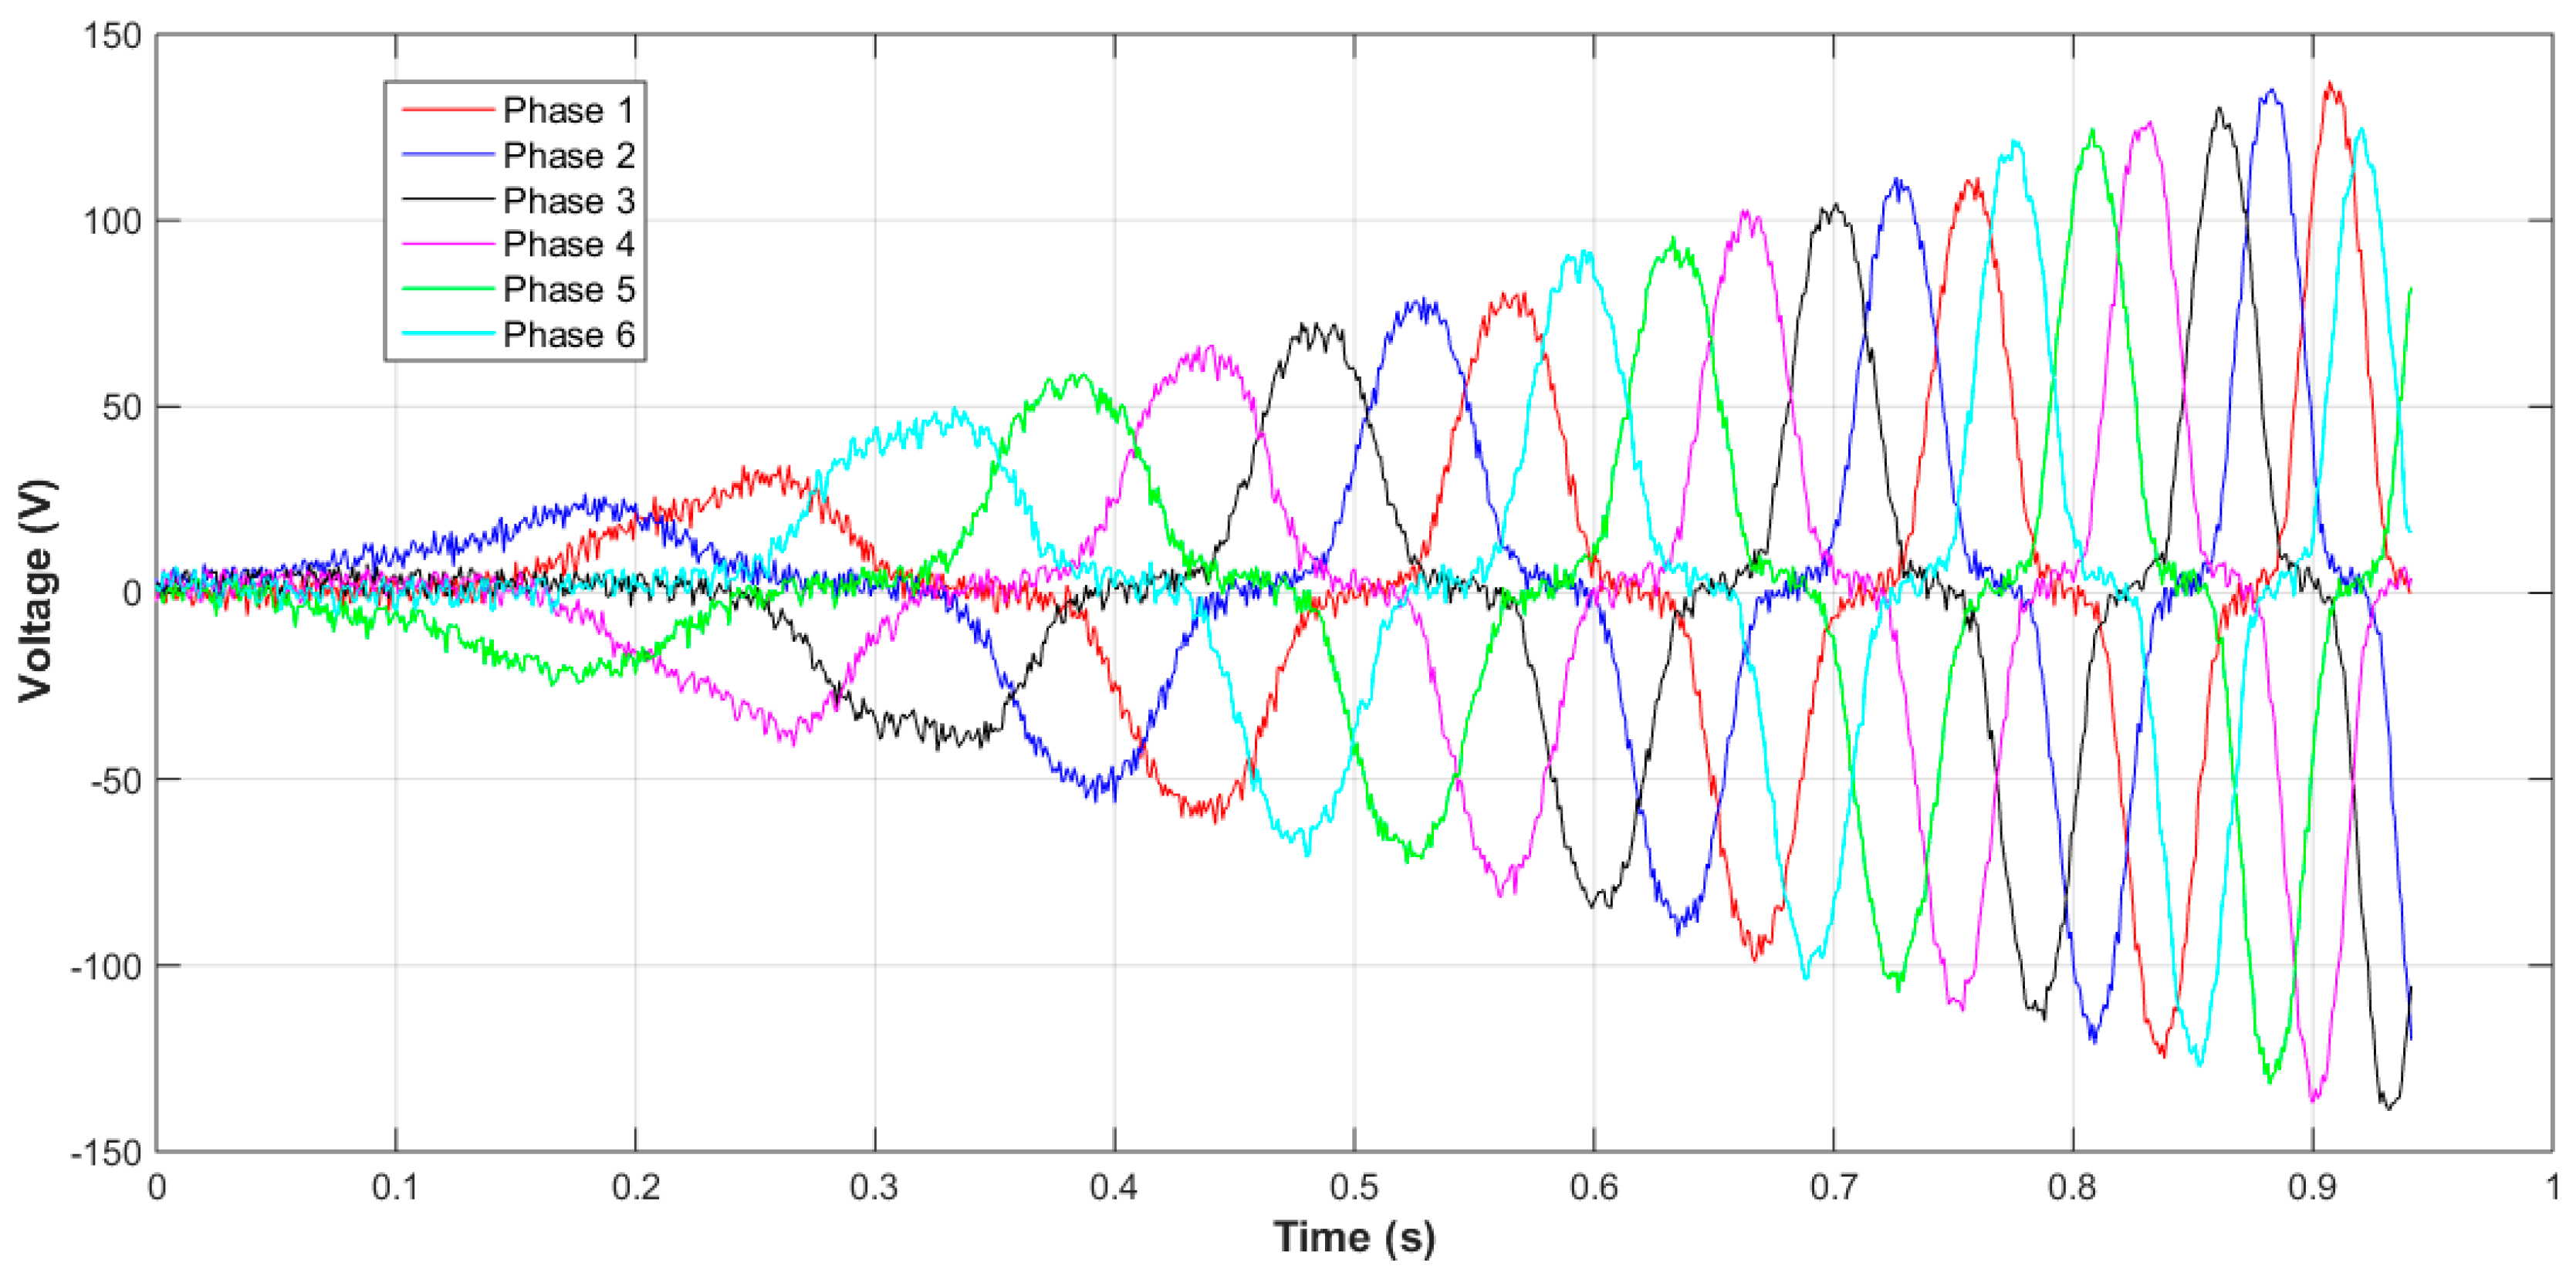
Experimental Results
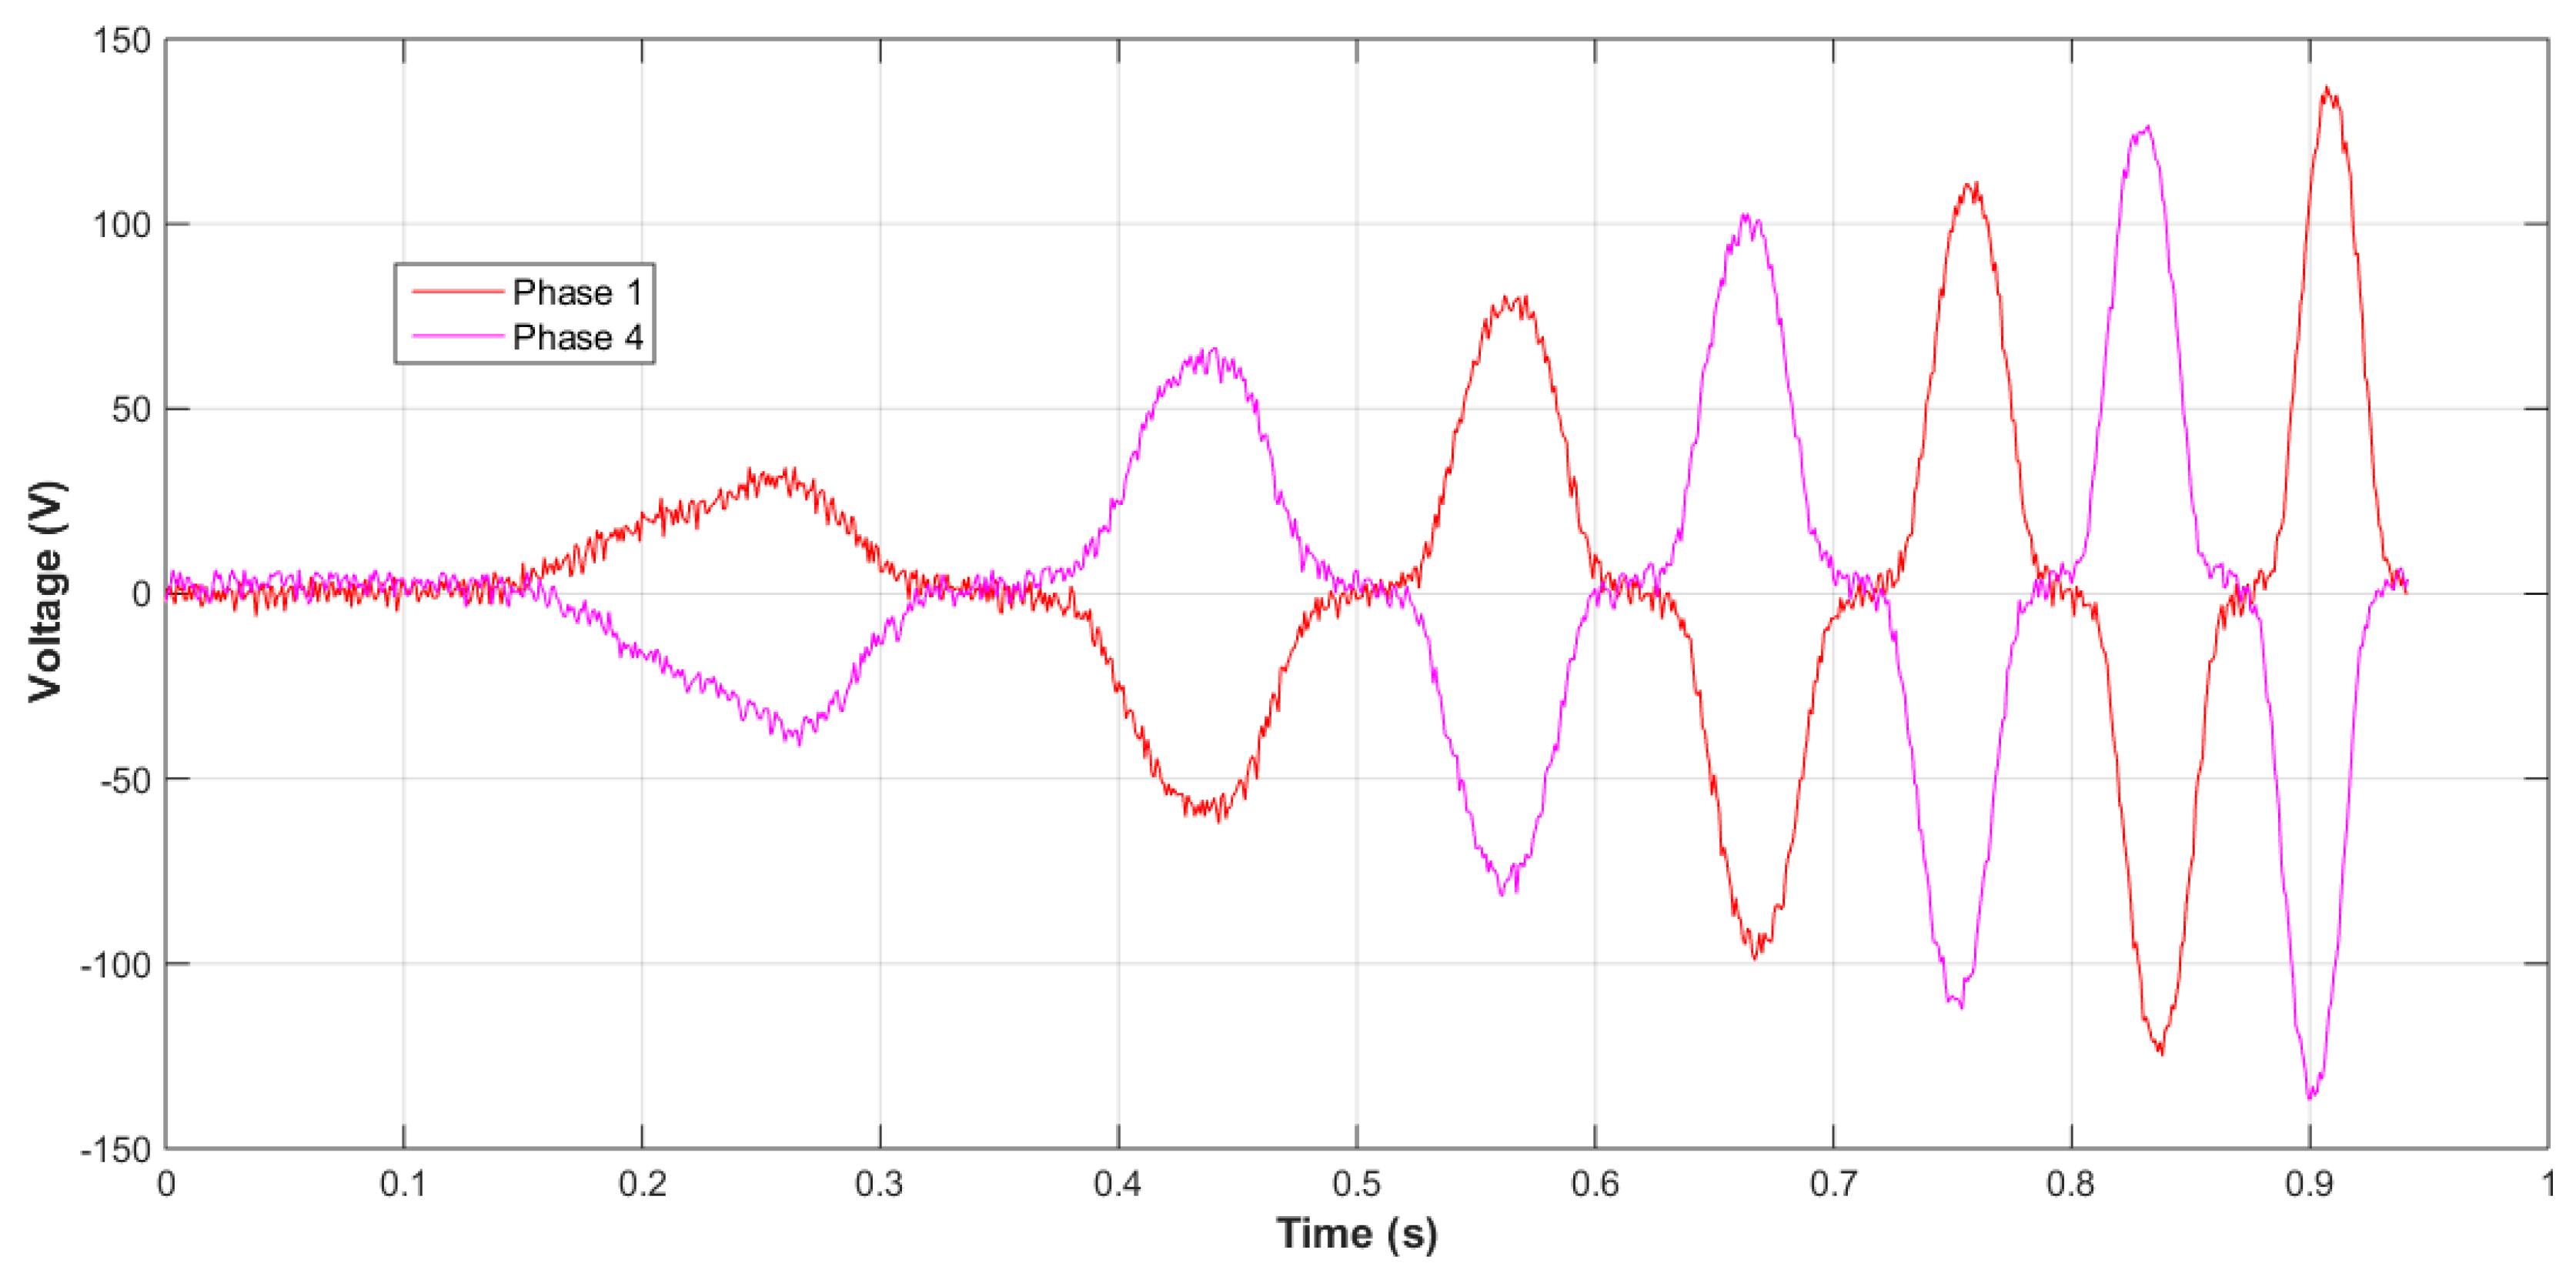
The prototype of PMG developed at the University of Palermo allows several connections of the stator winding coils. It has been tested by realizing a six-phase stator winding, with no electric load. The generated voltage, depending on the acceleration of the mover, has been acquired with a constant acceleration of 1.2 m/s
2, obtained by applying a constant force to the mover. The used acquisition system was realized with National Instruments board and LabVIEW.
Figure 5 shows measured voltage.
The voltages measured show a maximum value of 130 V.
Figure 6 shows the voltages of phases 1 and 4. The voltages of the phases 1 and 4 are in phase opposition. In the same way, the voltages of phases 2 and 5 and those of phases 3 and 6 are in opposition to each other. It is therefore possible to realize three-phase generator by suitably connecting between them the coils of these phases.
The experimental results shown in
Figure 5 and
Figure 6 demonstrate that the open circuit voltage values are on one side sufficiently high for our scopes (in the order of 100 V) and on the other side that can be easily converted. Moreover, the characteristic of the waveform is extremely useful for the design of the power electronics conversion section. The detection of these values is useful to identify the stator winding typology and, consequently, to size the power electronics system.
4.2. Sea-Water Electrolyzer
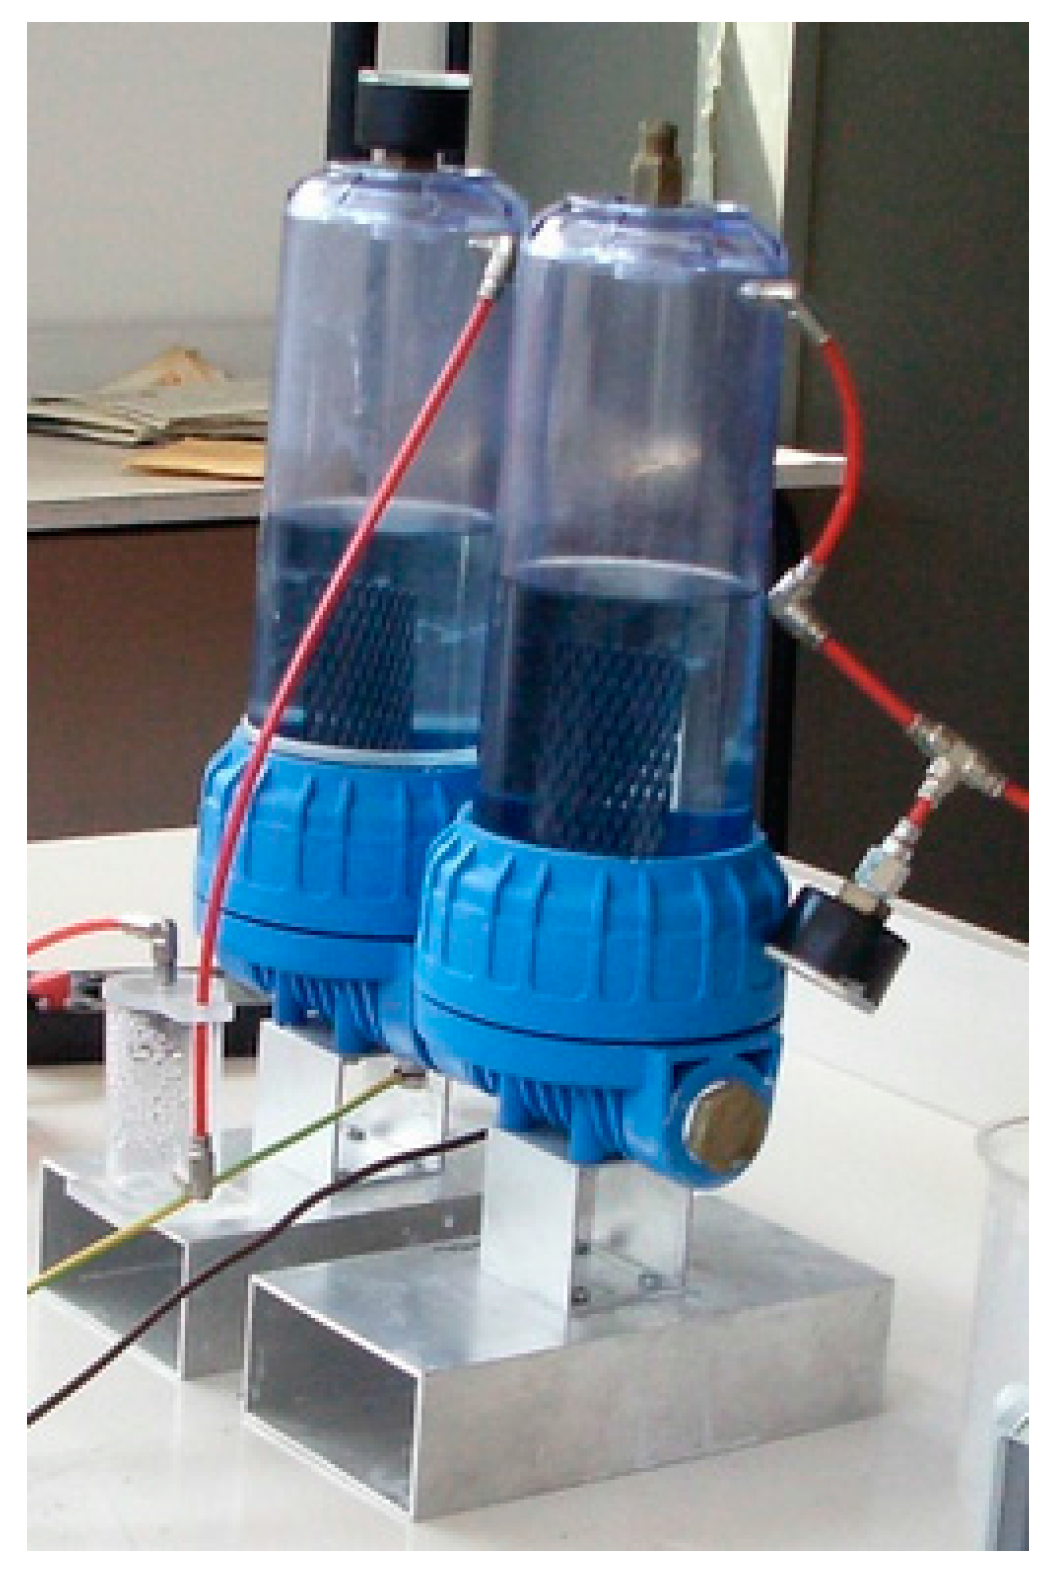
A sea-water electrolyzer prototype has been realized and tested. A comprehensive study of the small-scale prototype has been previously carried out.
Figure 7 shows the laboratory prototype under test.
As far as sea water is concerned, hydrogen is expected to be the main product of the electrolysis process. Further, oxygen is expected to be the main byproduct of the electrolysis process. Yet, under normal operating conditions concerning sea-water, electrolysis cell products are mainly H2 and Cl2 because of mass transfer and kinetics limitations.
By controlling the anodic voltage, oxygen evolution instead of chlorine evolution could be favored. The decomposition voltage ranges within 1.8–2.2 V for small-scale laboratory prototypes, depending on the current density. Within this voltage range, the chlorine evolution will replace the oxygen evolution. At sufficiently high potential there will be no increase in the chlorine evolution rate, whereas the oxygen evolution rate will increase with potential depending on current density.
After all, electrolysis at low current densities, less than 1 mA/cm2, will result in exclusive oxygen evolution. Operation in excess of the limiting current for chloride oxidation, which ranges from 100 to 1000 mA/cm2, will favor oxygen evolution. Operation at several thousand mA/cm2 will achieve high columbic oxygen efficiency values, but such values cannot be considered, mainly because of excessive heating and power dissipation.
A detailed and comprehensive overview of sea water electrolysis and a comparison of alkaline, brine, and sea-water electrolysis processes is reported in [
17].
The hydrogen production has been confirmed from a low-power fuel cell stack directly connected to the hydrogen output from the electrolyzer.
The power, voltage, and current values—which are drawn from the power supply—are measured to completely characterize the electrolyzer under test. In
Table 2, measures are listed.
The current and voltage values reported in
Table 2 represent the sizing values for the power electronics system output.
The results here presented demonstrate, on one side, the capability of the prototype of sea-water electrolytic stack to produce hydrogen from sea water; on the other side, the quantitative results are useful to obtain an optimum design of the electronic driving section.
4.3. The Power Electronics Interface
The power electronics system acts as an interface between the generator and the sea-water electrolyzers, hence, it has been sized starting from the output values of the generator to ensure the necessary input values to the electrolyzers. Moreover, it has been conceived with a high level of modularity to easily extend the hydrogen production capability for marine installation. Since cost and reliability are key issues to face, modularity is limited to the DC–DC conversion stage and sea water electrolyzer. A diode rectifier bridge is modeled and designed. In order to lower the cost and increase the reliability of the whole system, a conventional diode bridge is implemented instead of more advanced rectifier topologies, self- or control-driven, based on MOSFETs or IGBTs. As shown by simulation results, the efficiency is mainly affected by the linear generator efficiency. Therefore, choosing a diode bridge heavily improves the reliability of the power system, lowers the cost of the power electronics equipment, and the complexity of the control subsystem as well. Furthermore, effects on the efficiency of the whole sea WEC could be reasonably neglected.
A single power electronics module, including a DC–DC converter and a sea water electrolyzer, is designed [
18]. The module should supply the sea-water electrolyzer during the wave burst, thus providing a short-term energy storage between consecutive waves. A modular architecture is preferred to further extend to higher power levels, thus moving towards the installation in the Mediterranean Sea. The design of the power converter module is focused on the enhancement of the module reliability and cost. Since off-shore installation is forecast, reliability is a key issue to deal with. The aim is to lower the maintenance cost while ensuring an adequate performance level and hydrogen production rate. A low-cost and low components count is preferred to favor a modular architecture not compromising the cost of the whole power electronics equipment. The design procedure is validated through simulation results. In the simulation setup, the measured voltage signal of a linear generator phase is forced as the power supply input in order to simulate the power supply system as closely as possible to its effective behavior.
Each module includes a buck converter and the sea wave electrolyzer. The nominal supply voltage of the electrolyzer is set at 20 V. The minimum converter current is fixed at 0.2 A, according to experimental results from the laboratory prototype of the electrolyzer. A 130 V open-circuit phase voltage is obtained by experimental results of the linear generator. The measured phase voltage waveform in an open-circuit configuration is imported in the simulation software and forced as the power supply input of the power module simulation model. The open-circuit configuration corresponding to the highest peak voltage values is assumed as the worst case for the design of the power converter.
A diode bridge is included in the power system interface model as the front-end power converter. The power module architecture includes a buck converter for a proper regulation of the output voltage. A capacitive energy storage element is included at the output of the rectifier section. Yet, the capacitor value should be limited to avoid instability and oscillations due to the inductive behavior of the linear generator. Among DC–DC converters, nonisolated topologies are focused on to limit the cost of each power module. Among nonisolated topologies, input-inductive converters are discarded. A buck converter is designed. The buck converter is designed to ensure an adequate power supply of the electrolyzer, avoiding instabilities and oscillations, during the wave burst. A voltage mode pulse-width modulation control network is designed.
A continuous conduction mode (CCM) of operation is forced over the rated current range of the buck converter to improve the module efficiency, while not overloading the rectifier capacitor during the burst wave. The switching frequency is fixed at 100 kHz. The inductance value is designed by forcing a CCM operation, as given by:
The worst-case condition for the power inductor design corresponds to the minimum duty-cycle value over the whole operating range and, consequently, the maximum operating voltage. Minimum value of the output current is accounted for in Equation (6). According to the ratings of each module, a 15% minimum value of the duty cycle is obtained. The critical inductance is equal to 0.42 mH, as given by Equation (6). Consequently, a 1 mH inductance value is selected to ensure CCM.
The output capacitor of the buck converter is designed to limit the open loop damping factor, which is given by:
In order to avoid stability and compensation issues deriving from an extremely low resonant frequency, the C
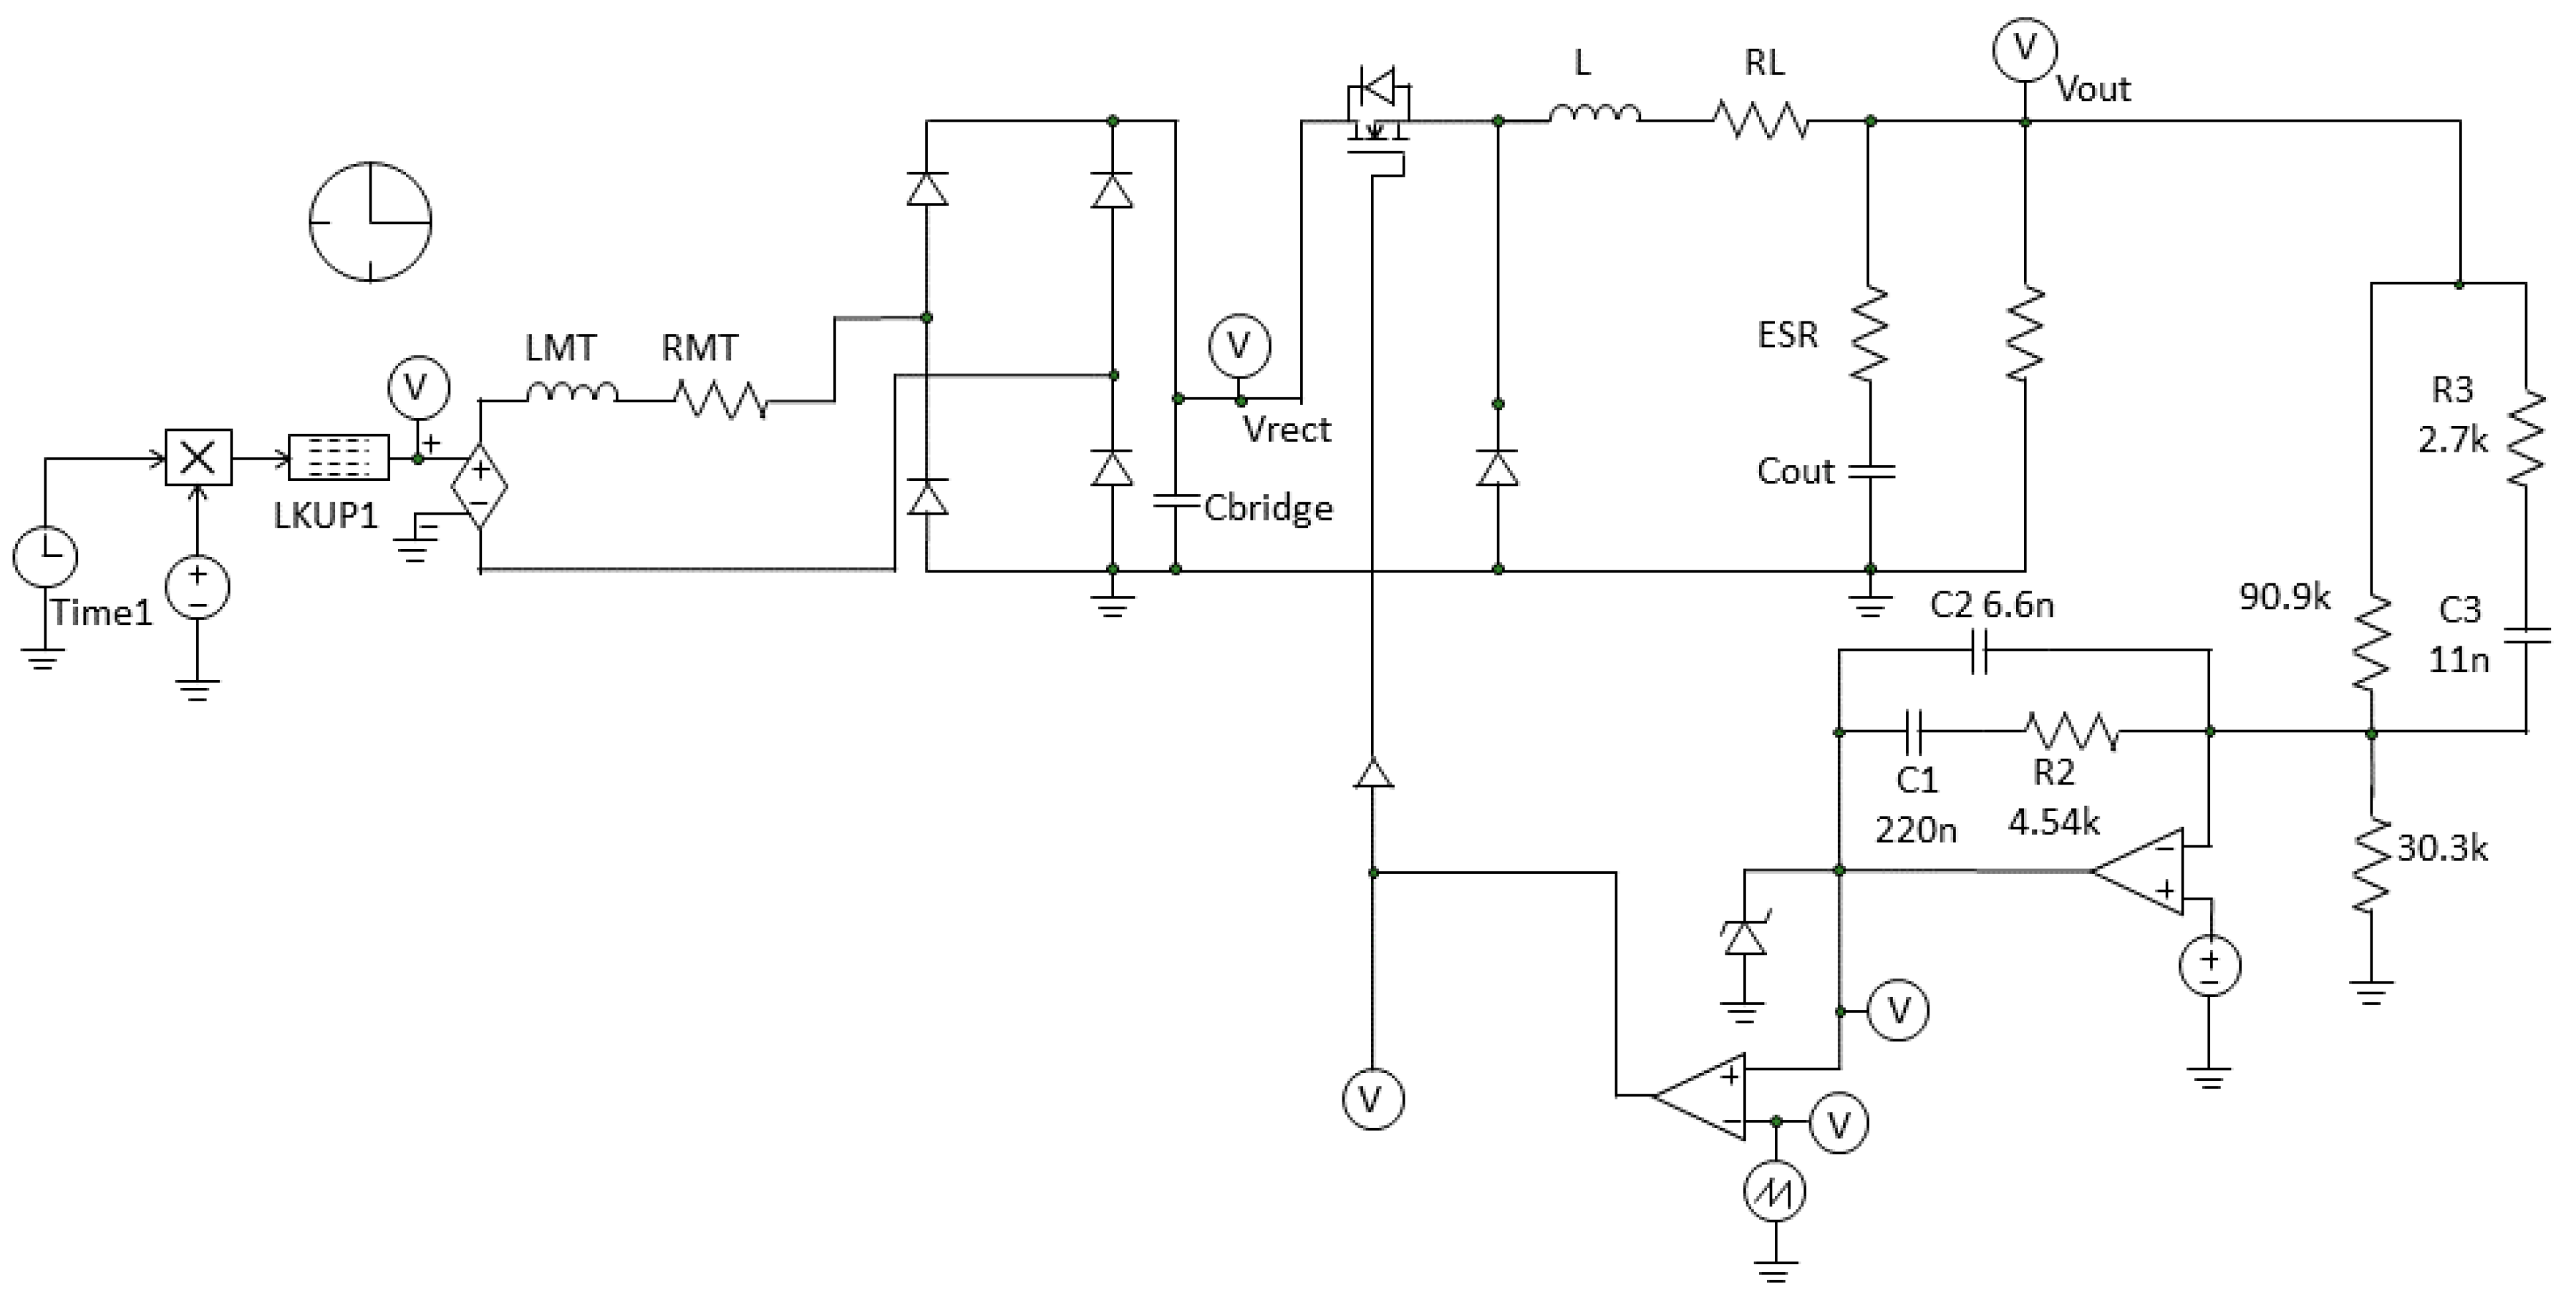
out is fixed at 1 mF, thus achieving a 0.4 open-loop damping factor. In
Figure 8, the schematics of the power electronics interface is shown. In the schematics, the generator phase, the rectifier section, and the power module are included.
The generator phase is modeled by a series connection of an inductance LMT and a resistor RMT. According to experimental results, LMT = 308 mH, RMT = 37 Ω. The measured open-circuit voltage waveform is forced as the input voltage of the power converter stage by means of the Look-up Table (LUT) block. Commercial components are modeled for inductors and capacitors, including parasitic elements.
The control system is based on a type III error amplifier network. Under the worst-case condition, a phase margin of 59.6°, a gain margin of 43.2 dB, and a 300 Hz bandwidth are achieved, ensuring a great level of robustness of the designed control system. The control system is designed to ensure stability and adequate dynamic response over a wide range of load current values. Stability is ensured up to 20 A to ensure a great design flexibility and modularity of the electrolyzer section. Under 20 A load current, a 74.2° phase margin, 32 dB gain margin, and 800 Hz bandwidth are achieved. Thanks to the robustness of the designed control system, up to 33 sea-water electrolyzer prototypes can be connected to each power module without requiring modification to the control section.
Simulation Results
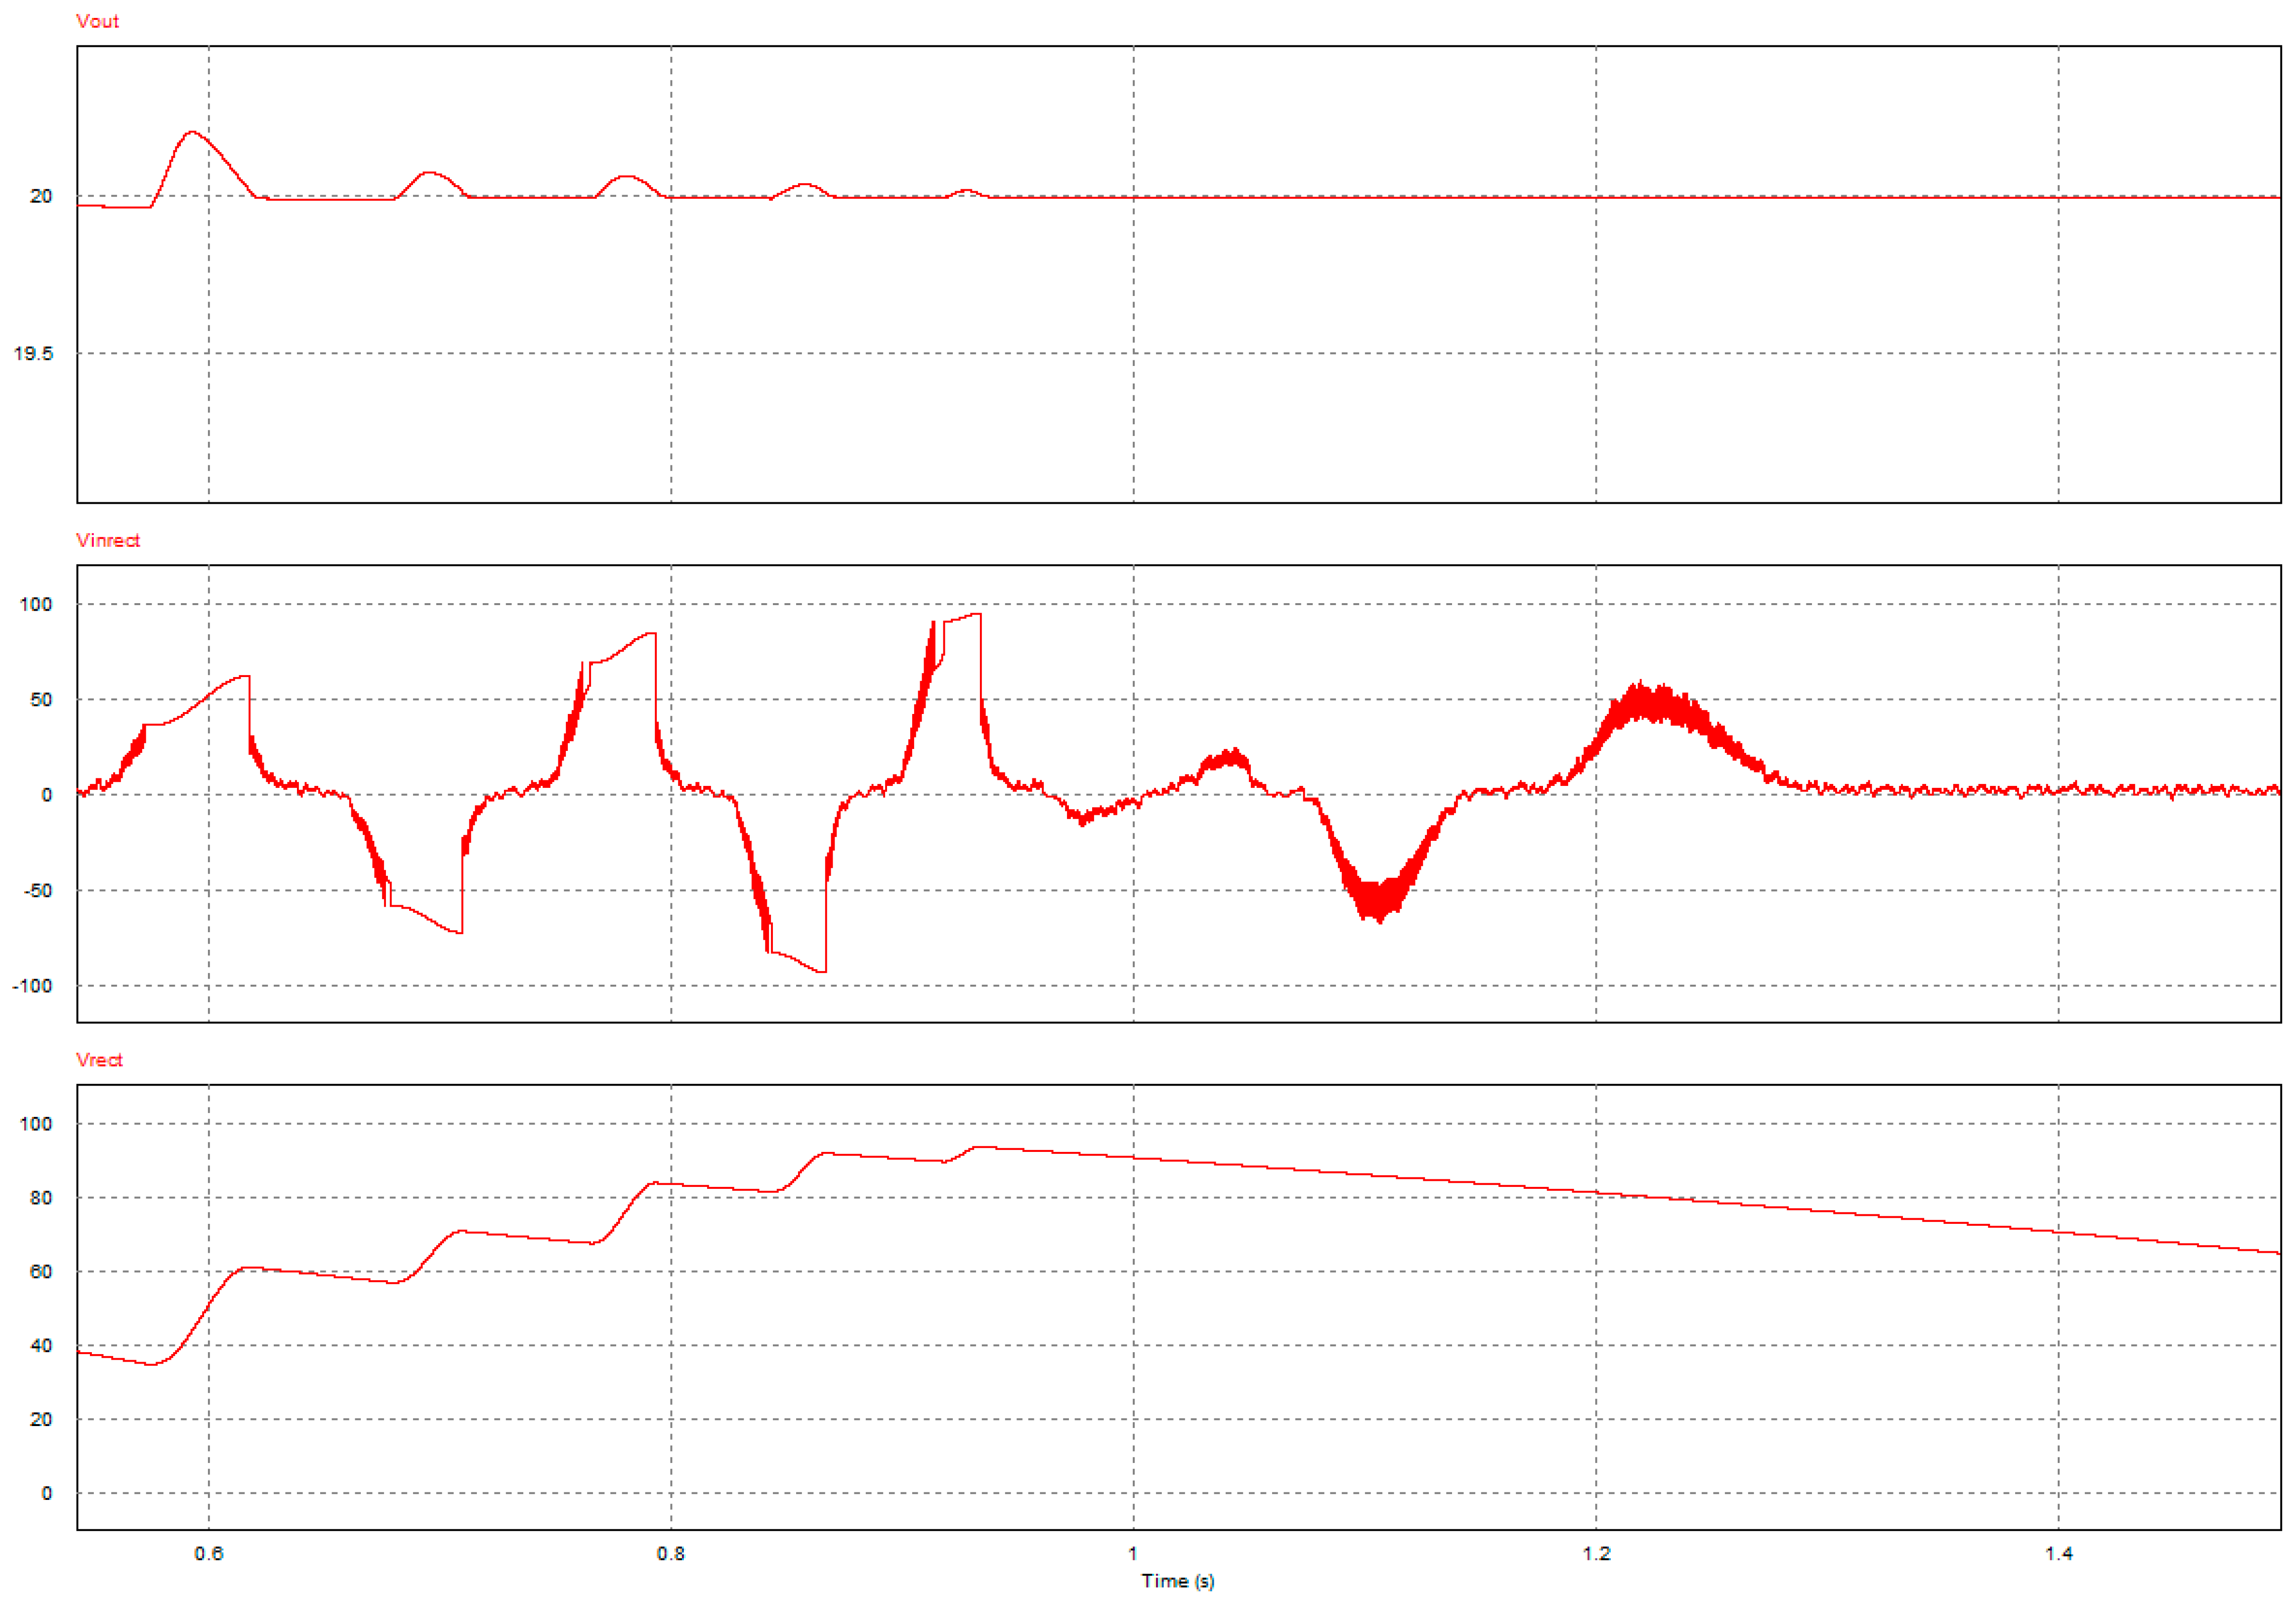
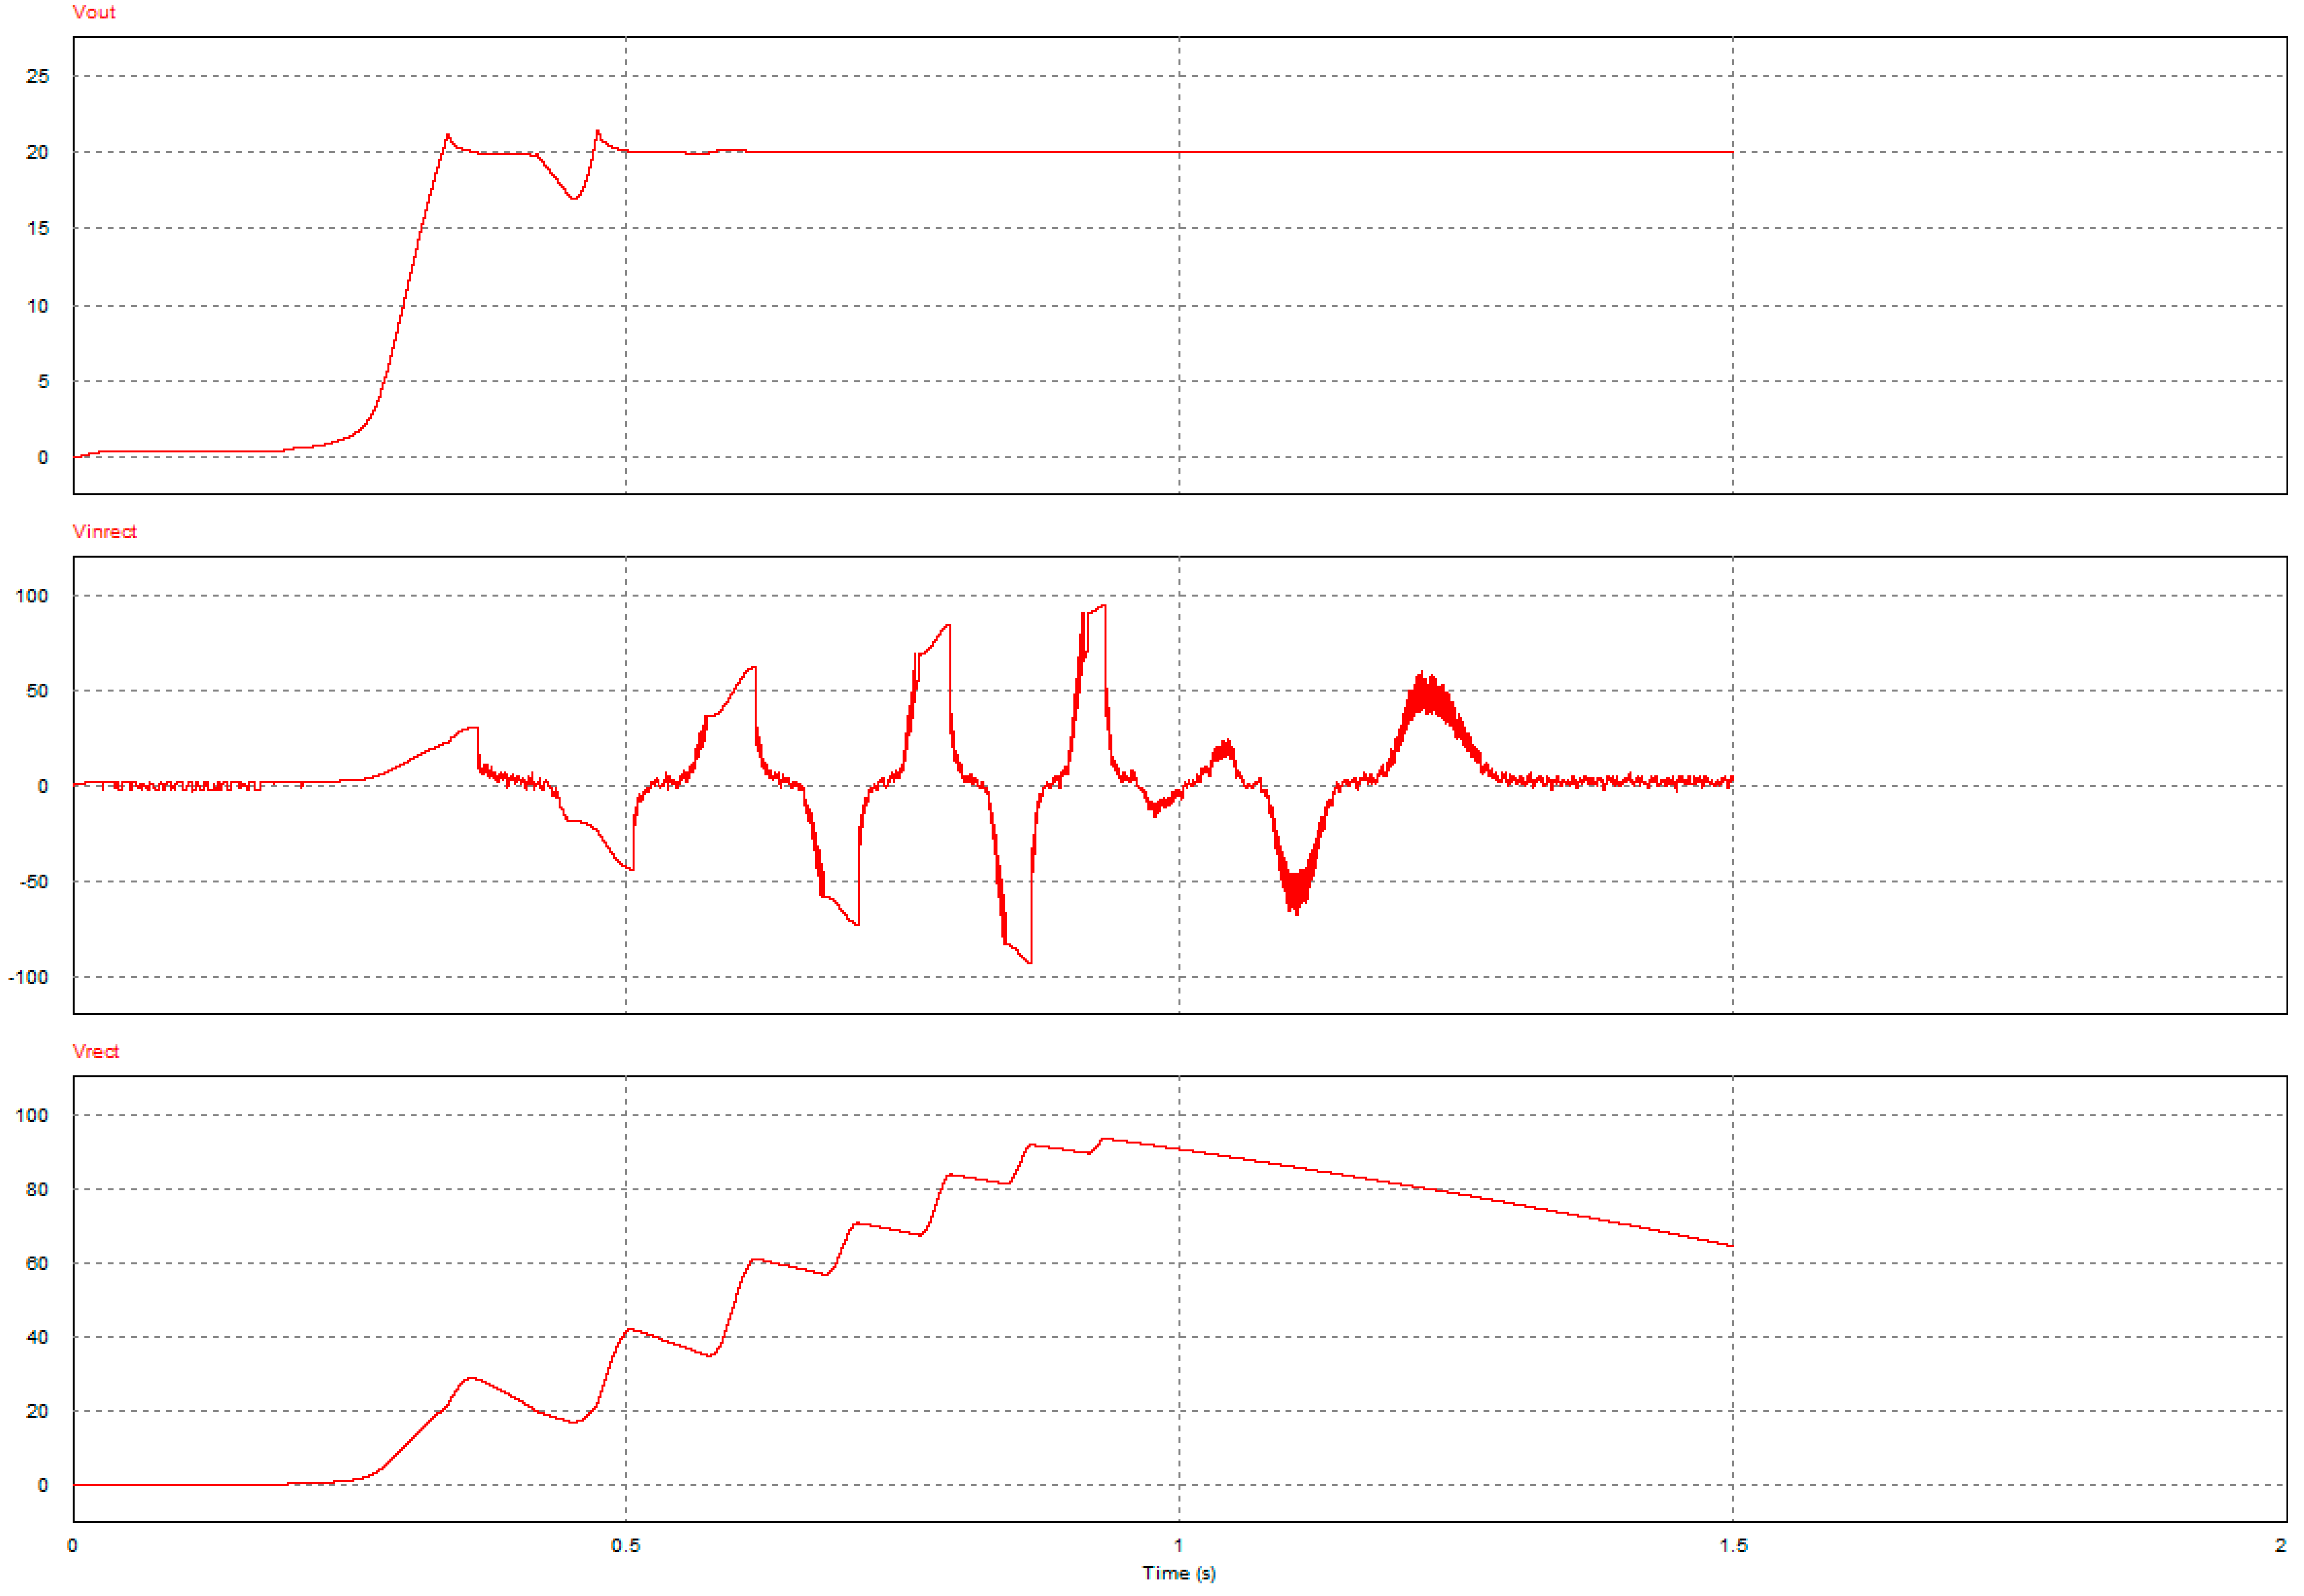
The simulation results here presented allow validation of the design procedure of the power module. In this case, the goal is achieved if, during the burst interval, the electrolyzer supply voltage remain a fixed and constant value. In
Figure 9, from the top to the bottom screen, the electrolyzer supply voltage V
out, the diode bridge rectifier input voltage waveform V
inrect and the diode bridge rectifier output V
rect are shown. As shown by simulation results, a proper regulation of the electrolyzer supply voltage is achieved over the whole burst interval. The simulation starts at the zero-voltage condition for each capacitive element. Therefore, the system startup condition is emulated and simulated. At the beginning of the voltage burst, the input rectifier voltage falls below the nominal supply voltage value of 20 V and, therefore, a transient on the output voltage occurs. Yet, thanks to a proper and accurate design of the buck converter stage, the maximum voltage change under this extreme input transient is equal to 3 V. After the voltage burst peak, a slow discharge of the capacitive buffer of the rectifier occurs, and the buck converter is supplied by the storage element. Measured voltage waveforms and parasitic elements of commercial components are included in the simulation setup to match the effective experimental behavior. Over the whole wave burst period, a proper regulation of the electrolyzer supply voltage is successfully achieved.
In
Figure 10, a detail of the voltage waveforms of
Figure 9 is shown. Discarding the startup condition, during the whole wave burst period, the maximum voltage change at the electrolyzer section is limited to 0.2 V, corresponding to 1% of the nominal voltage value.
These results clearly characterize the behavior of the electronic section. It is worthwhile to note that our conversion module is based on off-the-shelf electronic components. This fact potentially greatly enhances any maintenance procedures and greatly reduces the cost.
4.4. Evaluation of System Performances
As shown by experimental and simulations results, the small-scale prototype is suitable for hydrogen production and storage from sea water in the Mediterranean Sea area. According to the design procedure, one power module is adequately supplied if a continuous working strategy is adopted, so the electrolyzer here presented is adequately supplied. Modularity can increase the system redundancy and, therefore, the reliability of the whole system in case of a module fault. The modularity of the system allows the designer to easily upgrade the power level and hydrogen production rate of the whole marine plant.
Note that a nonisolated, low-cost, and low component count DC–DC converter is included within each module. The cost of the whole plant is mainly affected by the generator and the diode bridge. The cost of each module does not heavily affect the cost of the whole plant, allowing a high level of modularity.
5. Conclusions
In this paper, experimental test and simulations on a linear generator-based prototype of a wave energy conversion (WEC) system are proposed. The designed WEC system allows the production of hydrogen in a sheltered water area, like the Mediterranean Sea. The choice of hydrogen as the energy carrier is aimed to avoid a fixed submarine connection and to potentially enhance the overall reliability. The same reliability approach has been followed in the design of the electrical generator by choosing a device that can avoid any external moving parts. The mechanical structure of the proposed buoyant, with its intrinsic symmetrical structure, is immune to rotation and flip events, thus ensuring that the designed WEC is well suited to face storms and rough weather conditions. As a result, the intellectual path that has been followed in this paper is based on a preliminary analysis of the faults having occurred on the previous installations, which has led to some potential improvements of the design. For this reason, a standalone floating point absorber structure was chosen.
Experimental results for the forecast marine installation both of the permanent magnet linear generator and sea-water electrolyzer have been determined. On the basis of experimental results, a modular architecture for the hydrogen production and storage has been proposed and efficiently sized. Power module converters with a point-of-load DC–DC converter, acting as front-end between the generator and the electrolyzers, have been, for this porpoise, conceived and sized. The power module unit has been simulated, taking into account the voltage supply wave experimentally obtained from the linear generator. Simulation results allow validation of the design procedure of the power module such that, during the burst interval, the electrolyzer supply voltage regulated with a fixed and constant value. Moreover, the proposed power module architecture and size allows enhancement of the reliability of the power conversion section, limiting the cost and component count of the power plant and ensuring an adequate supply strategy for hydrogen storage.
The hydrogen production has been confirmed by a low-power fuel cell stack directly connected to the hydrogen output from the electrolyzer. The small-scale prototype is designed to be installed, in the near future, in the Mediterranean Sea. As shown by experimental and simulation results, the small-scale prototype is suitable for hydrogen production and storage from sea water in this area.
Authors are currently investigating several electrical configurations for the linear generator in order to identify the most efficient for marine installation and to enhance the power extension of the prototype. Moreover, a test bench equipped with a rectifier and an electronic charge will be set up to test the generator. The test will be carried out at several mechanical load weight values and will allow identification, considering the waves’ amplitude and the time interval between two waves, the number of electrolyzers that the generator can supply. At last, experimental testing of the whole system is foreseen before the marine installation.


