Disinfection in Wastewater Treatment Plants: Evaluation of Effectiveness and Acute Toxicity Effects
by
 , ,
, ,
Maria Cristina Collivignarelli
1,* ,
,
Alessandro Abbà
1,
Gianpaolo Alloisio
2,
Eleonora Gozio
2 and
Ilaria Benigna
1 1
Department of Civil Engineering and Architecture, University of Pavia, via Ferrata 1, 27100 Pavia, Italy
2
Department of Brescia, ARPA Lombardia (Regional Agency for Environmental Protection), via Cantore 20, 25123 Brescia, Italy
*
Author to whom correspondence should be addressed.
Sustainability 2017, 9(10), 1704; https://doi.org/10.3390/su9101704
Submission received: 10 July 2017
/
Revised: 7 September 2017
/
Accepted: 19 September 2017
/
Published: 22 September 2017
(This article belongs to the Special Issue Recent Advances for Water and Wastewater Treatment and Reuse with Emphasis in Applications in Vulnerable Communities)
Abstract
:In Italy, urban wastewater disinfection is regulated in the third part of Legislative Decree n. 152/2006, which states that wastewater treatment plants (WWTPs) must include a disinfection unit, with a capacity exceeding 2000 Population Equivalent (PE). This treatment shall ensure microbial quality and health security. The legislation provides the following limits for wastewater: Escherichia coli (E. coli) concentration below 5000 CFU 100 mL−1 (recommended value), active chlorine concentration below 0.2 mg L−1 and lack of acute toxicity. The compliance with these conditions is shown by means of the study of correct disinfectant dosage, which also depends on wastewater characteristics. An investigation at the regional level (from 2013 to 2016) shows a correlation between acute toxicity discharge and disinfection treatment through chemical reagents (mainly with the use of chlorine compounds and peracetic acid). The experimental work concerns two active sludge WWTPs in northern Italy with small capacity (10,000–12,000 PE). The activities provide the assessment of microbiological quality and toxicity of WWTPs effluents in relation to the dosage of sodium hypochlorite and peracetic acid, by means of the use of batch tests. The results show that with similar disinfectant dosage and comparable initial E. coli concentration, peracetic acid exhibits the best performance in terms of microbial removal (with removal yields up to 99.99%). Moreover, the acute toxicity was evident at higher doses and therefore with higher residuals of peracetic acid (2.68 mg L−1) compared to the free residual chlorine (0.17 mg L−1).
1. Introduction
Many human pathogens can be transmitted by waters contaminated by wastewater effluents, which should be disinfected to prevent the spread of pathogenic microorganisms, particularly when the wastewater is used for watering, drinking or bathing purposes [1].
Wastewater disinfection is applied to provide protection to humans against exposure to waterborne pathogenic microorganisms. Microbial inactivation is achieved in these processes by induced biochemical changes within the pathogenic microbial population. The nature of these biochemical changes is dependent upon the microbial population and the applied disinfectant. All disinfectants have the ability to involve changes in wastewater composition that many persist after the disinfection process is terminated, though the nature and extent of these changes will be site- and disinfectant-specific. One possible outcome of these chemical changes is an alteration of effluent toxicity [2].
Chlorination is the most widely used method for disinfecting the effluents from wastewater treatment plants (WWTPs) and from drinking water treatment plants (DWTPs), but can cause the formation of mutagenic/carcinogenic and toxic by-products that are potentially harmful to human and aquatic organisms [3,4,5,6,7,8,9,10].
Recently, peracetic acid (PAA) has also been proposed as a wastewater disinfectant. Peracetic acid (CH3CO3H) is a strong oxidant which presents several advantages, including: the treatment being easy to implement (without the need of high investment); the large spectrum of microbial activity even in the presence of heterogeneous organic matter; absence of residual or toxic and/or mutagenic by-products; not requiring dechlorination; presenting low dependency on pH; and short contact time [11]. Major disadvantages associated with PAA disinfection are the increase of organic content in the effluent due to acetic acid, and thus the potential for microbial regrowth (acetic acid is already present in PAA mixtures and is also formed after PAA decomposition) [12].
The disinfection efficiency of PAA in wastewater applications has been demonstrated in the scientific literature [13,14,15,16]. The formation of disinfection by-products (DBPs) during PAA disinfection was studied by Dell’Erba [17].
The European Community’s (EC) environmental regulations aim to reduce the pollution of surface water caused by municipal wastewater (Council Directive 91/271/EEC 1991 as amended by the Commission Directive 98/15/EEC of 27 February 1998) [18,19]. This requires the European Union member states to ensure that discharge of urban wastewater and its effects are monitored [20].
In order to prevent sanitary hazards related to the uses of recipient water bodies, the current Italian regulations prescribe WWTP effluent emission limits for a wide range of chemical compounds, toxicity, and bacterial discharge, such as Escherichia coli [21].
In Italy the legislation provides the following limits for wastewater: active chlorine concentration below 0.2 mg L−1, lack of acute toxicity and E. coli concentration below 5000 CFU 100 mL−1 (recommended value). In order to respect this value, many WWTPs apply a wastewater disinfection process, because sometimes the E. coli concentration in the effluent is higher than the limit established by the local authorities.
Disinfection techniques should be analyzed case by case, because each effluent shows different chemical and physical characteristics, and, sometimes, the reuse of wastewater (i.e., for agricultural use) is applied [22].
In a different way, depending on the treatment adopted, there are different E. coli removal yields for each different stage of WWTPs [23].
It is well known that some disinfectant treatments, despite promoting a reduction in pathogenic organisms and organic contaminants, can also produce toxic and genotoxic compounds, depending on the precursors present in the wastewater and the concentrations of disinfectant used [24].
To clarify this issue, a series of toxicity tests, using Daphnia magna, Vibrio fischeri and Pseudokirchneriella subcapitata [25,26,27,28,29], were performed on wastewater effluent samples taken from two WWTPs.
The toxicity responses were measured in disinfected and undisinfected effluent samples in order to evaluate the changes in toxicity attributable to disinfection processes.
The determination of toxicity in wastewater was carried out using Daphnia magna. The test is based on the observation of the number of immobile organisms after 24 h of exposure to the sample. Immobilization is the effect on the organisms caused by the toxic substances present in the sample.
In addition to the test with Daphnia magna as indicated in D.Lgs 152/2006 and further modifications, acute toxicity tests were carried out using bioluminescent bacteria (Vibrio fischeri) and monocellular green algae (Pseudokirchneriella subcapitata).
The test with Vibrio fischeri was based on the observation of luminescence inhibition after 15 min and 30 min. In the case of Pseudokirchneriella subcapitata the test was based on the observation of inhibition of algal growth after 72 h.
The study of disinfectant agents suitable for microbial population removal without acute toxicity is very important, especially in Italy due to the different enforcement (at a local scale) of E. coli limit values, which, according to national legislation, are recommendations only.
The aim of the present study was to compare two different disinfectants (sodium hypochlorite and peracetic acid) in terms of acute toxicity on the water body and microbial inactivation. Moreover, the aim was to find a dosage range which allows the respect of E. coli limit values, acute toxicity, disinfectant residual and COD (Chemical Oxygen Demand).
The disinfection tests were applied to the effluent from two active sludge WWTPs in northern Italy with small capacities (10,000 to 12,000 PE), and two disinfectant agents (sodium hypochlorite and PAA) were used. These activities provided the assessment of microbiological quality and toxicity of WWTPs effluents in relation to the dosage of sodium hypochlorite and peracetic acid, by means of the use of batch tests.
2. Materials and Methods
2.1. Description of the WWTPs and Characteristics of the Influent
The experimental work were carried out on two urban WWTPs in northern Italy with small capacities (12,000 PE and 10,000 PE respectively).
The urban WWTPs identified by number 1 and 2 are based on a conventional active sludge (CAS) process with a pre-denitrification scheme. They treat domestic, meteoric and industrial sewage collected in a unit drainage system. Table 1 presents the main features of each WWTP.
Both WWTPs are equipped with an emergency disinfection unit with the use of sodium hypochlorite. The contact tanks are built with a longitudinal baffle serpentine flow basin, with a volume of 90 m3 for WWTP 1 and 35 m3 for WWTP 2 (the contact time depends on the flow rate, usually about 30 min for WWTP 1 and 20 min for WWTP 2). There are no flash-mixing tanks.
2.2. Experimental Tests
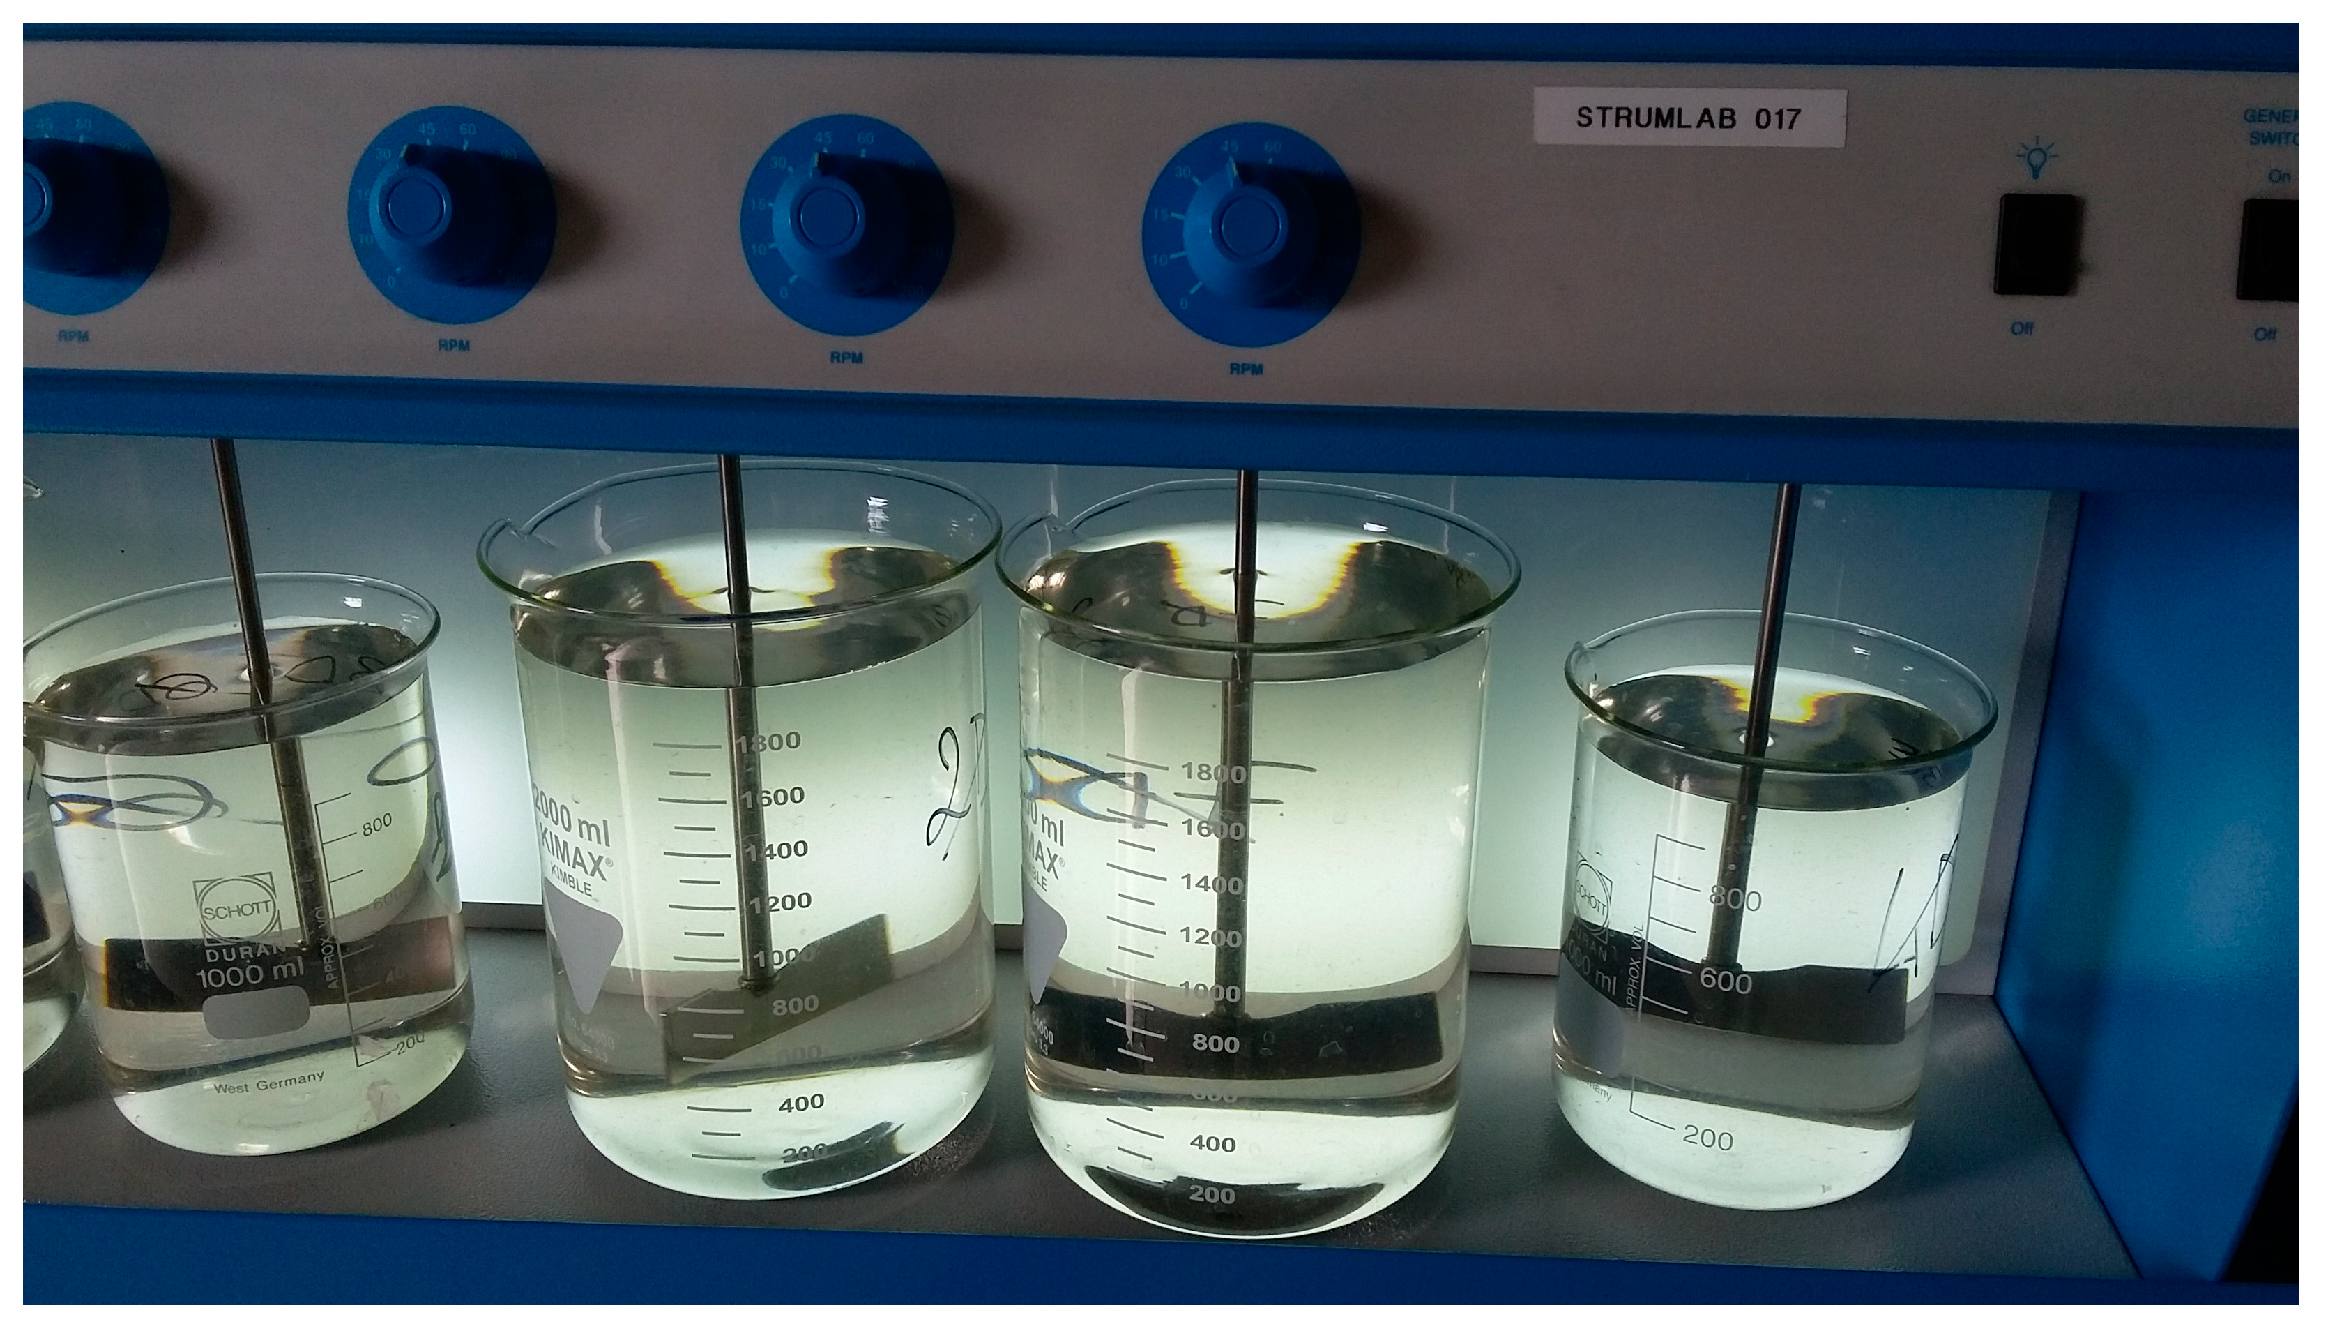
Laboratory scale disinfection tests were executed (in the WWTPs analyzed) using 40 L of purified effluent taken with an automatic sampler. Each day, three disinfection tests were carried out with different sodium hypochlorite doses, three tests with different peracetic acid doses (PAA) and a reference sample without the dosage of disinfectant agents. pH was measured at the beginning and end of the tests. The solutions were put into a jar test for mixing (Figure 1) with a rotation speed of 45 rpm.
Disinfection tests were carried out on the effluent of WWTP 1 by testing different disinfectant dosages, while for the WWTP 2 the doses were chosen on the basis of the results obtained for WWTP 1. Table 2 presents the experimental program and the analysis/tests carried out in the work.
2.3. Analytical Methods
The concentrations of COD, BOD5, N-NH4+, N-NO2−, N-NO3−, Total Nitrogen (TN), Total Phosphorus (TP) and Total Suspended Solids (TSS) were measured according to standard methods for water and wastewater [30,31,32,33]. BOD5 was determined at 20 °C by inoculation of activated sludge from the WWTP. The pH was measured with a probe Sentix 940-3 WTW®.
The concentrations of residual chlorine and residual acid peracetic were measured by means of colorimetric tests.
Free residual chlorine was measured with Hach Lange LCK 410 kit.
Total chlorine and peracetic acid residues were measured with the method “Hach 10070 Pillows powder”. In case of PAA the conversion of mg Cl2 L−1 to mg PAA L−1 (by multiplying the value of 1.07) is necessary [34].
The respirometric tests of oxygen uptake rate (OUR) were carried out according to ISO 8192:2007 [35].
The E. coli concentration was measured using two methods: the number of colonies of E. coli (CFU) (Standard Method) [30] and the most probable number of microorganisms per volume (MPN) [36].
The CFU method allows the counting of the number of E. coli colonies grown on a membrane on agar soil supplemented with chromogenic substances. The sample is filtered through a cellulose ester membrane of 0.45 μm nominal porosity. After an incubation period of 18–24 h at 44 ± 1 °C, the results are read under ultraviolet light (366 nm). The 4-methylumbelliferyl-β-d-glucuronide (MUG) compound, embedded in the soil, is hydrolyzed by β-glucuronidase of E. coli, releasing 4-methylumbelliferone compound which thus produces ultraviolet light-fluorescent blue-green colonies. The results are expressed as colony forming units per 100 mL sample.
The MPN method expresses results as the most likely number of microorganisms per volume. A dehydrated soil is added to a sample; then the mixture is transferred in boxes that are sealed and then incubated at 36 ± 2 °C for 18–22 h. After the incubation, samples with a yellow color intensity equal to or greater than that of the Quanti-Tray/2000 Comparator are considered positive for coliform bacteria. Yellow samples, which are tested under UV light (365 nm) in a dark room, exhibiting any degree of fluorescence are considered positive for E. coli. The most probable amount of E. coli in 100 mL of the sample can be determined through statistical tables.
The determination of the acute toxicity of the WWTPs effluents was carried out by multispecific ecotoxicological tests: Daphnia magna at 24 h [37], Vibrio fischeri at 15 min and 30 min [38] and Pseudokirkneriella subcapitata at 72 h [39].
Neonates of Daphnia magna were held in a temperature-controlled room at 20 ± 2 °C illuminated with fluorescent lamps for 16 h d−1. In the acute toxicity tests, daphnids were exposed to samples of different concentrations of wastewater and the tested agent; the immobile daphnids were counted after 24 h of exposure.
The luminescence of reconstituted liquid dried bacteria Vibrio fischeri NRRL-B-11177 was measured on a Microtox mod. 500 luminometer according to the ISO standard. The luminescent bacteria were exposed to wastewater samples for 15 min and 30 min. The percentage inhibition was calculated for each concentration relative to the control.
The green, unicellular algae Pseudokirchneriella subcapitata were cultured in a nutrient solution prepared and kept on an orbital shaker at 100 rpm at a constant room temperature of 23 ± 2 °C and under continuous fluorescent illumination (6000–10,000 lx.). After 72 h the growth of algae was determined by algal density, which was measured by counting algal cells in a Burker counting cell or absorbance measurement with the spectrophotometer. The inhibition of specific growth rates for each concentration was calculated in comparison to the control.
3. Results and Discussion
3.1. WWTPs Performance Evaluation
Table 3 shows the concentrations of COD, BOD5, TSS, TN, nitrogenous forms and TP measured in each WWTP during the disinfection tests.
The analyses were carried out to evaluate the performance of WWTPs. Table 3 shows that disinfection does not involve a significant modification in qualitative characteristics of the effluent.
It can be observed that the effluents of the WWTPs analyzed respect the limit values reported by Italian legislation [18], for COD, BOD5 and TSS, and by the Lombardy Regulation n. 3/2006 (in Tab. 5 and Tab. 6) [40] for TN and TP. Furthermore, the average removal efficiency of COD, BOD5 and TSS is higher than 90% for both of WWTPs; as concerns TN and TP, the average removal yields of WWTP 1 (65% and 77% respectively) are lower than the performance obtained in WWTP 2 (90% for both pollutants).
Moreover, the results of respirometric tests of OUR have confirmed the good performance of WWTPs and the good “state of health” of biomass.
3.2. Disinfectant Residual
3.2.1. Sodium Hypochlorite
The results reported in Figure 2 show the free and total residual chlorine for all disinfection tests carried out with the use of different doses of sodium hypochlorite; moreover, the limit value of active chlorine concentration (equal to 0.2 mg L−1) is reported.
In Figure 2 the acute toxicity is also shown for different content of free chlorine. It can be noted that, according to several studies [1,41,42,43,44] there is a good correlation between the concentration of chloramines (indirectly calculated as the difference between total chlorine and free chlorine) and the acute toxicity observed with Daphnia magna, Pseudokirchneriella subcapitata and Vibrio fischeri. Moreover, high content of free chlorine involves acute toxicity, although the chloramine concentrations persist in the aquatic environment for a long time (and only sunlight/ventilation lead to their removal) and the risks due to their presence could be high.
3.2.2. Peracetic Acid
Figure 3 shows the residual PAA and COD concentration after disinfection tests with peracetic acid. Unlike the free residual chlorine, for the residual PAA, in Italy, there are no limit values.
COD concentration was monitored in the case of disinfection with peracetic acid due to the increase in the concentration of organic matter; in the tests, this increase was approximately equal to 50% for WWTP 1 and equal to 60% for WWTP 2, but the COD concentration was always below the limit of 125 mg L−1 (Decree Italian Law 152/2006).
In disinfection tests the decay of PAA was not evaluated, because the aim of the present study was not to find an optimal disinfectant dosage but a range of dosages that would respect the limit values of E. coli and toxicity. It was not considered decay because Rossi et al., 2007 [14] have shown that it becomes significant with doses and contact times far higher than those applied.
3.3. Acute Toxicity Assessment
The results of the acute toxicity of experimental disinfection tests using both disinfectants are shown below.
The sample is considered toxic when at least one of these three conditions occurs:
- in the case of Daphnia magna, the percentage of immobilisation is greater or equal to 50%;
- in the case of Vibrio fischeri, the inhibition of luminescence is greater or equal to 50%;
- in the case of Pseudokirchneriella subcapitata, inhibition of algal growth is greater or equal to 50%.
There is conformity when the limit on free active chlorine is 0.2 mg L−1, the E. coli limit of 5000 CFU 100 mL−1 and the absence of acute toxicity are observed at the same time.
3.3.1. Sodium Hypochlorite
In Table 4 the results of the acute toxicity assessments, using three species from different trophic levels of aquatic ecosystems, with an active chlorine dosage are shown. Grey cells show the values of the limits that are not observed.
As regards the WWTP 1, the acute toxicity was increased as the free residual chlorine value increases. Acute toxicity has been reported for values above 0.17 mg L−1. An active chlorine dosage between 30 and 50 mg min L−1 allowed the contemporary respect of the E. coli limit value and a non-toxicity of disinfected effluent.
Concerning the WWTP 2, acute toxicity has been reported for values above 0.20 mg L−1. An active chlorine dosage between 20 and 25 mg min L−1 allowed the contemporary respect of the E. coli limit and a non-toxicity of disinfected effluent.
The use of low dosages of active chlorine has involved a scarce disinfection efficiency, especially in case of high E. coli concentrations, that, for WWTP 1, has reached 26,000 CFU 100 mL−1. A proper solution for disinfection efficiency increasing could be two or three-step chlorination, also in order to reduce the DBPs formation and the toxicity effects [45,46].
3.3.2. Peracetic Acid
In Table 5 the results of the acute toxicity assessment, using three species from different trophic levels of aquatic ecosystems with a PAA dosage, are reported. Grey cells show the values of the limits that are not observed.
Concerning the WWTP 1, the acute toxicity was increased as the residual PAA value increases. Acute toxicity has been reported for values above 2.68 mg L−1. A PAA dosage between 20 and 40 mg min L−1 allowed the contemporary respect of the E. coli limit and a non-toxicity of disinfected effluent.
The results obtained for WWTP 2 effluent is similar to WWTP 1: in fact, a PAA dosage between 20 and 35 mg min L−1 allowed the contemporary respect of the E. coli limit value and a non-toxicity of disinfected effluent.
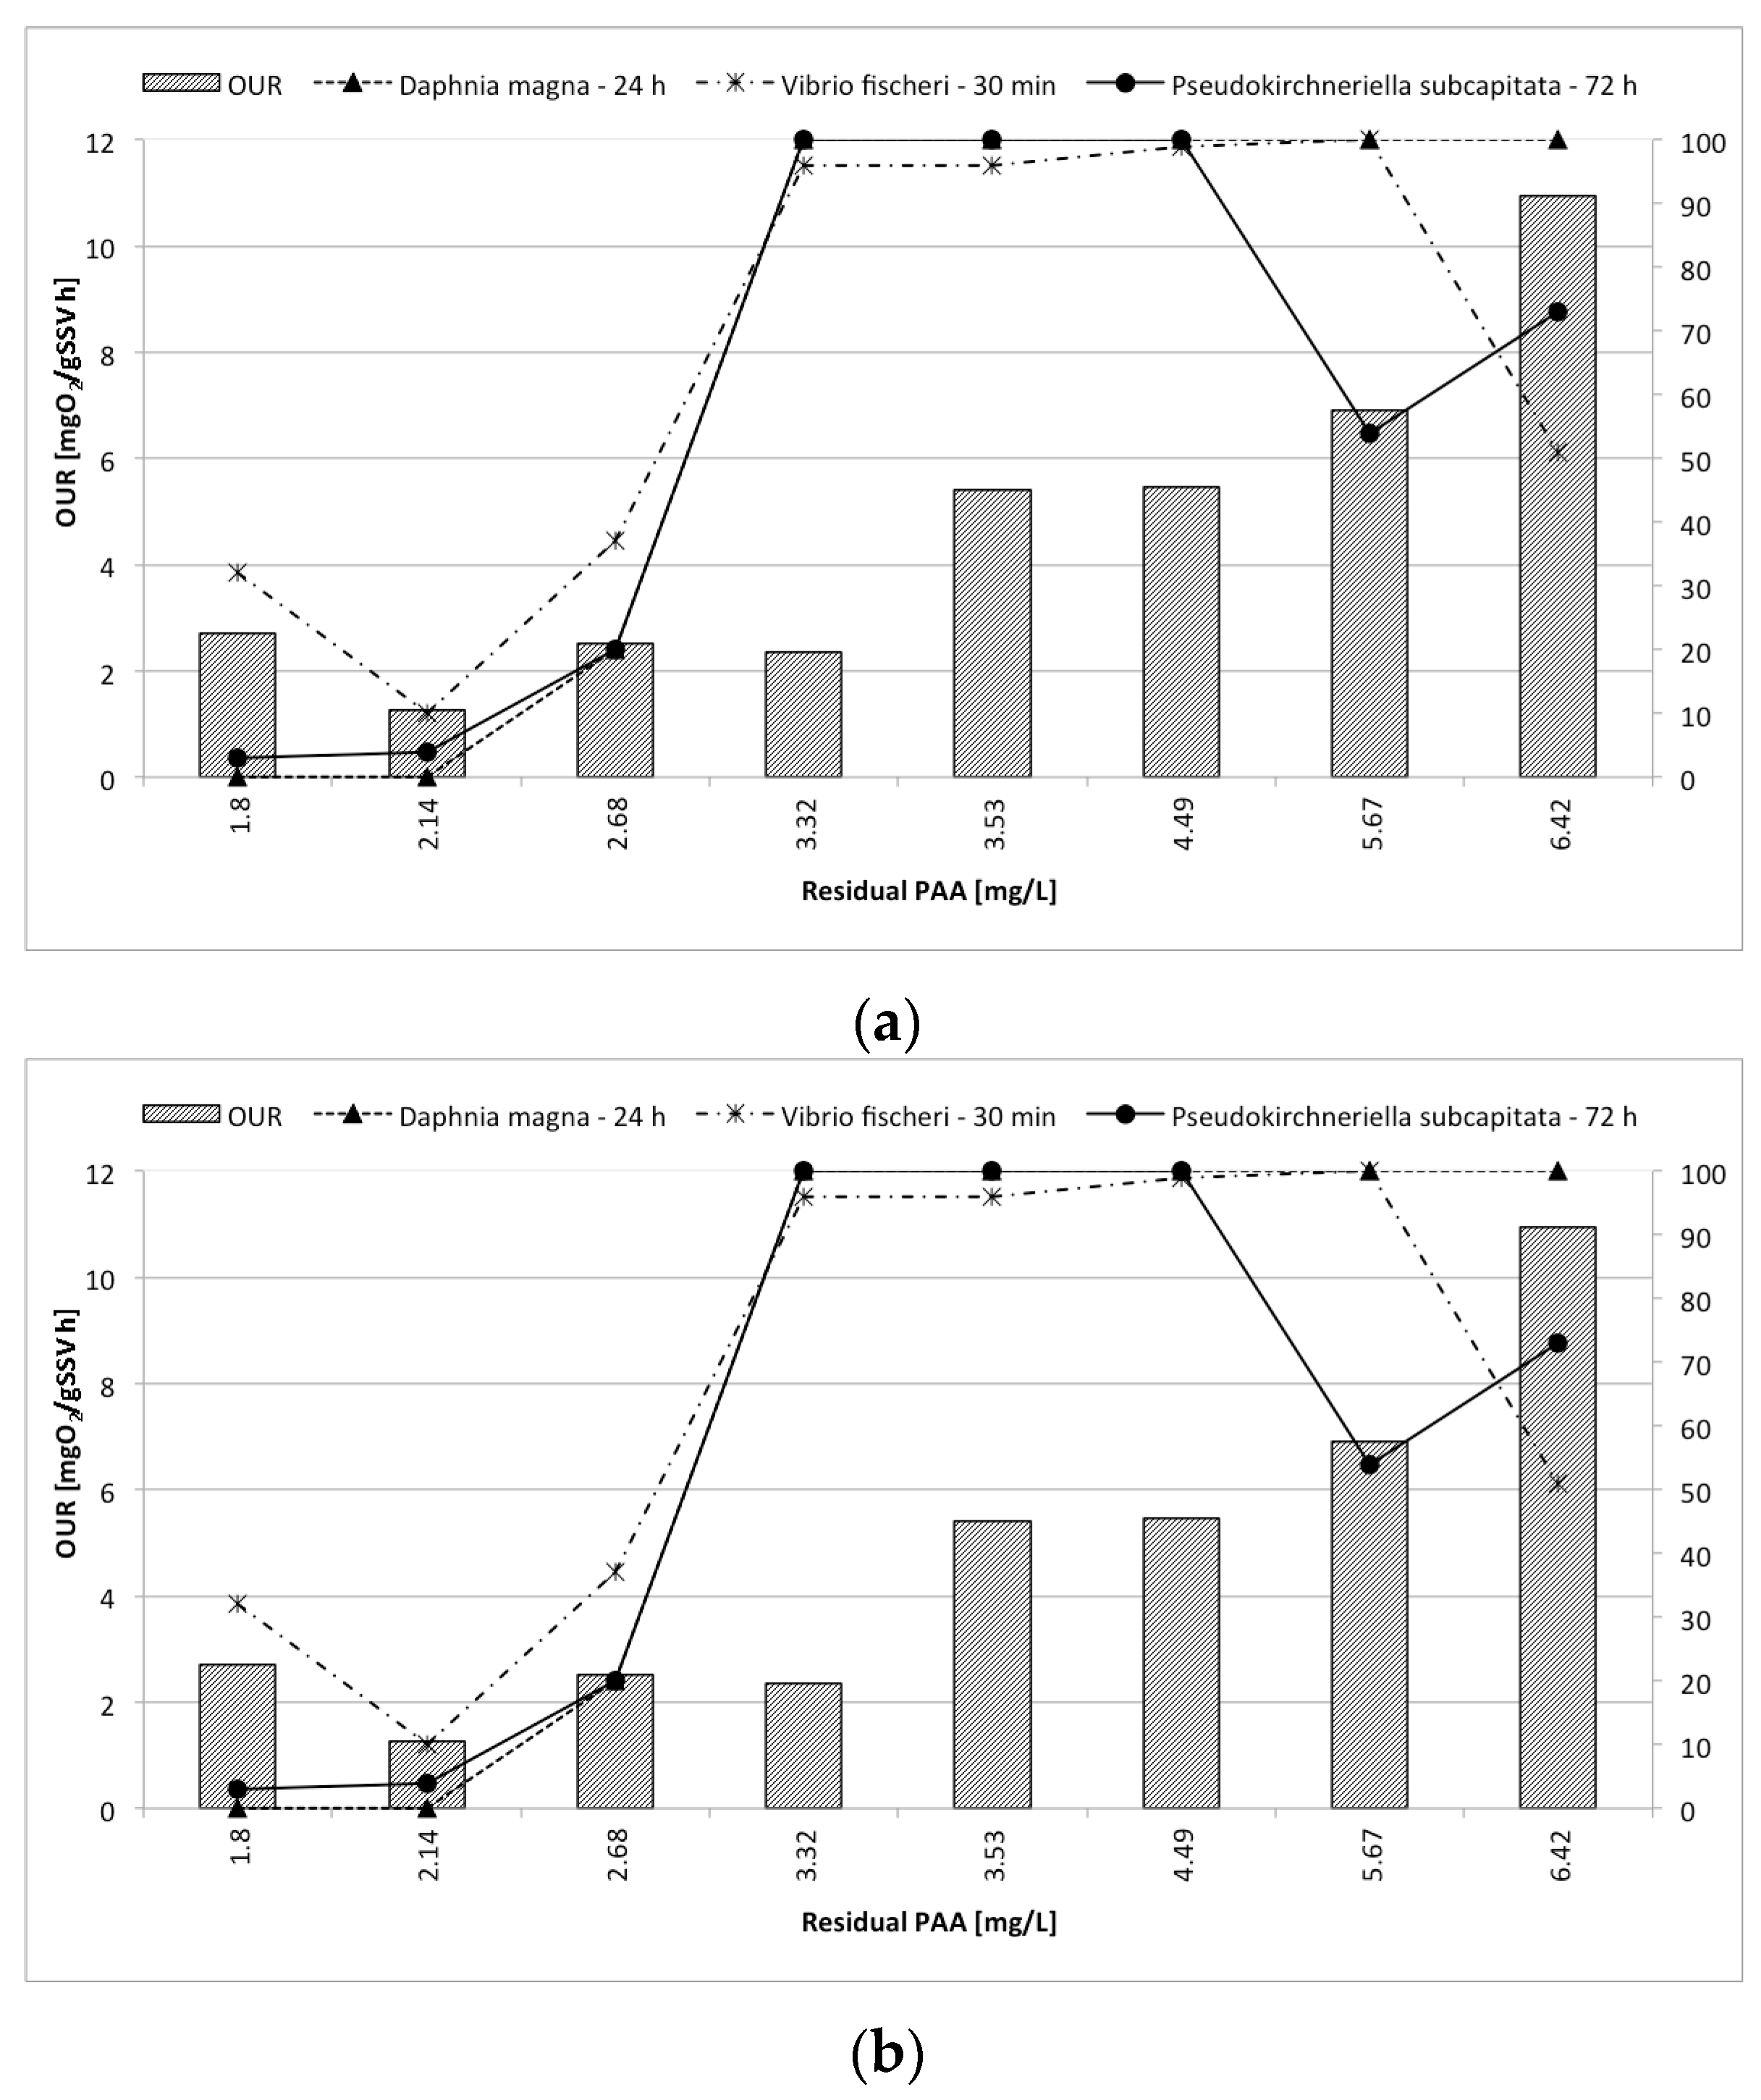
3.4. OUR Tests
The OUR values shown in Figure 4 consider only the part of oxygen demand to degrade the organic matter (the values reported are obtained by the difference between the OUR of each effluent and the endogenous values). When the free residual chlorine limit value is higher than 0.2 mg L−1, a slowing down of oxygen consumption, to degrade the organic matter present in the effluent, is observed. The effect of chlorination is generally a reduction in carbonaceous oxygen uptake rate (OUR) [47].
Moreover, Figure 4 shows that there is a correlation between the reduction of OUR and the presence of toxicity (especially for Vibrio fischeri) in case of sodium hypochlorite use. Concerning disinfection with PAA there is not a correlation with toxicity; indeed an increase in organic content, due to acetic acid that is readily biodegradable, and OUR enhancement were observed.
4. Conclusions
The aim of the present study was to evaluate the ecotoxicological behavior of secondary effluents disinfected with sodium hypochlorite and PAA using three species from different trophic levels of aquatic ecosystems. Moreover, the work is aimed to find a dosage range, which allows the respect of E. coli limit values, acute toxicity, disinfectant residual and COD.
The experimental activities provided assessment of microbiological quality and toxicity of WWTPs effluents in relation to the dosage of sodium hypochlorite and peracetic acid, by means of the use of batch tests.
The results showed that the acute toxicity was increased as the disinfectant residual value increases. Moreover, residual acute toxicity of peracetic acid was higher (2.68 mg L−1) than residual chlorine (0.17 mg L−1). As concerns the chlorination, a good correlation between the content of chloramines and the acute toxicity was observed.
As concerns the WWTP 1, an active chlorine dosage between 30 and 50 mg min L−1 allowed the contemporary respect of the limit of E. coli and a non-toxicity of disinfected effluent and a PAA dosage between 20 and 40 mg min L−1 allowed the contemporary respect of the E. coli limit and a non-toxicity of disinfected effluent. Concerning the WWTP 2, an active chlorine dosage between 20 and 25 mg min L−1 allowed the contemporary respect of the E. coli limit and a non-toxicity of disinfected effluent and a PAA dosage between 20 and 35 mg min L−1 allowed the contemporary respect of the E. coli limit value and a non-toxicity of disinfected effluent.
The results show that with similar disinfectant dosage and comparable initial E. coli concentration, peracetic acid displayed the best performance in terms of microbial removal (with removal yields up to 99.99%).
Acknowledgments
Authors wish to thank A2A Ciclo idrico for giving the cofinancial support to the experimental research.
Author Contributions
Maria Cristina Collivignarelli and Gianpaolo Alloisio supervised the experimental work and data analysis; Alessandro Abbà and Ilaria Benigna carried out the experimental tests and the data analysis; Eleonora Gozio supervised the ecotoxicological analyses and advised on the data interpretation.
Conflicts of Interest
The authors declare no conflict of interest.
References
- Monarca, S.; Feretti, D.; Collivignarelli, C.; Guzzella, L.; Zerbini, I.; Bertanza, G.; Pedrazzani, R. The influence of different disinfectants on mutagenicity and toxicity of urban wastewater. Water Res. 2000, 34, 4261–4269. [Google Scholar] [CrossRef]
- Blatchley, E.R., III; Hunt, B.A.; Duggirala, R.; Thompson, J.E.; Zhao, J.; Halaby, T.; Cowger, R.L.; Straub, C.M.; Alleman, J.E. Effects of disinfectants on wastewater effluent toxicity. Water Res. 1997, 31, 1581–1588. [Google Scholar] [CrossRef]
- Yang, M.; Zhang, X. Comparative Developmental Toxicity of New Aromatic Halogenated DBPs in a Chlorinated Saline Sewage Effluent to the Marine Polychaete Platynereis dumerilii. Environ. Sci. Technol. 2013, 47, 10868–10876. [Google Scholar] [CrossRef] [PubMed]
- Yang, M.; Liu, J.; Zhang, X.; Richardson, S.D. Comparative Toxicity of Chlorinated Saline and Freshwater Wastewater Effluents to Marine Organisms. Environ. Sci. Technol. 2015, 49, 14475–14483. [Google Scholar] [CrossRef] [PubMed]
- Liu, J.; Zhang, X. Comparative toxicity of new halophenolic DBPs in chlorinated saline wastewater effluents against a marine alga: Halophenolic DBPs are generally more toxic than haloaliphatic ones. Water Res. 2014, 65, 64–72. [Google Scholar] [CrossRef] [PubMed]
- Sun, Y.-X.; Wu, Q.-Y.; Hu, H.-Y.; Tian, J. Effect of ammonia on the formation of THMs and HAAs in secondary effluent chlorination. Chemosphere 2009, 76, 631–637. [Google Scholar] [CrossRef] [PubMed]
- Wu, M.N.; Wang, X.C.; Ma, X.Y. Characteristics of THMFP increase in secondary effluent and its potential toxicity. J. Hazard. Mater. 2013, 325–331. [Google Scholar] [CrossRef] [PubMed]
- Sorlini, S.; Biasibetti, M.; Gialdini, F.; Collivignarelli, M.C. How can drinking water treatments influence chlorine dioxide consumption and by-product formation in final disinfection? Water Sci. Technol. Water Supply 2016, 16. [Google Scholar] [CrossRef]
- Sorlini, S.; Collivignarelli, M.C.; Canato, M. Effectiveness in chlorite removal by two activated carbons under different working conditions: A laboratory study. J. Water Supply Res. Technol. AQUA 2015, 64, 450–461. [Google Scholar] [CrossRef]
- Watson, K.; Shaw, G.; Leusch, F.D.L.; Knight, N.L. Chlorine disinfection by-products in wastewater effluent: Bioassay-based assessment of toxicological impact. Water Res. 2012, 46, 6069–6083. [Google Scholar] [CrossRef] [PubMed]
- De Souza, J.B.; Queiroz Valdez, F.; Jeranoski, R.F.; de Sousa Vidal, C.M.; Cavallini, G.S. Water and Wastewater Disinfection with Peracetic Acid and UV Radiation and Using Advanced Oxidative Process PAA/UV. Int. J. Photoenergy 2014. [Google Scholar] [CrossRef]
- Kitis, M. Disinfection of wastewater with peracetic acid: A review. Environ. Int. 2004, 30, 47–55. [Google Scholar] [CrossRef]
- Antonelli, M.; Rossi, S.; Mezzanotte, V.; Nurizzo, C. Secondary effluent disinfection: PAA long term efficiency. Environ. Sci. Technol. 2006, 40, 4771–4775. [Google Scholar] [CrossRef] [PubMed]
- Rossi, S.; Antonelli, M.; Mezzanotte, V.; Nurizzo, C. Peracetic acid disinfection: A feasible alternative to wastewater chlorination. Water Environ. Res. 2007, 79, 341–350. [Google Scholar] [CrossRef] [PubMed]
- Mezzanotte, V.; Antonelli, M.; Citterio, S.; Nurizzo, C. Wastewater Disinfection Alternatives: Chlorine, Ozone, Peracetic Acid, and UV Light. Water Environ. Res. 2007, 79, 2373–2379. [Google Scholar] [CrossRef] [PubMed]
- Luukkonen, T.; Teeriniemi, J.; Prokkola, H.; Rämö, J.; Lassi, U. Chemical aspects of peracetic acid based wastewater disinfection. Water SA 2014, 40. [Google Scholar] [CrossRef]
- Dell’Erba, A.; Falsanisi, D.; Liberti, L.; Notarnicola, M.; Santoro, D. Disinfection by-products formation during wastewater disinfection with peracetic acid. Desalination 2007, 215, 177–186. [Google Scholar] [CrossRef]
- Regulations on Environmental Matters; Decree Italian Law 152/2006. 2006. Available online: http://www.gazzettaufficiale.it/atto/serie_generale/caricaDettaglioAtto/originario?atto.dataPubblicazioneGazzetta=2006-04-14&atto.codiceRedazionale=006G0171 (accessed on 10 July 2017).
- Directive 2000/60/EC, 23 October 2000. Establishing a Framework for Community Actions in the Field of Water Policy. Available online: http://ec.europa.eu/environment/water/water-framework/index_en.html (accessed on 10 July 2017).
- Farré, M.L.; García, M.-J.; Tirapu, L.; Ginebreda, A.; Barceló, D. Wastewater toxicity screening of non-ionic surfactants by Toxalert® and Microtox® bioluminescence inhibition assays. Anal. Chim. Acta 2001, 427, 181–189. [Google Scholar] [CrossRef]
- Pignata, C.; Fea, E.; Rovere, R.; Degan, R.; Lorenzi, E.; de Ceglia, M.; Schilirò, T.; Gilli, G. Chlorination in a wastewater treatment plant: Acute toxicity effects of the effluent and of the recipient water body. Environ. Monit. Assess. 2012, 184, 2091–2103. [Google Scholar] [CrossRef] [PubMed]
- Papa, M.; Bertanza, G.; Abbà, A. Reuse of wastewater: A feasible option, or not? A decision support system can solve the doubt. Desalination Water Treat. 2015. [Google Scholar] [CrossRef]
- Raboni, M.; Gavasci, R.; Torretta, V. Assessment of the Fate of Escherichia coli in Different Stages of Wastewater Treatment Plants. Water Air Soil Pollut. 2016, 227, 455. [Google Scholar] [CrossRef]
- Da Costa, J.B.; Rodgher, S.; Daniel, L.A.; Espındola, E.L.G. Toxicity on aquatic organisms exposed to secondary effluent disinfected with chlorine, peracetic acid, ozone and UV radiation. Ecotoxicology 2014, 23, 1803–1813. [Google Scholar] [CrossRef] [PubMed]
- Farré, M.; Arranz, F.; Ribó, J.; Barceló, D. Interlaboratory study of the bioluminescence inhibition tests for rapid wastewater toxicity assessment. Talanta 2004, 62, 549–558. [Google Scholar] [CrossRef] [PubMed]
- Park, K.; Choi, S.; Lee, S.; Kweon, J.; Song, J. Comparison of formation of disinfection by-products by chlorination and ozonation of wastewater effluents and their toxicity to Daphnia magna. Environ. Pollut. 2016, 215, 314–321. [Google Scholar] [CrossRef] [PubMed]
- Amodei, M.; Azzoni, R.; Marina Pocar, M. Daphnia magna nel monitoraggio ambientale. Biol. Ambient. 2000, 14, 13–20. [Google Scholar]
- Antonelli, M.; Mezzanotte, V.; Panouillères, M. Assessment of peracetic acid disinfected effluents by microbiotests. Environ. Sci. Technol. 2009, 43, 6579–6584. [Google Scholar] [CrossRef] [PubMed]
- Tisler, T.; Zagorc-Koncan, J.; Cotman, M.; Drolc, A. Toxicity potential of disinfection agent in tannery wastewater. Water Res. 2004, 38, 3503–3510. [Google Scholar] [CrossRef] [PubMed]
- APAT-CNR-IRSA. Metodi Analitici per le Acque. Manuali e Linee Guida; 2003. Available online: http://www.isprambiente.gov.it/it/pubblicazioni/manuali-e-linee-guida/metodi-analitici-per-le-acque (accessed on 10 July 2017).
- Qualità Dell’acqua—Determinazione Dell’azoto Totale. 1992. Available online: http://www.unichim.it/index.php?n=Pubblicazioni.MetodiAcque (accessed on 10 July 2017).
- Qualità Dell’acqua—Determinazione Dell’azoto Ammoniacale in Acque di Diversa Natura Mediante Prova in Cuvette. UNICHIM 2363/2009. 2017. Available online: http://www.unichim.it/index.php?n=Pubblicazioni.MetodiAcque (accessed on 10 July 2017).
- Qualità Dell’acqua—Determinazione del Fosfato Solubile e del Fosforo Totale; International Organization for Standardization: Geneva, Switzerland, 2008; Available online: http://www.unichim.it/index.php?n=Pubblicazioni.MetodiAcque (accessed on 10 July 2017).
- Hach 10070 Pillows Powder. Available online: https://www.hach.com/dpd-total-chlorine-reagent-powder-pillows-25-ml-pk-100/product-downloads?id=7640188396 (accessed on 10 July 2017).
- Water Quality—Test for Inhibition of Oxygen Consumption by Activated Sludge for Carbonaceous and Ammonium Oxidation; International Organization for Standardization: Geneva, Switzerland, 2007; Available online: https://www.iso.org/standard/37369.html (accessed on 10 July 2017).
- Water Quality—Enumeration of Escherichia coli and Coliform Bacteria; International Organization for Standardization: Geneva, Switzerland, 2012; Available online: https://www.iso.org/standard/52246.html (accessed on 10 July 2017).
- Water Quality—Determination of the Inhibition of the Mobility of Daphnia Magna Straus (Cladocera, Crustacea). Acute Toxicity Test; International Organization for Standardization: Geneva, Switzerland, 2013; Available online: https://www.iso.org/standard/54614.html (accessed on 10 July 2017).
- Water Quality—Determination of the Inhibitory Effect of Water Samples on the Light Emission of Vibrio Fischeri (Luminescent bacteria Test)—Part 3: Method Using Freeze-Dried Bacteria; International Organization for Standardization: Geneva, Switzerland, 2009; Available online: https://www.iso.org/standard/40518.html (accessed on 10 July 2017).
- Water Quality—Fresh Water Algal Growth Inhibition Test with Unicellular Green Algae; International Organization for Standardization: Geneva, Switzerland, 2012; Available online: https://www.iso.org/standard/54150.html (accessed on 10 July 2017).
- Lombardy Regional Regulation No. 3/2006. Available online: http://www.atocittametropolitanadimilano.it/documenti/Regolamenti%20Regionali%2028%20marzo%202006.pdf (accessed on 10 July 2017).
- Aragno, M.; Cometto, P.; Beccaria, T.; Ghigo, M.; Vincenzi, M. Batterie di saggi ecotossicologici: Sintesi e prospettive dopo 13 anni di controlli ambientali in provincia di Cuneo. Atti 6° Edizione Giornate di Studio. 2014, pp. 147–151. Available online: http://www.artaabruzzo.it/download/pubblicazioni/20170523_atti_ecotossicologia_livorno_2016.pdf (accessed on 21 September 2017).
- Arizzi Novelli, A.; Melchiorri, M.; Mastrangioli, L.; Di Deo, N.; Sergiacomo, G.; Scamosci, E.; Surricchio, G.; Spatola Mayo, C. Valutazione degli effetti della disinfezione con acido peracetico sulle acque di scarico urbane. In Atti Delle Giornate di Studio su: L’ecotossicologia Come Strumento di Gestione; ISPRA: Livorno, Italy, 2016. [Google Scholar]
- Petala, M.; Samaras, P.; Zouboulis, A.; Koungolos, A.; Sakellaropoulos, G.P. Influence of ozonation on the in vitro mutagenic and toxic potential of secondary effluents. Water Res. 2008, 42, 4929–4940. [Google Scholar] [CrossRef] [PubMed]
- Zouboulis, A.; Samaras, P.; Ntampou, X.; Petala, M. Potential ozone applications for water/wastewater treatment. Sep. Sci. Technol. 2007, 42, 1433–1466. [Google Scholar] [CrossRef]
- Li, Y.; Zhang, X.; Yang, M.; Liu, J.; Li, W.; Graham, N.J.D.; Li, X.; Yang, B. Three-step effluent chlorination increases disinfection efficiency and reduces DBP formation and toxicity. Chemosphere 2017, 168, 1302–1308. [Google Scholar] [CrossRef] [PubMed]
- Li, Y.; Yang, M.; Zhang, X.; Jiang, J.; Liu, J.; Yau, C.F.; Graham, N.J.D.; Li, X. Two-step chlorination: A new approach to disinfection of a primary sewage effluent. Water Res. 2017, 108, 339–347. [Google Scholar] [CrossRef] [PubMed]
- Young, J.C. Waste strength and water pollution parameters. In Water Analysis—Organic Species; Minear, R.A., Keith, L.H., Eds.; Academic Press Inc.: Cambridge, MA, USA, 1984; ISBN 9780124983038. [Google Scholar]
Figure 1.
Jar test.

Figure 2.
Free and total residual chlorine.
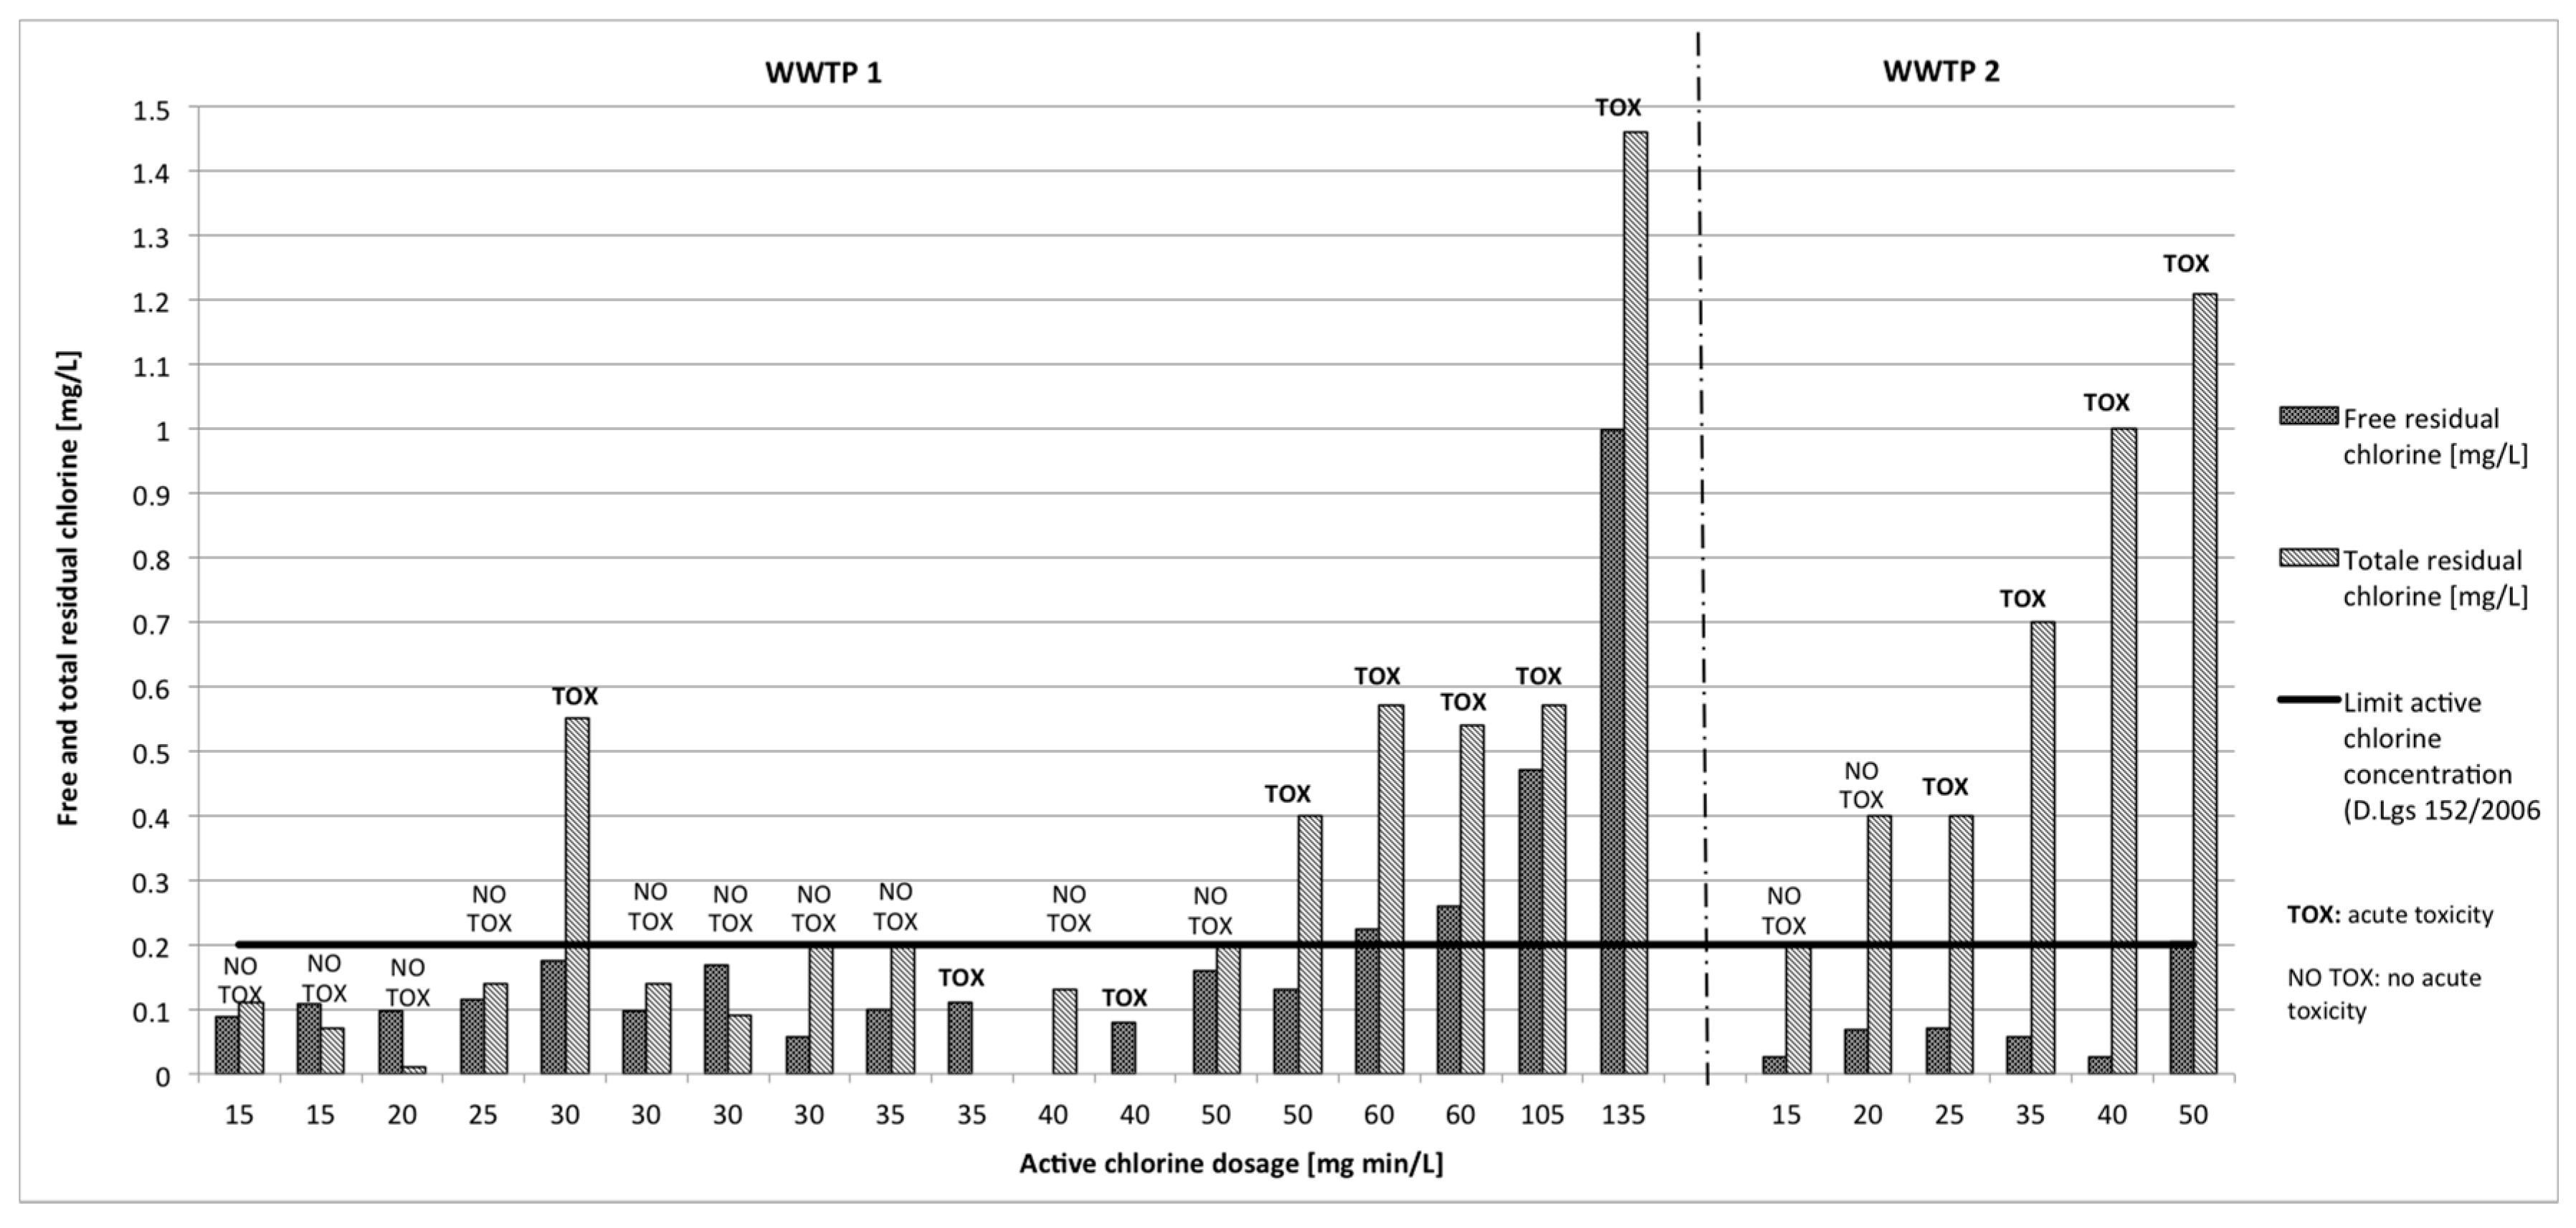
Figure 3.
Residual peracetic acid (PAA).
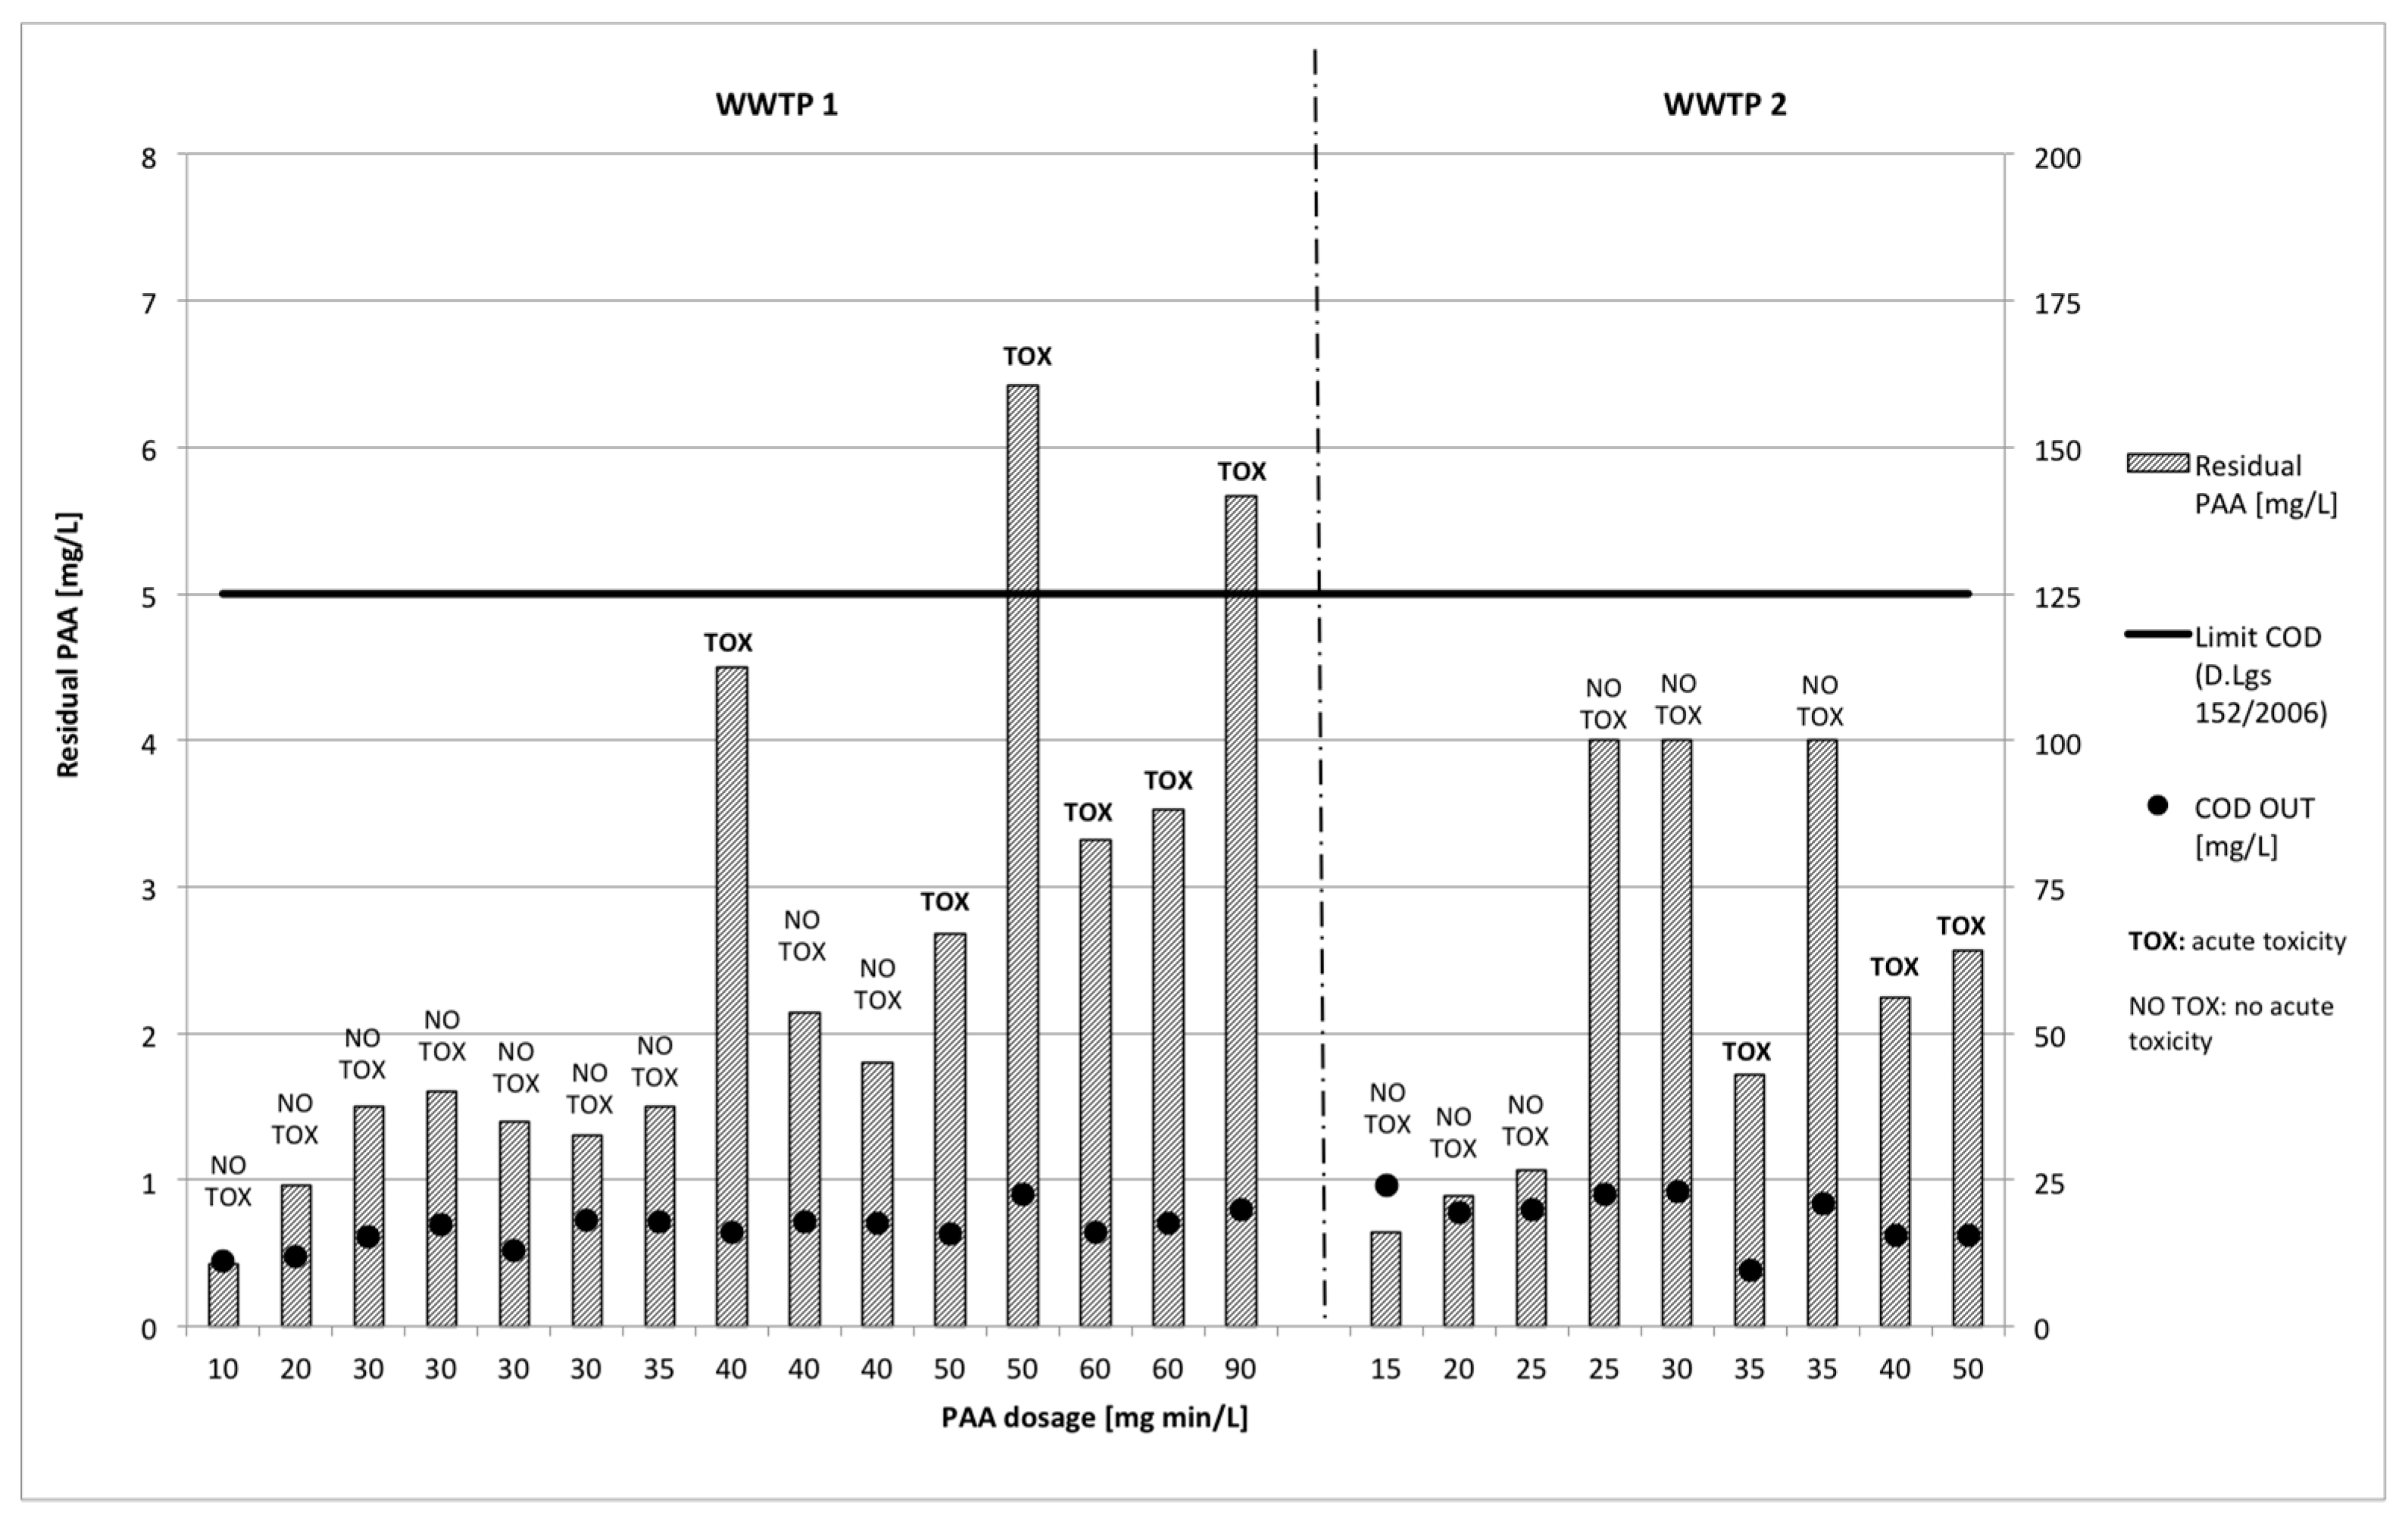
Figure 4.
Results of oxygen uptake rate (OUR) tests: effects of free residual chlorine (a) and residual PAA (b).
Figure 4.
Results of oxygen uptake rate (OUR) tests: effects of free residual chlorine (a) and residual PAA (b).


Table 1.
Characteristics of the wastewater treatment plants (WWTPs) analyzed.
| Type of Treatment |  | ||
|---|---|---|---|
| WWTP 1 | WWTP 2 | ||
| Capacity (Population Equivalent) | 12,000 | 10,000 | |
| Influent | Flow rate (m3 d−1) | 2980 | 2000 |
| COD (mg L−1) | 260 ± 158 | 433 ± 508.5 | |
| BOD5 (mg L−1) | 119 ± 90 | 199 ± 167.6 | |
| TN (mg L−1) | 35 ± 25 | 51 ± 43.6 | |
| TP (mg L−1) | 4 ± 5.7 | 6 ± 8.3 | |
| TSS (mg L−1) | 170 ± 230.3 | 243 ± 468.6 | |
| E. coli (CFU 100 mL−1) | 4800 ÷ 26,000 | 4500 ÷ 7600 | |
Legend: PT = pretreatment (screening and grit/grease removal), DEN = biological denitrification, OX-NIT = biological oxidation-nitrification S II = secondary sedimentation, D (NaClO) = disinfection with NaClO (emergency). TN = Total Nitrogen; TP = Total Phosphorus.
Table 2.
Experimental program and analysis/tests carried out in the research.
| Type of Disinfectant Agents | Dosage of Disinfectant (mg min L−1) | Contact Time (min) | Analysis/Tests | |||||
|---|---|---|---|---|---|---|---|---|
| Parameters Measured on Site | Physical-Chemical Analysis | Microbiological Analysis | Ecotoxicological Tests | Respirometric Tests | ||||
| WWTP 1 | NaClO | 15 ÷ 135 | 30 | Free and total residual chlorine; pH | COD, BOD5, TSS, TN, N-NH4+, N-NO3−, N-NO2−, TP | E. coli | Daphnia magna, Vibrio fischeri, Pseudokirchneriella subcapitata | endogenous OUR; exogenous OUR |
| CH3CO3H | 10 ÷ 90 | 30 | residual PAA; pH | |||||
| WWTP 2 | NaClO | 15 ÷ 50 | 30 | Free and total residual chlorine; pH | COD, BOD5, TSS, TN, N-NH4+, N-NO3−, N-NO2−, TP | E. coli | Daphnia magna, Vibrio fischeri, Pseudokirchneriella subcapitata | endogenous OUR; exogenous OUR |
| CH3CO3H | 15 ÷ 50 | 30 | residual PAA; pH | |||||
Table 3.
Concentration of pollutants in the influent and effluent of WWTPs.
| COD (mg L−1) | BOD5 (mg L−1) | SST (mg L−1) | TN (mg L−1) | N-NH4+ (mg L−1) | N-NO3− (mg L−1) | N-NO2− (mg L−1) | TP (mg L−1) | ||||
|---|---|---|---|---|---|---|---|---|---|---|---|
| WWTP 1 | DAY #1 | IN WWTP | 381 | 203 | 196 | 45.7 | 36.0 | 1.2 | 0.75 | 5.6 | |
| IN test | 13.4 | <5 | 5 | 10.9 | <0.2 | 11 | 0.04 | 1 | |||
| OUT | NaClO | 13.4 ÷ 14 | <5 | 5 ÷ 6 | 10.9 ÷ 11.1 | <0.2 | 11 ÷ 11.3 | 0.04 ÷ 0.05 | 1 ÷ 1.1 | ||
| PAA | 15.2 ÷ 19.9 | <5 ÷ 7.6 | <5 | 11.2 ÷11.6 | <0.1 ÷ 0.1 | 11.4 ÷ 12.3 | 0.04 ÷ 0.09 | 1 ÷ 1.1 | |||
| DAY #2 | IN WWTP | 270 | 142 | 150 | 40.9 | 35.0 | 1.0 | 0.67 | 4.8 | ||
| IN test | 13.9 | <5 | 5 | 10.8 | 0.1 | 8.6 | <0.01 | 1 | |||
| OUT | NaClO | 13.9 ÷ 14.7 | <5 | 5 ÷ 5.2 | 10.8 ÷ 10.9 | 0.1 ÷ 0.2 | 8.6 ÷ 8.8 | <0.01 | 1 ÷ 1.1 | ||
| PAA | 15.8 ÷ 17.5 | <5 ÷ 7.6 | 5 ÷ 5.1 | 10.8 ÷ 11.2 | 0.1 ÷ 0.2 | 8.6 ÷ 9.2 | <0.01 ÷ 0.01 | 1 ÷ 1.2 | |||
| DAY #3 | IN WWTP | 290 | 117 | 138 | 21.9 | 11.8 | 1.5 | 0.53 | 21.9 | ||
| IN test | 15.7 | 11.5 | <5 | 10.5 | 0.11 | 9.8 | 0.06 | 1.3 | |||
| OUT | NaClO | 15.7 ÷ 16.3 | 11.5 ÷ 12 | <5 | 10.5 ÷ 10.6 | 0.11 ÷ 0.13 | 9.8 ÷ 9.9 | 0.06 ÷ 0.07 | 1.3 ÷ 1.4 | ||
| PAA | 17.3 ÷ 22.4 | 12 ÷ 15.3 | <5 | 10.4 ÷ 10.6 | 0.14 ÷ 0.15 | 10 ÷ 10.5 | 0.05 ÷ 0.07 | 1.3 ÷ 1.4 | |||
| DAY #4 | IN WWTP | 69 | 29 | 54 | 17.3 | 2.7 | 1 | 0.67 | 2.4 | ||
| IN test | 12 | 14 | <5 | 12.7 | <0.1 | 12.6 | 0.04 | 0.7 | |||
| OUT | NaClO | 12 ÷ 12.2 | 14 ÷ 14.6 | <5 | 12.7 ÷ 12.9 | <0.1 | 12.6 ÷ 12.7 | 0.04 ÷ 0.05 | 0.7 ÷ 0.8 | ||
| PAA | 11 ÷ 13 | 15 ÷ 19 | <5 | 12.3 ÷ 13.5 | <0.1 | 12.6 ÷ 13.1 | 0.03 ÷ 0.04 | 0.7 ÷ 0.9 | |||
| DAY #5 | IN WWTP | 266 | 148 | 216 | 41.3 | 34 | 1.1 | 0.55 | 4.4 | ||
| IN test | 22.6 | 13.1 | 6 | 15 | <0.1 | 14.9 | 0.03 | 1.2 | |||
| OUT | NaClO | 22.6 ÷ 22.7 | 13.1 ÷ 14 | 6 ÷ 6.1 | 15 ÷ 15.1 | <0.1 | 14.9 ÷ 15.1 | 0.03 ÷ 0.04 | 1.2 ÷ 1.3 | ||
| PAA | 17.5 ÷ 18.1 | 18.6 ÷ 20.8 | <5 ÷ 5 | 14.9 ÷ 15 | <0.1 | 14.7 ÷ 14.9 | 0.02 ÷ 0.05 | 1.2 ÷ 1.3 | |||
| DAY #6 | IN WWTP | 172 | 79 | 60 | 32 | 29 | 1.2 | 0.76 | 3.2 | ||
| IN test | 31.4 | 14.1 | 13 | 13.8 | 1.8 | 11.6 | 0.4 | 1.3 | |||
| OUT | NaClO | 31.4 ÷ 32 | 14.1 ÷ 14.7 | 13 ÷ 13.1 | 13.8 ÷ 13.9 | 1.8 ÷ 1.9 | 11.6 ÷ 11.8 | 0.40 ÷ 0.41 | 1.3 ÷ 1.5 | ||
| PAA | 30.4 ÷ 33 | 15.8 ÷ 18 | 12 ÷ 13 | 13.9 ÷ 14.7 | 1.8 ÷ 2.1 | 11.3 ÷ 11.5 | 0.35 ÷ 0.36 | 1.3 ÷ 1.6 | |||
| WWTP 2 | DAY #1 | IN WWTP | 304 | 153 | 156 | 33.4 | 32.8 | 0.98 | 0.15 | 3.6 | |
| IN test | 9.4 | <5 | <5 | 2 | <0.2 | 1.8 | n.a. | 0.3 | |||
| OUT | NaClO | 9.4 ÷ 9.6 | <5 | <5 | 2 ÷ 2.3 | <0.2 | 1.8 ÷ 2 | n.a. | 0.3 ÷ 0.5 | ||
| PAA | 9.6 ÷ 15.6 | <5 | <5 | 2.3 ÷ 3.8 | <0.1 | 2.2 ÷ 2.3 | n.a. | 0.3 ÷ 0.6 | |||
| DAY #2 | IN WWTP | 413 | 155 | 152 | 39.3 | 37.5 | 1.09 | 0.18 | 4.5 | ||
| IN test | 25.2 | 8.2 | 12 | 5.4 | <0.1 | 4.2 | 0.08 | 0.7 | |||
| OUT | NaClO | 25.2 ÷ 25.4 | 8.2 ÷ 8.3 | 12 ÷ 12.3 | 5.4 ÷ 5.5 | <0.1 | 4.2 ÷ 4.3 | 0.08 ÷ 0.09 | 0.7 ÷ 0.8 | ||
| PAA | 25 ÷ 35 | 6 ÷ 6.5 | 8 ÷ 10 | 5.3 ÷ 5.4 | <0.1 ÷ 0.1 | 4.4 ÷ 4.5 | 0.08 ÷ 0.09 | 0.6 ÷ 0.7 | |||
| DAY #3 | IN WWTP | 452 | 251 | 280 | 44.6 | 38.2 | 1.1 | 0.21 | 5.9 | ||
| IN test | 20.1 | <5 | 5 | 3.9 | <0.1 | 2.7 | 0.01 | 0.3 | |||
| OUT | NaClO | 20.1 ÷ 20.4 | <5 | 5 ÷ 5.6 | 3.9 ÷ 4.1 | <0.1 | 2.7 ÷ 2.8 | 0.01 ÷ 0.02 | 0.3 ÷ 0.4 | ||
| PAA | 19.5 ÷ 24 | <5 | 5 ÷ 6 | 3.3 ÷ 3.8 | <0.1 | 2.8 ÷ 2.9 | 0.01 ÷ 0.03 | 0.3 ÷ 0.4 | |||
| Limit values (mg L−1) | 125 | 25 | 35 | 15 | - | - | - | 2 | |||
IN WWTP: concentrations of pollutants measured in the influent wastewater to WWTP. IN test: concentrations of pollutants measured in the effluent of WWTP before the disinfection unit. OUT NaClO: concentrations of pollutants measured in the samples after the disinfection tests with NaClO. OUT PAA: concentrations of pollutants measured in the samples after the disinfection tests with PAA.
Table 4.
Acute toxicity assessment with active chlorine.
| Active Chlorine Dosage (mg min L−1) | Free Residual Chlorine (mg L−1) | Acute Toxicity | E. coli (CFU 100 mL−1) | Conformity | |||||
|---|---|---|---|---|---|---|---|---|---|
| Daphnia magna 24 h | Vibrio fischeri | P. subcapitata 72 h | IN | OUT | |||||
| 15 min | 30 min | ||||||||
| WWTP 1 | 60 | 0.26 | 100/100 | 81/100 | 81/100 | 27/100 | 4800 | 5 | NO |
| 105 | 0.47 | 0/100 | 88/100 | 88/100 | 37/100 | 4800 | <1 | NO | |
| 135 | 0.998 | 0/100 | 87/100 | 87/100 | 59/100 | 4800 | <1 | NO | |
| 15 | 0.088 | 0/100 | 0/100 | 0/100 | 0/100 | 7000 | 5400 | NO | |
| 30 | 0.175 | 90/100 | 83/100 | 82/100 | 90/100 | 7000 | <1 | NO | |
| 60 | 0.224 | 100/100 | 82/100 | 82/100 | 100/100 | 7000 | <1 | NO | |
| 15 | 0.109 | 0/100 | 0/100 | 1/100 | 5/100 | 26,000 | 21,000 | NO | |
| 25 | 0.114 | 0/100 | 23/100 | 31/100 | 1/100 | 26,000 | 9500 | NO | |
| 30 | 0.096 | 0/100 | 18/100 | 25/100 | 8/100 | 26,000 | 9300 | NO | |
| 20 | 0.097 | 5/100 | 0/100 | 5/100 | 1/100 | 8100 | 3800 | YES | |
| 30 | 0.169 | 0/100 | 0/100 | 5/100 | 3/100 | 8100 | 320 | YES | |
| 40 | 0.129 | 45/100 | 9/100 | 13/100 | 16/100 | 8100 | 74 | YES | |
| 30 | 0.058 | 0/100 | 11/100 | 16/100 | 2/100 | 6100 | 3700 | YES | |
| 35 | 0.1 | 0/100 | 14/100 | 20/100 | 1/100 | 6100 | 290 | YES | |
| 50 | 0.13 | 0/100 | 40/100 | 42/100 | 3/100 | 6100 | 17 | YES | |
| WWTP 2 | 35 | 0.057 | 0/100 | 80/100 | 78/100 | 70/100 | 7100 | 58 | NO |
| 40 | 0.05 | 0/100 | 86/100 | 88/100 | 47/100 | 7100 | 37 | NO | |
| 50 | 0.203 | 100/100 | 91/100 | 93/100 | 65/100 | 7100 | 21 | NO | |
| 25 | n.a. | 100/100 | 91/100 | 93/100 | 65/100 | 4500 | 38 | NO | |
| 30 | n.a. | 100/100 | 0/100 | 5/100 | 8/100 | 4500 | 33 | NO | |
| 35 | n.a. | 100/100 | 8/100 | 6/100 | 1/100 | 4500 | 36 | NO | |
| 15 | 0.05 | 5/100 | 0/100 | 0/100 | 4/100 | 7600 | 5000 | YES | |
| 20 | 0.069 | 0/100 | 31/100 | 25/100 | 0/100 | 7600 | 100 | YES | |
| 25 | 0.07 | 0/100 | 6/100 | 6/100 | 0/100 | 7600 | 230 | YES | |
Table 5.
Acute toxicity assessment with PAA dosage.
| PAA Dosage (mg min L−1) | Residual PAA (mg L−1) | Acute toxicity | E. coli (CFU 100 mL−1) | Conformity | |||||
|---|---|---|---|---|---|---|---|---|---|
| Daphnia magna 24 h | Vibrio fischeri | P. subcapitata 72 h | IN | OUT | |||||
| 15 min | 30 min | ||||||||
| WWTP 1 | 30 | 1.50 | 0/100 | 13/100 | 5/100 | 5/100 | 4800 | 1 | YES |
| 60 | 3.32 | 100/100 | 100/100 | 96/100 | 100/100 | 4800 | <1 | NO | |
| 90 | 5.67 | 100/100 | 100/100 | 100/100 | 54/100 | 4800 | <1 | NO | |
| 40 | 4.49 | 100/100 | 99/100 | 99/100 | 100/100 | 7000 | <1 | NO | |
| 50 | 2.68 | 20/100 | 71/100 | 37/100 | 20/100 | 7000 | <1 | NO | |
| 60 | 3.53 | 100/100 | 100/100 | 96/100 | 100/100 | 7000 | <1 | NO | |
| 30 | 1.61 | 0/100 | 13/100 | 20/100 | 6/100 | 26,000 | 38 | YES | |
| 40 | 2.14 | 0/100 | 5/100 | 10/100 | 4/100 | 26,000 | 29 | YES | |
| 50 | 6.42 | 100/100 | 86/100 | 51/100 | 73/100 | 26,000 | 8 | NO | |
| 20 | 0.43 | 0/100 | 0/100 | 0/100 | 0/100 | 8100 | 5000 | YES | |
| 30 | 0.96 | 0/100 | 0/100 | 3/100 | 0/100 | 8100 | 180 | YES | |
| 40 | 1.39 | 0/100 | 23/100 | 16/100 | 3/100 | 8100 | 15 | YES | |
| 30 | 1.30 | 0/100 | 19/100 | 13/100 | 0/100 | 6100 | 16 | YES | |
| 35 | 1.50 | 0/100 | 33/100 | 22/100 | 1/100 | 6100 | 45 | YES | |
| 40 | 1.80 | 0/100 | 45/100 | 32/100 | 3/100 | 6100 | 110 | YES | |
| WWTP 2 | 35 | 1.71 | 5/100 | 82/100 | 44/100 | 1/100 | 7100 | 50 | NO |
| 40 | 2.25 | 5/100 | 100/100 | 80/100 | 1/100 | 7100 | 22 | NO | |
| 50 | 2.57 | 0/100 | 100/100 | 94/100 | 1/100 | 7100 | 37 | NO | |
| 25 | 4.00 | 0/100 | 0/100 | 0/100 | 0/100 | 4500 | 75 | YES | |
| 30 | 4.00 | 0/100 | 0/100 | 0/100 | 0/100 | 4500 | 54 | YES | |
| 35 | 4.00 | 0/100 | 0/100 | 0/100 | 0/100 | 4500 | 21 | YES | |
| 15 | 0.64 | 0/100 | 0/100 | 0/100 | 0/100 | 7600 | 7500 | NO | |
| 20 | 0.07 | 0/100 | 0/100 | 0/100 | 0/100 | 7600 | 3800 | YES | |
| 25 | 0.08 | 0/100 | 3/100 | 0/100 | 1/100 | 7600 | 2600 | YES | |
© 2017 by the authors. Licensee MDPI, Basel, Switzerland. This article is an open access article distributed under the terms and conditions of the Creative Commons Attribution (CC BY) license (http://creativecommons.org/licenses/by/4.0/).
Share and Cite
MDPI and ACS Style
Collivignarelli, M.C.; Abbà, A.; Alloisio, G.; Gozio, E.; Benigna, I. Disinfection in Wastewater Treatment Plants: Evaluation of Effectiveness and Acute Toxicity Effects. Sustainability 2017, 9, 1704. https://doi.org/10.3390/su9101704
AMA Style
Collivignarelli MC, Abbà A, Alloisio G, Gozio E, Benigna I. Disinfection in Wastewater Treatment Plants: Evaluation of Effectiveness and Acute Toxicity Effects. Sustainability. 2017; 9(10):1704. https://doi.org/10.3390/su9101704
Chicago/Turabian StyleCollivignarelli, Maria Cristina, Alessandro Abbà, Gianpaolo Alloisio, Eleonora Gozio, and Ilaria Benigna. 2017. "Disinfection in Wastewater Treatment Plants: Evaluation of Effectiveness and Acute Toxicity Effects" Sustainability 9, no. 10: 1704. https://doi.org/10.3390/su9101704
Note that from the first issue of 2016, this journal uses article numbers instead of page numbers. See further details here.