Urban Food Systems Strategies: A Promising Tool for Implementing the SDGs in Practice † †


Urban Systems Lab, The New School, New York, NY 10003, USA
†
An earlier version of this paper was presented at the Fourth International Conference on Sustainable Development (ICSD), Columbia University, New York, NY, USA, 21–22 September 2016.
Sustainability 2017, 9(10), 1707; https://doi.org/10.3390/su9101707
Submission received: 19 July 2017
/
Revised: 18 September 2017
/
Accepted: 19 September 2017
/
Published: 23 September 2017
(This article belongs to the Special Issue Implementation of the Sustainable Development Goals (SDGs))
Abstract
:The UN’s 2030 Agenda for Sustainable Development, and the transition from Millennium Development Goals (MDGs) to Sustainable Development Goals (SDGs), heralds an important turn in global sustainability policy. With implementation now taking place in all countries, regardless of GDP, a key question is how affluent governments in large metropolitan areas can effectively contribute to global sustainable development. This paper argues that urban food systems strategies—a relatively new tool in local policymaking in the Global North—have the potential to amplify and consolidate national and international efforts in this direction and facilitate a more synergistic approach to SDG implementation. An in-depth comparative analysis of the 2030 Agenda and the sustainable food systems strategies of five of the ten largest cities in North America—New York, Philadelphia, Los Angeles, Chicago, and Toronto—helps to uncover key gaps and areas of convergence between goals, objectives, and evaluation frameworks. Goal- and indicator-level analyses cast light on promising areas for cross-jurisdictional cooperation and suggest that, while not without limitations, urban food systems strategies offer manifold pathways to streamline global, national, and local implementation efforts and effectively forward the 2030 Agenda over the next decade.
1. Introduction
Since the turn of the century, more than 90 urban and regional sustainable food system plans and strategies have been devised by local administrations in the Global North alone (Figure 1). On 15 October 2015 the Milan Urban Food Policy Pact, signed by more than 100 cities all over the world, set a precedent and laid the groundwork for the first global urban food policy agenda. For the first time in more than a century, industrialized cities are taking the lead in food policy and seeking to re-envision food as an urban system whose sustainability is tightly intertwined with the sustainability of all other basic urban infrastructures—from transportation, to housing, water and waste management. The development of healthy, fair, and environmentally sound urban food systems is now increasingly recognized as a matter of local policy as much as the responsibility of national and international government institutions. As the political and societal salience of sustainable food policies at the local level continues to grow, a key question for those of us interested in advancing the 2030 Agenda for Sustainable Development is to what extent urban food systems strategies (UFSS) can bring about the implementation of the new Sustainable Development Goals (SDGs).
While research on the role of cities in transitioning their foodsheds to sustainability has significantly expanded over the past decade [1,2,3,4,5], the potential synergies between this new generation of urban food policies and the SDGs have received limited attention. This is a critical omission, because a clearer view of the current and potential areas for shared action can help tap into new opportunities for the implementation of the 2030 Agenda, while also increasing the credibility of UFSS, typically tied to electoral cycles and short-term political agendas.
This paper seeks to address the paucity of research in this domain by examining UFSS, their implementation tools, and the SDGs in tandem. The analysis focuses on the UFSS advanced by five of the ten largest North American cities—New York, Philadelphia, Los Angeles, Chicago, and Toronto—and assesses them against the 17 SDGs adopted by the General Assembly of the UN on 25 September 2015. A systematic comparative approach helps cast a new light on the key points of convergence and divergence between the SDGs and the sustainable food systems goals and metrics put forward by local administrations. Further, the exploration of the SDGs through the lens of UFSS helps appreciate their interconnectedness and offers entry points for a more systemic approach to the implementation of the 2030 Agenda.
A research focus on food systems is, in fact, instructive for ongoing debates on the interconnectedness between the SDGs and the shortcomings and promises of their means of implementation. Sustainable development scholars have hitherto effectively highlighted the importance of appraising and building on the co-dependency of the SDGs both through comprehensive assessments [6,7] and focused explorations of air pollution [8], health [9], education [10], sustainable consumption and production [11], and culture [12]. Food, along with other cross-sectoral systems, are considered as a more meaningful frame of reference for the SDGs [13], than the traditional social, environmental, and economic pillars of sustainable development.
Critical observers, however, worry that, with few exceptions [14,15], the interdependency between the SDGs is still poorly operationalized and, without clear and measurable indicators, the 169 targets of the 2030 Agenda risk being too vague and inconsequential. As a whole, the successful implementation of the SDGs is deemed to be contingent upon science-based [13,16,17,18] and time-sensitive [19] metrics and a social-ecological systems approach [20] to sustainability planning. While neither goal-setting nor technocratic measurement alone are a guaranty for success—and a deeper ethical foundation must be laid at the outset of sustainability governance and planning [21,22,23]. A shared dashboard of SDG indicators can go a long way in catalyzing action (and debate) within and across countries. It is the hope of this paper to further this debate and place the limelight on potential synergies between the SDGs and ongoing implementation endeavors in the domain of city-regional food systems policy and planning.
The remaining part of the paper is structured as follows. Section 2 briefly introduces the notion of UFSS and provides a synthetic summary of the rationale, limitations, and policy impacts of these tools so far. Section 3 spells out the research methods and data sources used to explore the alignments and potential synergies between UFSS and the 2030 Agenda. Section 4 summarizes the results of the comparative analysis and leads into Section 5, where UFSS are examined against the new global indicator framework for the SDGs. The remaining part of Section 5 and Section 6 sum up key implications of this research for policymakers and scholars interested in advancing global sustainability through the achievement of healthy, equitable, and sustainable urban food systems.
2. Urban Food Systems Strategies
While the number of local food systems plans and strategies has steadily grown over the past decade, the domain of urban food policy is still in its infancy and there is no single definition of what constitutes an urban food systems strategy. Generally, urban food systems strategies (UFSS) seek to offer a holistic assessment of the local foodshed—from farm to fork to waste management—and provide an integrated policy framework linking existing and recommended programs, institutions, and courses of action. Put simply, an urban food system strategy provides a snapshot of the current food system and a roadmap for how to improve it through leadership at the local level. UFSS typically revolve around place-based agri-food governance networks and catalyze new synergies between local authorities, civil society, and the private sector [24], and the intermediary institutions in between.
Unlike land-use plans or zoning codes, UFSS are seldom legally-binding. They could, however, spur change in local legislation through legislative provisions such as local laws on organic waste disposal [25,26,27], planning advice notes for future urban development [28], mayoral executive directives [29], zoning code amendments [30,31,32], fast-food retail bans [33], and local food metrics bills [34,35], among others. The process through which a food strategy or plan is developed and implemented is loosely codified and can significantly vary from place to place. In fact, the development of an UFSS may be steered by a task force of lead experts and extensive public consultations [36], a food policy council [37], an interdepartmental team [38] within municipal government, an advisory food policy council operating outside formal government structures [39,40], or a regional planning authority [41,42].
The impetus and justification for an UFSS, largely depends on its institutional home as well as its geographical context. Public health and local economic development concerns are a common thread across North American and Western European UFSS, whereas urban sprawl and the protection of artisanal and regional food products and landscapes are most frequently drivers for UFSS in Mediterranean countries. Implementing a long-term UFSS can be challenging, since both the policies and the staff working on their implementation are susceptible to shifts in political leadership and uncertain legal and financial resources. The lack of adequate monitoring mechanisms can be a further obstacle to the execution of otherwise ambitious local food sustainability agendas.
In recent years, some cities have taken up the challenge of measuring progress toward UFSS goals and objectives and begun to compile inventories of sustainable food system measures and indicators to support implementation. The equipment of UFSS with monitoring frameworks and mechanisms thus presents a novel opportunity to bridge global and local sustainable development efforts and reap the benefits of potential cross-scale partnerships. In the context of the 2030 Agenda, SDG 2—focusing on food security, nutrition, and sustainable agriculture, would be the obvious place to start, but, as it will be argued throughout the remainder of the paper, there is a much broader range of opportunities for an integrated approach to implementation of global and local sustainability policies within and beyond the urban food system.
3. Methods
The research conducted for this paper consisted of the systematic review and comparative analysis of the SDGs of the 2030 Agenda and the UFSS of New York, Philadelphia, Los Angeles, Chicago, and Toronto. The comparison aided the identification of gaps and areas of convergence between the UFSS and the 2030 Agenda goals, targets, and indicators.
3.1. Cities Selection
To be selected for the review, a strategy had to be authored by one of the ten largest metropolises in North America and to have informed (or be linked to) the long-term comprehensive plans for sustainable development adopted by those administrations. The implications of a city’s social, ecological, and economic systems for sustainable development were also part of the inclusion criteria used in the study.
When considered together, New York, Philadelphia, Los Angeles, Chicago, and Toronto are home to over 54 million inhabitants [43,44]—a population larger than Canada and the Netherlands combined, and thus even a small change at the margins of their economies can be consequential for achieving the SDGs writ large. In addition, the financial resources that each of these urban regions can mobilize, make them resourceful entry points for local-global cooperation. In 2014, the GDP generated in each of the five metro areas exceeded $300 billion [45,46], with a combined GDP of $3.4 trillion, outpacing the UK for the same year [47]. The marked socioeconomic inequalities (SDG 10) manifesting in each of these urban areas were also part of the rationale for selecting them. More than 2 million people live in poverty (SDG 1) in Los Angeles and near 3 million in New York [48], many of which are also food insecure (SDG 2). At the same time, these urban areas are also witnessing an unprecedented public health epidemic (SDG 3)—between 50% and 60% of their residents are overweight or obese [49,50]. The disappearance of local farms (SDG 2)—between 30 and 50 farms going out of business every year [51,52], and the inefficient use of natural resources (SDG 12)—over 2.5 million tons/year of waste generated [53,54,55,56] (except for Toronto generating about 1 million tons/year [57]), are two other traits that these metropolitan areas share.
In addition to being sites of important social and environmental challenges, these cities are also at the forefront of addressing them and finding solutions. In fact, the local administrations in these urban regions have been among the first to overtly acknowledge that food poverty and malnutrition are an issue in North America and that it is the responsibility of local authorities to address them. Having already been subjected to extreme weather events—like Hurricane Sandy in New York (2012), the 2013 ice storm in Toronto, or the 2013–2014 drought in California—some of these cities are also making important inroads into climate action (SDG 13), through this is still insufficiently reflected in their UFSS.
3.2. Data Analysis
The systematic review was carried out using critical content analysis and coding techniques [58], which afforded a three-pronged assessment of the degree of alignment between the 2030 Agenda [59], the UFSS of the five cities, and their respective indicator frameworks.
The first level of assessment focused on the degree of alignment between UFSS goals and the SDGs. A 5 × 17 goal-level comparison matrix was used to gauge the extent to which an SDG was addressed in a UFSS (Table 1). Depending on the prominence of an SDG theme, the UFSS was assigned an overlap score from zero (the lowest) to three (the highest). If the SDG was present as an explicit goal or objective of the UFSS and was supported by at least two concrete action steps, the overlap score assigned was the highest. In contrast, if there was no explicit mention of the SDG in the UFSS, the overlap score assigned was the lowest (for a detailed list of the criteria used please see Table 1).
Next, to assess potential alignments between UFSS and the SDGs at the goal-indicator interface, each strategy was scanned for relevant metrics. If not included directly in the strategy, indicator data were retrieved through electronic searches for publicly available follow-up monitoring frameworks and assessment reports. Through coding and thematic analysis, the indicators were grouped into themes and linked to an SDG which they may help track at the local level (Table 2, Table 3, Table 4, Table 5, Table 6, Table 7, Table 8, Table 9, Table 10, Table 11, Table 12, Table 13, Table 14, Table 15, Table 16, Table 17 and Table 18). Government agencies’ acronyms and references to specific geographic locations were simplified and rendered in general terms to facilitate comprehension. References to the sources where the exact formulation of each indicator can be found are included in all table footnotes. Absolute number indicators, such as the number of watersheds supporting aquatic life (see Section 4.14) or the number of registered beekeepers (see Section 4.15), were reported as featured in their original sources, even if, in principle, ratio- and percentage-based indicators are more meaningful for tracking progress.
It should be also noted that, while many of the indicators are relevant for the implementation of more than one SDG, each indicator was cited only once in the interest of consistency, clarity, and brevity of reporting. For instance, the number of acres of farmland in organic production (see Section 4.2) is an indicator relevant for the pursuit of sustainable agriculture (SDG 2), responsible consumption and production (SDG 12), reduced chemical pollution in waterways (SDG 6), and increased biodiversity (SDG 15), among other goals. However, this indicator was presented only in relation to SDG 2. Some of the indicators included, such as the number of animals per farm or the acres of land in agricultural production, may seem exclusively economic in nature, however, they were included for their important implications for sustainability. For instance, in addition to tracking economic productivity, the number of animals per farm (see Section 4.2) can help detect potential threats to animal welfare and the prevalence of concentrated animal feeding operations (CAFOs), associated with higher risks for soil, water, and food contamination [60,61,62]. Similarly, tracking the land in production per type (see Section 4.15) is an economic indicator which can also shed light on the extent of monocrop agriculture systems which have often been associated with decreased biodiversity and topsoil erosion [63,64,65].
Finally, a target-level assessment was conducted to uncover potential synergies between UFFS indicators and the new global indicator framework [66] vis-à-vis each SDG target. Each UFSS indicator was thematically coded and linked to an SDG target (Table S1) and subsequently assessed against the newly-agreed SDG indicators. The results of this third layer of analysis were then plotted onto a synoptic goals-targets grid (Figure 2) which highlighted the areas of greatest indicator concentration holding a promise to inform an integrated approach to SDG implementation and lay the groundwork for a cross-scale monitoring agenda.
4. Results
The outcomes of the comparative analysis of the five urban food systems strategies (UFSS) suggest that these relatively novel tools in the mayoral policy toolbox could be a promising means for implementing the SDGs at the local level and point to untapped opportunities for building integrated monitoring mechanisms over the next decade. In fact, the goal-level analysis revealed a significant overlap between the SDGs and the urban food system goals set forth at the local level (see Table 1). The overlap is most pronounced in the SDGs focusing on hunger (SDG 2), public health (SDG 3), innovation and infrastructure (SDG 9), sustainable cities (SDG 11), and responsible consumption and production (SDG 12). Whereas SDG goals focusing on gender inequality (SDG 5), climate change (SDG 13), and the preservation of marine ecosystems (SDG 14) exhibit the least degree of overlap. This is not to say that these issues are extraneous to the urban food system, just the opposite, but it is indicative of their slow-paced institutionalization in policies and action plans for healthy, environmentally sound, and equitable urban foodsheds.
The overview of the UFSS goals and objectives, and their intersection with the SDGs, provides some cues into distinct strengths and weaknesses of each UFSS. For instance, Philadelphia’s food system plan outperforms other cities in the domain of fairness and justice (SDGs 10, 16) and the protection of aquatic life (SDG 14), whereas the food strategy of Los Angeles is the only one to consistently and explicitly refer to climate change (SDG 13) throughout its goals and objectives. Further, land conservation (SDG 15), is featured as a standalone goal only in the UFSS of Chicago, New York, and Philadelphia, while Toronto and Chicago treat it as a crosscutting objective. An UFSS-SDGs comparison is, however, much more instructive at the goal-level of analysis, due to at least two caveats. Not having a separate goal on an SDG topic may, for example, be symptomatic not of a weakness in this area, but of a strength already normalized in local governance culture. This is the case for Toronto, a city renowned for its food policy council and distinct strengths in coalition-building and cross-sectoral food system partnerships (SDG 17). Another caveat to consider is that follow-up monitoring instruments frequently include a much wider spectrum of food system issues than the plans and reports that precede them and, thus, may sway the strengths of a city from one SDG to another as the implementation process unfolds.
One crosscutting UFSS challenge which emerged from the analysis concerns the data sources and reporting frequency for each measure or indicator included in an UFSS or the SDG monitoring framework. UFSS indicator inventories typically combine government-based data from federal, state, county, and city-level sources with data from nongovernmental institutions like universities, nonprofit advocacy organizations, and private-sector research companies. As a result, depending on the reporting agency, new data may become available over five-year (e.g., NASS Census of Agriculture), biennial (e.g., California Department of Conservation Farmland Mapping and Monitoring Program), annual (e.g., American Community Survey), quarterly (e.g., Quarterly Workforce Indicators Data), or monthly (e.g., Public Health Foundation Enterprise WIC Program) time periods. Indicators relying on data collection by nongovernmental evaluation entities and even some government ones (e.g., USDA ERS Food Environment Atlas) reporting cycles may be irregular or unknown. These inconsistencies can hamper a systemic understanding of what works and why but, as discussed in the remainder of this section, also point to key areas for joint cross-scale action which can be harnessed by local and national institutions to overcome them.
4.1. SDG 1: End Poverty in All Its Forms Everywhere
Poverty is a complex problem which requires the concerted action of multiple government sectors, from economic development to education, environmental policy, and public health [70,71]. With its intrinsic multi-sectoral nature, food can serve as a powerful connector that binds the flawed “tunnel” visions in current policy to develop systemic anti-poverty strategies. Many of the anti-poverty avenues that food uniquely can open are highlighted in local food systems plans and policies as part of the other SDGs discussed below. Yet, some local administrations do recognize the fact that no urban food system can be sustainable unless the root causes of food poverty [72] are addressed. Ensuring a stronger income security, increasing social assistance rates to reflect the cost of healthy eating, developing neighborhood partnerships to facilitate multiple pathways to employment, and leveraging the urban foodshed infrastructure to develop job and life skills are, for instance, some of the key policy areas which global cities, like Toronto, have called attention to in their sustainable food strategies.
Among the metrics and indicators to measure progress toward the implementation of these goals, advanced by New York, Philadelphia, Los Angeles, Chicago, and Toronto, are the mean salary by food sector job type, the percentage of food system workers using food assistance, the percent of students eligible for free lunch, the cost of food as a percentage of income, and the number of people trained in employment-related skills by urban farms and gardens (Table 2). Next to tracking how poverty manifests and it is addressed in the food system, cities are also recognizing the importance of including a subset of broader poverty indicators such as average hourly living wage for household with two adults and one child, percentage of population in poverty (100% Federal Poverty Level [FPL]) and in extreme poverty (50% FPL), number of TANF (Temporary Assistance for Needy Families) recipients, and cost of living index. Some cities, like Chicago, also emphasize the importance of including spatially explicit indicators of poverty like the concentration of areas of extreme high poverty and low assistance program enrollment and measure the accessibility to social assistance offices.
4.2. SDG 2: End Hunger, Improve Nutrition, and Promote Sustainable Agriculture
According to the Community Food Security Coalition, community food security is achieved when “all community residents obtain a safe, culturally acceptable, nutritionally adequate diet through a sustainable food system that maximizes community self-reliance and social justice” [76]. In fact, community food security is at the heart of urban food systems plans and cities have put forward policies and proposals that address both access to and quality of the urban foodscape. Among the strategies tackling economic access are policies aiming to increase of the amount, availability, and enrolment rates in national food assistance programs like the Supplemental Nutrition Assistance Program (SNAP) and the Special Supplemental Nutrition Program for Women, Infants and Children (WIC) in the US. Indicators advanced by cities to assess progress in this area are the rate of participation in federal food assistance programs (SNAP, WIC), the percentage of eligible population receiving SNAP benefits, the dollar amount of federal benefits lost due to underutilization, and the funds spent on SNAP enrolment by local agencies, among others (see Table 3).
The City of New York, for instance, invested over $1 million in expanding access to fresh food through the installation of electronic benefits transfer (EBT) equipment at mobile fruit vendors and farmers markets, to enable SNAP and WIC participants to use their cards at these outlets [36]. In Philadelphia, an interagency partnership helped to increase WIC farmers market vouchers from $20 to $80 for the 2010 season [41]. Proposed indicators here include the number of farmers markets equipped with EBT, the number of farmers markets accepting healthy food vouchers, and the number of healthy food vouchers issued per year (e.g., Senior Farmers Market Nutrition Program). Other strategies point to opportunities for leveraging the cash grants for emergency and anti-hunger operations available at the state level in the US, to increase the percentage of locally and nutritious food distributed to combat hunger at the local level. Soup kitchens are viewed as one emergency food setting where healthy, fresh food options ought to become more prevalent in the future. Cities are also strongly advocating for food secure school environments, by proposing policies to mandate free breakfasts in high-need schools, introduce salad bars in public schools citywide, and increase outreach and infrastructure for free summer meals programs. School food procurement contracts and policies are deemed an underused lever for healthy and sustainable urban and regional food systems.
Importantly, local administrations are beginning to make the case that to combat hunger, while improving public health through better nutrition, short food supply networks like CSAs (Community Supported Agriculture schemes) and farmers markets, need to transition from elite to widely accessible fresh food supply options. In addition to EBT and WIC initiatives, a growing number of cities, including the five cities examined in this paper, are starting to introduce economic incentives for spending SNAP benefits at farmers markets and other fruits and vegetables vendors. The Health Bucks in New York City and the Philly Food Bucks initiatives, for example, provide SNAP participants with free $2 coupons for every $5 spent at farmers markets, while the California Market Match program doubles SNAP dollars. Supporting the development of CSAs catering specifically to low-resource communities and encouraging regional gleaning programs, whereby fruits and vegetables surpluses are collected from periurban and regional farmers and distributed to food insecure families and individuals, are two additional strategies cities are putting forward to make alternative urban-rural linkages more socially equitable.
Physical access to healthy food venues is equally key to the achievement of food secure cities. Recent studies in North America have, in fact, revealed the uneven geography of food access and the existence of so-called “food deserts”—areas with severely impaired access to fresh fruits and vegetables [77,78], and “food swamps”—areas with high density of fast-food and unhealthy food outlets [79]. Through their food strategies and local land-use policies, cities are, thus, aiming to address these anomalies in the urban foodscape. Specific actions include financial and land-use incentives for supermarkets in low-income neighborhoods (e.g., the FRESH program in New York City), new public transit connections and privately sponsored shuttles between food insecure citizens and food banks, farmers markets, and supermarkets, as well as mandating fresh food options in affordable housing developments.
Alongside availability and access to fresh food infrastructure, cities are also recognizing the need to keep track of the broader landscape of local food outlets alleviating hunger in the urban foodshed. The number of food pantries, community kitchens, soup kitchens, and emergency food assistance programs are some of the specific measures included in UFSS. Baseline indicators such as the number of households reporting food insecurity, the number of children eligible for free or reduced-price school meals, and the rate of food insecure food system workers, are also considered key for gauging the different manifestations of hunger in cities and the progress being made in reducing it.
4.3. SDG 3: Healthy Lives and Well-Being for All at All Ages
UFSS can be a powerful ally for implementing SDG 3, focusing on health and well-being for all and reducing premature mortality from non-communicable diseases. Redesigning the urban food environment, from food safety regulations to institutional procurement standards, educational practices, and high-quality open space, can be conducive to the achievement of healthier cities [80,81,82]. Some local governments have started considering the underexplored opportunities to connect schools and community gardens through joint-use agreements, while others have spearheaded the formation of “food animators” programs to help residents in food insecure neighborhoods set up fresh produce markets, community kitchens, and community gardens. Education is understandably one of the centerpieces of most healthy food policies at the local scale. Some of the strategic steps identified by municipalities are the integration of nutrition and garden education in school curricula citywide, the expansion of farm-to-school programs, raising awareness about seasonal produce and regional foodsheds to develop a more mindful relationship with food as a system, as well as the advocacy for increased education funding through federal government programs like SNAP.
Aggressive marketing and advertising of unhealthy foods is another area of policy intervention that some cities are beginning to explore. Soliciting healthy food advertising in public spaces and in local media, as well as calling for a ban on unhealthy food adds which target children under 13 years of age, are among the local and higher-tier government actions outlined in some UFSS. Large-scale institutional procurement offers one strategic entry point for radically transforming the urban food system. Besides school food procurement, where new nutrition standards and restrictions on soft and sports drinks are being introduced, other institutions like municipal agencies and hospitals are also starting to be considered as part of a holistic institutional food procurement reform at the local level. Evidence suggests that changes to the school food environment can cut the incidence of overweight and obesity by as much as a half (e.g., in Philadelphia). Additional policies include municipal bans on trans fats and discretionary bans on animal products from livestock and poultry raised with growth hormones and antibiotics. Local laws requiring calorie-labelling on the menus of restaurants with multiple locations are also part of the policy provisions recently undertaken in large metropolitan areas in North America.
The diverse set of healthy food systems indicators put forward by cities (see Table 4), effectively reflects the need for a holistic approach to monitoring and planning for the urban foodscape. All five food systems strategies, and related ancillary reports, call attention to the importance of synchronously tracking the state of individual health (e.g., percent of adults and children who are overweight or obese, diabetes death rate, coronary heart disease death rate), the prevalence of healthy and unhealthy nutrition practices (e.g., adults eating at least five servings of fruits and vegetables a day, children and teens drinking at least one soda or sweetened drink a day), and the presence of physical infrastructure which facilitates or hinders healthy food choices (e.g., number of salad bars in schools and hospitals, number of stores that sell fresh produce, number of mobile green carts accepting EBT, fast food restaurants per capita). The role of public institutions through targeted programs and incentives is also highlighted among the areas where devising clear metrics (e.g., number of senior food programs, city incentives for healthy vending) would be beneficial.
4.4. SDG 4: Inclusive and Equitable Quality Education and Lifelong Learning Opportunities for All
While efforts to promote education in the urban food system are often associated with healthy nutrition and individual well-being, initiatives to support education throughout the entire food chain—from production through consumption and waste disposal—are as crucial. What is more, food offers a unique set of avenues to advance inclusive and effective learning practices across disciplines; it cuts across a broad spectrum of environmental and social sciences and offers multiple opportunities for vocational training and innovative small businesses and entrepreneurship. Local government officials have, in fact, used urban food strategies to pioneer new and acknowledge existing educational programs at all levels of the food system—from edible schoolyards (e.g., the Grow to Learn program and small grants in New York City) to healthy nutrition workshops, cooking classes, and professional training programs for new farmers, gardeners, farmers markets managers (e.g., Farm School NYC and the Youth Greenmarkets program of GrowNYC), and composters.
Higher quality nutrition has been shown to lead to superior learning capabilities and improved focus in school [83,84]. Ensuring consistent access to healthy nutrition for students of all ages must, therefore, be part and parcel of SDG 4 implementation efforts. Among the indicators put forward in urban food plans, and relevant to this end, are the number of farm-to-school programs offered, the number of students served per day in student nutrition programs, and the rate of eligible students participating in school lunch programs (see Table 5). In addition to effective learning, cities are also focusing monitoring efforts on the availability and extent of nutrition education (e.g., government funds spent on nutrition education programs) and taking the pulse of new opportunities for gaining job-ready skills in the urban food system (e.g., number of urban agriculture programs offering training in employment-related skills).
As municipalities are increasingly recognizing food as an important part of the urban economy, even in industrialized cities, local food system plans—including the five strategies examined in this paper—have focused on targeted educational initiatives to facilitate the successful establishment of new startups and businesses in the food processing and manufacturing domain of the urban food system. To inspire and train the next generation of food system makers, cities are putting forward several promising approaches, among which the creation of online resource centers for beginning food manufacturers, the organization of regional food business-to-business conferences, and the development of workshops and vocational programs for young entrepreneurs.
4.5. SDG 5: Gender Equality and Empowerment of All Women and Girls
Gender inequality is a structural issue which permeates all spheres of society, including the agri-food system [85,86]. Yet, despite its ubiquity, the goal of gender equality has only begun to surface in sustainable food system advocacy through discourses about food justice and the deep-seated disparities in access to affordable nutritious food. This is indeed reflected in the early wave of local and regional food systems strategies, which the New York City’ FoodWorks plan [36], Philadelphia’s Eating Here plan [41], Chicago’s Food Systems Report [67], Toronto’s Cultivating Food Connections strategy [37], and Los Angeles’s Good Food for All Agenda [40] are part of. Discussion of gender inequality, and the unique roles of women and girls in the food system, is almost absent in these documents (see Table 1 and Table 6) and so are proposals for specific interventions or advocacy for higher tiers of government. There is a lot that can be done at the local level—from support to women’s startups and businesses, many of which already successful and underway, to equal pay for equal work in the food sector, to protection and equitable treatment of immigrant women farmworkers. Cities and local administrations are just beginning to chart this new terrain in local food policy but they have a pivotal role to play in its long-term normalization both in political discourses and everyday practices.
4.6. SDG 6: Availability and Sustainable Management of Water and Sanitation for All
The pursuit of sustainable urban foodsheds is inextricably tied to the successful management of urban watersheds and the water distribution infrastructures within cities [87]. Through their food strategies, cities like New York, Los Angeles, Toronto, and Philadelphia are highlighting this vital linkage and advocating for farmland protection from urbanization and support of sustainable farming practices that can prevent farm run-off and the risk of contaminated groundwater in their regions (see also Table 7). To prevent water contamination due to urban sewage overflows, cities are creating new green infrastructure grants, whereby the increase of permeable surfaces, including ground-level and rooftop farms and gardens, throughout the urban area can divert storm water from cities’ combined sewages, decreasing the risk of contamination of nearby rivers. Rain and grey water collection and filtration systems can instead be successfully deployed to reduce the use of city’s drinking water in irrigation for urban farms and community gardens. In addition, the selection and use of drought-resistant plants, mulch and soil that retain humidity, and precision drip-irrigation systems can further increase water efficiency in these projects. Compared to soil-based cultivation techniques, hydroponics and aeroponics systems in rooftop greenhouses can cut down up to ten times water consumption in urban food production.
Sustainable food systems and water management in big cities also overlap at the waste disposal end of the food chain. In New York City, for instance, improper disposal of cooking grease can clog the sewage infrastructure and cause perilous backups in households and commercial food establishments. Policies to upgrade the urban sewage infrastructure as well as sanctions and incentives to prevent oil and grease from ending up in the water system are among the concrete measures being adopted to this end. Finally, cities are also in the position of reducing their overall water footprint by cutting the consumption of beef in their diets. Research has shown that the production of 1kg of red meat requires over 10 thousand times more water than to produce 1kg of tomatoes [88]. Investing resources in campaigns and policies that can bring about cultural change and shift beliefs about what is a healthy diet is, thus, an essential component of the city-driven water management strategies that are being advanced.
4.7. SDG 7: Access to Affordable, Reliable, Sustainable and Modern Energy for All
While not the main focus of UFSS, the production of renewable energy is an important part of local sustainability plans and often intersects with urban food policies. There are a host of opportunities to encourage more efficient energy use and supply throughout the urban food system [89]. Food waste is one underused energy resource that local governments and small businesses are increasingly exploring and seeking to tap into. The collection and recycling of used cooking oils, for instance, can support the local production and distribution of biodiesel, which, when obtained this way, is also less polluting. New York City, for instance, seeks to encourage these practices by mandating by law a minimum percentage (currently 3%) of biodiesel in fuels used for residential heating in the winter. In addition, vehicles running on biodiesel, or other less polluting fuels, are suggested as substitute to the trucks used to distribute food to farmers markets as well as the buses in public transit fleets.
Urban food scraps and organic waste more broadly are yet another potential source of renewable energy in urban areas. The processing of these scraps, by means of anaerobic digestion, can enable cities to use the methane gases and energy produced during the phase of decomposition to heat water, buildings, and greenhouses. Facilitating the use and production of renewable energy on farms is also key part of the avenues for the successful implementation of SDG 7. The attentive integration of infrastructure that produces wind, solar, and biomass energy can make farms and farming more resilient both financially and environmentally.
To assess progress toward greater energy efficiency in the urban foodshed, local administrations have set forth indicators addressing multiple components of the food chain—from production to refrigeration and transportation. Among these are the number of alternative energy systems (solar, wind, biomass) installed on farms, the number of food manufacturers participating in energy efficiency programs and the energy efficiency of the vehicles used for food transportation and the distance traveled (see Table 8). Coastal cities like New York are also considering the reliability of energy access citywide in case of extreme climate events. The availability and extent of backup power resources across the urban food supply distribution network are among the monitoring areas considered to this end.
4.8. SDG 8: Inclusive and Sustainable Economic Growth and Decent Work for All
The urban domain of the food system can be a fertile ground for innovative enterprises that work to transition the current food retail and consumption environment to sustainability [90,91]. Holistic incentive strategies like the establishment of food enterprise zones, whereby financial and zoning incentives are offered in designated parts of the city, can stimulate the integration of urban farming, healthy food retail, and value-added food processing activities in low-resource communities and underserved urban areas. The Philadelphia UFSS recognizes that the introduction of such activities can have positive economic effect on the surrounding environment, while evaluation studies in New York have found that the first three stores developed through the incentives brought 93 new jobs and retained 90 existing ones in the communities which used the program. Making sure that public investment is linked to good jobs and small food enterprises, is an objective highlighted in the Los Angeles’s good food agenda, emphasizing the importance of living wages and the quality of jobs created (see Table 9). Investment in new local food infrastructure and the refurbishment of existing facilities to create business incubators (e.g., “kitchen incubators”) is another concrete action that cities are putting forward through their local food system plans and regulations.
Cities are also using their UFSS to advocate for economic growth policies to be enacted at the state level of government. Concrete action steps aligned with SDG 8 include the investment in the education and training of new farmers, increasing access to financial resources (e.g., tax reliefs for farmers supplying local communities, micro-loans, affordable retirement plans), and new infrastructure (e.g., business incubators). The preservation of existing farmland and facilitating access to it for new farmers (e.g., by matching interested farmers with landowners or retiring farmers) are also among the key actions advanced to support sustainable urban regions. Additional strategies include supporting local food growers and processors in marketing their products through targeted branding and campaigning, as well as agritourism initiatives. Some policymakers are also calling for a more diversified approach to food safety regulations, often precluding small businesses and startups from entering the market. Mandating compliance with “whole farm” safety plans rather than crop-specific regulations and promoting transparent food labelling, indicating the provenance and the methods of production, are further approaches considered to this end.
4.9. SDG 9: Resilient Infrastructure, Inclusive Industrialization, and Innovation
Sound food producing, processing, and waste management infrastructures are vital to the development of new local food businesses and the sustainable scaling up of existing ones [92,93]. Through their food strategies, cities have promoted the expansion of ground-based and rooftop farming initiatives and their recognition as integral part of green infrastructure. Some of the policies encated to advance more resilient and innovative urban infrastructures include waiving of floor to area ratio requirements and height restrictions for some rooftop greenhouses, reducing water rates for rooftop gardens, advocating for state green roofs tax credit for food-producing roofs, as well as developing searchable inventories of city-owned property suitable for urban farming (Table 10 and Table 16). A more streamlined process for obtaining permits and public land leases for community gardens, as well as protecting them from development, is also in the remit of competencies of local administrations, as noted in the Los Angeles food system strategy, and can strengthen the infrastructure of productive landscapes citywide. Making the most of available federal funding, like the HUD Community Development Block Grant in the US, to develop urban agriculture projects is one underused financial opportunity that can help expand urban food growing infrastructure and advance multiple SDGs at once (e.g., SDGs 2, 9, 11, 13, 15).
Opportunities for innovation in the urban food system depend also on the availability of space and training for small-scale food processing entrepreneurs. Promoting commercial kitchen incubators (e.g., like the Hot Bread Kitchen in New York) and making available new industrial space for food manufacturing businesses is thus essential for social innovation in this domain of the urban foodscape. Larger-scale facilities such as regional food hubs [94,95], where processing, packaging, and logistic infrastructures and professional support are concentrated, are also recurrent interventions proposed in UFSS (see also retail-related indicators in Table 10). Multi-functional hubs can help food processing startups stabilize and fill a key gap in the regional food system by enabling small- and mid-scale producers aggregate and thus meet the high demand for local, fresh produce in nearby cities. Cities are now rethinking the role of existing infrastructure, including public city markets and large international food logistics terminals (e.g., Hunts Point in New York City and the Ontario Food Terminal in Toronto), and how they can support a more inclusive, healthy, and resilient urban food system. One potential strategy suggested to reduce air-pollution and use of fossil fuels, typical for these truck-reliant infrastructures, is to increase rail service and optimize the routes and food distribution modes within the city and between city and region.
To meet the needs of urban dwellers, however, food infrastructure need not be only brick and mortar. Financing the establishment of a network of mobile healthy food vendors, particularly in communities with little to no access to affordable fresh food options is, in fact, one progressive approach to build a resilient urban food infrastructure being implemented by several cities across North America, including the cities analyzed in this paper.
4.10. SDG 10: Reduce Inequality within and among Countries
In a highly globalized yet increasingly consolidated urban food supply, dismantling inequality within and among countries can hardly be done in isolation from dismantling inequality within the food system itself. Food can be a useful entry point for uncovering and addressing multilayered inequalities in industrialized countries and the supply systems they rely on. In addition to the already mentioned strategies for coping with unequal food access, another set of disparities pertain to the state and federal levels of decision-making in the urban foodshed.
While cities cannot enact farm bill reforms themselves, they are nevertheless using UFSS to voice food justice concerns and point to potential solutions which higher tiers of government are better suited to pursue. Common inequalities at the regional level include disparities between fruits and vegetables producers and commodity crops producers, small-scale and large-scale farms, farm owners and farmworkers, decision-makers and indigenous populations. Establishing federal subsidies for non-commodity producers, enforcing antitrust laws, allowing farmworkers to anonymously file complaints of employer misconduct and abuses, incorporating fairness as a standard in certification and labelling practices (see also SDG 16), including indigenous communities in decision-making processes, as well as providing affordable on-farm housing, are some of the concrete policies and areas for tracking progress (see Table 11) that local administrations in some of the largest North American urban areas are putting into practice.
4.11. SDG 11: Inclusive, Safe, Resilient, and Sustainable Cities
The growing number and saliency of UFSS in Global North cities, is symptomatic of the progressive reactivation the local level of food policy in developed countries. The new conceptual, political, and economic relationships between agri-food systems and urban policies point to food’s untapped potential to support more inclusive, safe, and resilient human settlements. Smarter food waste management of both organic (e.g., food scraps, cooking grease, sewage) and solid (e.g., packaging) waste can, for instance, significantly reduce the impact of cities on climate, public health, and the environment. By encouraging the prevention, reuse, and recycling of food-related waste, developed economies cities New York can cut the volume of curbside waste by a third [53].
Local policies and programs to preserve and expand urban agriculture sites are also effectively increasing access to safe and inclusive green and public spaces. New urban gardens between and atop buildings are incentivized to increase the quality of urban environments, while equipping communities to better deal with extreme climate events. Sustainable institutional food procurement policies are among the most consequential city-driven interventions in the food system which bear implications for multiple SDGs—from childhood health (SDG 3) to sustainable agriculture (SDG 2) and reduced inequalities (SDG 10). A more diverse web of urban-rural linkages and regional foodsheds supplying both nearby cities and the world food economy make regions overall more resilient and inclusive (SDG 13).
Among all SDGs, SDG 11 arguably best exhibits the multiple interrelations between the seventeen goals in the 2030 Agenda. The intersectoral nature of the urban food system further helps uncover this complexity. To measure progress toward the implementation of SDG 11 through existing urban food policy and planning efforts, is thus necessary to consider the entire set of indicators, which cities use to monitor the environmental, social, economic, and public health spheres of life in the urban foodshed (see Table 12).
4.12. SDG 12: Sustainable Consumption and Production
Urban food consumption is a critical domain of sustainable consumption since it concurrently affects human health and the environment [96,97,98]. Global cities are hotspots of global food consumption and are strategically positioned to affect change through the everyday consumption choices that people make and the associated waste disposal, reuse, and recycling practices. Large-scale institutional food procurement is one lever to effectively advance SDG 12 which cities are increasingly using to change the landscape of local food consumption. Cities are rewriting the rules and contracts that dictate the streams of food supplied to public schools, hospitals, government agencies, and other institutions [99] to allow public agencies give preference to local, nutritious, and sustainably-produced foods (see also Table 13).
Food waste management is yet another sphere of urban consumption governed by local jurisdictions. To reduce the amount of solid waste in the urban food system, cities have started banning materials difficult to recycle such as Styrofoam and discouraging the use of bottled water through the citywide installation of water fountains and advertising campaigns for reusable bottles. Pilot household composting programs and restaurant grease recycling initiatives are also among the new local initiatives put forward by UFSS and instrumental to the implementation of SDG 12.
At the production end of the food chain, cities are seeking to contribute to sustainability by instituting energy efficiency programs for food manufacturers, advocating for food system-specific criteria in green business certification programs and green job employment strategies, and by supporting community-based enterprises committed to environmental protection and human well-being alongside economic growth.
4.13. SDG 13: Combat Climate Change and Its Impacts
Agricultural production and land use change generate about one third of the greenhouse gases (GHGs) emissions worldwide and are among the key drivers of global warming [100]. If one considers the entire food system—from field to fork to landfill—this is a conservative estimate. Effective climate governance and the pursuit of SDG 13, therefore, require that legislators at different levels of government explicitly consider the agri-food system’s role in climate mitigation and adaptation. Through their UFSS, and related implementation tools, cities are taking the lead in this direction. In New York City, for instance, then-Council Member and current City Mayor, Bill de Blasio spearheaded the Resolution to Reduce NYC’s Climate “Foodprint” (Res. No. 2049) in 2009. Importantly, this bottom-up policy initiative which linked food sustainability and climate action, influenced the city’s comprehensive food system strategy FoodWorks (2010), long-term sustainability plans—PlaNYC (2011) and OneNYC (2015), and food system resiliency study Five Borough Food Flow (2016) [73].
Much as SDG 11, SDG 13-related UFSS goals and indicators (see Table 14) cut across multiple spheres of sustainable development policy. For instance, the goal of reducing GHG emissions in agriculture is tightly connected to indicators tracking energy consumption in the food chain (SDG 7), the development of regional economic circuits and shorter supply chains (SDG 8), innovation in infrastructure (SDG 9), urbanization and deforestation leading to shrinkage of the natural carbon sinks (SDG 15), as well as to metrics helping us understand how all these phenomena intersect with climate vulnerability and at risk populations (SDG 3). Likewise, efforts to expand urban green infrastructure, often associated with climate adaptation, concurrently enhance the continuity of ecological corridors and ecosystems (SDG 15), while reducing the impact of extreme climate events like heat waves and hurricanes. Metrics used to gauge emergency preparedness and infrastructure resiliency, such as the average number of days of food stocks available in different store typologies or the number of farms receiving disaster payments, were also included in some of the strategies examined.
Social equity (SDG 10) in the context of climate resilience is reflected in some UFSS through goals of climate justice. Making sure that the most vulnerable urban populations, especially low-income communities and communities of color, are among the beneficiaries of climate change investments is, for instance, a separate goal in the Los Angeles’s Good Food for All Agenda (2010). This is instructive for the implementation of SDG 13 writ large, in that places the emphasis on people-centered infrastructural interventions promoting social justice hand in hand with climate preparedness [101,102].
4.14. SDG 14: Sustainable Life below Water
Aquatic life is a vital marker of the health of water bodies like rivers, streams, seas, and oceans. In todays’ increasingly urbanized world, cities have the potential to play a key role to preserving and restoring aquatic life not only through a more responsible and efficient use of water resources (SDG 6), but also by leveraging urban diets (SDG 3), infrastructures (SDG 9), and institutions (SDG 17) to transition agricultural and fishing practices.
Promoting sustainable urban water management through green infrastructure (SDG 13), to ensure clean and healthy waterways, is one recurrent SDG 14-related goal across UFSS. In some US cities, the expansion of permeable surfaces (e.g., through bioswales, green roofs, community gardens) is an essential intervention to prevent sewage water from entering in the nearby water bodies. Cities with combined storm water and wastewater sewer systems like New York are increasingly supporting alternative water management approaches and recognizing the superior water absorption qualities of food-producing rooftops compared to ornamental vegetation.
Importantly, cities are also recognizing the importance of responsible expansion of local food production. Taking into account water availability and adopting sustainable farming practices (SDG 2, target 2.4), which limit or exclude the use of chemical fertilizers and pesticides (e.g., through integrated pest management), are, for instance, some of the specific action steps set forth in the Local Food chapter of the Chicago metropolitan sustainability plan GO TO 2040. Promoting water-smart local foodscapes is even more critical for urban foodsheds which are intensively exploited. In California, for example, agricultural activities account for a whopping 61% of total water consumption [103]. The integration of rainwater harvesting and recycling for irrigation in both urban and rural settings is thus a key strategy to aid implementation of SDG 14.
While urban food strategies exhibit an overall paucity of indicators on aquatic life, the Greater Philadelphia food system plan Eating Here (2011) points to several key areas where SDG 14-relevant monitoring may take place (Table 15). The number of watersheds, and the length of rivers and streams, supporting aquatic life in the region (in this case, encompassing the states of New Jersey and Pennsylvania), as well as the watersheds and waterways polluted and impaired for aquatic life, are among the suggested metrics.
By large, aquatic life in seas and oceans is the area least addressed in the five UFSS examined in this paper. Yet, as urban ecologists contend [104], the disconnect between urban environmental policy and marine aquatic life is misplaced. One of the strategies considered by urban food policymakers to stem overfishing and slow down the depletion of wild fish stocks is the support of small-scale sustainable aquaculture. Education about responsible fish consumption, supported by the Toronto UFSS, is yet another promising approach, potentially aiding the implementation of SDG 4 as well. The Toronto Public Health Department led the development of the first sustainable fish consumption education guidelines in North America, providing recommendations on the nutrition, food safety, and ecological criteria to consider when purchasing and consuming fish in the city. Besides raising awareness through published materials, coastal cities are taking action to restore marine ecosystems also though hands-on water ecosystem restoration and education projects such as the Billion Oyster Project in New York Harbor [105].
4.15. SDG 15: Sustainable Life on Land, No Land Degradation and Biodiversity Loss
Land is a finite resource and, like water, is subjected to environmental pressures from both established and expanding urban regions [106]. Objectives for farmland and open space preservation are prominent in all UFSS examined, with monitoring efforts focusing on land consumption, soil quality, and biodiversity (Table 16). Besides restrictive land-use regulations, land trusts are another important mechanism for open space protection supported by cities. It is a proactive approach to shielding prime agricultural land or community gardens from real estate and infrastructural development.
Because of the growing competition for urban land, the implementation of SDG 15, and indeed of all goals in the 2030 Agenda, requires local administrations to mediate trade-offs among competing sustainable development interests. To mitigate the risk of displacement of community gardens, for instance, the City of New York updated its land-use review procedures and included a garden review process, increasing the chances to maintain community gardens threatened by development (including affordable housing) in the neighborhood they serve; though at the cost of changing their original location. Further, Philadelphia’s Eating Here food systems plan (2011) draws attention to the potential conflict between farmland preservation and renewable energy production. The plan suggests that installation of solar power plants on farmland should be permitted only if there is no available space within already urbanized areas.
Reversing “peak soil” and topsoil depletion due to unsustainable land uses is a goal integral to all five UFSS. Objectives to this end include the introduction of grassed waterways to prevent soil erosion, the transition to organic agriculture and agroecology, and the restriction of chemical fertilizers, herbicides, and pesticides in local farming (Table 16, see also SDG 6). Policies to protect and enhance biodiversity (SDG 15) are also weaved into some of the UFSS. The extent of farmland used for crops for direct human consumption (i.e., not animal feeds or biofuels), the number of beekeeper permits issued, and the number of organic farms in the regional foodshed are some of the indicators specifically aimed at increasing biodiversity in both urban and rural areas. UFSS also underscore the importance of helping farmers stay on the land by ensuring equitable access to urban markets (SDG 8), longer-term land leases, and training and financing for young farmers, cannot and must not be overlooked in addressing the implementation of sustainability goals (e.g., SDGs 15 and 2).
4.16. SDG 16: Access to Justice for All, Peaceful and Inclusive Societies
For its intrinsic intersectoral nature, the food system is recognized as a unique domain for achieving the interrelated goals of social, economic, environmental, and racial justice by municipal and national governments. The multi-layered concept of “food justice” effectively encapsulates these different dimensions and recurrently surfaces in the language adopted in UFSS. Cities emphasize the singular opportunity to link labor and immigrant rights through comprehensive food policy at the local level and call attention to the most vulnerable populations in the food chain, such as (undocumented) immigrant and minority workers, many of which are women. The Los Angeles Good Food for All Agenda (2010), for instance, urges communities and institutions to treat food system workers “with respect, justice, and dignity” [40]. The pursuit of inclusive societies and access to justice for all—the focus of SDG 16, is, in fact, tightly interrelated with a handful of other sustainable development goals targeting gender equality (SDG 5), reduced inequities within and among countries (SDG 10), and decent work for all (SDG 8).
Greater Philadelphia’s food system plan Eating Here (2011) presents an important innovation with respect to SDG 16 in that singles out “fairness” as a strategic standalone goal for the regional foodshed. One of the objectives, and related metrics, highlighted in this area is ensuring fair competition in the market place (Table 17). Besides advocating for antitrust laws to be enacted at higher tiers of government, cities see also a direct opportunity to affect fairness in the food system by improving the living conditions for farmworkers and their families, including good quality housing and access to healthcare. The City of Toronto’s food strategy turns this idea on its head and uses the goal of ensuring access to public health for all (SDG 3) as the starting point for achieving fairness in the food system. According to this UFSS, a health-focused food system is a system that promotes social justice. Transparent, inclusive, and democratic decision-making processes are yet another goal closely related to the achievement of SDG 16, especially emphasized in Los Angeles’s UFSS.
Being issued by affluent, industrialized, democratic governments, most UFSS lack the peace-focused component of SDG 16. Yet, it is worth recalling that not-so-distant food system crises have ignited riots and social unrest worldwide and are indicative of the “new food equation” [107] in which cities are taking a front seat in food policy no matter their socioeconomic standing.
4.17. SDG 17: Stronger Means of Implementation and Partnership for the Goals
Neither local food policies nor the broader set of sustainable development goals will get out of the door in the absence of strong institutions, wide public participation, and mechanisms that afford recurrent monitoring of progress and adjustments of the course of action. One of the reasons why the recent wave of UFSS offers a promising field for the implementation of the SDGs is the dense web of nongovernmental, quasi-governmental, and governmental organizations which took shape alongside. In North America alone, there are over 100 local food policy councils and partnerships [108] already, up from just a handful in the 1990s. While still amorphous and unstable, these new political spaces gather and collate key local food system data and, in the absence of an established urban department of food [109], serve as de facto food systems planning agencies [110]. What is more, the planning work of these stakeholder coalitions uniquely ties decision-makers across the different policy silos where food policy is locked-in (e.g., agriculture, nutrition, public health, waste, environmental protection). Thus, the establishment of a local food policy council is a goal frequently expressed in UFSS (cf. New York, Chicago, Los Angeles).
Importantly, many of these food policy groups are hosted within, or are well-connected to, municipal sustainability and resiliency offices, city and regional planning agencies, and public health departments. No matter their institutional home, local food policy spaces are strategically positioned to guide not only agri-food and nutrition initiatives, but climate action more broadly. What is more, thanks to their deep and broad networks and cross-sectoral competencies these institutions can contribute to a more integrated approach to implementation of urban food policy and the SDGs. To this end, mandating the development of consistent monitoring frameworks and reporting practices across cities is as essential. Following the release of its comprehensive food system plan in 2010, New York City adopted Local Law 52 of 2011 which requires multiple city agencies to report on their food system-related initiatives every year. Since then, five Food Metrics Reports [111] were successfully released, including those examined in this paper.
Further, the institutionalization of new professional figures—such as food systems planners and urban policy coordinators—are indispensable to navigate the fragmented landscape of policies, programs, and initiatives across the food system and different city agencies. These interdisciplinary professionals are doing the hard job of “shuttle diplomats” [112], helping cities craft sustainable food system solutions through mediating conflict, facilitating collaboration, and making synergistic connections across departments, food system sectors, and government scales. Measuring not only the extent of participation in local food policy coalitions (see Table 18), but also the robustness and stability of food policy staff in city administrations is one area in need of further attention.
5. Toward an Integrated Approach to Implementation
The comparative analysis of the SDGs and the food systems strategies of New York, Philadelphia, Los Angeles, Chicago, and Toronto, revealed multiple potential synergies between local, national, and global sustainability efforts. Yet, to assess the scope for an integrated approach to implementation of the SDGs, a finer-grained understanding of how local metrics complement, extend, or diverge from the 2030 Agenda’s suit of indicators is warranted. The present section calls attention to this new frontier in sustainable development research and policy and points to ways in which scholars and policymakers may begin to approach it.
5.1. Urban Food Systems Strategies and the New Global Indicator Framework
In March 2017, the UN Statistical Commission released the official framework of suggested indicators for measuring progress toward the achievement of the SDGs [66]. The 169 targets were equipped with 232 different existing and newly-introduced metrics. When examined in tandem with the 260 urban food systems strategies (UFSS) indicators presented in this paper, several key trends emerge (c.f. Supplementary Materials, Table S1).
As expected, the areas of major overlap between SDGs and UFSS indicators (see Figure 2) consistently mirror the goal-level comparison presented in Table 1. The paucity of goals and objectives on topics such as gender equality (SDG 5), marine ecosystems (SDG 14), and climate action (SDG 13) is reiterated at the level of indicators. By contrast, goals focusing on agri-food systems (SDG 2), cities (SDG 11), consumption (SDG 12) and life on land (SDG 15) exhibit the highest concentration of UFSS indicators. In these goals, targets with the least amount of overlapping indications are due either to a mismatch in geographical focus—targets focusing only on developing countries (e.g., targets 1.a, 11.c, 10.6, 14.a), or to a mismatch in scale—targets focusing exclusively on national or international interventions and regulations (e.g., targets 13.2, 15.7, 16.3).
Considering the target level alone, main areas of intersection pertain to the reduction of under- and malnutrition (targets 2.1, 2.2), sustainable agriculture (target 2.4), prevention of non-communicable diseases (target 3.4), resilient infrastructure (target 9.1), efficient use of natural resources (target 12.2), land conservation (target 15.1), and multi-stakeholder partnerships (target 17.17). The quality of intersections can, however, be as informative as the density. Outliers with a single UFSS indicator, such as target 5.7, aligned with Los Angeles’s indicator tracking women-operated farms in the urban foodshed, or target 2.5, aligned with Toronto’s measure of the contribution of urban agriculture to biodiversity, can point to key areas of continuity between global and local metrics and ought not be neglected.
The juxtaposition of UFSS and SDG indicators sheds light on a number of different opportunities for continuity between global and local-level sustainability actions and monitoring practices. For instance, the indicator tracking the percentage of nonsupervisory food system workers with health insurance, used in the Los Angeles’s metrics report, can usefully extend SDG indicator 3.8.1 focusing on the achievement of universal health coverage, and thus support progress toward implementing SDG 3. Likewise, measuring the number and type of legislative changes made to protect the rights of temporary agricultural workers in Philadelphia’s urban foodshed can support tracking SDG indicator 10.7.2, focusing on the number of countries that have implemented well-managed migration policies, and thus help reduce inequalities within and among countries (SDG 10). Among others, additional examples of potential synergies include the amount of reduced packaging upstream, measured in New York City, and SDG indicator 12.5.1 assessing national recycling rates, and evaluation efforts in Los Angeles tracking the rate of soil erosion per acre per year in the region and SDG indicator 15.3.1 assessing the proportion of degraded land. It should be however noted, that, unlike the recently-agreed global SDG indicators, many UFSS indicators (e.g., median farm size in the urban foodshed or percent of last-mile food distribution trips originating in the city) are better viewed as potential means to SDG implementation rather than target-specific metrics for tracking the achievement of an SDG.
In addition to nested monitoring practices and indicators, UFSS indicators can help strengthen SDG implementation also by bridging the gap between comprehensive SDG targets and SDG indicators focusing on a single issue or dimension of the target. For instance, cities have a key role to play in halting biodiversity loss (SDG 15, target 15.4) and the Red List Index can be usefully expanded through community-level indicators such as the number of urban agriculture projects that grow native or pollinator plants tracked in Toronto or the number of registered beekeepers tracked in Los Angeles. Similarly, target 14.1, focusing on the prevention and reduction of marine pollution from land-based activities, can benefit from considering not only the amount of coastal damage and waste but also the volume of sewage diverted from waterways (New York), or the presence and extent of rivers and streams impaired for aquatic life (Philadelphia). Global cities and regions located near vital marine ecosystems—like New York, Los Angeles, and Philadelphia examined here—can play a key role in preventing land-based marine pollution and point to the benefits of considering target 14.1 and target 6.5, focusing on integrated water resource management, in tandem.
The scope for augmenting SDG targets through topics drawn from UFSS indicators, especially those aiming at attaining more equitable, healthy, and sustainable agricultural production and nutrition, is by far the greatest. For instance, government subsidies disproportionately privileging commodity (e.g., corn, cotton, soybean) over non-commodity produce (e.g., fruits and vegetables) have important implications for small-scale farmers (target 2.3) and may impair economic access to fresh and nutritious foods for vulnerable and poor individuals (target 2.2). Targets focusing on the achievement of greater equality within and between countries (SDG 10) through policy interventions (target 10.4) can thus benefit from incorporating considerations about the amount of governments funds received by local food and agriculture businesses by type of produce (commodity vs. non-commodity payments) as suggested in Philadelphia’s food system plan. Subsidies are not new to SDG metrics and are already considered in SDG targets like 14.6, which targets fisheries subsidies leading to overfishing, however, as most UFSS underscore, subsidies for land-based food production have equally important social and ecological implications and merit separate attention.
One further area where UFSS indicators can effectively aid the implementation of the 2030 Agenda is target 2.4 addressing sustainable food production within SDG 2. While an emphasis on the environmental dimension of agricultural practices is understandable, the type and quality of systems and infrastructures used for large-scale animal husbandry operations is as key. Supporting farming practices prioritizing humanely raised, hormone- and antibiotics-free cattle, hogs, fish, poultry, and dairy cows is an effort undertaken by a growing number of public and private institutions worldwide and cannot be decoupled from the 2030 Agenda and its food system-related goals. Indicators like the density of animals per farm (Los Angeles) point to ways in which this gap can be addressed. What is more, consideration of animal welfare can help tracking achievement of sustainable consumption and production (SDG 12) not only based on the extent of material footprints (target 12.2) but also on their quality.
Lastly, the spatial dimension of food insecurity and the importance of healthy nutrition for school-aged children are two central UFSS monitoring areas without an adequate parallel in SDG indicators. The extent to which current fresh food infrastructure meets the needs of low-income individuals and to which anti-hunger subsidies support healthy diets are important markers for tracking progress toward SDG 2 in a systemic fashion. SDG targets 2.1 and 2.2 can be extended and complemented by UFSS indicators such as the rate of acceptance of government nutrition assistance benefits at farmers markets or participation of low-income women and seniors in fresh food retail—a monitoring priority for all UFSS examined. Target 2.2 which focuses on malnutrition writ large, yet its indicators track nutrition outcomes for children under 5 years of age only and leave out school-aged youth. Urban food strategies and their implementation through local health and education departments are, therefore, well positioned to fill this gap and amend the current decoupling of SDG 2 and SDG 4 in the global indicator framework. Given that healthy school nutrition is key to improved cognitive functions and learning [83,84,113] and the development of a healthy lifestyle in adult life, this potential synergy is of strategic importance.
5.2. Further Policy Implications
The analysis of the 260 UFSS indicators side by side the over 230 SDG indicators exposed a landscape of multiple opportunities for an integrated approach to the implementation of the 2030 Agenda for Sustainable Development and streamline connections with the New Urban Agenda [114] adopted at the Habitat III conference in October 2016. Numerous areas of alignment, overlap, and potential extension of monitoring activities exist and offer avenues for a unified, multi-scale inventory of sustainability metrics and the basis for more influential local-global partnerships for the goals. In addition to the policy implications of specific overlaps and discontinuities between UFSS and SDG indicators discussed above, this finding offers several broader takeaways for future policy and practice.
Acknowledging and building on existing data collection, analysis, and sense-making activities taking place at the local level, in addition to national-level reporting, is essential for the effective pursuit of the SDGs in practice. Public officials engaged in national and international monitoring activities of indicators, which are already incorporated in the SDG indicator framework, need, therefore, to find ways to effectively take stock of the evaluation work carried out by colleagues working at subnational levels of governance and sustainability planning. Urban food policy coordinators, as well as sustainability and resiliency policy directors, may harness the network power of existing nation-wide mayoral coalitions to develop an integrated grid of city-level sustainability dashboards and spur joint action. This could be aided by the explicit recognition of the SDGs and their relevance for local policies in future reiterations of long-term sustainability and resilience plans and strategies periodically devised at the local scale.
National reporting agencies may incentivize capacity-building and the systematic identification of key interfaces between SDG-relevant monitoring activities across multiple scales and jurisdictions. If supported with adequate staff and resources, this would effectively create a new institutional space and legitimacy for unified cross-jurisdictional monitoring mechanisms and infrastructure, which—as seen from this paper—have significant potential to amplify national and global implementation efforts. Compiling metadata for local-level indicators consistent with the metadata used by the UN Statistics Division for the SDG indicators can further facilitate potential crossovers. A synoptic view of relevant indicators and progress being made locally and collectively is critical not only for identifying priorities and allocating limited public funds, but also for detecting so-called positive and negative “spillover” effects from the local implementation of the SDGs [115]. For instance, when fairness and sustainability in New York City’s food system increase thanks to new programs, projects, and policies, do other cities benefit or bear inadvertent costs as a result? A combined, if not integrated, monitoring infrastructure may assist in gaining knowledge of such questions at different scales and support a more holistic approach to implementing both the 2030 SDGs and the New Urban Agenda.
The comparative analysis of UFSS and the 2030 Agenda goals and indicators offered also insights into potential tensions and challenges for an integrated implementation of the SDGs. How, for instance, to reconcile the impetus for re-regionalizing the urban foodshed of Global North cities with SDGs advocating for more equitable global trade, whereby poor countries increase their exports to developed countries? How to marry localism ideologies, underscoring the social, economic, and ecological benefits of locally-sourced produce with goals of global justice and economic solidarity? These are ethical and political dilemmas which ought to be assiduously addressed in the multi-stakeholder spaces and partnerships which SDG 17 calls for. The spatial boundaries most appropriate for addressing each SDG target bear yet another implementation challenge [116]. The urban foodshed, referred to in most indicators of Los Angeles’s food system assessment, is, for example, a unit of analysis and monitoring that clearly transcends administrative boundaries. In fact, geographic units are better suited for systemically addressing complex socioecological challenges, yet working at this scale is far from straightforward. What new data collection and policy implementation arrangements are needed to work across jurisdictions—cities, counties, metropolitan regions, states—to effectively tackle landscape-level problems, what key data are missing, inaccessible, or inconsistent between local governments, and who should be responsible for filling the gaps are among the uneasy questions which policymakers and local leaders will have to address.
5.3. Implications for Research
The findings presented in the previous sections have implications for global sustainable development research as well as research focusing on urban food policy and planning. The untapped potential for a cross-jurisdictional approach to the 2030 Agenda implementation—whereby cities and local communities work in concert with states and international institutions—is one of the key messages of the paper. This outcome is in line with previous literature on the topic [117,118,119,120] stressing the importance of establishing inter-institutional channels of communication and actively engaging subnational and local government authorities in implementing the SDGs. Further, the paper points to the potential role of place-based sustainability indicators, and UFSS indicators more specifically, as an antidote to the “modernization” of sustainable development [121] and the homogenization of metrics and understandings of what sustainable development should look like. Future research could thus facilitate bottom-up driven integration by exposing the nitty-gritty practicalities of measuring progress toward the SDGs in a diverse set of cities [119] and providing practice-based insights into what makes sense, where, and why.
Results of this paper also stress the importance of considering the multiple interconnections between and within the SDGs when addressing their implementation, underscored in recent SDG research [6,8,14,15,115,122]. Being inherently complex and cross-sectoral, the urban food system, and the metrics used to track its transformation, are well-suited for detecting potential positive and negative interactions in the SDG ecosystem as well as between different scales of implementation [117]. The joint UFSS-SDGs analysis also highlighted the centrality of cross-cutting themes like sustainable consumption and production [11] alongside insufficient links between some SDGs, like healthy nutrition and education, or missing targets on politically sensitive issues [19], such as socioeconomic and ecological disparities resulting from commodity-centered agricultural subsidies.
The inclusion of cities as a stand-alone goal (SDG 11) is a significant step forward, however, the analysis revealed that it would be a mistake to confine the role of cities to a single goal. Without acknowledging this cross-sectoral potential and outlining specific responsibilities for authorities, businesses, and third sector organizations working at the local scale, governance capacities for the SDGs would be limited at best [123]. SDG experts and scholars with competencies in urban policy and planning should therefore work to advance policy-relevant research and provide guidance in this critical area of implementation.
The outcomes of the present paper are also aligned with emergent scholarship on urban food policy in developed countries. Food can, in fact, be an important lever for sustainable development and more equitable local governance [5,124,125,126] and cities are progressively equipping themselves to drive sustainability transitions in the food system [3,127,128], hitherto deemed as the exclusive purview of national and international levels of government. However, a focus on the connection between urban food systems plans and the 2030 Agenda and their respective monitoring frameworks is relatively novel. Incorporating the SDGs in future research in the domain of local food policy and planning research would be, therefore, both timely and necessary. The over hundred local food systems strategies devised to date in the Global North offer multiple opportunities to chart this new terrain of research. Scholars can, for instance, conduct comparative analyses encompassing larger number of cities and more diverse geographical contexts, beyond North American experiences alone, as well as in-depth case studies using grounded theory and action research to cast light on the daily challenges of monitoring progress toward the SDGs on the ground.
6. Concluding Remarks
The urban food system—from farm to fork to landfill—offers a host of tangible opportunities to advance the 2030 Agenda for Sustainable Development. The rising wave of urban food systems strategies, aiming to make the most of these opportunities, therefore, constitutes an important avenue for an integrated implementation of the SDGs over the next decade. To date, over ninety sustainable food systems strategies, and over hundred local food charters, have been devised in affluent industrialized countries. This unprecedented momentum of political attention offers a rare window of opportunity to make key connections between advocates for sustainable development, at all tiers of government, and the healthy and sustainable food systems activists and policymakers at the urban scale.
Yet, there are also several potential obstacles and limitations that the current landscape of urban food strategies displays when considered vis-à-vis the implementation of the SDGs. For one, few of these documents are legally-binding or supported by new legislation. Food strategies are, in fact, very susceptible to shifts in electoral cycles and changes in political leadership. The exiguous staff and financial resources set aside for the development of urban food systems plans so far make the long-term survival and impact of these tools uncertain. Moreover, implementing these strategies requires managing multiple trade-offs and the ability to reconcile seemingly conflicting goals (e.g., public housing vs. community gardens, biodiversity vs. regional farming) and powers (e.g., corporate sector vs. community-based solutions) and to do so within the frame of limited municipal resources. Thus, in addition to uncovering potential synergies between local and global monitoring efforts, future research would benefit from using such contested policy areas as a unit of analysis and from investigating whether and how local governments are coping with conflicting priorities.
Despite the still precarious position of urban food policies, promising advancements toward their institutionalization have already been made. Organizational innovations like the food policy councils of Toronto, Los Angeles, and Chicago, or the office of the food policy director in New York City, are among the emergent political spaces that can cement the advancements made so far. New cross-departmental and cross-sector partnerships can lay the groundwork for effective implementation of the 2030 Agenda in tandem with urban food systems strategies, through open, transparent, and inclusive decision-making processes. Ultimately, one of the most compelling ideas that the concurrent investigation of food, cities, and planning for sustainability at global and local scales brings to the fore is that cities are truly vital to the transition of the urban food system to sustainability, and so are food systems for attaining the sustainable city. There has hardly ever been a better time to seize this unique and powerful connection.
Supplementary Materials
The following are available online at www.mdpi.com/2071-1050/9/10/1707/s1, Table S1: Overview of SDG targets, global indicator framework, and related urban food systems strategies (UFSS) indicators.
Acknowledgments
Preliminary research for this work was supported through a doctoral scholarship by the Department of Architecture and Urban Studies of Politecnico di Milano, Italy and a postdoctoral research fellowship by the Tishman Environment and Design Center of The New School, New York, NY, USA. The author would like to thank both institutions for their support. The author is also grateful for the valuable insights and constructive feedback received from the guest editors of this Special Issue and the two anonymous reviewers.
Conflicts of Interest
The author declares no conflict of interest.
Abbreviations
The following abbreviations are used in this manuscript:
| EBT | Electronic Benefits Transfer |
| FPL | Federal Poverty Level |
| MDGs | Millennium Development Goals |
| SDGs | Sustainable Development Goals |
| SNAP | Supplemental Nutrition Assistance Program |
| TANF | Temporary Assistance for Needy Families |
| UFSS | Urban Food Systems Strategies |
| WIC | Special Supplemental Nutrition Program for Women, Infants and Children |
References
- Ilieva, R.T. Urban Food Planning: Seeds of Transition in the Global North; Routledge: New York, NY, USA, 2016. [Google Scholar]
- Cohen, N. How Great Cities are Fed Revisited: Ten municipal policies to support the New York City foodshed. Fordham Environ. Law Rev. 2011, 22, 691–710. [Google Scholar]
- Morgan, K. Feeding the City: The Challenge of Urban Food Planning. Int. Plan. Stud. 2009, 14, 341–348. [Google Scholar] [CrossRef]
- Sonnino, R.; Spayde, J.J. The “new frontier”? Urban strategies for food security and sustainability. In Sustainable Food Systems: Building a New Paradigm; Marsden, T., Morley, A., Eds.; Routledge: London, UK; New York, NY, USA, 2014. [Google Scholar]
- Sonnino, R. The new geography of food security: Exploring the potential of urban food strategies. Geogr. J. 2016, 182, 190–200. [Google Scholar] [CrossRef]
- International Council for Science (ICSU). A Guide to SDG Interactions: From Science to Implementation; Griggs, D.J., Nilsson, M., Stevance, A., McCollum, D., Eds.; International Council for Science: Paris, France, 2017. [Google Scholar]
- Le Blanc, D. Towards Integration at Last? The Sustainable Development Goals as a Network of Targets; United Nations Department of Economic & Social Affairs Work: New York, NY, USA, 2015; pp. 1–17. [Google Scholar]
- Elder, M.; Zusman, E. Strengthening the Linkages Between Air Pollution and the Sustainable Development Goals; Institute for Global Environmental Strategies: Kamiyamaguchi, Japan, 2016. [Google Scholar]
- Jha, A.; Kickbusch, I.; Taylor, P.; Abbasi, K. Accelerating achievement of the sustainable development goals. BMJ Br. Med. J. 2016, 409, i409. [Google Scholar] [CrossRef] [PubMed]
- Pongiglione, F. The need for a priority structure for the Sustainable Development Goals. J. Glob. Ethics 2015, 11, 37–42. [Google Scholar] [CrossRef]
- Akenji, L.; Bengtsson, M. Making sustainable consumption and production the core of sustainable development goals. Sustainability 2014, 6, 513–529. [Google Scholar] [CrossRef]
- Watene, K.; Yap, M. Culture and sustainable development: Indigenous contributions. J. Glob. Ethics 2015, 11, 51–55. [Google Scholar] [CrossRef]
- Glaser, G. Base sustainable development goals on science. Nature 2012, 491, 35. [Google Scholar] [CrossRef] [PubMed]
- Elder, M.; Bengtsson, M.; Akenji, L. An optimistic analysis of the means of implementation for sustainable development goals: Thinking about goals as means. Sustainability 2016, 8, 962. [Google Scholar] [CrossRef]
- Nilsson, M.; Griggs, D.; Visbeck, M.; Ringler, C.; McCollum, D. Introduction: A framework for understanding sustainable development goals interactions. In A Guide to SDG Interactions: From Science to Implementation; Griggs, D.J., Nilsson, M., Stevance, A., McCollum, D., Eds.; International Council for Science: Paris, France, 2017; pp. 18–30. ISBN 9780230223073. [Google Scholar]
- Griggs, D.; Stafford Smith, M.; Rockström, J.; Ohman, M.C.; Gaffney, O.; Glaser, G.; Kanie, N.; Noble, I.; Steffen, W.; Shyamsundar, P.; et al. An integrated framework for sustainable development goals. Ecol. Soc. 2014, 19, 49. [Google Scholar] [CrossRef]
- Young, O.R.; Underdal, A.; Kanie, N.; Andresen, S.; Bernstein, S.; Biermann, F.; Gupta, J.; Haas, P.M.; Iguchi, M.; Kok, M.; et al. Earth system challenges and a multi-layered approach for the Sustainable Development Goals. Policy Br. 2014, 1, 4. [Google Scholar] [CrossRef]
- Griggs, D.; Stafford-Smith, M.; Gaffney, O.; Rockström, J.; Ohman, M.C.; Shyamsundar, P.; Steffen, W.; Glaser, G.; Kanie, N.; Noble, I. Policy: Sustainable development goals for people and planet. Nature 2013, 495, 305–307. [Google Scholar] [CrossRef] [PubMed]
- Pogge, T.; Sengupta, M. The Sustainable Development Goals: A plan for building a better world? J. Glob. Ethics 2015, 11, 56–64. [Google Scholar] [CrossRef]
- Norström, A.V.; Dannenberg, A.; McCarney, G.; Milkoreit, M.; Diekert, F.; Engström, G.; Fishman, R.; Gars, J.; Kyriakopoolou, E.; Manoussi, V.; et al. Three necessary conditions for establishing effective Sustainable Development Goals in the Anthropocene. Ecol. Soc. 2014, 19, 8. [Google Scholar] [CrossRef]
- Burford, G.; Hoover, E.; Velasco, I.; Janoušková, S.; Jimenez, A.; Piggot, G.; Podger, D.; Harder, M.K. Bringing the “Missing Pillar” into sustainable development goals: Towards intersubjective values-based indicators. Sustainability 2013, 5, 3035–3059. [Google Scholar] [CrossRef] [Green Version]
- Holden, E.; Linnerud, K.; Banister, D. The Imperatives of Sustainable Development. Sustain. Dev. 2017, 25, 213–226. [Google Scholar] [CrossRef]
- Fukuda-Parr, S.; McNeill, D. Post 2015: A new era of accountability? J. Glob. Ethics 2015, 11, 10–17. [Google Scholar] [CrossRef]
- Wiskerke, J.S.C. On places lost and places regained: Reflections on the alternative food geography and sustainable regional development. Int. Plan. Stud. 2009, 14, 369–387. [Google Scholar] [CrossRef]
- New York City Law Department Local Law No. 77 of 2013, Council Int. No. 1107-A. In The Rules of the City of New York; American Legal Publishing Corporation: Cincinnati, OH, USA, 2013.
- San Francisco Department of the Environment. Mandatory Recycling and Composting Ordinance (No. 100-09); City of San Francisco: San Francisco, CA, USA, 2009. [Google Scholar]
- The City Council of the City of Chicago. Composting Ordinance No. 92607; City of Chicago: Chicago, IL, USA, 2007. [Google Scholar]
- Brighton & Hove City Council. Food Matters Planning Advice Note (PAN) 06: Food Growing and Development; Brighton & Hove City Council: Brighton & Hove, UK, 2011.
- Newsom, G. Healthy and Sustainable Food for San Francisco; Office of the Mayor City & County of San Francisco: San Francisco, CA, USA, 2009. [Google Scholar]
- City and County of Denver. City and County of Denver Zoning Code, Section 59-2; City and County of Denver: Denver, CO, USA, 2008.
- City of Portland. City of Portland Zoning Code, Section 33.296; City of Portland: Portland, OR, USA, 2012.
- City of Madison. Madison Zoning Code, Section 28.151; City of Madison: Madison, WI, USA, 2009. [Google Scholar]
- Los Angeles City Council Office of the City Clerk. Ordinance No. 180103; Los Angeles City Council Office of the City Clerk: Los Angeles, CA, USA, 2008. [Google Scholar]
- State of New York. Food Metrics Bill (S.4061/A.5102); State of New York: Albany, NY, USA, 2013.
- The City of New York. Local Law 52 of 2011 Food Metrics for New York City; The City of New York: New York, NY, USA, 2011.
- The City of New York. FoodWorks: A Vision to Improve NYC’s Food System; The New York City Council: New York, NY, USA, 2010.
- Toronto Public Health. Cultivating Food Connections: Toward a Healthy and Sustainable Food System for Toronto; City of Toronto: Toronto, ON, USA, 2010. [Google Scholar]
- City of Seattle. Seattle Food Action Plan; City of Seattle, Seattle Office of Sustainability and the Environment: Seattle, WA, USA, 2012.
- Chicago Metropolitan Agency for Planning (CMAP). GO TO 2040: Comprehensive Regional Plan; Chicago Metropolitan Agency for Planning: Chicago, IL, USA, 2010.
- Delwiche, A.; Fox, C.; Klein, A.; Landsman, C. Good Food for All Agenda: Creating A New Regional Food System for Los Angeles; Los Angeles Food Policy Task Force: Los Angeles, CA, USA, 2010. [Google Scholar]
- Delaware Valley Regional Planning Commission (DVRPC). Eating Here: Greater Philadephia’s Food System Plan; Delaware Valley Regional Planning Commission: Philadelphia, PA, USA, 2011. [Google Scholar]
- Coleman, J.; Gray, L.V.; Parham, J.; Praetorius, M.; Sigworth, R.; West, S. Managing Maryland’s Growth: Planning for the Food System; Maryland Department of Planning: Baltimore, MD, USA, 2012.
- US Census Bureau. 2016 Population Estimates; US Department of Commerce (DOC): Washington, DC, USA, 2016.
- Statistics Canada. 2011 Census of Population. Available online: http://www12.statcan.gc.ca/census-recensement/2011/dp-pd/prof/index.cfm?Lang=E (accessed on 3 September 2017).
- US Department of Commerce. Real GDP by Metropolitan Area for 2014. Available online: https://www.bea.gov/regional/index.htm (accessed on 2 September 2017).
- City of Toronto. Economic Indicators for Greater Toronto Area (GTA) and Census Metropolitan Area (CMA); City of Toronto: Toronto, ON, USA, 2015. [Google Scholar]
- World Bank GDP (current US$). Available online: https://data.worldbank.org/ (accessed on 2 September 2017).
- US Census Bureau. 2013 American Community Survey. Available online: https://factfinder.census.gov (accessed on 27 August 2017).
- CDC. 2010 Behavioral Risk Factor Surveillance System. Available online: https://www.cdc.gov/brfss/annual_data (accessed on 27 August 2017).
- Statistics Canada Canadian Community Health Survey (Cycle 2013/14). Available online: http://www.statcan.gc.ca/eng/survey/household/3226 (accessed on 31 August 2017).
- Statistics Canada. 2006 Census of Agriculture. Available online: http://www.statcan.gc.ca/ca-ra2006/index-eng.htm (accessed on 3 September 2017).
- USDA/NASS. 2012 Census of Agriculture. Available online: https://agcensus.usda.gov/Publications/2012 (accessed on 27 August 2017).
- The Department of Sanitation of New York (DSNY). NYC Curbside Waste Characterization Study; The Department of Sanitation of New York: New York, NY, USA, 2013.
- Chicago Department of the Environment. Waste Characterization Study; City of Chicago: Chicago, IL, USA, 2010. [Google Scholar]
- Sanitation Department of Public Works. Fact Sheet: Waste Generation and Disposal Projections; City of Los Angeles: Los Angeles, CA, USA, 2006. [Google Scholar]
- Philadelphia Streets Department Philadelphia Municipal Solid Waste (MSW) 2014. Available online: http://www.philadelphiastreets.com/images/uploads/documents/swrac_goals_comm_handout_dec_2015.pdf (accessed on 2 September 2017).
- Solid Waste Management Services. Toronto: Long Term Waste Management Strategy; City of Toronto: Toronto, ON, Canada, 2016. [Google Scholar]
- Miles, M.B.; Huberman, A.M. Qualitative Data Analysis; Sage: Thousand Oaks, CA, USA, 1994. [Google Scholar]
- United Nations. Transforming Our World: The 2030 Agenda for Sustainable Development; A/RES/70/1; United Nations: New York, NY, USA, 2015. [Google Scholar]
- Gilchrist, M.J.; Greko, C.; Wallinga, D.B.; Beran, G.W.; Riley, D.G.; Thorne, P.S. The potential role of concentrated animal feeding operations in infectious disease epidemics and antibiotic resistance. Environ. Health Perspect. 2007, 115, 313–316. [Google Scholar] [CrossRef] [PubMed]
- Heederik, D.; Sigsgaard, T.; Thorne, P.S.; Kline, J.N.; Avery, R.; Bønløkke, J.H.; Chrischilles, E.A.; Dosman, J.A.; Duchaine, C.; Kirkhorn, S.R.; et al. Health effects of airborne exposures from concentrated animal feeding operations. Environ. Health Perspect. 2007, 115, 298–302. [Google Scholar] [CrossRef] [PubMed]
- Burkholder, J.A.; Libra, B.; Weyer, P.; Heathcote, S.; Kolpin, D.; Thorne, P.S.; Wichman, M. Impacts of waste from concentrated animal feeding operations on water quality. Environ. Health Perspect. 2007, 115, 308–312. [Google Scholar] [CrossRef] [PubMed]
- Stoate, C.; Báldi, A.; Beja, P.; Boatman, N.D.; Herzon, I.; van Doorn, A.; de Snoo, G.R.; Rakosy, L.; Ramwell, C. Ecological impacts of early 21st century agricultural change in Europe—A review. J. Environ. Manag. 2009, 91, 22–46. [Google Scholar] [CrossRef] [PubMed]
- Kessler, J.J.; Rood, T.; Tekelenburg, T.; Bakkenes, M. Biodiversity and Socioeconomic Impacts of Selected Agro-Commodity Production Systems. J. Environ. Dev. 2007, 16, 131–160. [Google Scholar] [CrossRef]
- Tscharntke, T.; Klein, A.M.; Kruess, A.; Steffan-Dewenter, I.; Thies, C. Landscape perspectives on agricultural intensification and biodiversity - Ecosystem service management. Ecol. Lett. 2005, 8, 857–874. [Google Scholar] [CrossRef]
- UN Statistical Commision; Inter-Agency and Expert Group on Sustainable Development Goal Indicators. Annex III: Revised list of global Sustainable Development Goal indicators; United Nations Statistics Division: New York, NY, USA, 2017. [Google Scholar]
- The Chicago Food Policy Advisory Council; The City of Chicago. Food Systems Report; The Chicago Community Trust: Chicago, IL, USA, 2009. [Google Scholar]
- The Chicago Food Policy Advisory Council. Hunger Report; The Chicago Community Trust: Chicago, IL, USA, 2009. [Google Scholar]
- City of Chicago. A Recipe for Healthy Places: Addressing the Intersection of Food and Obesity in Chicago; City of Chicago Department of Housing and Economic Development: Chicago, IL, USA, 2013. [Google Scholar]
- Sachs, J. The End of Poverty: Economic Possibilities for Our Time; Penguin Books: New York, NY, USA, 2005. [Google Scholar]
- Fisher, J.A.; Patenaude, G.; Giri, K.; Lewis, K.; Meir, P.; Pinho, P.; Rounsevell, M.D.A.; Williams, M. Understanding the relationships between ecosystem services and poverty alleviation: A conceptual framework. Ecosyst. Serv. 2014, 7, 34–45. [Google Scholar] [CrossRef]
- Walker, R.E.; Keane, C.R.; Burke, J.G. Disparities and access to healthy food in the United States: A review of food deserts literature. Health Place 2010, 16, 876–884. [Google Scholar] [CrossRef] [PubMed]
- New York City Mayor’s Office of Recovery and Resiliency. Five Borough Food Flow: 2016 New York City Food Distribution & Resiliency Study Results; New York City Mayor’s Office of Recovery and Resiliency: New York, NY, USA, 2016.
- Hingorani, A.; Chau, H.-F. Los Angeles Food System Snapshot 2013: A Baseline Report of the Los Angeles Regional Foodshed; Los Angeles Food Policy Council: Los Angeles, CA, USA, 2013. [Google Scholar]
- Teitel-Payne, R.; Kuhns, J.; Nasr, J. Urban Agriculture Indicators; Toronto Urban Growers: Toronto, ON, Canada, 2016. [Google Scholar]
- Hamm, M.W.; Bellows, A.C. Community Food Security and Nutrition Educators. J. Nutr. Educ. Behav. 2003, 35, 37–43. [Google Scholar] [CrossRef]
- LeClair, M.S.; Aksan, A.-M. Redefining the food desert: Combining GIS with direct observation to measure food access. Agric. Human Values 2014, 31, 537–547. [Google Scholar] [CrossRef]
- Blanchard, T.C.; Matthews, T.L. Retail Concentration, Food Deserts, and Food-Disadvantaged Communities in Rural America. In Remaking the North American Food System: Strategies for Sustainability (Our Sustainable Future); Hinrichs, C.C., Lyson, T.A., Eds.; University of Nebraska Press: Lincoln, NE, USA, 2007. [Google Scholar]
- Fielding, J.E.; Simon, P.A. Food deserts or food swamps?: Comment on “Fast food restaurants and food stores.”. Arch. Intern. Med. 2011, 171, 1171–1172. [Google Scholar] [CrossRef] [PubMed]
- Lake, A.; Townshend, T. Obesogenic environments: Exploring the built and food environments. J. R. Soc. Promot. Health 2006, 126, 262–267. [Google Scholar] [CrossRef] [PubMed]
- Cutts, B.B.; Darby, K.J.; Boone, C.G.; Brewis, A. City structure, obesity, and environmental justice: An integrated analysis of physical and social barriers to walkable streets and park access. Soc. Sci. Med. 2009, 69, 1314–1322. [Google Scholar] [CrossRef] [PubMed]
- Feng, J.; Glass, T.A.; Curriero, F.C.; Stewart, W.F.; Schwartz, B.S. The built environment and obesity: A systematic review of the epidemiologic evidence. Health Place 2010, 16, 175–190. [Google Scholar] [CrossRef] [PubMed]
- Hoyland, A.; Dye, L.; Lawton, C.L. A systematic review of the effect of breakfast on the cognitive performance of children and adolescents. Nutr. Res. Rev. 2009, 22, 220. [Google Scholar] [CrossRef] [PubMed]
- Rampersaud, G.C.; Pereira, M.A.; Girard, B.L.; Adams, J.; Metzl, J.D. Breakfast habits, nutritional status, body weight, and academic performance in children and adolescents. J. Am. Diet. Assoc. 2005, 105, 743–760. [Google Scholar] [CrossRef] [PubMed]
- Fuwa, M. Macro-level Gender Inequality and the Division of Household Labor in 22 Countries. Am. Sociol. Rev. 2004, 69, 751–767. [Google Scholar] [CrossRef]
- Agarwal, B. Food Crises and Gender Inequality; DESA Working Paper; United Nations Department of Economic and Social Affair: New York, NY, USA, 2011.
- Platt, R.H.; Barten, P.; Pfeffer, M.J. A Full, Clean Glass? Managing New York City’s Watersheds. Environment 2000, 42, 9–20. [Google Scholar] [CrossRef]
- Barilla Center for Food & Nutrition. Cambiamento Climatico, Agricoltura e Alimentazione; Barilla Center for Food & Nutrition: Parma, Italy, 2009. [Google Scholar]
- Bazilian, M.; Rogner, H.; Howells, M.; Hermann, S.; Arent, D.; Gielen, D.; Steduto, P.; Mueller, A.; Komor, P.; Tol, R.S.J.; et al. Considering the energy, water and food nexus: Towards an integrated modelling approach. Energy Policy 2011, 39, 7896–7906. [Google Scholar] [CrossRef]
- Donald, B. Food Systems Planning and Sustainable Cities and Regions: The Role of the Firm in Sustainable Food Capitalism. Reg. Stud. 2008, 42, 1251–1262. [Google Scholar] [CrossRef]
- Donald, B.; Blay-Palmer, A. The urban creative-food economy: Producing food for the urban elite or social inclusion opportunity? Environ. Plan. A 2006, 38, 1901–1920. [Google Scholar] [CrossRef]
- Urban Design Lab. Infrastructure-Health. Modeling Production, Processing and Distribution Infrastructure for A Resilient Regional Food System; Columbia University: New York, NY, USA, 2011. [Google Scholar]
- Halweil, B. Home Grown: The Case for Local Food in a Global Market; Worldwatch Institute: Washinton, DC, USA, 2002; ISBN 1878071661. [Google Scholar]
- Horst, M.; Ringstrom, E.; Tyman, S.; Ward, M.; Werner, V.; Born, B. Toward a more expansive understanding of food hubs. J. Agric. Food Syst. Community Dev. 2011, 2, 209–225. [Google Scholar] [CrossRef]
- Blay-Palmer, A.; Landman, K.; Knezevic, I. Constructing resilient, transformative communities through sustainable “food hubs.”. Local Environ. Int. J. Justice Sustain. 2013, 18, 521–528. [Google Scholar] [CrossRef]
- Baroni, L.; Cenci, L.; Tettamanti, M.; Berati, M. Evaluating the environmental impact of various dietary patterns combined with different food production systems. Eur. J. Clin. Nutr. 2007, 61, 279–286. [Google Scholar] [CrossRef] [PubMed]
- Hall, K.D.; Guo, J.; Dore, M.; Chow, C.C. The progressive increase of food waste in America and its environmental impact. PLoS ONE 2009, 4, 9–14. [Google Scholar] [CrossRef] [PubMed]
- Bowman, S.A.; Vinyard, B.T. Fast Food Consumption of U.S. Adults: Impact on Energy and Nutrient Intakes and Overweight Status. J. Am. Coll. Nutr. 2004, 23, 163–168. [Google Scholar] [CrossRef] [PubMed]
- Urban School Food Alliance New York, Chicago, Los Angeles, Miami, Dallas, Orlando, and Fort Lauderdale Will Coordinate Menus to Improve Purchasing Power from Food Providers. Available online: https://www.urbanschoolfoodalliance.org/ (accessed on 20 August 2017).
- Pielke, R.A.; Mahmood, R.; McAlpine, C. Land’s complex role in climate change. Phys. Today 2016, 69, 40–46. [Google Scholar] [CrossRef]
- Baptista, A. Thinking Big on Climate Change. Available online: http://www.huffingtonpost.com/anabaptista/%0Athinkingbigonclimatec_%0Ab_9311328.html (accessed on 9 November 2016).
- Rosenzweig, C.; Solecki, W.; Romero-Lankao, P.; Mehrotra, S.; Dhakal, T.B.; Ibrahim, S.A. Climate Change and Cities: Second Assessment Report of the Urban Climate Change Research Network; Columbia University: New York, NY, USA, 2015. [Google Scholar]
- Johnson, R.; Cody, B.A. California Agricultural Production and Irrigated Water Use; Congressional Research Service: Washington, DC, USA, 2015.
- Bulleri, F.; Chapman, M.G. The introduction of coastal infrastructure as a driver of change in marine environments. J. Appl. Ecol. 2010, 47, 26–35. [Google Scholar] [CrossRef]
- Billion Oyster Project. Available online: https://www.billionoysterproject.org/ (accessed on 10 July 2017).
- Yu, Y.; Feng, K.; Hubacek, K. Tele-connecting local consumption to global land use. Glob. Environ. Chang. 2013, 23, 1178–1186. [Google Scholar] [CrossRef]
- Morgan, K.; Sonnino, R. The School Food Revolution: Public Food and the Challenge of Sustainable Development; Earthscan: London, UK, 2008. [Google Scholar]
- Center for a Livable Future Food Policy Council Directory, 2015 Update. [PowerPoint slides]. Available online: https://assets.jhsph.edu/clf/mod_clfResource/doc/FPC_Trends_Slides_2015_10_28.pdf (accessed on 12 Novermber 2015).
- Raja, S. Why All Cities Should Have a Department of Food. Available online: http://theconversation.com/why-all-cities-should-have-a-department-of-food-39462 (accessed on 10 December 2015).
- Winne, M. Food System Planning: Setting the Community’s Table. Available online: http://www.plannersnetwork.org/2004/01/food-system-planning-setting-the-communitys-table/ (accessed on 23 September 2017).
- New York City Mayor’s Office of Food Policy. Food Metrics Report; The City of New York: New York, NY, USA, 2016.
- Forester, J. Planning in the Face of Power; University of California Press: Berkeley, CA, USA, 1989; ISBN 0520064135. [Google Scholar]
- Taras, H. Nutrition and student performance at school. J. Sch. Health 2005, 75, 199–213. [Google Scholar] [CrossRef] [PubMed]
- United Nations. New Urban Agenda; United Nations - Habitat III: Quito, Equador, 2017; ISBN 9789211327311. [Google Scholar]
- Sachs, J.; Schmidt-Traub, G.; Kroll, C.; Durand-Delacre, D.; Teksoz, K. Global Responsibilities: International Spillovers in Achieving the Goals; Bertelsmann Stiftung and Sustainable Development Solutions Network (SDSN): New York, NY, USA, 2017. [Google Scholar]
- Mbow, C.; Neely, C.; Dobie, P. How can an integrated landscape approach contribute to the implementation of the Sustainable Development Goals (SDGs) and advance climate-smart objectives? In Climate-Smart Landscapes: Multifunctionality in Practice; Minang, P.A., van Noordwijk, M., Freeman, O.E., Mbow, C., de Leeuw, J., Catacutan, D., Eds.; World Agroforestry Centre (ICRAF): Nairobi, Kenya, 2015; pp. 103–117. [Google Scholar]
- Castelazo, J. R. Institutional leadership and the Sustainable Development Goals. In Ensuring effective implementation of the Sustainable Development Goals: Leadership, Action and Means; United Nations Economic and Social Council: New York, NY, USA, 2017; pp. 1–22. [Google Scholar]
- Lucci, P. SDGs: Five Challenges for City Leaders. Available online: https://www.odi.org/comment/10038-sdgs-five-challenges-city-leaders (accessed on 23 September 2017).
- Simon, D.; Arfvidsson, H.; Anand, G.; Bazaz, A.; Fenna, G.; Foster, K.; Jain, G.; Hansson, S.; Evans, L.M.; Moodley, N.; et al. Developing and testing the Urban Sustainable Development Goal’s targets and indicators—A five-city study. Environ. Urban 2016, 28, 49–63. [Google Scholar] [CrossRef]
- Revi, A.; Rosenzweig, C. The Urban Opportunity: Enabling Transformative and Sustainable Development; Sustainable Development Solutions Network (SDSN): New York, NY, USA, 2013. [Google Scholar]
- Elgert, L.; Krueger, R. Modernising sustainable development? Standardisation, evidence and experts in local indicators. Local Environ. Int. J. Justice Sustain. 2012, 17, 561–571. [Google Scholar] [CrossRef]
- Waage, J.; Yap, C.; Bell, S.; Levy, C.; Mace, G.; Pegram, T.; Unterhalter, E.; Dasandi, N.; Hudson, D.; Kock, R.; et al. Thinking Beyond Sectors for Sustainable Development. In Thinking Beyond Sectors for Sustainable Development; Ubiquity Press: London, UK, 2015; pp. 79–88. ISBN 9781909188426. [Google Scholar]
- Spangenberg, J.H. Hot Air or Comprehensive Progress? A Critical Assessment of the SDGs. Sustain. Dev. 2017, 25, 311–321. [Google Scholar] [CrossRef]
- Morgan, K. Local and green, global and fair: The ethical foodscape and the politics of care. Environ. Plan. A 2010, 42, 1852–1867. [Google Scholar] [CrossRef]
- Roberts, W. Food for City Building: A Field Guide for Planners, Actionists & Entrepreneurs; Hypenotic Inc.: Toronto, ON, Canada, 2014. [Google Scholar]
- Reynolds, K.; Cohen, N. Beyond the Kale: Urban Agriculture and Social Justice Activism in New York City; University of Georgia Press: Athens, GA, USA, 2016. [Google Scholar]
- Pothukuchi, K.; Kaufman, J.L. Placing the food system on the urban agenda: The role of municipal institutions in food systems planning. Agric. Human Values 1999, 16, 213–224. [Google Scholar] [CrossRef]
- Pothukuchi, K.; Kaufman, J.L. The Food System: A stranger to the planning field. J. Am. Plan. Assoc. 2000, 66, 113–124. [Google Scholar] [CrossRef]
Figure 1.
Food Systems Charters and Strategies issued at the subnational level in developed countries per year from 2001 to 2015. Source: The Author.
Figure 1.
Food Systems Charters and Strategies issued at the subnational level in developed countries per year from 2001 to 2015. Source: The Author.

Figure 2.
Potential synergies between UFSS indicators and the SDGs and their targets and indicators. Source: The Author. Note: The size of each circle reflects the number of UFSS and SDG indicators per SDG target. Targets with more than 8 indicators are represented with the largest circle size. Grey-only intersections represent targets with the same the number of UFSS and SDG indicators. Black-only intersections represent targets with no UFSS indicators. Alphanumerical target numbers were converted to numerical (e.g., Target 1.a is plotted as Target 6) for simplicity of representation.


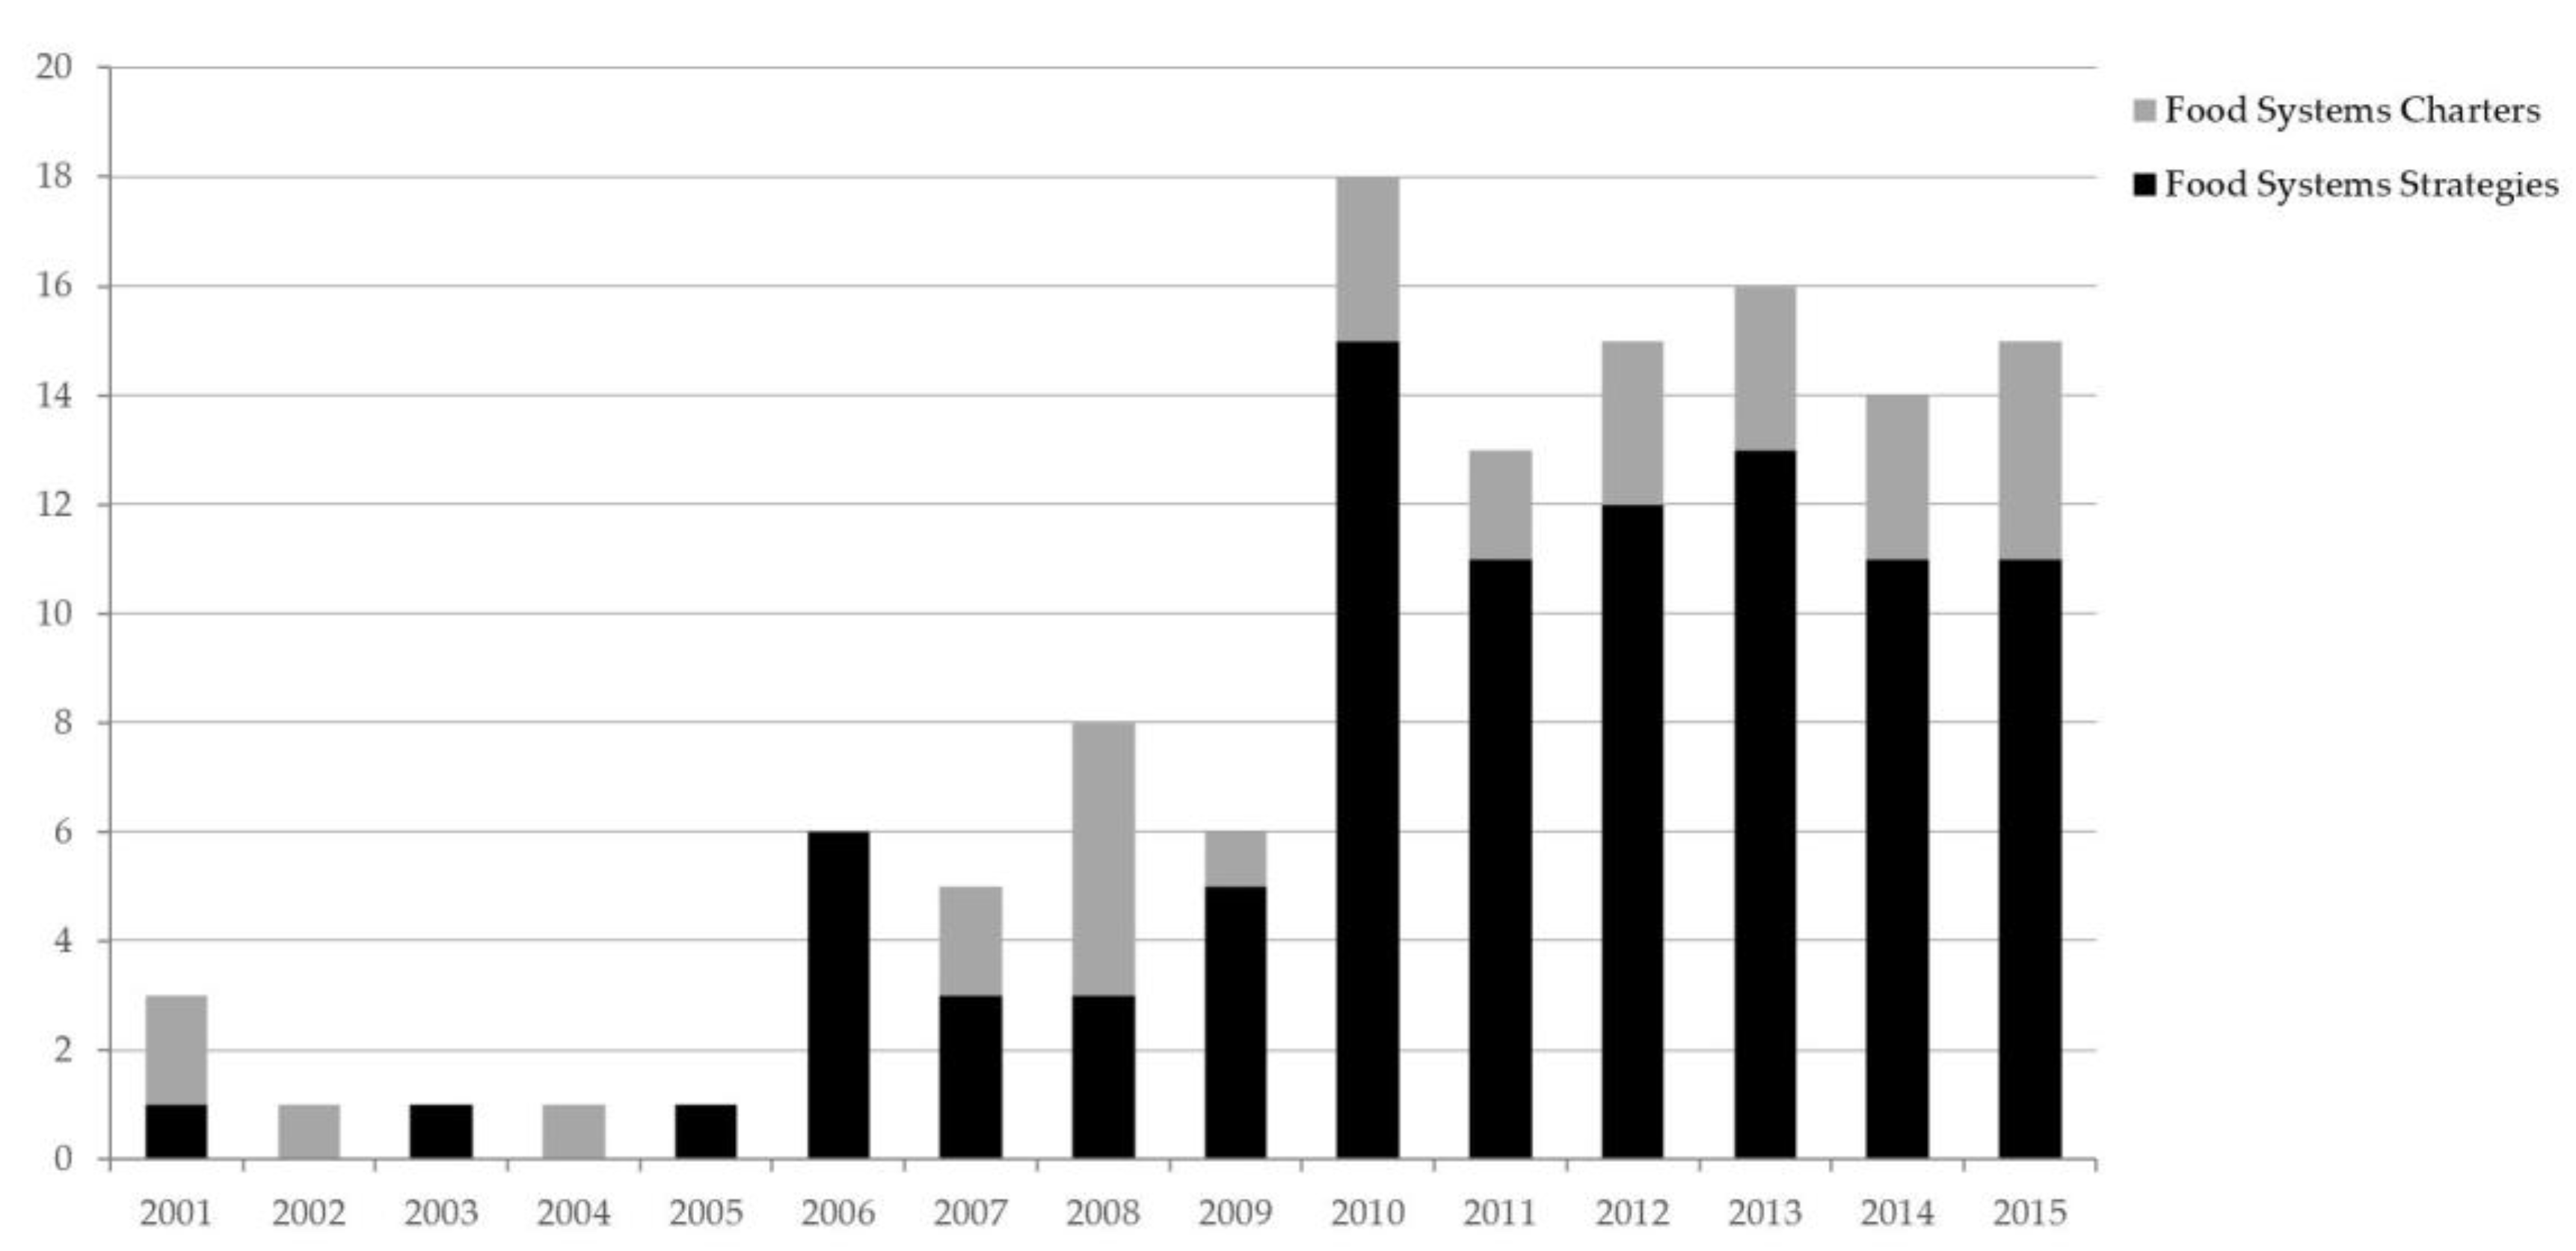
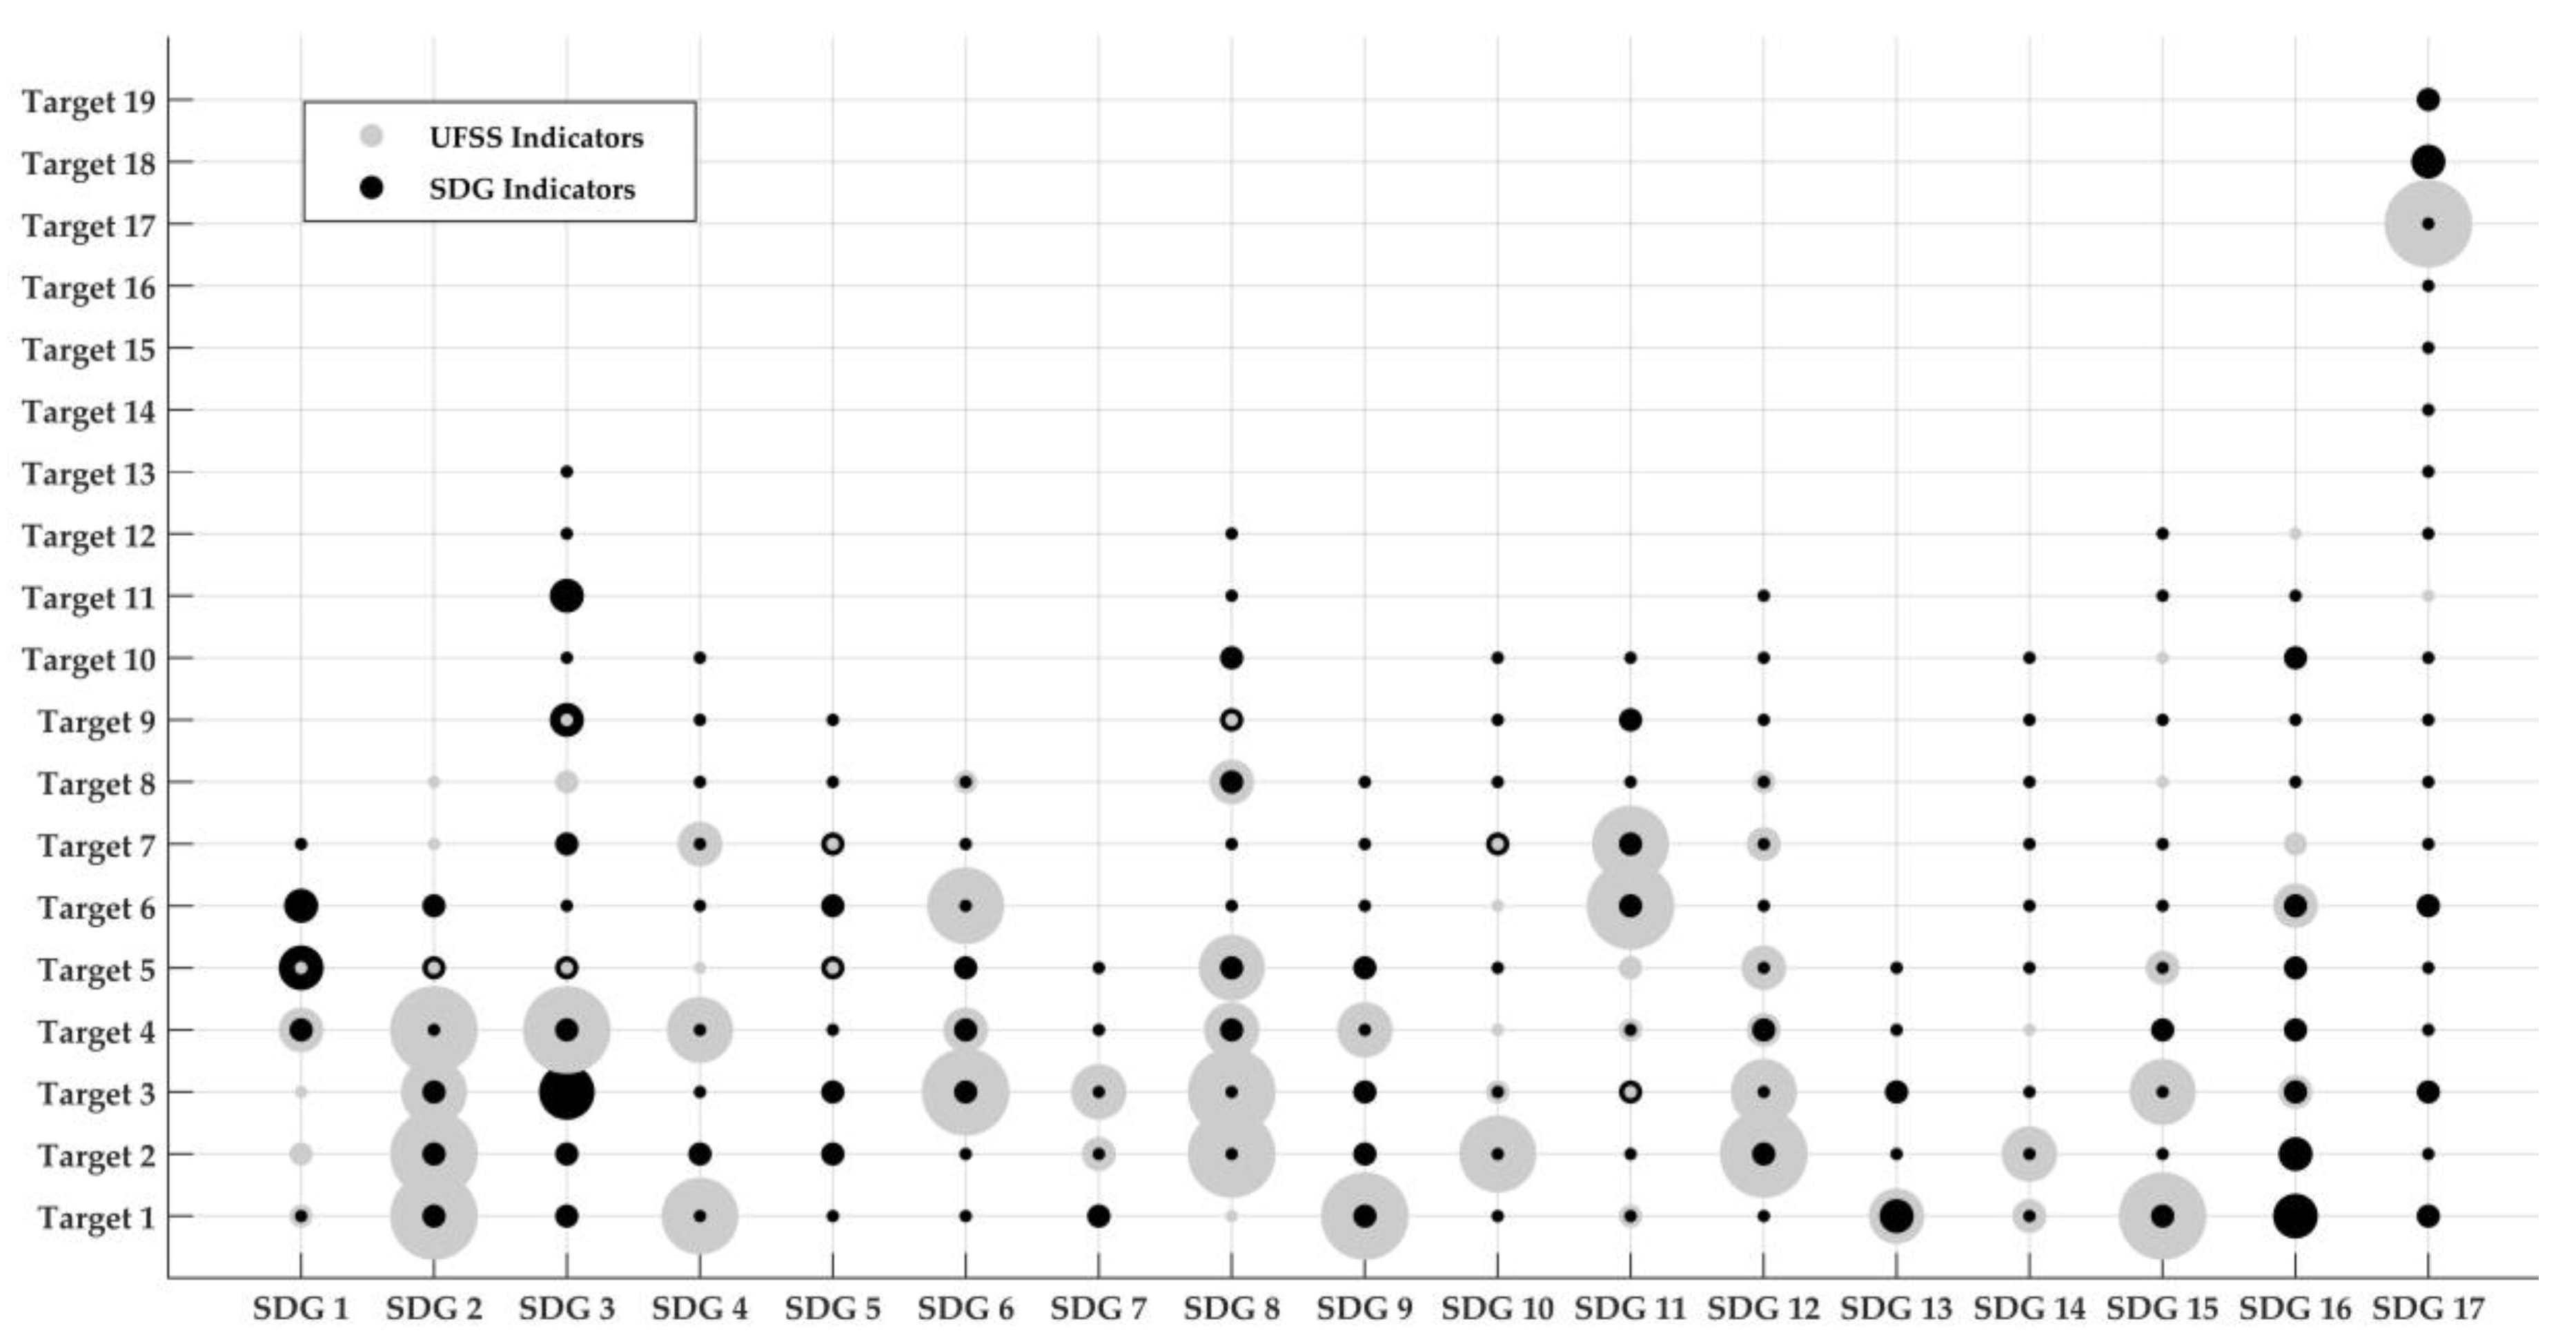
Table 1.
The degree of overlap between the SDGs and the UFSS goals advanced in New York City, Philadelphia, Los Angeles, Chicago, and Toronto.
Table 1.
The degree of overlap between the SDGs and the UFSS goals advanced in New York City, Philadelphia, Los Angeles, Chicago, and Toronto.
| SDG | New York 1 | Philadelphia 2 | Los Angeles 3 | Chicago 4,5 | Toronto 6 |
|---|---|---|---|---|---|
| SDG 1: No poverty | ●● | ●● | ●● | ●● | ●● |
| SDG 2: No hunger | ●●● | ●●● | ●●● | ●●● | ●●● |
| SDG 3: Good health | ●●● | ●●● | ●●● | ●●● | ●●● |
| SDG 4: Quality education | ●●● | ●●● | ●● | ●●● | ●●● |
| SDG 5: Gender equality | ● | ● | ● | – | – |
| SDG 6: Clean water and sanitation | ●●● | ●●● | ●●● | ●● | ● |
| SDG 7: Renewable energy | ●●● | ●●● | ● | ●● | ● |
| SDG 8: Good jobs and economic growth | ●●● | ●●● | ●●● | ●●● | ●●● |
| SDG 9: Innovation and infrastructure | ●●● | ●●● | ●●● | ●●● | ●●● |
| SDG 10: Reduced inequalities | ●● | ●●● | ●●● | ●● | ●● |
| SDG 11: Sustainable cities | ●●● | ●●● | ●●● | ●●● | ●●● |
| SDG 12: Sustainable consumption and production | ●●● | ●●● | ●●● | ●●● | ●●● |
| SDG 13: Climate action | ● | ● | ●● | ● | ● |
| SDG 14: Life below water | ● | ●● | – | ● | ● |
| SDG 15: Life on land | ●●● | ●●● | ●● | ●●● | ●● |
| SDG 16: Peace and justice | – | ●●● | ●● | – | – |
| SDG 17: Partnerships for the goals | ● | ●●● | ●●● | ●●● | ●● |
Legend: (●●●) The SDG is present as an explicit goal/objective and supported by proposals for two or more concrete actions; (●●) The SDG is an explicit goal/objective or is extensively addressed as a subpart of another goal/objective; (●) The SDG is only mentioned in passing or constitutes a small subpart of a goal/objective; (–) There is no explicit mention of this SDG. Sources: 1 FoodWorks (2010) [36]; 2 Eating Here Food System Plan (2011) [41]; 3 The Good Food for All Agenda (2010) [40]; 4 GO TO 2040, Food Systems Report and Hunger Report (2009) [67,68], 5 A Recipe for Healthy Places (2013) [69], 6 Cultivating Food Connections (2010) [37].
Table 2.
Some of the SDG 1-related indicators in urban food systems strategies (UFSS) or reports.
| SDG | Theme | UFSS Indicator |
|---|---|---|
| SDG 1: No poverty | General | Percentage of population in poverty (100% FPL) and in extreme poverty (50% FPL) 4b |
| Cost of living index 4a | ||
| Consumer Price Index (CPI) in urban areas per type of consumer goods 2 | ||
| Average hourly living wage for household with two adults and one child in the urban foodshed 3 | ||
| Ratio of population receiving services to need 4b | ||
| Concentration of areas of extreme high poverty/low program enrollment 4a | ||
| Food system | Cost of food as a percentage of income (and by age) 4a | |
| Mean salary by food sector job type 1b,3 | ||
| Median hourly wages by occupation in the food sector 3 | ||
| Percentage of food system workers using government food assistance compared to general population usage 3 | ||
| Percent of students eligible for free lunch 2 | ||
| Number of people who the farm/garden has trained in employment-related skills 5b | ||
| Number of people trained by urban agriculture organizations per population subset 5b |
Source from which the metric or indicator was derived: 1b New York City Five Borough Food Flow (2016) [73]; 2 Greater Philadelphia Eating Here Food System Plan (2011); 3 Los Angeles Food System Snapshot (2013) [74]; 4a Chicago GO TO 2040, Food Systems Report (2009), 4b Chicago GO TO 2040, Hunger Report (2009); 5b Toronto Urban Agriculture Indicators (2016) [75].
Table 3.
Some of the SDG 2-related indicators in urban food systems strategies or reports.
| SDG | Theme | UFSS Indicator |
|---|---|---|
| SDG 2: No Hunger, Improved Nutrition, and Sustainable Agriculture | Food affordability | Food Price Index 4b |
| Percent change in consumer price index of food relative to percent change in wages 4a | ||
| Cost of food as a percentage of income (and by age) 4a | ||
| Food insecure households | Percent of population that are food insecure or hungry 2,4b | |
| Percent of population who are accessing food services by age, gender, income, employment status, and ethnicity 4b | ||
| Missing meals per person for each neighborhood tabulation area 1a | ||
| Number of low-income adults in the county who are food insecure 3 | ||
| Number of households suffering from food insecurity compared to total population 2 | ||
| Number of children eligible for free or reduced-price school meals 3 | ||
| Rate of food insecurity among food system workers compared to general population 3 | ||
| Food assistance programs | Number of emergency food assistance programs 5a | |
| Communities with documented lack of nutrition assistance programs (school programs, summer food programs, women, children, and infants program sites, pantries) 4b | ||
| Number of seniors receiving government nutrition assistance benefits 1a | ||
| Rate of participation in emergency food programs 4b | ||
| Rate of participation in government nutrition assistance programs in the county (percent of eligible residents receiving benefits) and as compared to all counties in the state 3 | ||
| Percentage of potentially eligible population receiving food stamps 4b | ||
| Dollar amount of government nutrition assistance benefits lost due to underutilization 3 | ||
| Funds spent on enrollment in federal nutrition assistance programs by local agencies 1a | ||
| Physical infrastructure and access to affordable, fresh, and nutritious food | Number of food pantries 4a | |
| Number of community kitchens 5a | ||
| Number of persons served by pantries and soup kitchens 4b | ||
| Number of farmers’ markets accepting federal healthy food subsidies 3 | ||
| Percentage of farmers’ markets accepting healthy food purchasing vouchers for recipients of federal nutrition assistance benefits 3 | ||
| Number of healthy food vouchers issued for seniors making purchases at farmers markets 3 | ||
| Agricultural productivity and infrastructure | Amount of food produced in the region 4a | |
| Number of farms in the foodshed 3 | ||
| Median farm size in the local jurisdiction 3 | ||
| Median farm size in the foodshed 3 | ||
| Percentage of large farms in the foodshed (>500 acres) 3 | ||
| Percentage of mid-sized farms in the foodshed (180–499 acres) 3 | ||
| Percentage of small farms in the foodshed (<180 acres) 3 | ||
| Animal welfare and humane animal husbandry | Average number of cattle per farm 3 | |
| Average number of dairy cows per farm 3 | ||
| Average number of hogs per farm 3 | ||
| Average number of broilers (chickens) and layers (egg-laying hens) per farm 3 | ||
| Sustainable agriculture | Acres of farmland in organic production 2 | |
| Number of certified organic farms in the foodshed 3 | ||
| Agricultural applied water use in the foodshed 3 | ||
| Percent of agricultural water usage coming from rainfall in the foodshed 3 | ||
| Number of urban agriculture projects using efficient watering practices 5b | ||
| See also Table 2, Table 7, Table 11, Table 13, Table 14, Table 16 (SDGs 1, 6, 10, 12, 13, 15) |
Source from which the metric or indicator was derived: 1a New York City Food System Metrics Report (2016); 2 Greater Philadelphia Eating Here Food System Plan (2011); 3 Los Angeles Food System Snapshot (2013); 4a Chicago GO TO 2040, Food Systems Report (2009), 4b Chicago GO TO 2040, Hunger Report (2009); 5a Toronto Food by Ward: Food Assets and Opportunities (2016), 5b Toronto Urban Agriculture Indicators (2016).
Table 4.
Some of the SDG 3-related indicators in urban food systems strategies or reports.
| SDG | Theme | UFSS Indicator |
|---|---|---|
| SDG 3: Good Health | Population Health | Percent of adults who are overweight or obese 2,3,4b |
| Low-income pre-school obesity rate 2 | ||
| Percentage of 4-year-old participants in government nutrition assistance programs who are obese or overweight 3 | ||
| Percentage of children in grades 5, 7, and 9 who are obese 3 | ||
| Diabetes death rate (age-adjusted) per 100,000 population 3,4b | ||
| Coronary heart disease rate (age-adjusted) per 100,000 population 3,4b | ||
| Percentage of non-supervisory food system workers with health insurance 3 | ||
| Healthy nutrition and living practices | Food expenditures for home consumption for statistical area per category (cereals, meats, poultry, fish, fruits and vegetables, dairy, and other) 2 | |
| Percentage of adults who eat at least five servings of fruits and vegetables a day 3,4b | ||
| Percentage of children who eat fast food at least once a week 3 | ||
| Percentage of adults who eat fast food at least once a week 3 | ||
| Percentage of children and teens who reported drinking at least one soda or sweetened drink a day 3 | ||
| Number of people participating in urban agriculture 5b | ||
| Amount of time spent in urban agriculture activities 5b | ||
| Programs and institutions | Percentage of non-supervisory food system workers with health insurance 3 | |
| Percentage compliance with food standards for public institutions 1a | ||
| Amount of city incentives for healthy vending 3 | ||
| Gardening programs in hospitals, schools, churches, housing 3 | ||
| Number of senior food programs 4a | ||
| Ratio of population receiving services to need 4b | ||
| Physical infrastructure | Accessibility to local department of health services offices 4a | |
| Number of salad bars in schools 1a | ||
| Number of salad bars in hospitals 1a | ||
| Number of healthy mobile food carts permits, number of violations, locations, and number of operators that accept EBT 1a,5a | ||
| Percent of mobile food vendors graded ‘A’ by the Department of Public Health 3 | ||
| Number of grocery stores receiving government-sponsored healthy retail benefits 1a | ||
| Percentage of farmers markets at which food assistance programs are available in the county and in the city 3 | ||
| Number of stores that sell fresh produce or specialize in a food group recognized as healthy by government 5a | ||
| Number of fast food restaurants per 1000 People 2,3 | ||
| Number of liquor stores 3 |
Source from which the metric or indicator was derived: 1a New York City Food System Metrics Report (2016); 2 Greater Philadelphia Eating Here Food System Plan (2011); 3 Los Angeles Food System Snapshot (2013); 4a Chicago GO TO 2040, Food Systems Report (2009), 4b Chicago GO TO 2040, Hunger Report (2009); 5a Toronto Food by Ward: Food Assets and Opportunities (2016), 5b Toronto Urban Agriculture Indicators (2016).
Table 5.
Some of the SDG 4-related indicators in urban food systems strategies or reports.
| SDG | Theme | UFSS Indicator |
|---|---|---|
| SDG 4: Quality education | Effective learning environment | High school lunch participation rate 3 |
| Number of students participating in the school lunch program as a fraction of all eligible students 3 | ||
| Participation in school breakfast/lunch program 4b | ||
| Percentage of low-income students who eat breakfast in school daily 3 | ||
| Number of students served/day in student nutrition programs 5a | ||
| Number of locations offering student nutrition programs 5a | ||
| Number of farm-to-school programs 3,4a | ||
| Number of school gardens 3 | ||
| Nutrition education | Funds spent on nutrition education by city agencies and per program (farmers markets initiatives, school initiatives, government offices initiatives) 1a | |
| Job-ready skills and training | Mean education by food sector job type 1b | |
| Number of food-related job training programs 1a | ||
| Number of urban agriculture programs offering training in employment-related skills 5b | ||
| Number of types of skills taught by urban agriculture projects 5b |
Source from which the metric or indicator was derived: 1a New York City Food System Metrics Report (2016), 1b New York City Five Borough Food Flow (2016); 3 Los Angeles Food System Snapshot (2013); 4a Chicago GO TO 2040, Food Systems Report (2009), 4b Chicago GO TO 2040, Hunger Report (2009); 5a Toronto Food by Ward: Food Assets and Opportunities (2016), 5b Toronto Urban Agriculture Indicators (2016).
Table 6.
Some of the SDG 5-related indicators in urban food systems strategies or reports.
| SDG | Theme | UFSS Indicator |
|---|---|---|
| SDG 5: Gender equality | Leadership | Number of women-operated farms in the urban foodshed 3 |
| Food access | Percent of farmers markets accepting benefits of supplemental nutrition programs for women, infants, and children 1 | |
| Participation rate in women-centered and general nutrition assistance programs 4b | ||
| Number of low-income farmers markets clients who are pregnant women, lactating mothers, or mothers with children ages 2–4 1a,4a | ||
| Percent of population who are accessing food services by age, gender, income, employment status, and ethnicity 4b | ||
| Number of languages in which the book of vendors accepting government benefits for nutrition assistance of women, infants, and children is translated 1 |
Source from which the metric or indicator was derived: 1 New York City FoodWorks (2010), 1a New York City Food System Metrics Report (2016); 3 Los Angeles Food System Snapshot (2013); 4a Chicago GO TO 2040, Food Systems Report (2009), 4b Chicago GO TO 2040, Hunger Report (2009).
Table 7.
Some of the SDG 6-related indicators in urban food systems strategies or reports.
| SDG | Theme | UFSS Indicator |
|---|---|---|
| SDG 6: Clean water and sanitation | Extent of water pollution | Average levels of nitrate in runoff from agriculture detected 3 |
| Potential sources of water pollution | Pesticide usage in the urban foodshed in agriculture as percentage of total usage 3 | |
| Total tons of pesticides applied in the urban foodshed 3 | ||
| Number of urban agriculture projects using organic pest control methods 5b | ||
| Chemical application records from individual farmers 4a | ||
| Prevention practices | Number of farms participating in government-sponsored watershed preservation agricultural programs 1a | |
| Annual dollar amount of financial support provided to farms for watershed preservation by local administrations 1a | ||
| Number of urban agriculture projects collecting rainwater 5b |
Source from which the metric or indicator was derived: 1a New York City Food System Metrics Report (2016); 3 Los Angeles Food System Snapshot (2013); 4a Chicago GO TO 2040, Food Systems Report (2009); 5b Toronto Urban Agriculture Indicators (2016).
Table 8.
Some of the SDG 7-related indicators in urban food systems strategies or reports.
| SDG | Theme | UFSS Indicator |
|---|---|---|
| SDG 7: Renewable energy | Resiliency | Extent of backup power resources and adoption of resiliency measures across the food supply distribution network 1b |
| Production | Number of food manufacturers participating in energy efficiency programs 1 | |
| Number of alternative energy systems (solar, wind, biomass) installed on farms 2 | ||
| Transportation | Environmental impacts of food transportation 4a | |
| Percent of alternative food transportation vehicles using renewable energy sources compared to total food transportation vehicles 1 | ||
| Per unit impact of the type of food transportation involved, the energy efficiency of the vehicles used, and the distance traveled 1 | ||
| Number of optimized food distribution routes within the region and the city 1 | ||
| Average miles food supplied to the city travels 3 | ||
| Volume of produce grown for local processing and consumption 4a | ||
| Storage | Number of new energy-efficient refrigeration units installed 1 |
Source from which the metric or indicator was derived: 1 New York City FoodWorks (2010), 1b New York City Five Borough Food Flow (2016); 2 Greater Philadelphia Eating Here Food System Plan (2011); 3 Los Angeles Good Food Agenda (2010); 4a Chicago GO TO 2040 Food Systems Report (2009).
Table 9.
Some of the SDG 8-related indicators in urban food systems strategies or reports.
| SDG | Theme | UFSS Indicator |
|---|---|---|
| SDG 8: Good jobs and economic growth | Jobs | Number of jobs per food-related employment category 2 |
| Number of people employed in the food system per year and as a percentage of total employment 3,4a | ||
| Number of direct jobs offered by local food hubs 1b | ||
| Types of food sector jobs at risk of being automated 1b | ||
| Thriving businesses | Percentage of local farms reporting net losses per year 2 | |
| Number of local farms reporting net gains and number of local farms reporting net losses 2 | ||
| Net cash farm income 4a | ||
| Number of food business incubators 1,5 | ||
| Market | Estimates of economic activity generated by local food purchases 2 | |
| Percentage contribution of food production and distribution to the regional economy 2 | ||
| Amount of money spent on food in the state 4a | ||
| Total fruit and vegetable production value in the 100-mile foodshed 2,3 | ||
| Value of agricultural sales by type (commodity, specialty, dairy) 4a | ||
| Value of food purchases in the region per year 2 | ||
| Top three agricultural products by county as percentage of total agricultural value 3 | ||
| Projected increase in international food imports 2 | ||
| Total revenue generated from sales of food grown through urban agriculture 5b | ||
| Distribution of food and ag-related businesses in region 4a | ||
| Short supply chains | Number of urban agriculture growers supplementing their income with produce sales 5b | |
| Number of farmers who direct market 3,4a | ||
| Value of direct sales in the foodshed 3 | ||
| Number of Community Supported Agriculture farms 4a | ||
| Number of food manufacturers receiving monetary benefits from city agencies 1a | ||
| Number of food co-ops 5a | ||
| Number of city-wide food box programs 5a | ||
| Number of food festivals 5a |
Source from which the metric or indicator was derived: 1 New York City FoodWorks (2010), 1a New York City Food System Metrics Report (2016), 1b New York City Five Borough Food Flow (2016); 2 Greater Philadelphia Eating Here Food System Plan (2011); 3 Los Angeles Food System Snapshot (2013); 4 Chicago GO TO 2040, 4a Food Systems Report (2009); 5 Toronto Cultivating Food Connections (2010), 5a Toronto Food by Ward: Food Assets and Opportunities (2016), 5b Toronto Urban Agriculture Indicators (2016).
Table 10.
Some of the SDG 9-related indicators in urban food systems strategies or reports.
| SDG | Theme | UFSS Indicator |
|---|---|---|
| SDG 9: Innovation and infrastructure | Production | Number of different urban agriculture facilities 5b |
| Number of people waiting to access urban agriculture programs and plots 5b | ||
| Distribution | Volume of food distributed throughout city per year 1b,2 | |
| Number and size of local food hubs 1b,3 | ||
| Percent of last-mile food distribution trips originating in the city 1b | ||
| Number of daily truck and rail trips to or through local food hubs 1b | ||
| Customer segments served by food hubs per type 1b | ||
| Percent of food with lower shelf-life and specific infrastructure requirements 1b | ||
| Typical storage use by different point-of-sale outlets 1b | ||
| Percent of excess storage capacity per point-of-sale outlet category 1b | ||
| Food distributors market share split 1b | ||
| Percent of annual food volume distributed by distributor type and broken down by types of point-of-sale outlets where it is being sold 1b | ||
| Percent of annual food volume retrieved by different types point-of-sale outlets and broken down by supplier types 1b | ||
| Retail | Number and type of different point-of-sale outlets 1b,3 | |
| Number of grocery stores open during the past five calendar years 1a | ||
| Number of grocery stores per 1,000 People 2 | ||
| Grocery store square feet per capita 1a,3 | ||
| Number of farmers markets 4a,5a | ||
| Number of vendors at farmers markets 1a | ||
| Number of stores engaged by government healthy market programs 3 | ||
| Number of cities in the county permitting sidewalk food vending 3 | ||
| Number of sidewalk food vendors 3 | ||
| Number of traditional food trucks 3 | ||
| Estimated number of people served by sidewalk food vendors per day 3 | ||
| Waste | Processing capacity of local composting facilities 4a |
Source from which the metric or indicator was derived: 1a New York City Food System Metrics Report (2016), 1b New York City Five Borough Food Flow (2016); 2 Greater Philadelphia Eating Here Food System Plan (2011); 3 Los Angeles Food System Snapshot (2013); 4a Chicago GO TO 2040, Food Systems Report (2009); 5a Toronto Food by Ward: Food Assets and Opportunities (2016), 5b Toronto Urban Agriculture Indicators (2016).
Table 11.
Some of the SDG 10-related indicators in urban food systems strategies or reports.
| SDG | Theme | UFSS Indicator |
|---|---|---|
| SDG 10: Reduced inequalities | Livelihood | Changes in food and farmworkers’ hourly wage for all occupations and selected food occupations 2 |
| Median hourly wage of food system workers in the foodshed vs. median hourly wage of all workers in the foodshed 3 | ||
| Median hourly wage of non-supervisory food system workers in the foodshed 3 | ||
| Leadership | Number of minority-operated farms in the foodshed 3 | |
| Percent of marginalized people represented in leadership or decision-making roles 5b | ||
| Number of urban agriculture participants in leadership roles 5b | ||
| Social cohesion | Number of people from marginalized communities employed in urban agriculture 5b | |
| Number of opportunities for diverse people to work or socialize together 5b |
Source from which the metric or indicator was derived: 2 Greater Philadelphia Eating Here Food System Plan (2011); 3 Los Angeles Food System Snapshot (2013); 5b Toronto Urban Agriculture Indicators (2016).
Table 12.
Some of the SDG 11-related indicators in urban food systems strategies or reports.
| SDG | Theme | UFSS Indicator |
|---|---|---|
| SDG 11: Sustainable cities 1 | Environmental | See Table 7, Table 8, Table 13, Table 14, Table 15, Table 16 (SDGs 6, 7, 12, 13, 14, 15) |
| Social | See Table 2, Table 3, Table 5, Table 6, Table 11, Table 17, Table 18 (SDGs 1, 2, 4, 5, 10, 16, 17) | |
| Economic | See Table 9 (SDG 8) and Table 10 (SDG 9) | |
| Health | See Table 4 (SDG 3) |
1 All indicators analyzed in this paper are derived from city-driven food strategies and focus on sustainable cities and so were not repeated here. For specific indicators useful for the implementation of SDG 11 at the urban scale, please refer to Table 2, Table 3, Table 4, Table 5, Table 6, Table 7, Table 8, Table 9, Table 10, Table 11 and Table 13, Table 14, Table 15, Table 16, Table 17, Table 18.
Table 13.
Some of the SDG 12-related indicators in urban food systems strategies or reports.
| SDG | Theme | UFSS Indicator |
|---|---|---|
| SDG 12: Sustainable consumption and production | Consumption | Percent of food supplied to the city per category (produce, meat, fish) 1b |
| Total city agencies’ expenditure on local food 1a | ||
| Funds spent by government-funded agencies and institutions on bottled water 1a | ||
| Annual per capita disappearance of red meat and poultry 3 | ||
| Annual per capita disappearance of eggs 3 | ||
| Waste prevention and reduction from farm to fork | Amount of reduced packaging upstream 1 | |
| Amount of compostable food and organic waste per person entering the waste stream each year 2 | ||
| Volume of municipal solid waste per sector 4a | ||
| Amount of food scraps as percentage of total municipal waste stream 3 | ||
| Food scraps sent to landfills or incinerators in the city per year 3 | ||
| Tons of food scraps composted in the city per year 3 | ||
| Surplus food recovered from farms to food banks 3 | ||
| Percent of food wasted across supply chain 3 | ||
| Estimated national percentage of produce losses at the farm level 3 |
Source from which the metric or indicator was derived: 1 New York City FoodWorks (2010), 1a New York City Food System Metrics Report (2016), 1b New York City Five Borough Food Flow (2016); 2 Greater Philadelphia Eating Here Food System Plan (2011); 3 Los Angeles Food System Snapshot (2013); 4a Chicago GO TO 2040, Food Systems Report (2009).
Table 14.
Some of the SDG 13-related indicators in urban food systems strategies or reports.
| SDG | Theme | UFSS Indicator |
|---|---|---|
| SDG 13: Climate action | GHGs emissions | Percentage of greenhouse gas emissions due to agriculture 3 |
| Percentage of agricultural greenhouse gas emissions due to livestock production 3 | ||
| Average amount of nitrogen oxide (NOX) emitted from agricultural production in the foodshed 3 | ||
| Average amount of fine particles (PM2.5) emitted from agricultural production in the foodshed 3 | ||
| Climate resiliency | Number of farms which received disaster payments 2 | |
| Typical days of stock by point-of-sale outlet type 1b | ||
| Transportation means used for last-mile distribution 1b | ||
| Percent of urban food volume carried by different transportation routes (bridges and tunnels) 1b | ||
| Productive green infrastructure | Number of edible parkway gardens in the city 3 | |
| Number of community gardens in the city and in the county 2,3 | ||
| Number of registered community gardens on city-owned property 1a | ||
| Number of urban agricultural sites in the city 3 | ||
| Acreage of agricultural land use in zoning code for city and county 3 | ||
| Number (sq. footage) of unused/underused land placed into food production 5b | ||
| Number of different types of urban agriculture practiced 5b |
Source from which the metric or indicator was derived: 1a New York City Food System Metrics Report (2016), 1b New York City Five Borough Food Flow (2016); 2 Greater Philadelphia Eating Here Food System Plan (2011); 3 Los Angeles Food System Snapshot (2013); 5b Toronto Urban Agriculture Indicators (2016).
Table 15.
Some of the SDG 14-related indicators in urban food systems strategies or reports.
| SDG | Theme | UFSS Indicator |
|---|---|---|
| SDG 14: Life below water | Water bodies supporting aquatic life | Number of local watersheds supporting aquatic life 2 |
| Number of unassessed watersheds 2 | ||
| River and stream miles supporting aquatic life 2 | ||
| Unassessed river and stream miles 2 | ||
| Number of aquaculture sites in the local jurisdiction 3 | ||
| Compromised water bodies | Number of watersheds impaired for aquatic life 2 | |
| Miles of rivers and streams impaired for aquatic life 2 | ||
| Volume of city’s raw sewage diverted from waterways 1 | ||
| Education | Extent of outreach and education on responsible fish consumption in the city 5 |
Source from which the metric or indicator was derived: 1 New York City FoodWorks (2010); 2 Greater Philadelphia Eating Here Food System Plan (2011); 3 Los Angeles Food System Snapshot (2013); 5 Toronto Cultivating Food Connections (2010).
Table 16.
Some of the SDG 15-related indicators in urban food systems strategies or reports.
| SDG | Theme | UFSS Indicator |
|---|---|---|
| SDG 15: Life on land | Farmland and open space | Total acres of land in production per type (cropland, permanent pasture) 2,3,4a |
| Farmland by type (pasture, commodity, specialty, etc.) 4a | ||
| Acres of agricultural land in the foodshed 3,4a | ||
| Land zoned as agricultural 4a | ||
| Acres of grazing land 3 | ||
| Land consumption | Acres of agricultural land converted to urban and built land in the foodshed 3 | |
| Percentage of agricultural land converted to urban and built land in the foodshed 3 | ||
| Number of solar energy production plants installed on previously developed land 2 | ||
| Land conservation | Amount of permanently preserved farmland 2 | |
| Number of farms which received conservation program payments 2 | ||
| Interest in landowner participation in conservation easements 4a | ||
| Percent of undeveloped land in the 100-mile Foodshed considered important agricultural soils 2 | ||
| Average age of farmers 2 | ||
| Healthy soils | Erosion rate in tons per acre per year on croplands in the region 3 | |
| Erosion rate in tons per acre per year on croplands in the country 3 | ||
| Total land in certified organic farms/pasture 4a | ||
| Number of urban agriculture projects using organic soil amendments 5b | ||
| Biodiversity | Number of registered beekeepers 3 | |
| Value of organically produced commodities 4a | ||
| Number of certified organic farms by national government and by third parties 4a | ||
| Value of agricultural products sold for direct human consumption 4a | ||
| Number of urban agriculture projects that grow native or pollinator plants 5b | ||
| Number of products grown by urban agriculture projects 5b |
Source from which the metric or indicator was derived: 2 Greater Philadelphia Eating Here Food System Plan (2011); 3 Los Angeles Food System Snapshot (2013); 4a Chicago GO TO 2040, Food Systems Report (2009); 5b Toronto Urban Agriculture Indicators (2016).
Table 17.
Some of the SDG 16-related indicators in urban food systems strategies or reports.
| SDG | Theme | UFSS Indicator |
|---|---|---|
| SDG 16: Peace and justice | Fair competition | Number and extent of enforcement of antitrust laws in agribusiness and other food businesses 2 |
| Dollar amount of government subsidies received by local food and agriculture businesses by type of produce (commodity vs. non-commodity payments) 2 | ||
| Protection of workers’ rights | Extent of law-abiding farm labor arrangements in the foodshed 2 | |
| Number and type of legislative changes made to protect the rights of temporary agricultural workers 2 | ||
| Union density rates among food system workers 3a | ||
| Number of programs geared toward better living conditions for farm laborers (housing, healthcare, services) 2 | ||
| Number of culturally appropriate, cost-effective, and practical farmworker housing units built 2 | ||
| Decision making processes | Extent of inclusiveness, democracy, and transparency of decision-making in the urban food system 3a | |
| Civic engagement | Number of food justice projects or initiatives in the city 3 | |
| Violations | Number of violations by mobile food vendors 1a | |
| Number of farm worker fatalities 3 | ||
| Accountability | Availability, type, and impact of current accountability mechanisms for detecting injustices in the local food system 3 | |
| Education | Number of programs fostering youth recognition of the current injustices created by the current food system 3 |
Source from which the metric or indicator was derived: 1a New York City Food System Metrics Report (2016); 2 Greater Philadelphia Eating Here Food System Plan (2011); 3 Los Angeles Good Food for All Agenda (2010), 3a Los Angeles Food System Snapshot (2013).
Table 18.
Some of the SDG 17-related indicators in urban food systems strategies or reports.
| SDG | Theme | UFSS Indicator |
|---|---|---|
| SDG 17: Partnership for the goals | Organizational infrastructure | Number of organizations and individuals involved in a food system stakeholder committee 2 |
| Number of food system stakeholder committee members by ZIP code 2 | ||
| Number of community food agencies 5a | ||
| Number of different types of urban agriculture organizations 5b | ||
| Percent of people in types of urban agriculture programs 5b | ||
| Number of collaborations formed through urban agriculture project 5b | ||
| Duration of collaborations 5b | ||
| Participation | Number of people recognizing the importance of working together 2 | |
| Number of participating organizations in the network of a local food policy councils 3 | ||
| Number of people participating in urban agriculture in different roles 5b | ||
| Number of urban agriculture projects maintaining wait lists 5b | ||
| Implementation | Number of organizational or program objectives achieved through collaborations 5b |
Source from which the metric or indicator was derived: 2 Greater Philadelphia Eating Here Food System Plan (2011); 3 Los Angeles Food System Snapshot (2013); 5a Toronto Food by Ward: Food Assets and Opportunities (2016), 5b Toronto Urban Agriculture Indicators (2016).
© 2017 by the author. Licensee MDPI, Basel, Switzerland. This article is an open access article distributed under the terms and conditions of the Creative Commons Attribution (CC BY) license (http://creativecommons.org/licenses/by/4.0/).
Share and Cite
MDPI and ACS Style
Ilieva, R.T. Urban Food Systems Strategies: A Promising Tool for Implementing the SDGs in Practice †. Sustainability 2017, 9, 1707. https://doi.org/10.3390/su9101707
AMA Style
Ilieva RT. Urban Food Systems Strategies: A Promising Tool for Implementing the SDGs in Practice †. Sustainability. 2017; 9(10):1707. https://doi.org/10.3390/su9101707
Chicago/Turabian StyleIlieva, Rositsa T. 2017. "Urban Food Systems Strategies: A Promising Tool for Implementing the SDGs in Practice †" Sustainability 9, no. 10: 1707. https://doi.org/10.3390/su9101707
Note that from the first issue of 2016, this journal uses article numbers instead of page numbers. See further details here.