Optimum Insulation Thickness for Building Exterior Walls in 32 Regions of China to Save Energy and Reduce CO2 Emissions


Department of Housing and Environmental Design, Graduate School of Human Life Science, Osaka City University, Osaka 5588585, Japan
*
Author to whom correspondence should be addressed.
Sustainability 2017, 9(10), 1711; https://doi.org/10.3390/su9101711
Submission received: 8 September 2017
/
Revised: 19 September 2017
/
Accepted: 22 September 2017
/
Published: 24 September 2017
Abstract
:China accounts for approximately 30% of the CO2 emissions—one of the largest proportions from a single nation. Therefore, reducing the CO2 emissions in China will play a decisive role in global CO2 emissions reduction. This paper is a proposal of optimum insulation thickness (OIT) for the exterior walls of buildings in 32 regions of China to save energy and reduce CO2 emissions. The determination of the OIT for exterior walls its impact on the annual total energy cost and annual CO2 emissions per unit area of building exterior walls were calculated for 32 regions of China using the life-cycle cost analysis (LCCA) and degree-days (DD) method. The results indicate that the annual total energy cost decreases up to the OIT level, and increases beyond the OIT level. The annual CO2 emissions can be reduced by increasing the insulation thickness. It is predicted that the average total energy cost of 32 regions can potentially be decreased by about $5/m2-year (40%) and the average CO2 emissions of the 32 regions can potentially be reduced by about 27 kg/m2-year (63%) when the OIT is applied. It also shows it is more effective to apply the OIT for the exterior walls of buildings to save annual total energy cost and reduce annual CO2 emissions in the Severe Cold and Hot Summer & Cold Winter climatic zones rather than the other climatic zones of China.
1. Introduction
The energy demands of buildings are high due in part to the indoor thermal comfort requirements of buildings. A continuous and cheap supply of energy is desired for economic and social development [1]. The use of nonrenewable energy can cause environmental problems, global warming and a reduced quality of life in humans. One of the most effective ways of reducing the energy use is to utilize fossil fuel sources efficiently [2,3]. A proposed theoretical model indicated that increasing the albedo and thermal insulation of rooftops can effectively reduce the heat gain in buildings during the summer season [4]. Thermal insulation in building exterior walls can decrease the heat loss or gain through the building envelopes in the winter, but at increasing cost [5]. Design and construction with optimal insulation thickness (OIT) should be considered as a prerequisite and a top priority for energy savings in buildings [6,7]. The definition of OIT has been detailed by many researchers worldwide [8,9,10]. The degree-day (DD) method is commonly used to calculate the energy needs of buildings, and methods of calculating the OIT are proposed based on the DD method [11,12,13].
The thermal properties of the building envelope are determined by the combination of wall mass, thermal resistance, insulation thickness and location, exterior surface color, etc. [14]. The thermal insulation of building exterior walls significantly reduces the heating and cooling needs of the zone [15]. The influence of the insulation configuration on thermal loads of buildings has been detailed by many researchers. A study on the performances of the heat and multilayer reflection insulators of buildings was implemented by Lee et al. [16], and indicated that the multilayer reflection insulator keeps the interior wall surface temperature high in winter and low in summer, improves the thermal comfort of the habitants and reduces the yearly heat loads. The impact of thermal insulation on building heat loads was implemented by Kossecka and Kosny [17], and a predication of yearly heating and cooling energy demand for a one-story residential building was carried out using DOE-2.1E. It was known that the insulating material configuration of the building external wall can significantly affect the yearly thermal property of the building under various climatic and weather conditions. A numerical model for calculating the yearly cooling and heating transmission loads was adopted by Ozel [18]. The calculated cooling and heating transmission loads were imported to an economic model to decide the OIT for a south-facing wall in the climatic conditions of Elazığ, Turkey. The influence of windows on the thermal insulation of buildings was analyzed by Granzotto et al. [19]. It showed that the single components of windows will not affect the thermal insulation, although the acoustic properties will be influenced by unique constituent of windows. Baldinelli et al. [20] implemented the study on the influence of windows on the energy and environmental performance via a holistic approach using a sample of wooden windows. It showed that enhancing the thermal characteristics of windows can properly control the solar gains and strongly contribute to the optimization of energy and environmental performance. Thalfeldt et al. [21] carried out the analysis on the optimal façade designs including window properties, thermal insulation of exterior walls, window-to-wall ratio and shading for Estonia in the cold climate. The analysis indicated that the cost optimal façade solution was obtained by the triple pane low-E glazing with a window-to-wall ratio of 25% and the insulation thickness of an exterior wall of 200 mm as a design principle.
According to the China Climate Change Info-Net (CCCIN), it is known that China’s CO2 emissions accounted for a relatively large proportion of the world’s CO2 emissions—about 30% in 2016 [22]. According to China’s thermal design code of civil buildings (GB 50176-93) [23] and Li and Yao’s previous research [24], five main different climatic zones are defined in China as shown in Figure 1, including (I) Severe Cold climatic zone (the coldest mean monthly dry-bulb temperature: <−10 °C); (II) Cold climatic zone (the coldest mean monthly dry-bulb temperature: −10 °C–0 °C); (III) Hot Summer & Cold Winter climatic zone (the coldest mean monthly dry-bulb temperature: 0 °C~10 °C; the hottest mean monthly dry-bulb temperature: 25 °C–30 °C); (IV) Hot Summer & Warm Winter climatic zone (the coldest mean monthly dry-bulb temperature: >10 °C; the hottest mean monthly dry-bulb temperature: 25 °C–29 °C); and (V) Temperate region (the coldest mean monthly dry-bulb temperature: 0 °C–13 °C; the hottest mean monthly dry-bulb temperature: 18 °C–25 °C).
In global efforts to prevent global warming and environmental problems, measures to reduce CO2 emissions in China would have a much greater impact than in other developed countries. The OIT design for building exterior walls can play an important role in reducing the CO2 emissions by directly reducing the heating and cooling loads of buildings. Zhu et al. [25] have calculated the OIT of exterior walls for five typical cities, Urumqi, Beijing, Shanghai, Guangzhou and Kunming that are in different climatic zones of China, with consideration of annual heating degree-days (HDD) and cooling degree-days (CDD).
In order to save energy cost of buildings and reduce CO2 emissions, this paper aims to determine the OIT of building exterior walls for 32 regions of China. The OIT of building exterior walls for the selected 32 regions of China is proposed using DD method and life-cycle cost analysis (LCCA), without considering the influence of windows and external solar gains. A distribution map of OIT of building exterior walls for the 32 regions of China is created. In addition, the potential of annual total energy cost savings and annual CO2 emission reduction per unit area of building exterior walls when applying the OIT on exterior walls are evaluated for the 32 regions of China in this study.
2. Materials and Methodology
2.1. Regions of China
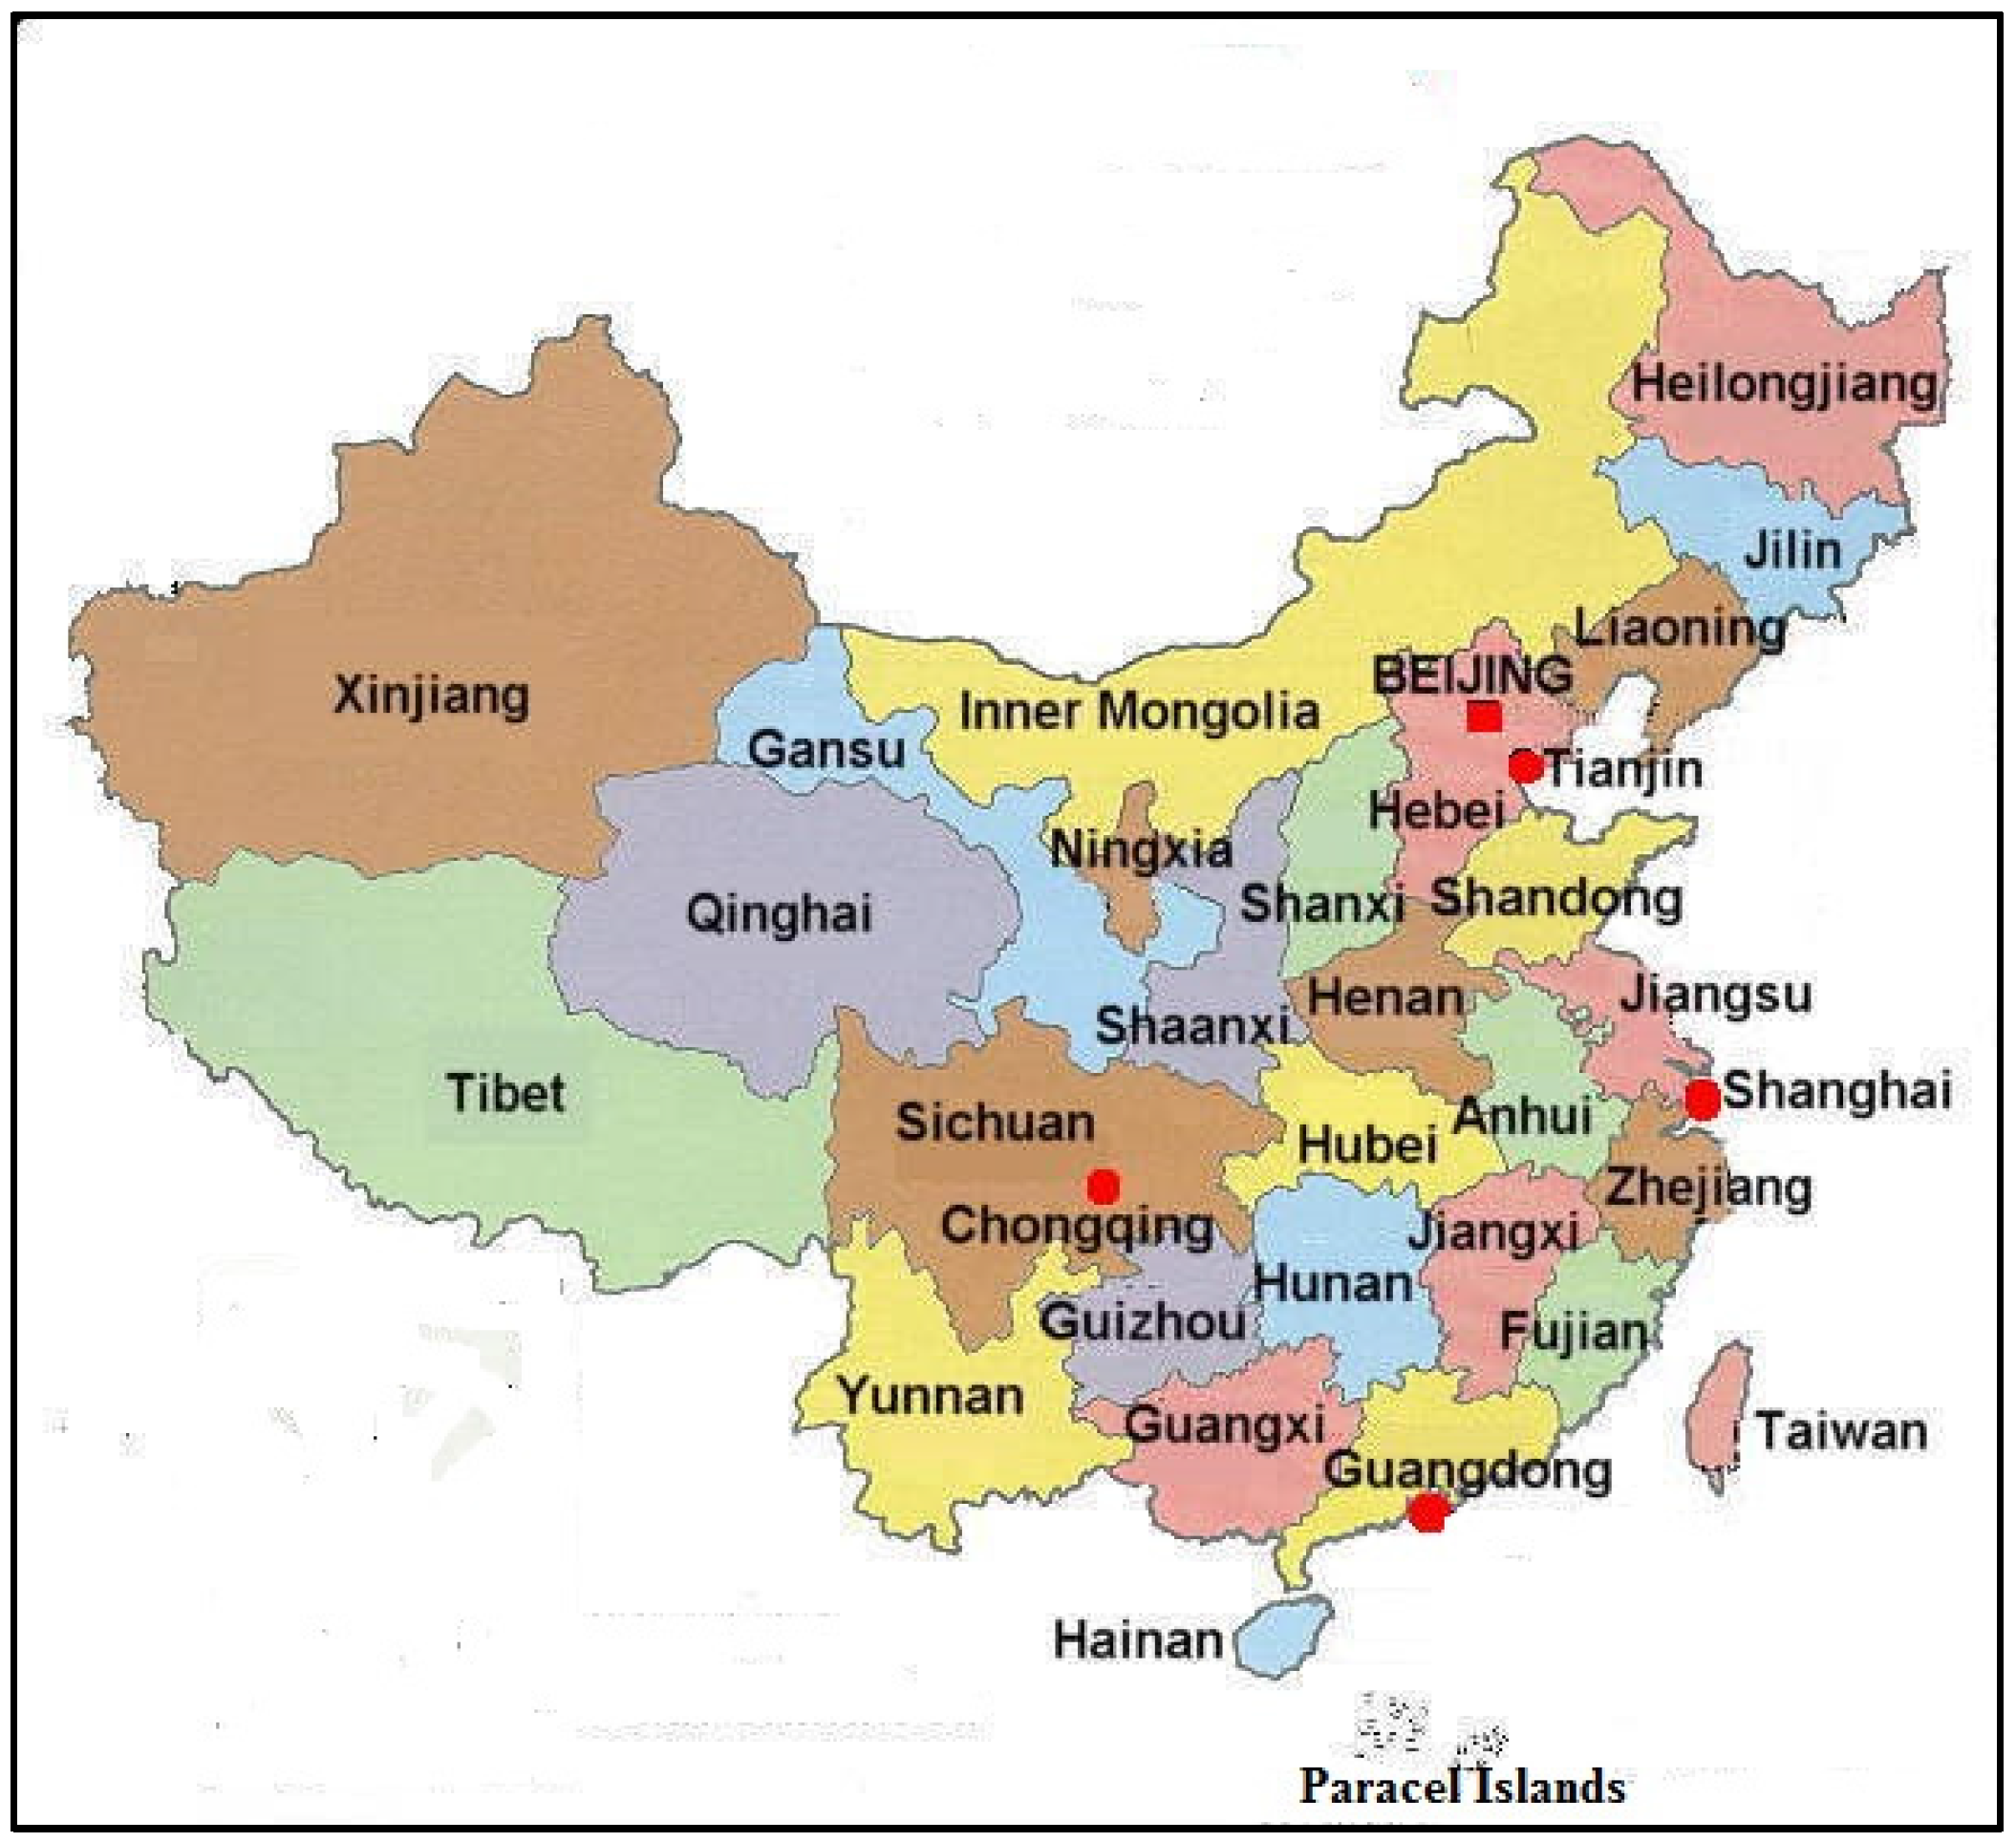
In this study, we chose 32 regions of China to propose the OIT for building exterior walls. The data is from the China Meteorological Data Service Center (CMDC) [26], which does not include meteorological data of Hong Kong, Macao and Taiwan regions. The geographic locations of selected 32 regions are detailed in Figure 2.
2.2. Determination of HDD and CDD
For determination of the HDD and CDD in this study, we obtained the mean daily outdoor dry-bulb temperature for 35 years (1981–2015) from 32 regions from the CMDC. The HDD is calculated at base dry-bulb temperature of 18.0 °C, and the CDD is calculated at base dry-bulb temperature of 28.0 °C. The HDD and CDD are determined using the following Equations (1) and (2), respectively,
where HDD18.0 is the heating degree-days at base dry-bulb temperature of 18.0 °C, [°C-day]; CDD28.0 is the cooling degree-days at base dry-bulb temperature of 28.0 °C, [°C-day]; θih is the design indoor dry-bulb temperature of 18.0 °C for heating period; θic is the design indoor dry-bulb temperature of 28.0 °C for cooling period; θom(n) is the mean daily outdoor dry-bulb temperature of the nth day, [°C]; and n is the days of heating or cooling periods, [day].
2.3. Total Energy Cost Analysis
The LCCA method is used to assess the annual total energy cost per unit area of building exterior walls over the lifetime of building exterior wall materials.
Heat loss or gain from unit exterior wall surface, can be calculated using the following Equations (3) and (4),
where q is the heat loss or gain from the unit exterior wall surface, [W/m2]; U is the coefficient of heat transmission of exterior walls, [W/m2K]; ΔT is the temperature difference between indoor and outdoor sides, [°C] or [K]; Ri is the thermal resistance of the interior air film, [m2K/W]; Ro is the thermal resistance of the exterior air film, [m2K/W]; Rw is the total thermal resistance of the wall layers without insulation, [m2K/W], Rwt is the sum of Ri, Ro, Rw, [m2K/W]; and Rins is the thermal resistance of the insulation material, [m2K/W].
The Rins can be derived through the following Equation (5),
where x is the insulation thickness, [m]; and k is the thermal conductivity of insulation material, [W/mK].
The annual fuel consumption per unit area of building exterior walls in heating and cooling periods can be derived using the following Equations (6) and (7), respectively,
where mH and mC are the annual fuel consumption per unit area of building exterior walls in heating and cooling periods, respectively, [kg/m2-yr] of coal, [m3/m2-yr] of natural gas or [kWh/m2-yr] of electricity; ηH and ηC are the efficiency of the heating and cooling systems, respectively, [-]; and HH and HC are the heating and cooling fuel value, respectively, [kJ/kg] of coal or [kJ/m3] of natural gas.
The annual total cost per unit area of building exterior walls, can be derived by the following Equations (8)–(10) via the LCCA,
where CT is the annual total cost per unit area of building exterior walls, [$/m2-yr]; PWF is the present worth factor, [-]; CH and CC are the unit fuel cost for heating and cooling, respectively, [$/kg], [$/m3] or [$/kWh]; Cins is the unit insulation cost, [$/m3]; i is the interest rate, [-]; g is the inflation rate, [-]; and N is the expected lifetime of exterior envelope materials, [yr].
2.4. Determination of Optimum Insulation Thickness
The minimum CT is taken as the point when the derivative of the cost as a function of insulation thickness (8) reaches zero, in the following Equations (11) and (12) [27],
and
The OIT can be also derived using the following Equation (13) [28],
2.5. Energy Cost Saving Analysis
The potential annual energy cost saving per unit area of building exterior walls can be derived by subtracting the annual total energy cost per unit area of building exterior walls for noninsulated walls and the annual total cost per unit area of building exterior walls for insulated walls. The relationship is shown as the following Equation (14),
where Ecs is the annual energy cost saving per unit area of building exterior walls, [$/m2-yr]; (CT)nins is the annual total cost per unit area of building exterior walls for non-insulated walls, [$/m2-yr]; and (CT)ins is the annual total cost per unit area of building exterior walls for insulated walls, [$/m2-yr].
2.6. CO2 Emission Calculation
The annual CO2 emissions per unit area of building exterior walls can be derived through the following Equations (15)–(18) [29],
where m is the mol number, [kmol/m2-yr]; M is the molar mass of fuel, 94.9 [kg/kmol] for coal and 17.5 [kg/kmol] for natural gas; is the annual CO2 emissions per unit area of building exterior walls, [kg/m2-yr]; a is the coefficient of CO2 emissions (here it is assumed as 0.45 kg CO2/kWh); E is the electricity consumption, [kWh/m2-yr]; COP is the coefficient of performance of air-conditioner (3.0 for cooling period and 2.5 for heating period), [-]; and is the molar mass of CO2, 44 [kg/kmol].
3. Results and Discussion
Despite the exterior wall structures in the different climatic zones of China being different, in order to unify calculation and better understand the change of OIT in the different climatic zones, this paper assumes two kinds of exterior wall structures, one as applicable to the 16 regions belonging to the Severe Cold and Cold climatic zones (Figure 3a) and the other for the 16 regions belonging to the Hot Summer & Cold Winter, Temperate and Hot Summer & Warm Winter climatic zones (Figure 3b). The parameters of calculation are given in Table 1.
For this calculation, traditional fuel in China, such as coal and gas are selected as the boiler fuel source for heating, and electricity is selected as the power source of air conditioners for cooling. The coal as fuel source is used for the Severe Cold and Cold climatic zones and the natural gas as fuel is used for the Hot Summer & Cold Winter, Temperate and Hot Summer & Warm Winter climatic zones of China. The fuel cost in this calculation is considered as a slightly higher price than mean price in the last ten years, thus it is likely to lead to a relatively higher total energy cost and a relatively higher OIT. There are many insulation materials used for building exterior walls in China, i.e., polymer mortar, fiberglass mesh, expanded polyurethane (EPS), rock wool, foam board, extruded polystyrene (XPS), etc. Similar to the research of Andreola et al. [37], there are also some insulation materials made of nonflammable and recyclable waste materials. In order to simplify the calculation, this study selects the EPS as insulation material of exterior walls.
3.1. HDD and CDD for 32 Regions
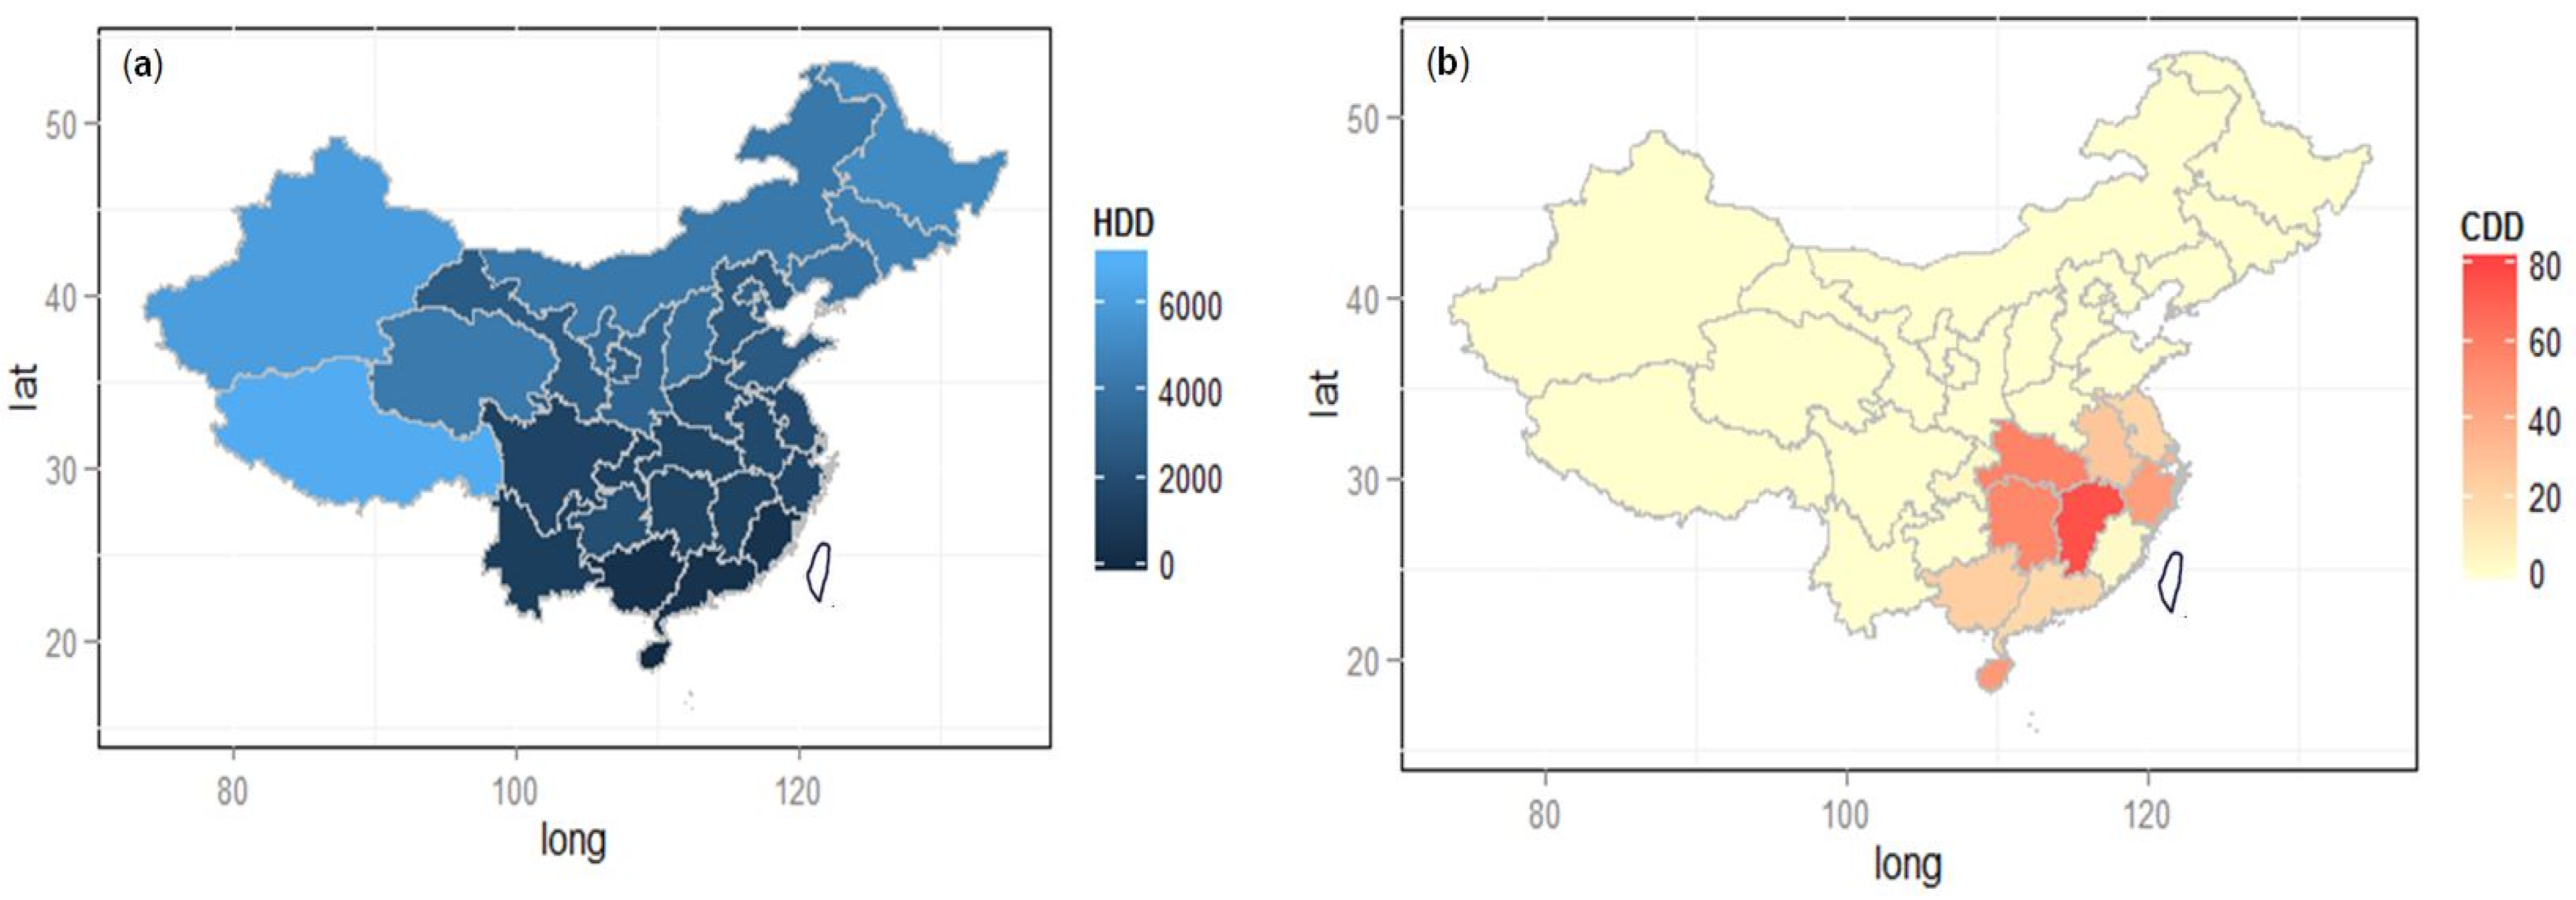
The HDD18.0 and CDD28.0 are derived from the above Equations (1) and (2). The annual HDD18.0 and CDD28.0 for 32 regions of China are calculated and shown in Table 2. The distribution maps of annual HDD18.0 and CDD28.0 for 32 regions of China are created and shown in Figure 4a,b, respectively.
Compared to annual HDD18.0, the annual CDD28.0 is relatively small for the 32 regions of China.
3.2. Optimum Insulation Thickness
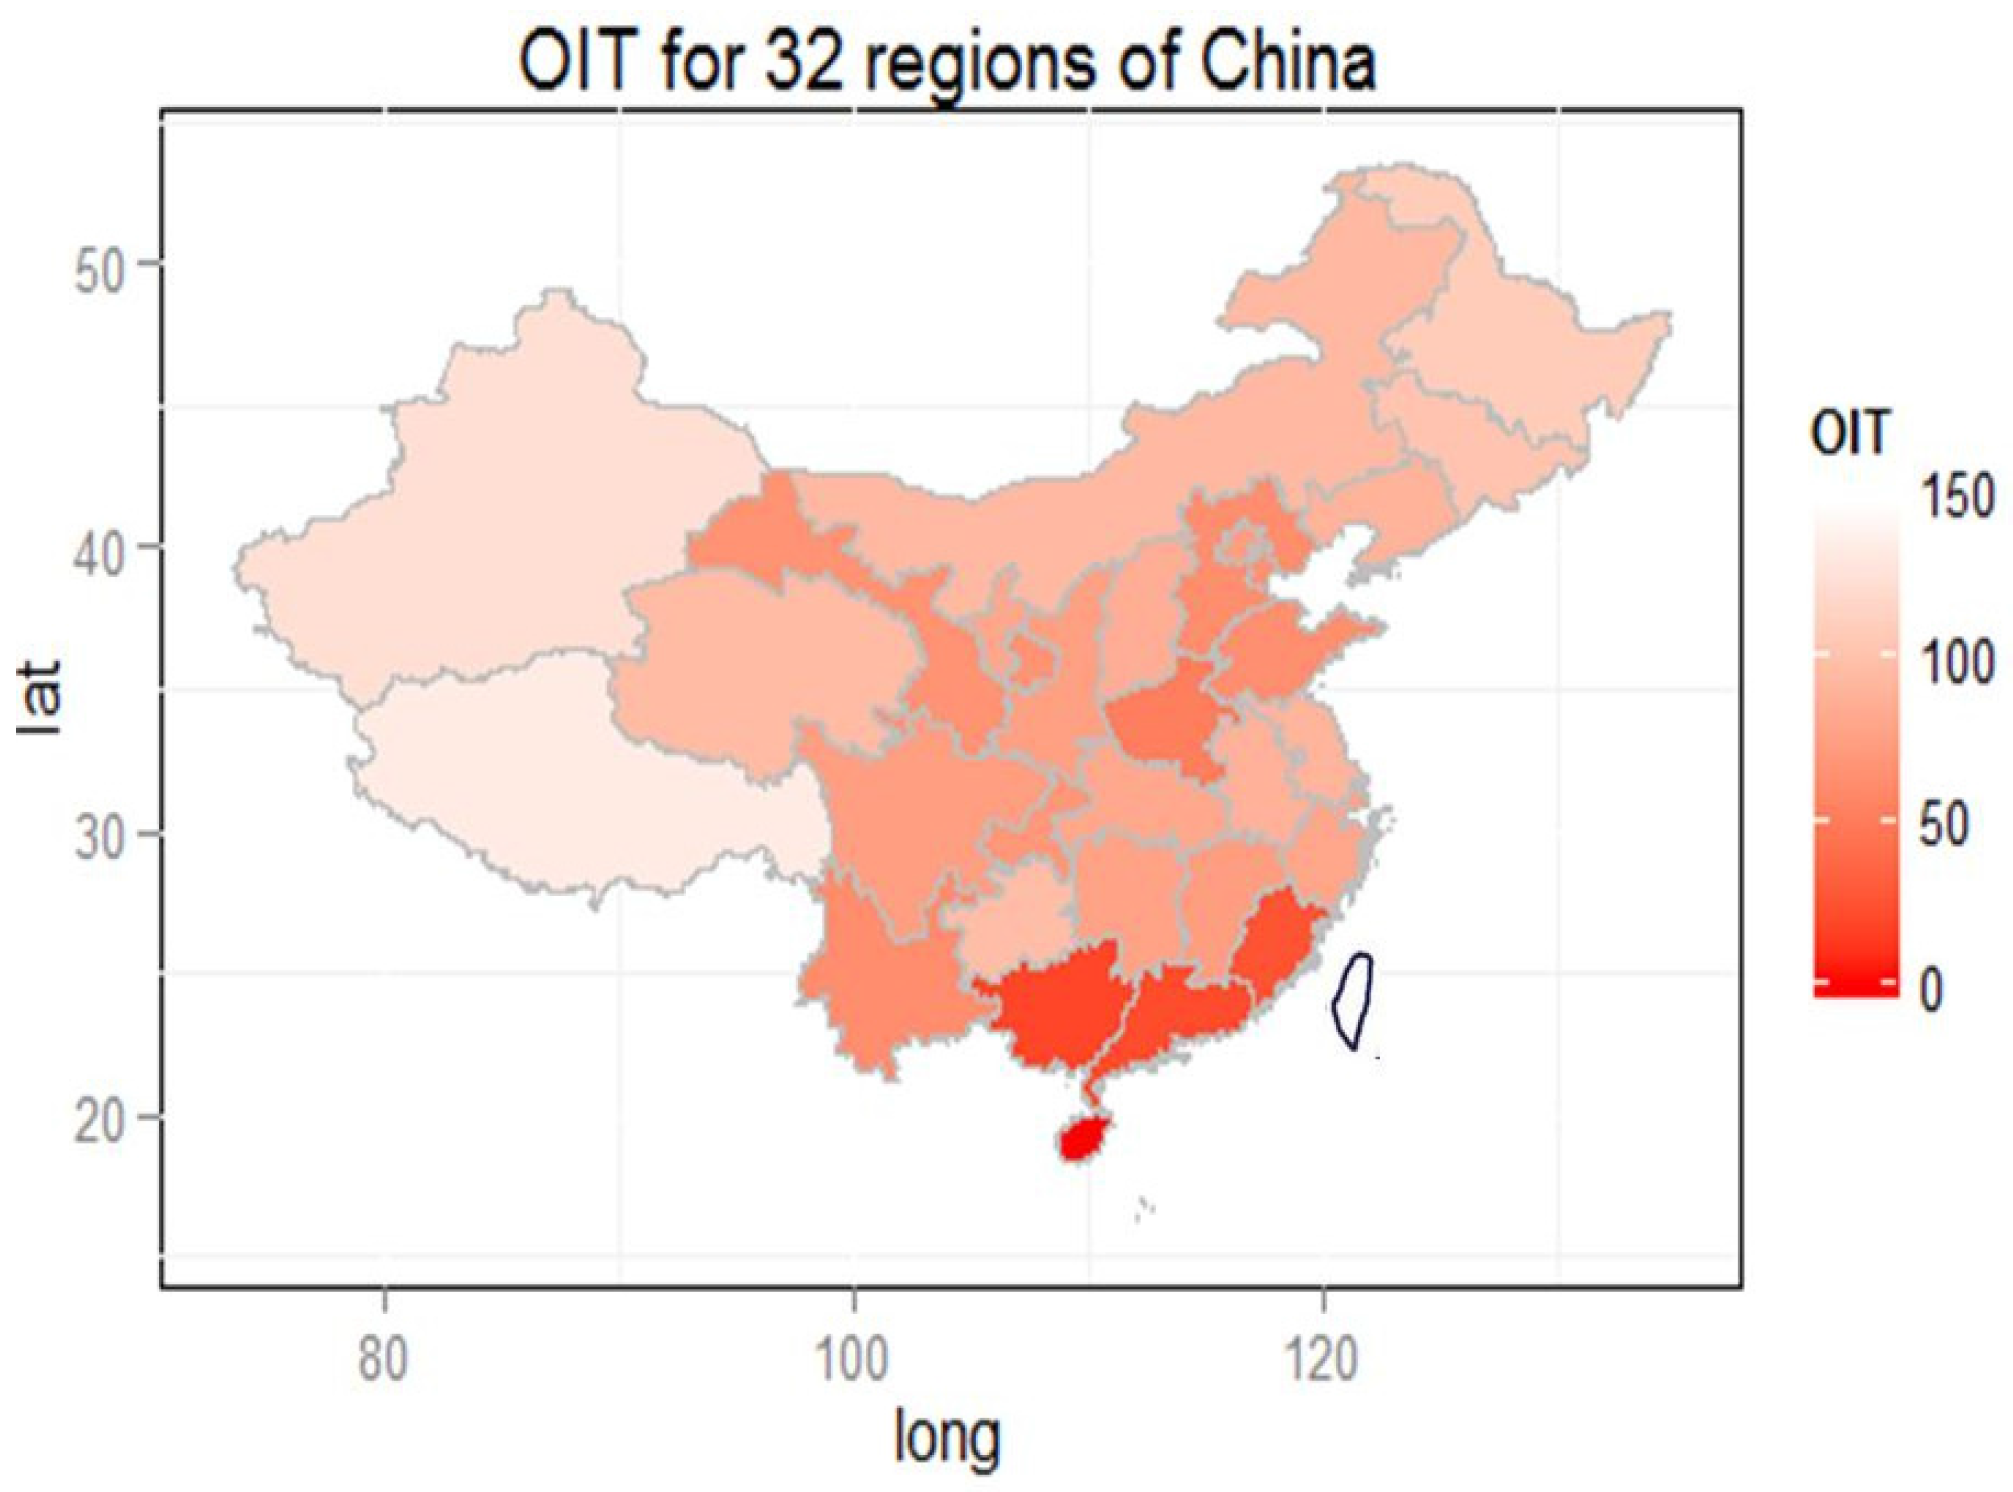
The OIT is derived from the above Equation (13). The OIT for the 32 regions are calculated and detailed in Table 2. The distribution map of OIT for the whole China territory is created and shown in Figure 5.
It shows that Tibet has the thickest OIT of 135 mm, followed by 125 mm for Xinjiang, 100–110 mm for Heilongjiang and Jilin, 90–100 mm for Liaoning, Inner Mongolia, Guizhou, Jiangsu and Qinghai, 80–90 mm for Shanxi, Ningxia, Anhui, Hubei and Zhejiang, 70–80 mm for Beijing, Shaanxi, Chongqing, Hunan, Jiangxi, Shanghai and Sichuan, 50–70 mm for Gansu, Hebei, Shandong, Tianjin, Yunnan and Henan, 10–30 mm for Fujian, Guangzhou and Guangxi, and noninsulation (0 mm) for Hainan and Paracel Islands.
We can see that the OIT for building exterior walls in Severe Cold climatic zone is the thickest, followed by that in Hot Summer & Cold Winter, Temperate and Cold climatic zones, and the OIT in Hot Summer & Warm Winter climatic zone is the thinnest.
Compared to the OIT for five typical cities of China determined in the research of Zhu et al. [22], the OIT for 32 regions of China determined in this study are relatively small. The reason can be considered from the following points:
- The weather data sources for HDD and CDD calculations are different; the weather data used in Zhu et al.’s research was obtained from the EnergyPlus weather file and the data used in this study was obtained from the CMDC weather file.
- Two kinds of exterior wall structures are assumed in this paper; one is applied to Severe Cold and Cold climatic zones and the other one is applied to Hot Summer & Cold Winter, Temperate and Hot Summer & Warm Winter climatic zones. However, only one general exterior wall structure was considered in Zhu et al.’s research.
- The base temperature of 28 °C is adopted for determining the annual CDD in this paper, however a relatively lower base temperature of 26 °C is adopted in Zhu et al.’s research.
3.3. Annual Total Cost
The annual total cost CT is derived from the above Equation (8).The curves of annual total cost, insulation cost and fuel cost per unit area of building exterior walls versus the insulation thickness for example regions of Tibet (Severe Cold), Shanghai (Hot Summer & Cold Winter), Yunnan (Temperate) and Guangdong (Hot Summer & Warm Winter) are calculated and shown in Figure 6.
The CT is affected by insulation thickness and fuel consumption of buildings, etc. The heat losses decrease with an increase of insulation thickness. If the insulation thickness increases, the thermal load which directly related to fuel cost would decrease. However, increasing the insulation thickness will increase the insulation cost, thus the CT which is the sum of fuel and insulation costs decreases up to a certain value of the insulation thickness, OIT. Beyond this OIT value, the CT increases.
The graphs in Figure 6 show that the initial CT for noninsulated walls, (CT)nins, which is equal to the fuel cost is the largest—about $25/m2-yr for Tibet, which belongs to the Severe Cold climatic zone, followed by Shanghai ($13/m2-yr), which belongs to the Hot Summer & Cold Winter climatic zone and Yunnan (about $/10m2-yr), which belongs to the Temperate climatic zone. The smallest is about $4/m2-yr for Guangdong, which belongs to the Hot Summer & Warm Winter climatic zone. The CT decreases by about 52% for Tibet, about 41% for Shanghai, about 34% for Yunnan, and about 11% for Guangdong by increasing the insulation thickness up to the OIT value.
3.4. Potential Annual Energy Cost Savings
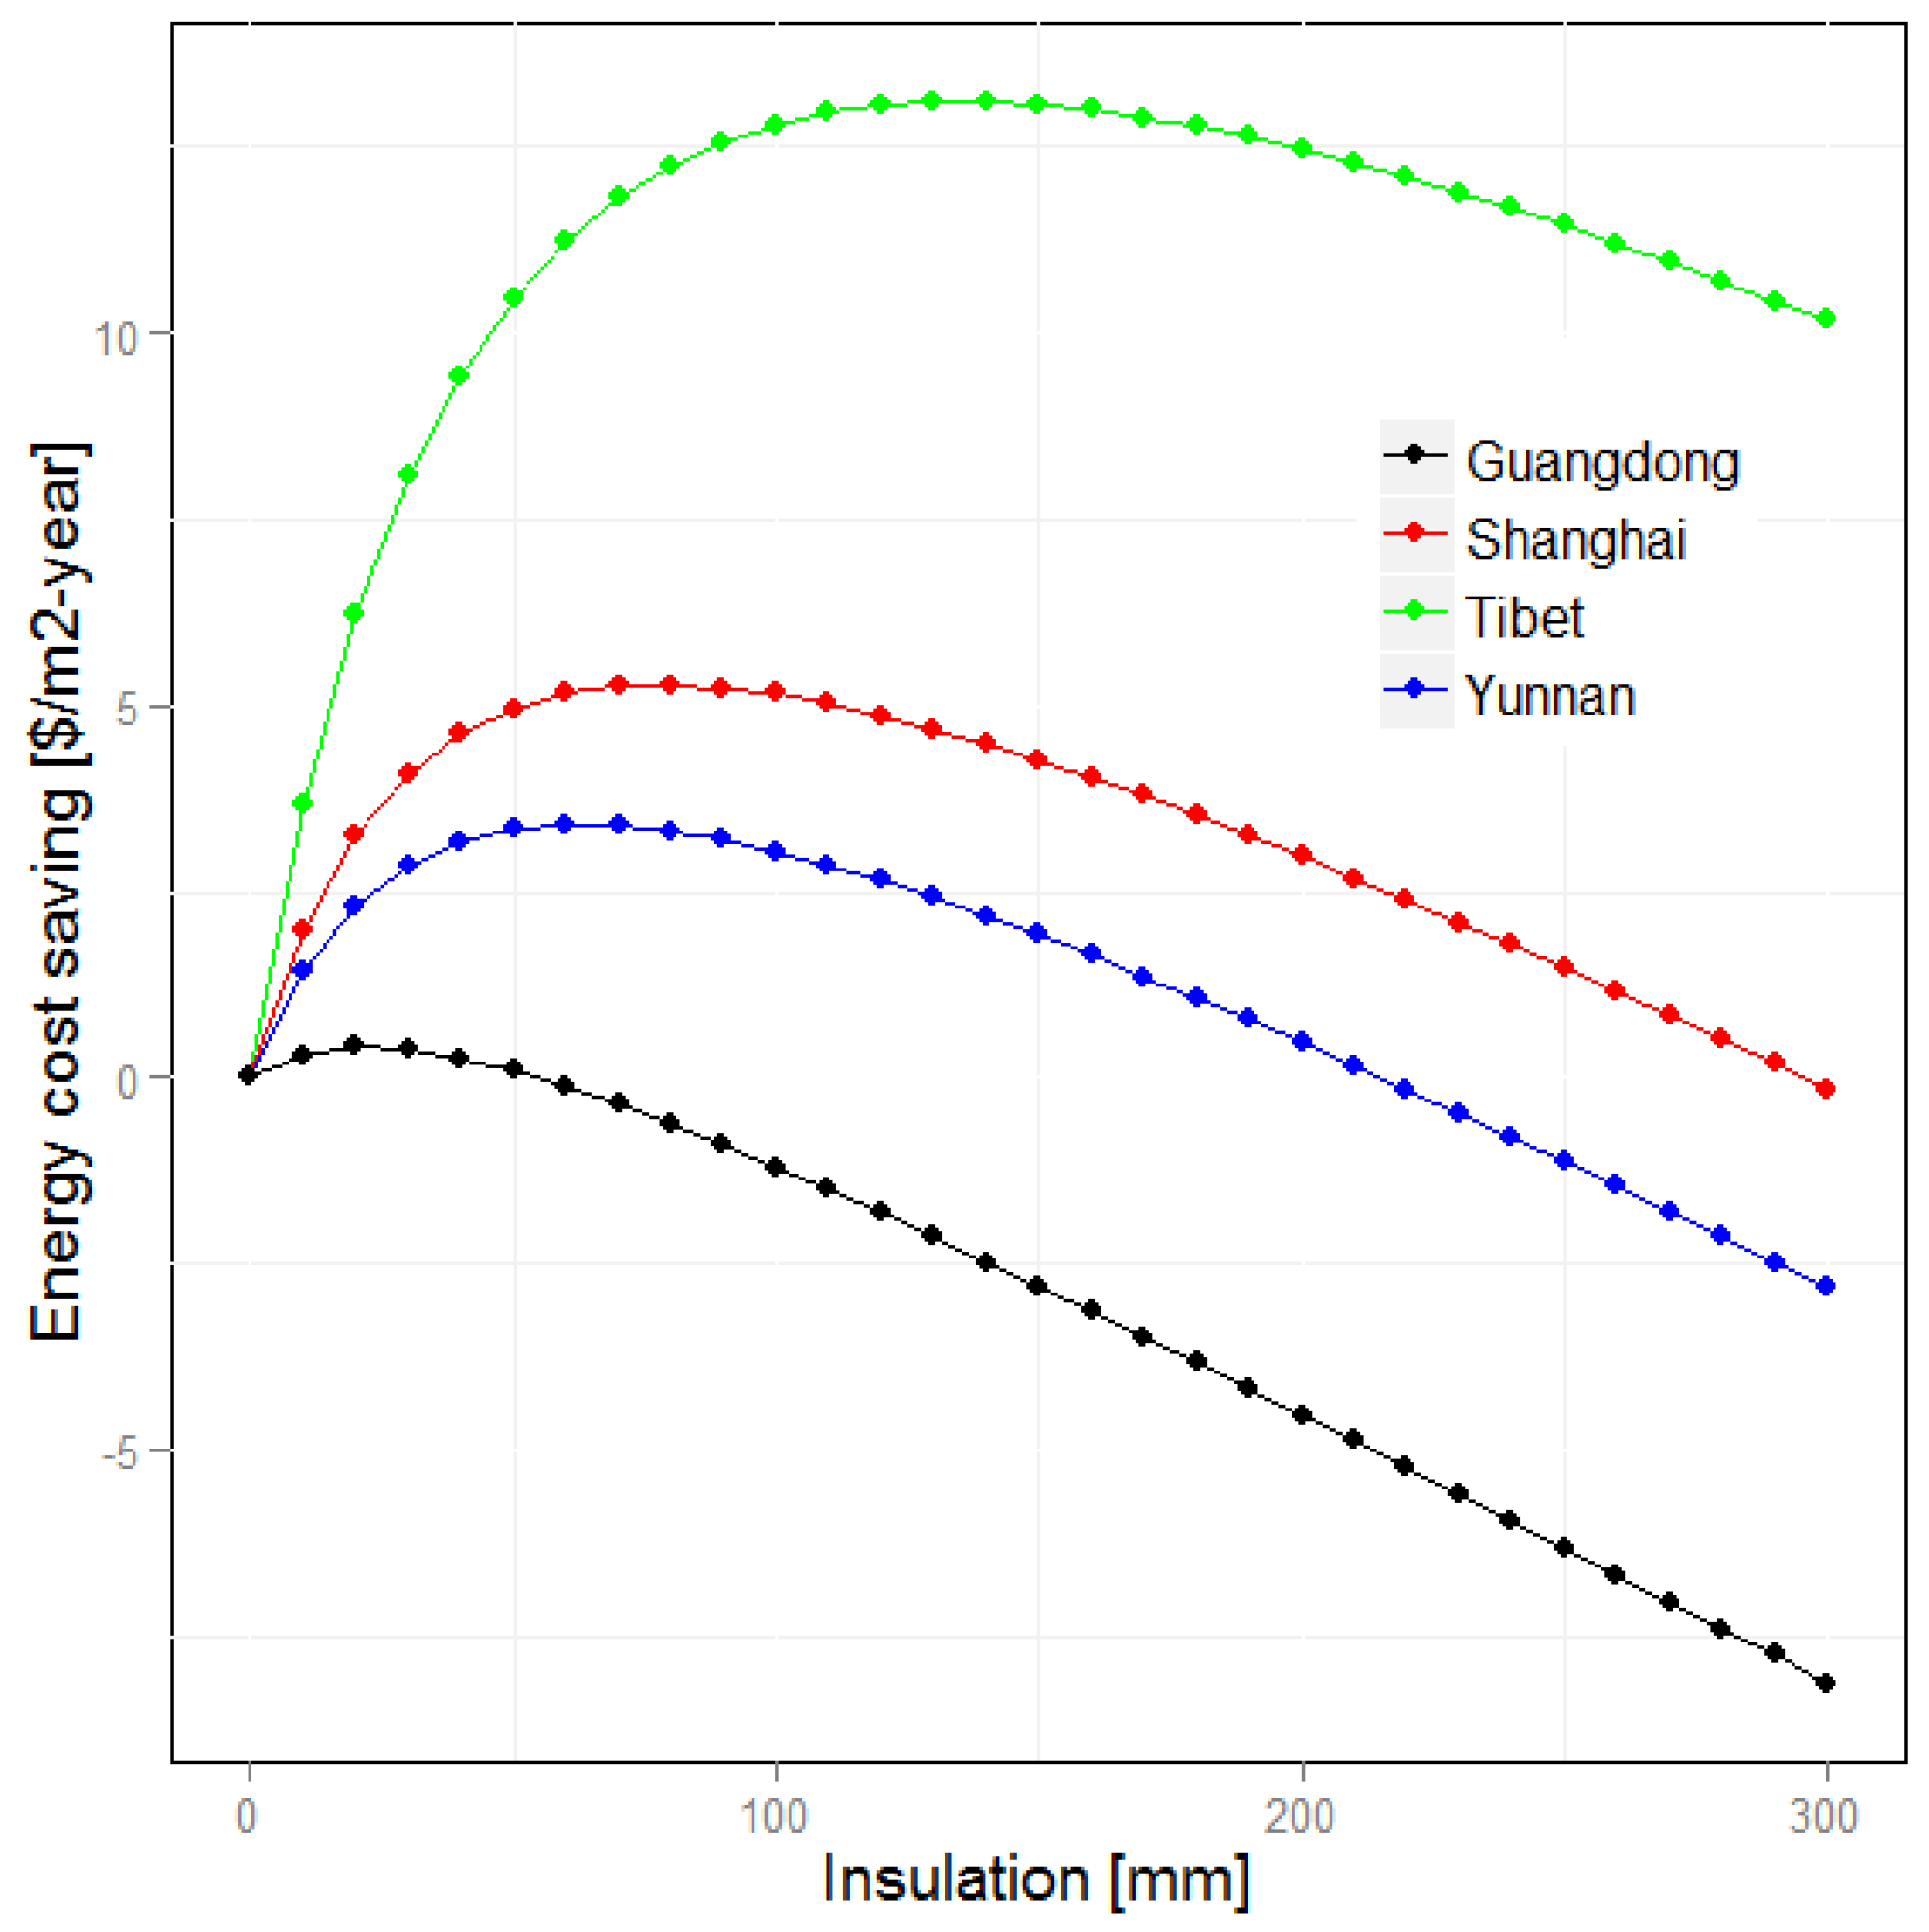
The potential annual energy cost savings per unit area of building exterior walls, Ecs, is derived from the above Equation (14). The curves of Ecs versus the insulation thickness for Tibet, Shanghai, Yunnan and Guangdong are shown in Figure 7. The curve shows that the Ecs increases up to the OIT level. Beyond the level of OIT, the Ecs decreases.
Figure 7 shows that Tibet has the largest Ecs of about $13/m2-yr, when the insulation thickness increases up to the OIT value of 135 mm, followed by Shanghai (the largest Ecs is about $5/m2-yr when the insulation thickness increases up to the OIT value of 78 mm) and Yunnan (the largest Ecs is about $3/m2-yr when the insulation thickness increases up to the OIT value of 63 mm). Guangdong has the smallest Ecs of about $0.40/m2-yr when the insulation thickness increases up to the OIT value of 22 mm.
If the OIT is applied for building exterior walls, the Ecs for 32 regions of China are estimated and detailed in Table 2.
It shows that when the OIT for exterior walls is used, the average Ecs of the 32 regions of China can potentially be decreased by up to about $5/m2-yr (40%), depending on initial conditions.
3.5. Potential Annual CO2 Emissions
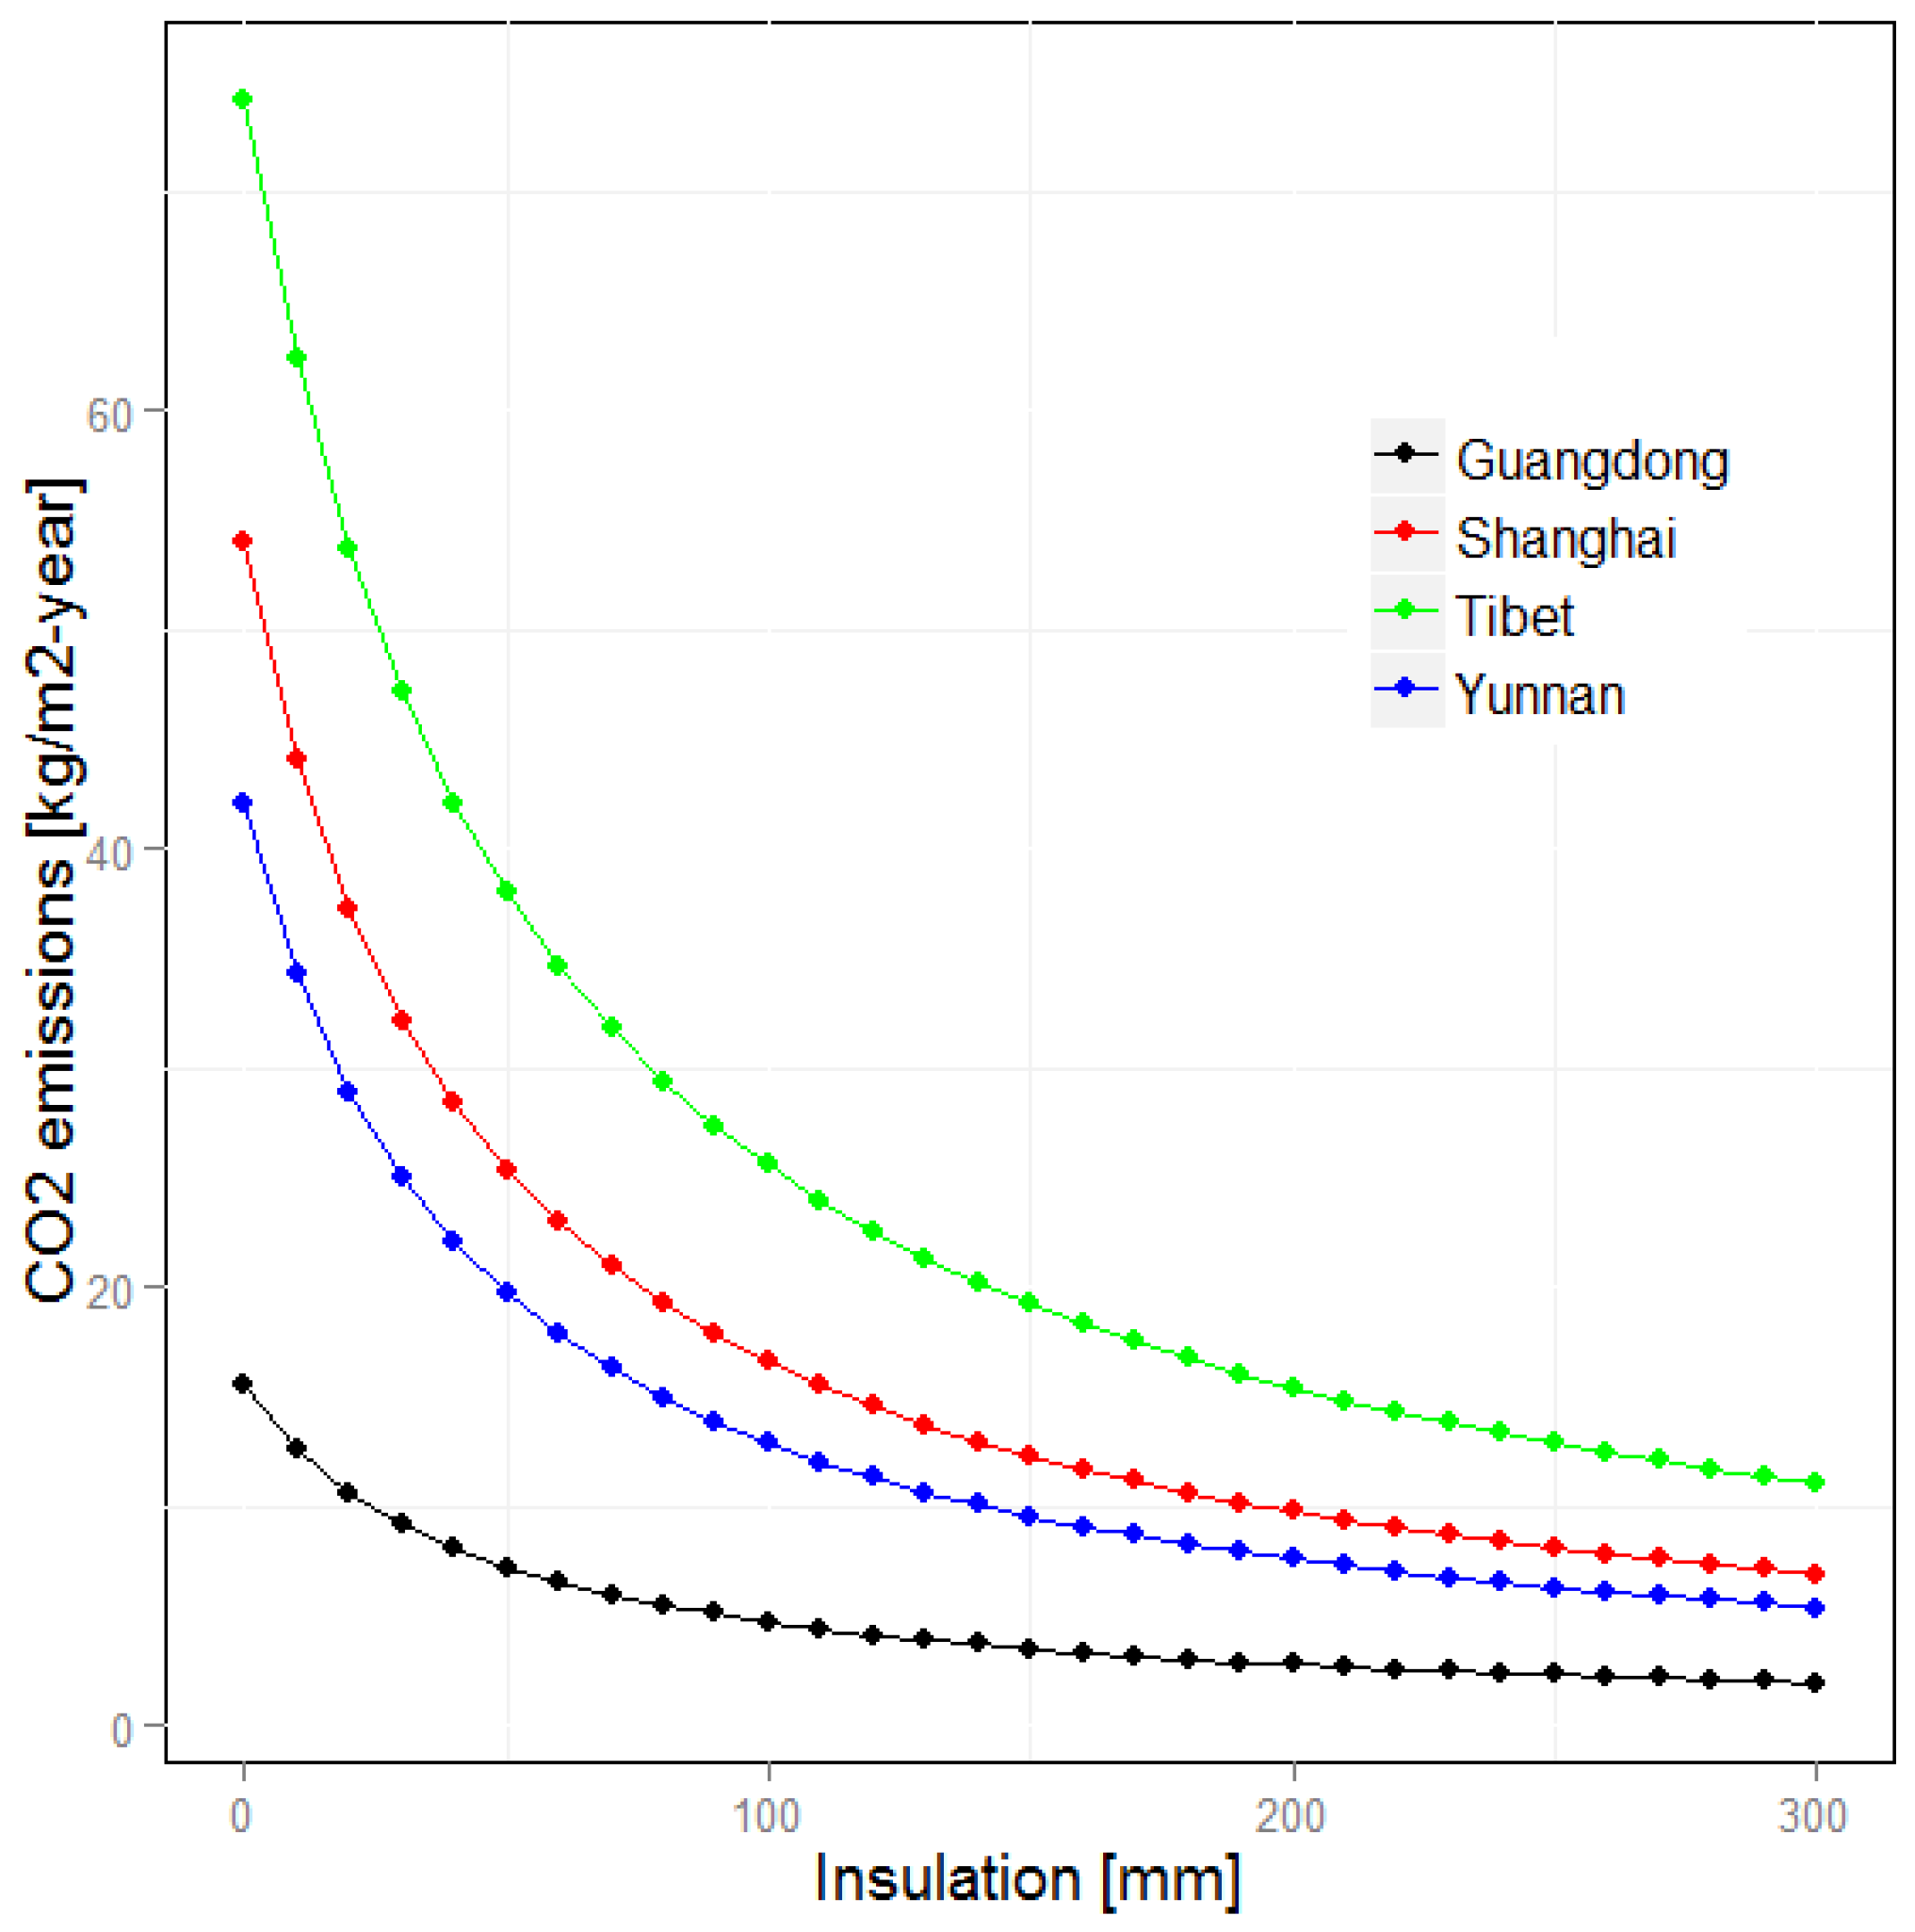
The potential annual CO2 emission per unit area of building exterior walls, mco2, is derived from the above Equations (15)–(18). The curves of mco2 versus the insulation thickness for example regions of Tibet, Shanghai, Yunnan and Guangdong are shown in Figure 8.
Figure 8 shows that Tibet has the largest reduction of mco2 of about 53 kg/m2-yr when the insulation thickness increases up to the OIT value of 135 mm, followed by Shanghai (CO2 emission reduction is about 35 kg/m2-yr when the insulation thickness increases up to the OIT value of 78 mm) and Yunnan (CO2 emission reduction is about 24 kg/m2-yr when the insulation thickness increases up to the OIT value of 63 mm). Guangdong has the smallest reduction of mco2 of about 5 kg/m2-yr when the insulation thickness increases up to the OIT value of 22 mm.
If the OIT for building exterior walls is applied, the reduction of mco2 for 32 regions of China are predicted and detailed in Table 2.
It is seen that the mco2 decreases by increasing the insulation thickness of exterior walls. When the OIT for exterior walls is used, the average mco2 of 32 regions of China can potentially be reduced by about 27 kg/m2-yr (63%).
In addition, we can see that when the region is much colder (such as Tibet), the reduction rate of mco2 as the insulation thickness increases is much larger. Thus, in order to greatly reduce mco2 in China, it is considered that it is more effective to implement the thermal insulation technology on the exterior walls of buildings in Severe Cold and Hot Summer & Cold Winter climatic zones rather than the other climatic zones of China.
4. Conclusions and Future Work
For the purpose of contributing to the thermal insulation design of building exterior walls for energy cost savings and CO2 emission reduction in China, this study proposed the OIT of exterior walls for 32 regions of China using more recent data via the DD method and LCCA over a hypothetical lifetime of 10 years, without considering the influence of windows and external solar gains. In addition, the impact of the OIT on the annual total energy cost and annual CO2 emissions per unit area of building exterior walls were also implemented in this study.
The findings indicate the thermal insulation of exterior walls is more effective in Severe Cold and Hot Summer & Cold Winter climatic zones of China for both total energy cost saving and CO2 emissions reduction per unit area of the building exterior walls, however it is the opposite in Hot Summer & Warm Winter climatic zones of China. It is predicted that the average annual total energy cost per unit area of building exterior walls can potentially be decreased by about $5/m2-yr (40%) and the average annual CO2 emissions per unit area of building exterior walls can potentially be reduced by about 27 kg/m2-yr (63%) for the 32 regions of China if the OIT is adopted.
For the future research, it will focus on the impact of the other parameters, i.e., windows of exterior walls, solar gains of exterior walls, different energy sources and a greater variety of wall construction and materials, etc. on the OIT design, total energy cost and CO2 emissions in different climatic zones of China. Furthermore, the cost of installing thermal insulation and labor will be considered when calculating the OIT of exterior walls. Finally, the potential for the possibility of introducing solar energy as a renewable energy to substitute for coal and natural gas in different climatic zones of China will be considered in future as it will largely affect the OIT design, total energy cost and CO2 emissions.
Acknowledgments
The authors are sincerely grateful to the China Meteorological Data Service Center (CMDC) for supporting the meteorological database in this study.
Author Contributions
For research articles with three authors, Jihui Yuan (100%) collected the meteorological database for analysis; Jihui Yuan (80%), Craig Farnham (10%) and Kazuo Emura (10%) implemented the calculation of optimum insulation thickness design for China regions; Jihui Yuan wrote the paper; Craig Farnham (a native English speaker) checked the English of paper.
Conflicts of Interest
The authors declare no conflicts of interest.
References
- Dombaycı, Ö.A. Investigation of the Effect of Thermal Insulation for a Model House in Cold Regions: A Case Study of Turkey. Environ. Progress Sustain. Energy 2013, 33, 527–537. [Google Scholar] [CrossRef]
- Mardookhy, M.; Sawhney, R.; Ji, S.; Zhu, X.; Zhou, W. A Study of Energy Efficiency in Residential Buildings in Knoxville, Tennessee. J. Clean. Prod. 2014, 85, 241–249. [Google Scholar] [CrossRef]
- Baniassadi, A.; Sajadi, B.; Amidpour, M.; Noori, N. Economic optimization of PCM and insulation layer thickness in residential buildings. Sustain. Energy Technol. Assess. 2016, 14, 92–99. [Google Scholar] [CrossRef]
- Qin, Y.; Zhang, M.; Hiller, J.E. Theoretical and experimental studies on the daily accumulative heat gain from cool roofs. Energy 2017, 129, 138–147. [Google Scholar] [CrossRef]
- Yuan, J.; Farnham, C.; Emura, K.; Alam, M.A. Proposal for optimum combination of reflectivity and insulation thickness of building external walls for annual thermal load in Japan. Build. Environ. 2016, 103, 228–237. [Google Scholar] [CrossRef]
- Ozel, M. Effect of wall orientation on the optimum insulation thickness by using a dynamic method. Appl. Energy 2011, 88, 2429–2435. [Google Scholar] [CrossRef]
- Sisman, N.; Kahya, E.; Aras, N.; Aras, H. Determination of optimum insulation thicknesses of the external walls and roof (ceiling) for Turkey’s different degree-day regions. Energy Policy 2007, 35, 5151–5155. [Google Scholar] [CrossRef]
- Yu, J.; Yang, C.; Tian, L.; Liao, D. A study on optimum insulation thicknesses of external walls in hot summer and cold winter zone of China. Appl. Energy 2009, 86, 2520–2529. [Google Scholar] [CrossRef]
- Dombaycı, Ö.A.; Gölcü, M.; Pancar, Y. Optimization of insulation thickness for external walls using different energy-sources. Appl. Energy 2006, 83, 921–928. [Google Scholar] [CrossRef]
- Özkan, D.B.; Onan, C. Optimization of insulation thickness for different glazing areas in buildings for various climatic regions in Turkey. Appl. Energy 2011, 88, 1331–1342. [Google Scholar] [CrossRef]
- Kurekci, N.A. Determination of optimum insulation thickness for building walls by using heating and cooling degree-day values of all Turkey’s provincial centers. Energy Build. 2016, 118, 197–213. [Google Scholar] [CrossRef]
- Dombayci, Ö.A.; Ozturk, H.K.; Atalay, Ö.; Acar, Ş.G.; Ulu, E.Y. The Impact of Optimum Insulation Thickness of External Walls to Energy Saving and Emissions of CO2 and SO2 for Turkey Different Climate Regions. Energy Power Eng. 2016, 8, 327–348. [Google Scholar] [CrossRef]
- Uçar, A.; Balo, F. Effect of fuel type on the optimum thickness of selected insulation materials for the four different climatic regions of Turkey. Appl. Energy 2009, 86, 730–736. [Google Scholar] [CrossRef]
- Hwaish, A.N.A. Impact of heat exchange on building envelope in the hot climates. Int. J. Emerg. Technol. Adv. Eng. 2015, 5, 47–57. [Google Scholar]
- Wati, E.; Meukam, P.; Nematchoua, M.K. Influence of external shading on optimum insulation thickness of building walls in a tropical region. Appl. Therm. Eng. 2015, 90, 754–762. [Google Scholar] [CrossRef]
- Lee, M.J.; Lee, K.G.; Seo, W.D. Analyses on performances of heat and multilayer reflection insulators. J. Cent. South Univ. 2012, 19, 1645–1656. [Google Scholar] [CrossRef]
- Kossecka, E.; Kosny, J. Influence of insulation configuration on heating and cooling loads in a continuously used building. Energy Build. 2002, 34, 321–331. [Google Scholar] [CrossRef]
- Ozel, M. The influence of exterior surface solar absorptivity on thermal characteristics and optimum insulation thickness. Renew. Energy 2012, 39, 347–355. [Google Scholar] [CrossRef]
- Granzotto, N.; Bettarello, F.; Ferluga, A.; Marsich, L.; Schmid, C.; Fausti, P.; Caniato, M. Energy and acoustic performances of windows and their correlation. Energy Build. 2017, 136, 189–198. [Google Scholar] [CrossRef]
- Baldinelli, G.; Asdrubali, F.; Baldassarri, C.; Bianchi, F.; D’Alessandro, F.; Schiavoni, S.; Basilicata, C. Energy and environmental performance optimization of a wooden window: A holistic approach. Energy Build. 2014, 79, 114–131. [Google Scholar] [CrossRef]
- Thalfeldt, M.; Pikas, E.; Kurnitski, J.; Voll, H. Facade design principles for nearly zero energy buildings in a cold climate. Energy Build. 2013, 67, 309–321. [Google Scholar] [CrossRef]
- China Climate Change Info-Net (CCCIN). Global Carbon Dioxide Emissions in 2016. Available online: http://www.ccchina.gov.cn (accessed on 20 February 2017).
- Ministry of Construction of the People’s Republic of China. Thermal Design Code of Civil Building (GB 50176─93); China Plan Publishing House: Beijing, China, 1993. (In Chinese)
- Li, B.; Yao, R. Urbanization and its impact on building energy consumption and efficiency in China. Renew. Energy 2009, 34, 1994–1998. [Google Scholar] [CrossRef]
- Zhu, P.; Huckemann, V.; Fisch, M.N. The optimum thickness and energy saving potential of external wall insulation in different climate zones of China. Procedia Eng. 2011, 21, 608–616. [Google Scholar] [CrossRef]
- China Meteorological Data Service Center (CMDC). 2016. Available online: http://data.cma.cn (accessed on 21 February 2017).
- Cengel, Y.A. Heat Transfer: A Practical Approach; McGraw-Hill: New York, NY, USA, 1998. [Google Scholar]
- Hasan, A. Optimum insulation thickness for buildings using life cycle cost. Appl. Energy 1999, 63, 115–124. [Google Scholar] [CrossRef]
- Dombayci, Ö.A. The environment impact of optimum insulation thickness for external walls of buildings. Build. Environ. 2007, 42, 3855–3859. [Google Scholar] [CrossRef]
- Polyurethane Price from Alibaba Global Trade. 2017. Available online: https://www.alibaba.com/showroom/price-of-polyurethane-resin.html (accessed on 21 February 2017).
- Natural Gas Price from energy.cngold.org. 2017. Available online: http://energy.cngold.org/tianranqi.html (accessed on 21 March 2017).
- Coal Price from energy.cngold.org. 2017. Available online: http://www.cngold.org/meitan/ (accessed on 21 February 2017).
- Electricity Price from State Grid Corporation of China. Available online: http://www.sgcc.com.cn/ (accessed on 21 March 2017).
- Yildiz, A.; Gurlek, G.; Erkek, M.; Özbalta, N. Economical and Environmental Analysis of Thermal Insulation Thickness in Buildings. J. Therm. Sci. Technol. 2008, 28, 25–34. [Google Scholar]
- China Interest Rate. 2017. Available online: http://www.tradingeconomics.com/china/interest-rate (accessed on 25 March 2017).
- China Inflation Rate. 2017. Available online: http://www.tradingeconomics.com/china/inflation-cpi (accessed on 25 March 2017).
- Andreola, F.; Barbieri, L.; Lancellotti, I. Valorization of tyres waste pyrolysis residue in lightweight materials. Environ. Eng. Manag. J. 2016, 15, 1907–1914. [Google Scholar]
Figure 1.
Five different climatic zones in China.
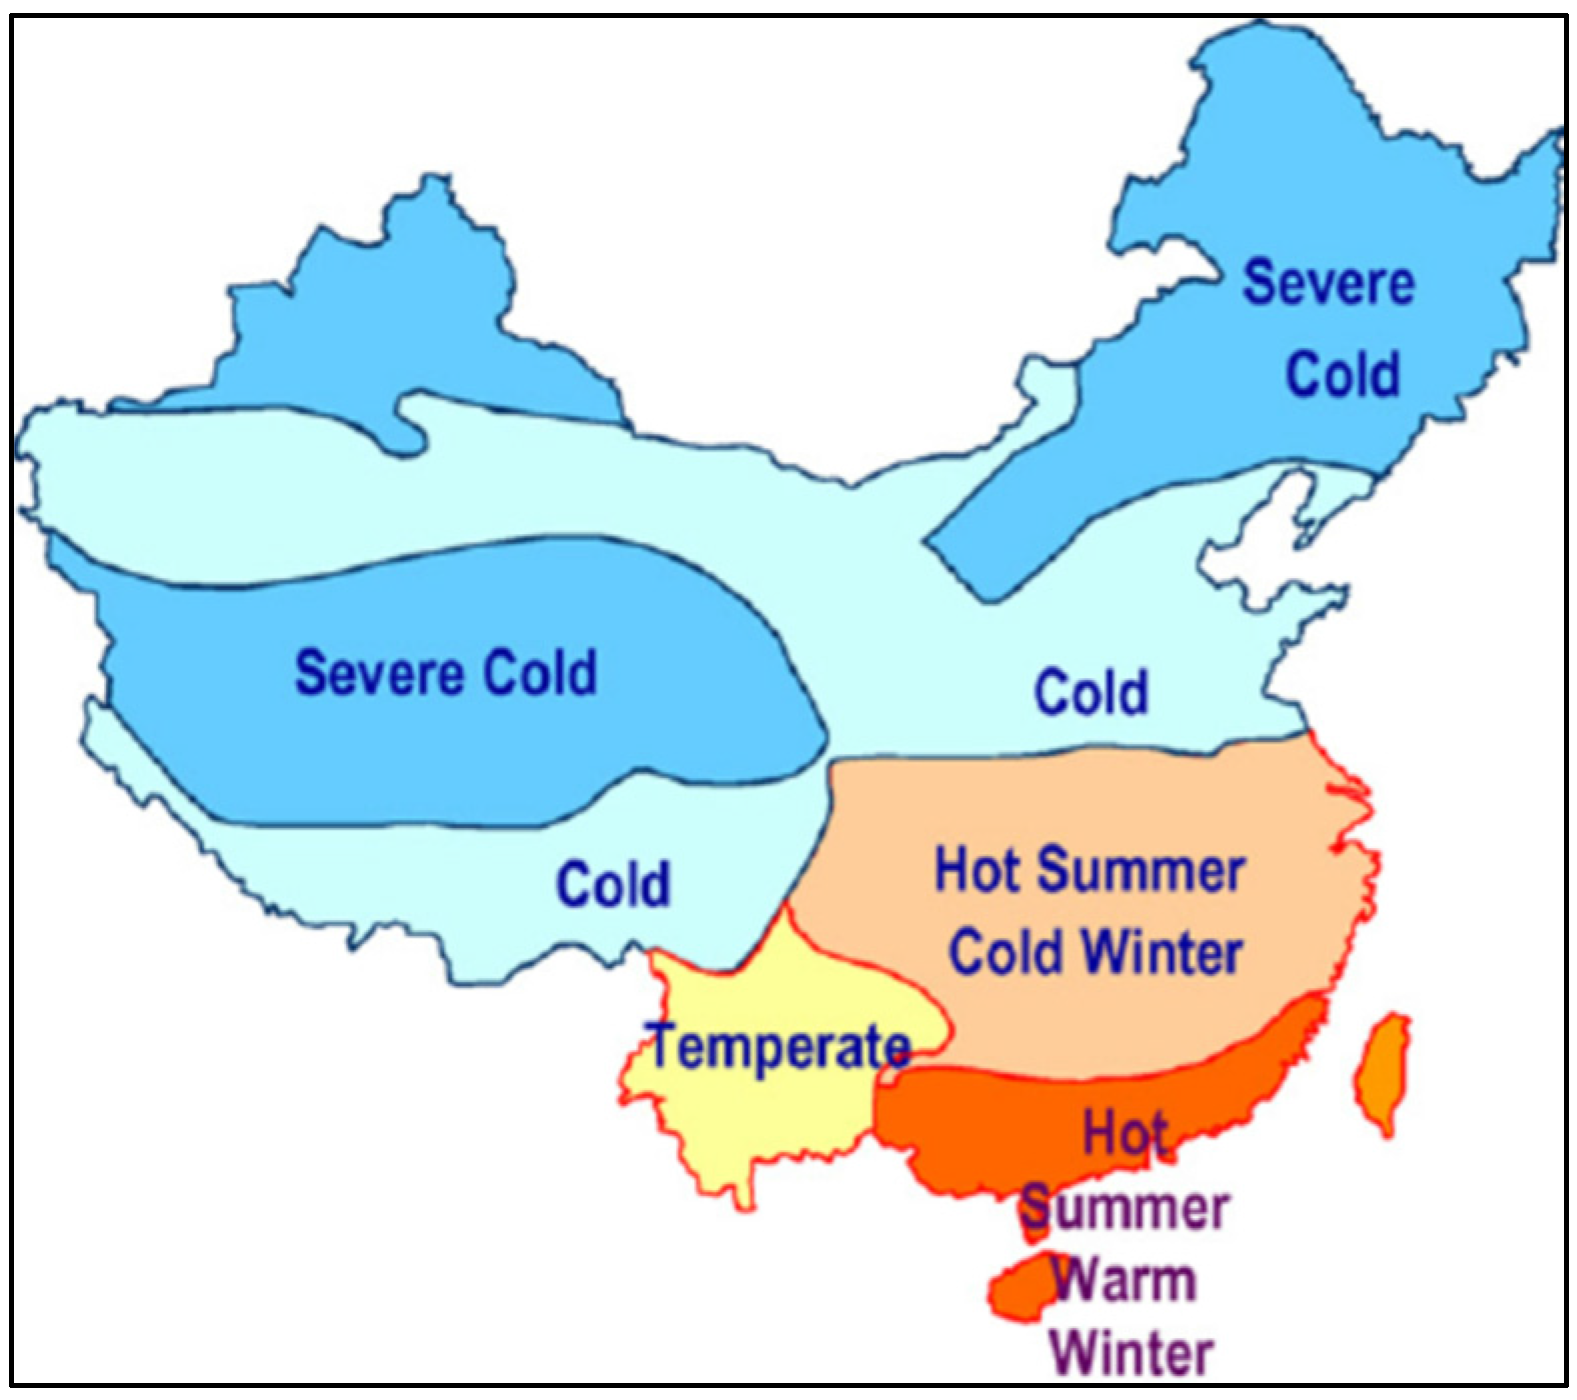
Figure 2.
Geographic locations of selected 32 regions of China.

Figure 3.
Cross-sectional view of two kinds of exterior wall structures; (a) for Severe Cold and Cold climatic zones and (b) for Hot Summer & Cold Winter, Temperate and Hot Summer & Warm Winter climatic zones.
Figure 3.
Cross-sectional view of two kinds of exterior wall structures; (a) for Severe Cold and Cold climatic zones and (b) for Hot Summer & Cold Winter, Temperate and Hot Summer & Warm Winter climatic zones.
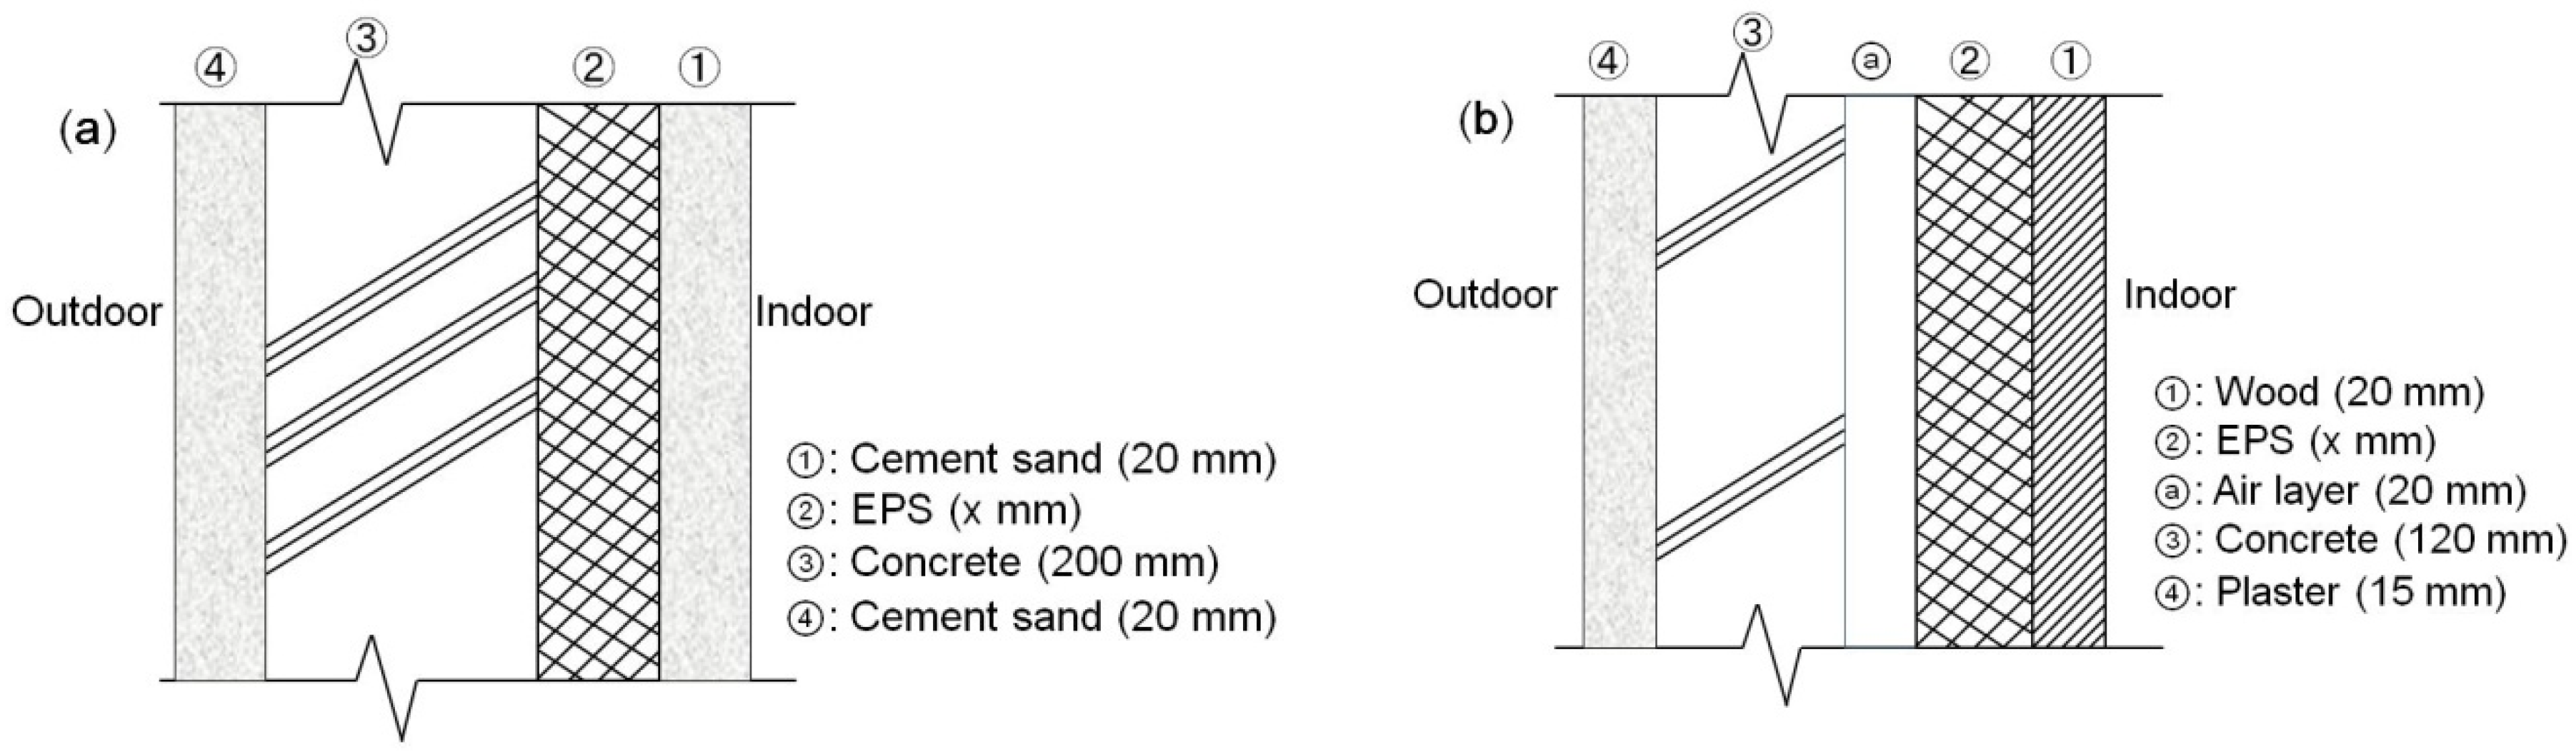
Figure 4.
Distribution maps of annual HDD18.0 (a) and CDD28.0 (b) for 32 regions of China.

Figure 5.
Distribution map of OIT for the whole China territory.

Figure 6.
Annual cost (total cost, insulation cost, fuel cost) versus insulation thickness for Tibet, Shanghai, Yunnan and Guangdong.
Figure 6.
Annual cost (total cost, insulation cost, fuel cost) versus insulation thickness for Tibet, Shanghai, Yunnan and Guangdong.
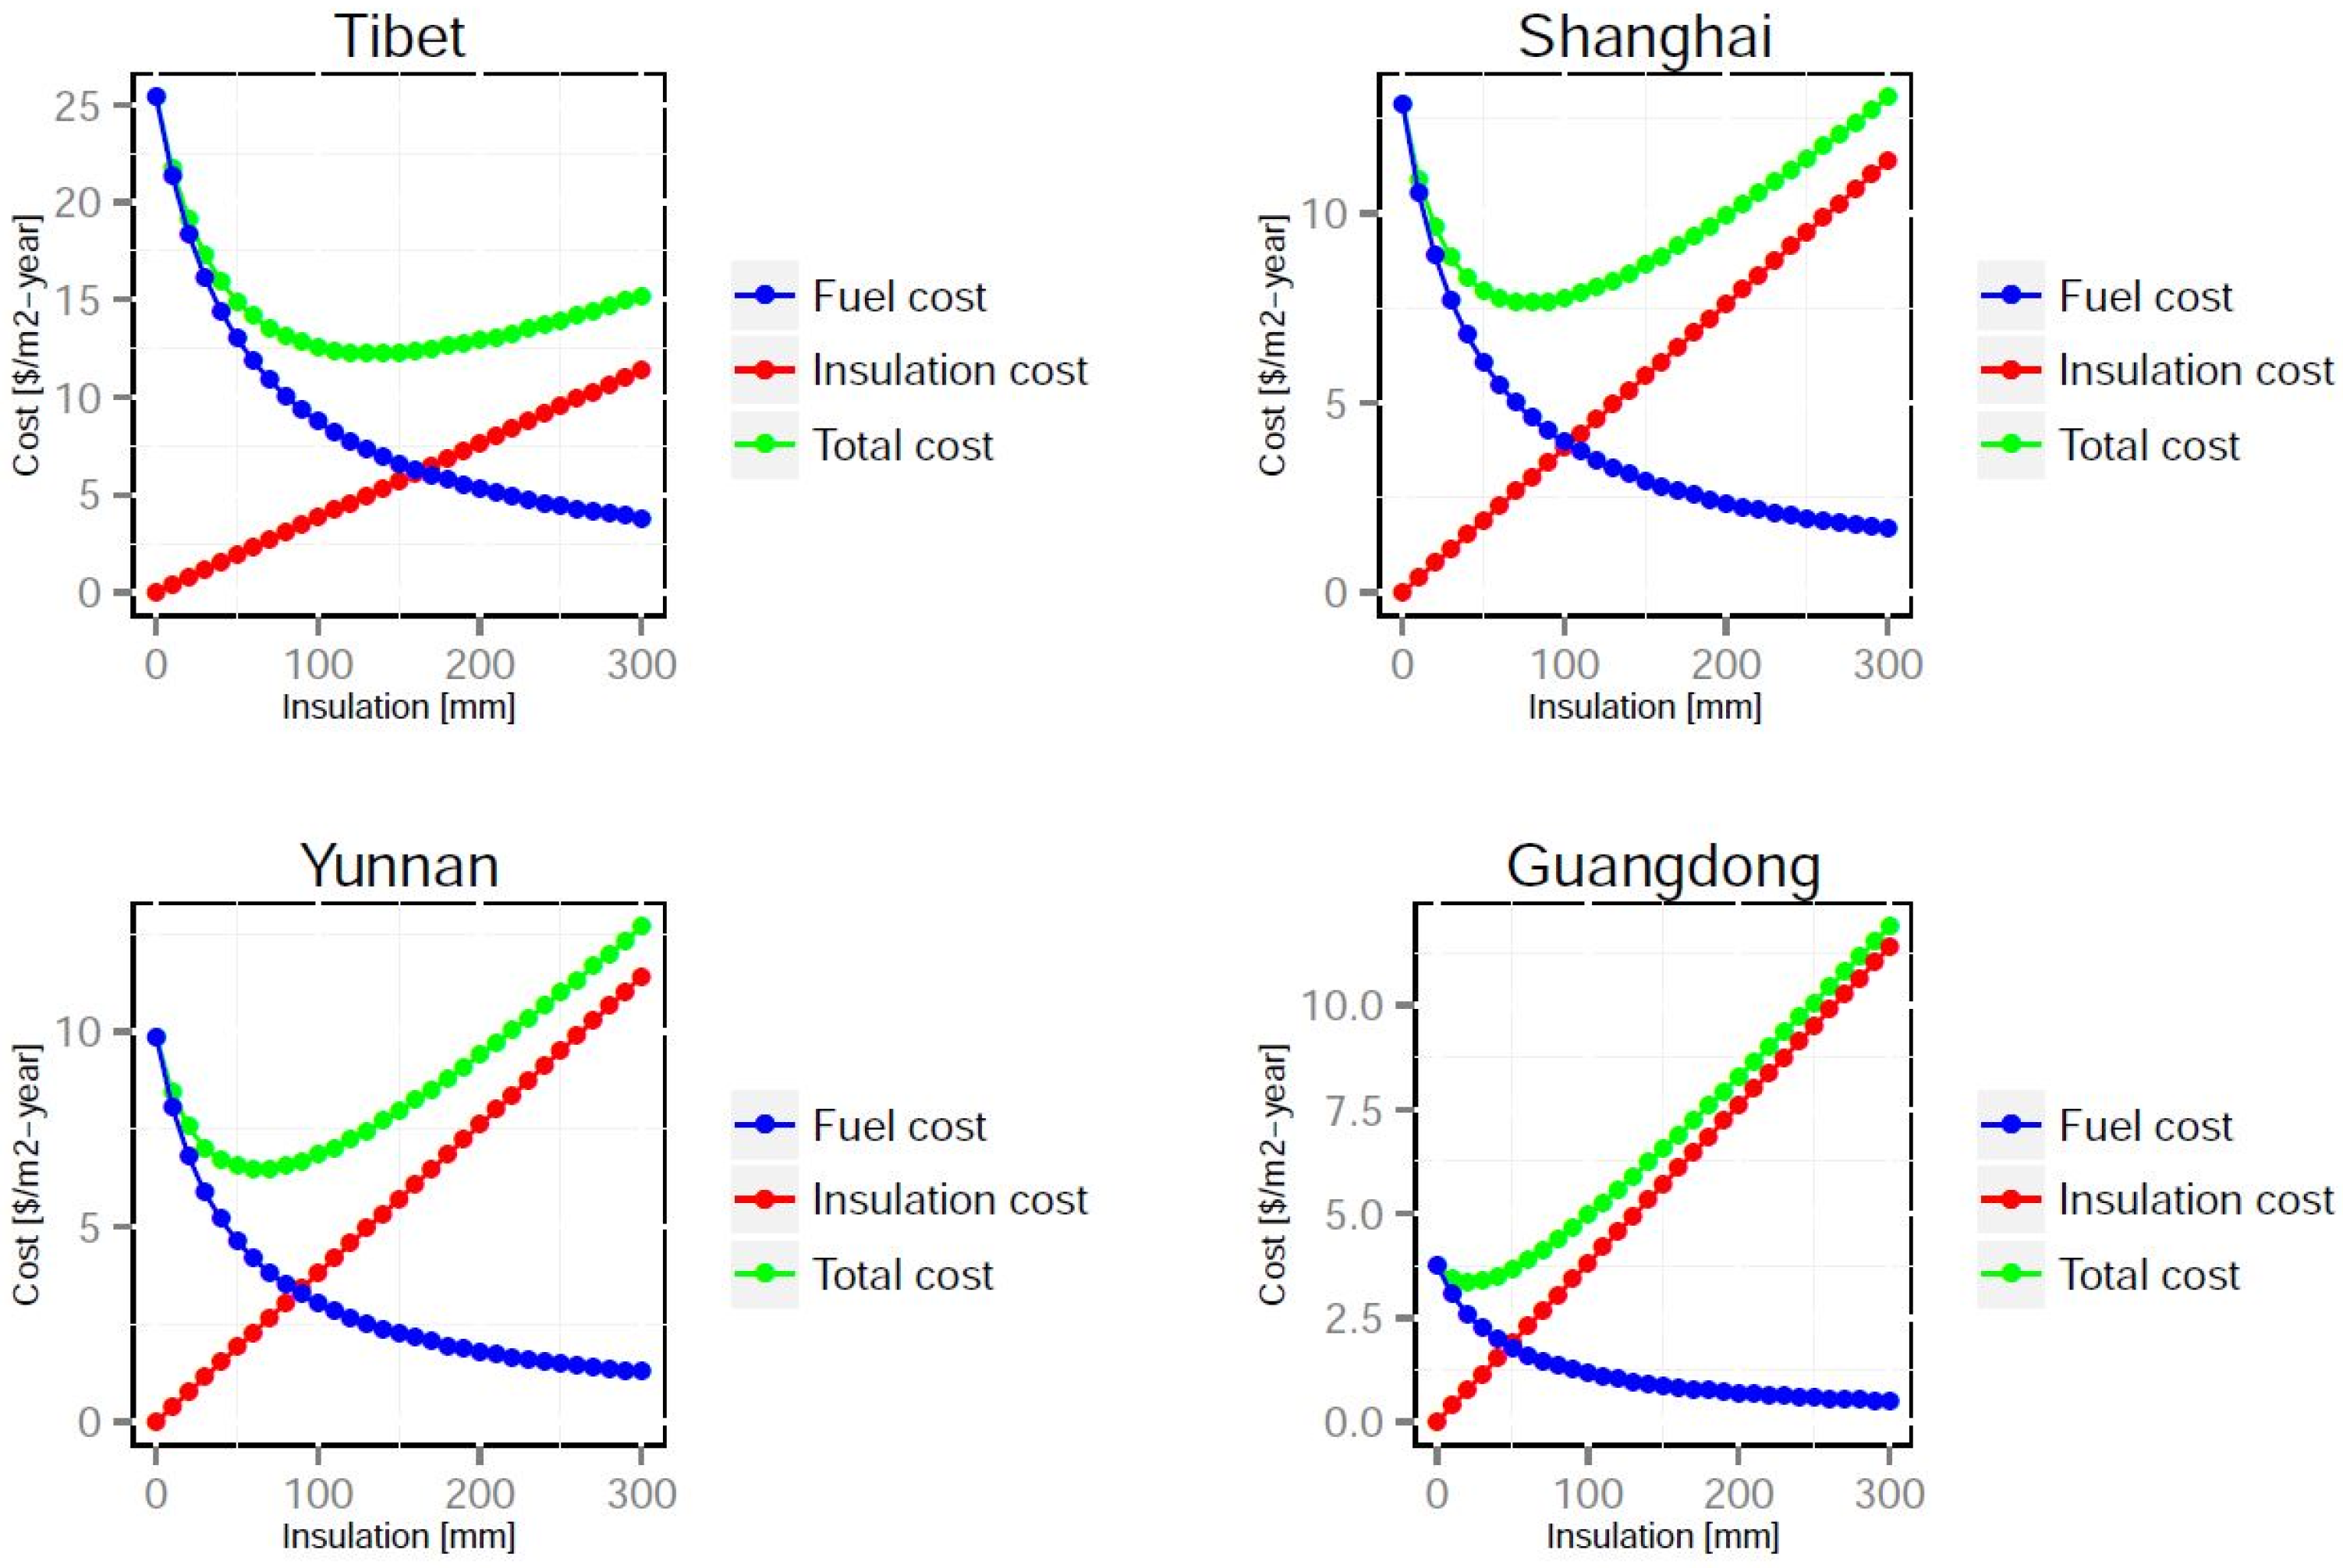
Figure 7.
Annual energy cost saving versus insulation thickness for Tibet, Shanghai, Yunnan and Guangdong.
Figure 7.
Annual energy cost saving versus insulation thickness for Tibet, Shanghai, Yunnan and Guangdong.

Figure 8.
Annual CO2 emissions versus insulation thickness for Tibet, Shanghai, Yunnan and Guangdong.
Figure 8.
Annual CO2 emissions versus insulation thickness for Tibet, Shanghai, Yunnan and Guangdong.

Table 1.
Parameter value used in the calculations.
| Parameter | Unit | Value |
|---|---|---|
| Cost of insulation material (Cins) | ||
| Expanded polyurethane (EPS) [30] | $/m3 | 38 |
| Fuel price (CH and CC) | ||
| Natural gas [31] | $/m3 | 0.48 |
| Coal [32] | $/kg | 0.09 |
| Electricity [33] | $/kWh | 0.09 |
| Fuel value (HH and HC) | ||
| Natural gas [11] | kJ/m3 | 48,570 |
| Coal [11] | kJ/kg | 25,122 |
| Electricity [25] | KJ/kWh | 3600 |
| Efficiency of heating system (ηH) | ||
| Natural gas [34] | [-] | 0.93 |
| Coal [29] | [-] | 0.65 |
| Present worth factor (PWF) | ||
| Interest rate (i) [35] | [-] | 4.35% |
| Inflation rate (g) [36] | [-] | 2.3% |
| N | [yr] | 10 |
Table 2.
Calculation results for 32 regions of China.
| Regions | HDD18.0 [°C-day] | CDD28.0 [°C-day] | OIT [mm] (Optimum Rins [m2K/W]) | Ecs [$/m2-yr] | mco2 Reduction [kg/m2-yr] |
|---|---|---|---|---|---|
| Bejing | 3155.4 | 0 | 75.14 (1.79) | 4.07 | 20.80 |
| Gansu | 2773.3 | 0 | 67.16 (1.60) | 3.25 | 17.30 |
| Hebei | 2625.1 | 0 | 63.91 (1.52) | 2.94 | 15.29 |
| Heilongjiang | 5121.7 | 0 | 110.16 (2.62) | 8.76 | 37.86 |
| Henan | 2141.0 | 0 | 52.62 (1.25) | 2.00 | 11.40 |
| Jilin | 4690.4 | 0 | 103.15 (2.46) | 7.68 | 33.59 |
| Liaoning | 3975.3 | 0 | 90.79 (2.16) | 5.95 | 27.41 |
| Inner Mongolia | 4230.6 | 0 | 95.32 (2.27) | 6.56 | 30.29 |
| Ningxia | 3515.4 | 0 | 82.24 (1.96) | 4.87 | 24.25 |
| Qinghai | 4321.1 | 0 | 96.89 (2.31) | 6.78 | 30.94 |
| Shaanxi | 3220.6 | 0 | 76.46 (1.82) | 4.22 | 21.22 |
| Shandong | 2641.7 | 0 | 64.28 (1.53) | 2.97 | 16.48 |
| Shanxi | 3753.7 | 0 | 86.73 (2.07) | 5.43 | 25.88 |
| Tianjin | 2731.5 | 0 | 66.25 (1.58) | 3.17 | 17.04 |
| Xinjiang | 6085.0 | 0 | 124.81 (2.97) | 11.24 | 47.34 |
| Tibet | 6786.9 | 0 | 134.76 (3.21) | 13.11 | 52.80 |
| Anhui | 1775.8 | 27.3 | 89.67 (2.14) | 6.91 | 43.56 |
| Chongqing | 1308.5 | 3.0 | 70.12 (1.67) | 4.23 | 29.32 |
| Fujian | 496.6 | 2.6 | 26.30 (0.63) | 0.59 | 7.34 |
| Guangdong | 423.2 | 18.6 | 21.86 (0.52) | 0.41 | 4.82 |
| Guangxi | 381.6 | 23.5 | 18.94 (0.45) | 0.31 | 4.35 |
| Guizhou | 2035.8 | 0 | 98.28 (2.34) | 8.30 | 51.61 |
| Hainan | 14.1 | 47.8 | 0 (0) | 0 | 0 |
| Hubei | 1569.1 | 57.5 | 82.67 (1.97) | 5.87 | 36.99 |
| Hunan | 1454.3 | 55.5 | 78.01 (1.86) | 5.23 | 34.29 |
| Jiangsu | 1831.5 | 20.7 | 91.54 (2.18) | 7.20 | 44.92 |
| Jiangxi | 1353.8 | 75.8 | 74.51 (1.77) | 4.76 | 31.94 |
| Paracel Islands | 31.6 | 0.5 | 0 (0) | 0 | 0 |
| Shanghai | 1478.4 | 34.6 | 78.32 (1.86) | 5.27 | 34.83 |
| Sichuan | 1430.8 | 0 | 75.24 (1.79) | 4.86 | 33.69 |
| Yunnan | 1150.3 | 0 | 62.89 (1.50) | 3.40 | 24.21 |
| Zhejiang | 1542.4 | 45.6 | 81.24 (1.93) | 5.67 | 36.35 |
Note: the upper 16 regions belong to Severe Cold and Cold climatic zones and the lower 16 regions belong to Hot Summer & Cold Winter, Temperate and Hot Summer & Warm Winter climatic zones; the value in the parenthesis of OIT column is the value of optimum thermal resistance of insulation.
© 2017 by the authors. Licensee MDPI, Basel, Switzerland. This article is an open access article distributed under the terms and conditions of the Creative Commons Attribution (CC BY) license (http://creativecommons.org/licenses/by/4.0/).
Share and Cite
MDPI and ACS Style
Yuan, J.; Farnham, C.; Emura, K. Optimum Insulation Thickness for Building Exterior Walls in 32 Regions of China to Save Energy and Reduce CO2 Emissions. Sustainability 2017, 9, 1711. https://doi.org/10.3390/su9101711
AMA Style
Yuan J, Farnham C, Emura K. Optimum Insulation Thickness for Building Exterior Walls in 32 Regions of China to Save Energy and Reduce CO2 Emissions. Sustainability. 2017; 9(10):1711. https://doi.org/10.3390/su9101711
Chicago/Turabian StyleYuan, Jihui, Craig Farnham, and Kazuo Emura. 2017. "Optimum Insulation Thickness for Building Exterior Walls in 32 Regions of China to Save Energy and Reduce CO2 Emissions" Sustainability 9, no. 10: 1711. https://doi.org/10.3390/su9101711
Note that from the first issue of 2016, this journal uses article numbers instead of page numbers. See further details here.