Targeting International Food Aid Programmes: The Case of Productive Safety Net Programme in Tigray, Ethiopia


1
Department of Geography, Ghent University, B-9000 Ghent, Belgium
2
Economics and Rural Development, Gembloux Agro-Bio Tech, University of Liège, 4000 Liège, Belgium
3
College of Business and Economics, Mekelle University, P.O. Box 231, Mekelle, Ethiopia
4
Department of Conflict and Development Studies, Ghent University, B-9000 Ghent, Belgium
5
The Horn Economic and Social Policy Institute (HESPI), P.O. Box 2692 code 1250, Addis Ababa, Ethiopia
*
Author to whom correspondence should be addressed.
Sustainability 2017, 9(10), 1716; https://doi.org/10.3390/su9101716
Submission received: 28 August 2017
/
Revised: 15 September 2017
/
Accepted: 20 September 2017
/
Published: 25 September 2017
(This article belongs to the Section Sustainable Agriculture)
Abstract
:Ethiopia has experienced more than five major droughts in the past three decades, leading to high dependency on international food aids. Nevertheless, studies indicate that asset depletion has not been prevented; neither did food insecurity diminish. Since 2004/5, the Productive Safety Net Programme (PSNP) has been implemented to improve food security in Tigray, Northern Ethiopia. Critics point out that the implementation of food aid programmes can have negative impacts as well as positive outcomes for local communities. Accordingly, this survey study aimed to analyse the distribution and allocation of food aids in the Productive Safety Net Programme (PSNP) in Tigray. Results of 479 interviews revealed that targeting different households in the PSNP has been considerably linked to socio-demographic attributes among which age and size of family were decisive factors to receive food aids. Furthermore, older households with smaller family size received more direct support. Inequality between genders was another major finding of this study. When combined with the marital status, there was also a big difference in the percentage of married or unmarried women receiving food aids. These findings could provide fundamental information for policy intervention to correct food security programmes at household level and reduce hunger. Given that, socio-demographic factors can help to identify particular and usually different requirements, vulnerabilities and coping strategies of the members of the food aid programme, so that they can be much more addressed when an emergency happens.
1. Introduction
Food deficits and famines are well-known problems worldwide, especially in Africa where the infamous famine of 1983–1984 affected the Horn of Africa deeply. Responses to these problems like emergency appeals and food aid programmes have a long history of preventing mass starvation. Accordingly, many food aid programmes have focused on the African countries, among which Ethiopia has been one of the main targets for many years [1]. In 2011, 62% of all food aid worldwide was intended for Sub-Saharan Africa (SSA). Nowadays, Ethiopia, as the second most populated African country, receives 19% of all food aids to Sub-Saharan Africa (SSA) and is highly dependent on this international food aid [2]. This country has experienced five major droughts in the past three decades (1971–1975, 1982–1986, 1987–1988, 1990–1992, 2008/9) [3,4], leading to high dependency on international food aids [5,6,7,8].
In Ethiopia, a large proportion of food aid has been distributed in the form of free transfers [9]. Attaining food security at household level is arguably one of the most effective ways to protect all family members from food insecurity and reduce poverty that is viewed through diversifying the income base of the poor [10,11]. The two main programmes, which are trying to reach this diversification, are the Food for Work (FFW) and the Food Security Package (FSP). The former was first used in Ethiopia in the 1960s. During the 1980s, an extensive national FFW soil conservation and afforestation project had been managed by the government using labour brigades [12]. With regard to inclining dependency on relief food aid, the Ethiopian government and foreign donors refocused food aid on development activities via FFW and demanded increased accountability for its use [13]. Given the resource constraints and level of poverty in Ethiopia, food deficiencies have to be backed up by long-term predictable support systems. Realizing the shortcomings of existing FFW programmes to achieve such support systems, the Productive Safety Net Programme (PSNP) was introduced in 2004/5 [10]. Some evidence suggests that food aid programmes have been reducing household vulnerability in Ethiopia, but it would be helpful to improve the targeting of these programmes [14]. Similarly, the findings of the analysis carried out by Coll-Black et al. [15] reveals that the targeting in the PSNP is progressive and that the direct supportive part of the program has been one of the best-targeted programs at global level. In this regard, Coll-Black et al. [16] suggest that the PSNP has been successful in targeting resources to the poorest households in rural areas through making a combination of community- and geographic-based targeting. Accordingly, the PSNP is designed to enhance longer-term food security of chronically food-insecure people through cash and food transfers [9]. Coll-Black et al. [17] argue that the PSNP aimed at targeting those households that are both poor and food-insecure. Overall, the targeting principles developed through the Project Implementation Manual (PIM) are being followed, but with a minor difference in some regions. The Program Implementation Manual (PIM) describes how to find eligible groups (i.e., persistent food-insecure households). Mechanisms utilized to identify eligible households encompass administrative, geographical, and community targeting approaches. The PSNP programme consists of two major projects: Direct Support (DS) and Public Work (PW), otherwise called FFW programmes [18]. In addition, the Other Food Security Programme (OFSP) has been implemented to encourage households to increase income generated from agricultural activities and to build up assets [5,18].
However, such food aids remain at the crux of a popping-up debate. Critics believe that asset depletion has not been prevented; nor did such programmes diminish food security [14,19,20]. Opponents also point out that the implementation of food aid programmes can have negative impacts as well for local communities. The variation of food aid across communities (which community gets aid, when and how much) over time suggests that there is much scope for improvement [14]. However, according to De Rudder [20], there is a significant and inverse relationship between agricultural production per capita (at district level) and the percentage of the population that participates in the PSNP in Ethiopia—districts with greater agricultural production per capita have a generally lower percentage of members in the PSNP, and vice versa. Riesgo et al. [21] simulated the distributional effects of fertilizer subsidy programs on the productivity and food security of Ethiopian smallholder farmers. A study by Daidone et al. [22] shows positive effects of social programmes for food security on homestead gardening and productive agricultural activities. Ritzema et al. [23] estimated the effects of intensification strategies on food availability. Their results exhibited considerable diversity within and across sites in household food availability status and livelihood strategies.
According to Little [24], because Ethiopia has been the largest global recipient of food aid during the past two decades, it has a greater risk compared to other recipients to experience certain effects of food aid. Regionally, Bishop and Hilhorst [19] analyse the implementation of the PSNP in two villages of the Amhara region. The authors argue that the implementation of the PSNP changed the objective from helping the most vulnerable persons towards the middle-income group. Local authorities started using the PSNP to realise the voluntary resettlement programme, by which the Ethiopian government aimed to move the people from the highlands to the lowlands. People in the poor income group were excluded from the PSNP as an incentive to resettle [19]. Nega et al. [10] and Segers et al. [25] conclude that participation in the FFW programme does not have a strong and significant effect on chronic and transitory poverty. Benefits from the FFW programme are skewed towards households in the richest and the middle tertiles. These findings have important implications for anti-poverty measures, where targeting seems a problem especially in the FFW. Therefore, Ethiopia is a good case to look into the efficacy of food aid programmes.
Therefore, it is necessary to critically review the impacts of food aid on other development programmes [19,25], food subsidies [26], possible dependency syndromes for recipient countries as well as households [1,24,27], and the efficacy of food aid distribution and allocation [9]. Despite a large volume of literature discussing the effects of food aids, there is a current lack of research investigating the effects of food aid on the Productive Safety Net Programme (PSNP). To fill this gap, this study seeks to analyse the distribution and allocation of food aids between households with different socio-demographic attributes. More precisely, the paper tries to compare the socio-demographic profile of different target groups of the PSNP in Tigray, Northern Ethiopia.
2. Materials and Methods
2.1. Study Area
Ethiopia is divided into 11 main regions including Tigray in the northern part of the country, which is located approximately between 12°N and 15°N and 36.46°E and 40°E. Tigray extends over a total area of 41,410 km2 with an estimated population of 6.96 million. The population density in 2010 was 75.1 per km2, and the average annual population growth rate was estimated at 2.1 over the period of 2010–2015 [28].
The studied kushets have been selected depending on four main criteria. First of all, the village had to be accessible from a nearby town and cooperation with local people had to be possible. Second, the village had to be large enough to take at least 35 interviews at household level. According to the UN Population Fund [29], the average household size in the rural areas of Tigray is 4.6 persons per household. This means that the village should have around 400 inhabitants to make sure that enough interviews of different types of households can be held. Possibilities for types of households are: a young couple with (all of) their children; an older couple with some (grand)children; a widow(er) with(out) children; the elderly with(out) children; and so forth. Another criterion was that the village should not be too close to the town, to avoid changing from the rural type into the urban by the (way of) generating income and the PSNP. Finally, the availability of earlier research was the last criterion, the comparison between recent data and earlier scientific research makes it possible to draw some conclusions or to see the changes and effects of FFW programmes in a specific village or town.
The different kushets used as study areas are located nearby regional towns on a mainly north-south axis through the eastern part of Tigray, following the main road connecting most of these regional towns (Figure 1).
2.2. Data Collection
The study benefits from a mixed-methodology approach that integrates both qualitative and quantitative techniques. The quantitative technique to collect the data was a survey conducted through 479 interviews with rural people using a structured questionnaire across 13 villages, and kushets included about 200 households [30] in 12 woredas (districts) in Tigray, Northern Ethiopia. The rural people older than 15 years old were interviewed because they gave a complete and workable set of information from the household. Between 35 and 40 interviews were conducted over two days of fieldwork in each village. The open questions were about socio-demographic attributes of households, types of vegetables, the variability in market prices, main income, secondary income, membership of PSNP, market, and so on. Appendix B shows all the questions of the structured interview with rural people.
The qualitative technique to collect the data was 15 interviews (open-ended questions) and two informative conversations with the representatives of the PSNP in the agricultural office of each woreda.
The preliminary version of the interview was based on a literature research and an earlier research about the PSNP [31]. The final version of the questions (see Appendix A and Appendix B) has been developed after the first eight interviews in May Ba’ati near Hagere Selam. In order to improve the reliability of the answers, all the interviews were recorded and transcribed. The SPSS 16.0 (SPSS Inc., Chicago, IL, USA) software was used for conducting descriptive analysis, Chi-square and Cramer’s V coefficients and analysis of variance (One-Way ANOVA).
In order to make a triangulation and increase the validity of the data, the collected data were compared with other sources of information, particularly by interviewing the representatives of the PSNP in the agricultural office in each woreda. First, the number of members for Public Work (PW) and Direct Support (DS) on the household and individual level was obtained. The second part of the information includes the planned and actual distributed amount of food and cash divided into PW and DS. The last part was a semi-structured interview about the specific details of the PSNP in the specific woreda (see Appendix A). The PSNP uses these administrative subdivisions to regulate and control the food and cash distributions to their members.
3. Results
3.1. Socio-Demographic Attributes of Households
Table 1 gives an overview of the socio-demographic attributes of the studied households. Every characteristic included in this household study is divided into different sub-categories. The exact number of participants as well as proportional divisions are listed according to each (sub)category in this table.
According to the findings of this study, the average age of the participants was 48.1 years. More than two-thirds of the participants were more than 31 years old, whereas 22% were young (range: 15–34; mean: 25.5 years). The majority (79.1%) of the respondents were married. The gender composition of the population covered by the survey was 54.5% male. The average household size across the entire sample was 5.6 members. Households with big family size (6–12 persons) comprised of 54.3% and the households with small family size (1–5 persons) comprised 45.7%. The majority (92.7%) of the respondents held their own farms. Interestingly, most of those (74.9%) who intended to PW for free may sell (72.3%) their farms or move (67%) to other places when necessary.
3.2. Socio-Demographic Attributes of Households in Different PSNP Memberships
An analysis of variance (ANOVA) was used to determine whether or not there is a significant difference in the ‘Age’, ‘Children’ and ‘Family size’ attributes of the respondents and their three types of membership of the PSNP (Table 2 and Table 3).
The average value of ‘age’, ‘children’ and ‘family’ for each type of membership of the PSNP is calculated. For ‘Age’, the mean value within the direct support (DS) type of membership of the PSNP is significantly higher (65.24) than the PW (43.66) and the non-members group (47.33) (Table 2). A similar difference can be found in the mean values of ‘family size’. The average family size for the DS is significantly smaller (3.59) than the Public Work (PW) (5.82) and non-members (5.92). As shown in Table 2, the variable ‘children’ does not have a significant difference in mean for the three categories of the PSNP. The variable ‘children’ will not be used to explain the variability that exists in the membership types of the PSNP.
Since the ‘Levene Statistic’ was not significant for any of the variables, we can conclude that the variance is not equal for all the categories of the factor (membership of the PSNP). The least significant difference (LSD) test is used since equal variances are not assumed. The results of this test indicate that ‘age’ has a significant difference in mean (9061.728) between all three categories of the PSNP whereas ‘family’ has only a significant difference (119.757) when comparing DS to the other categories. This means that ‘age’ can provide a good indication for the difference in the type of membership. The ‘family size’ could also be a good indication whether or not someone is a member of the DS type of membership.
3.3. Socio-Demographic Characteristics and the PSNP Membership Type
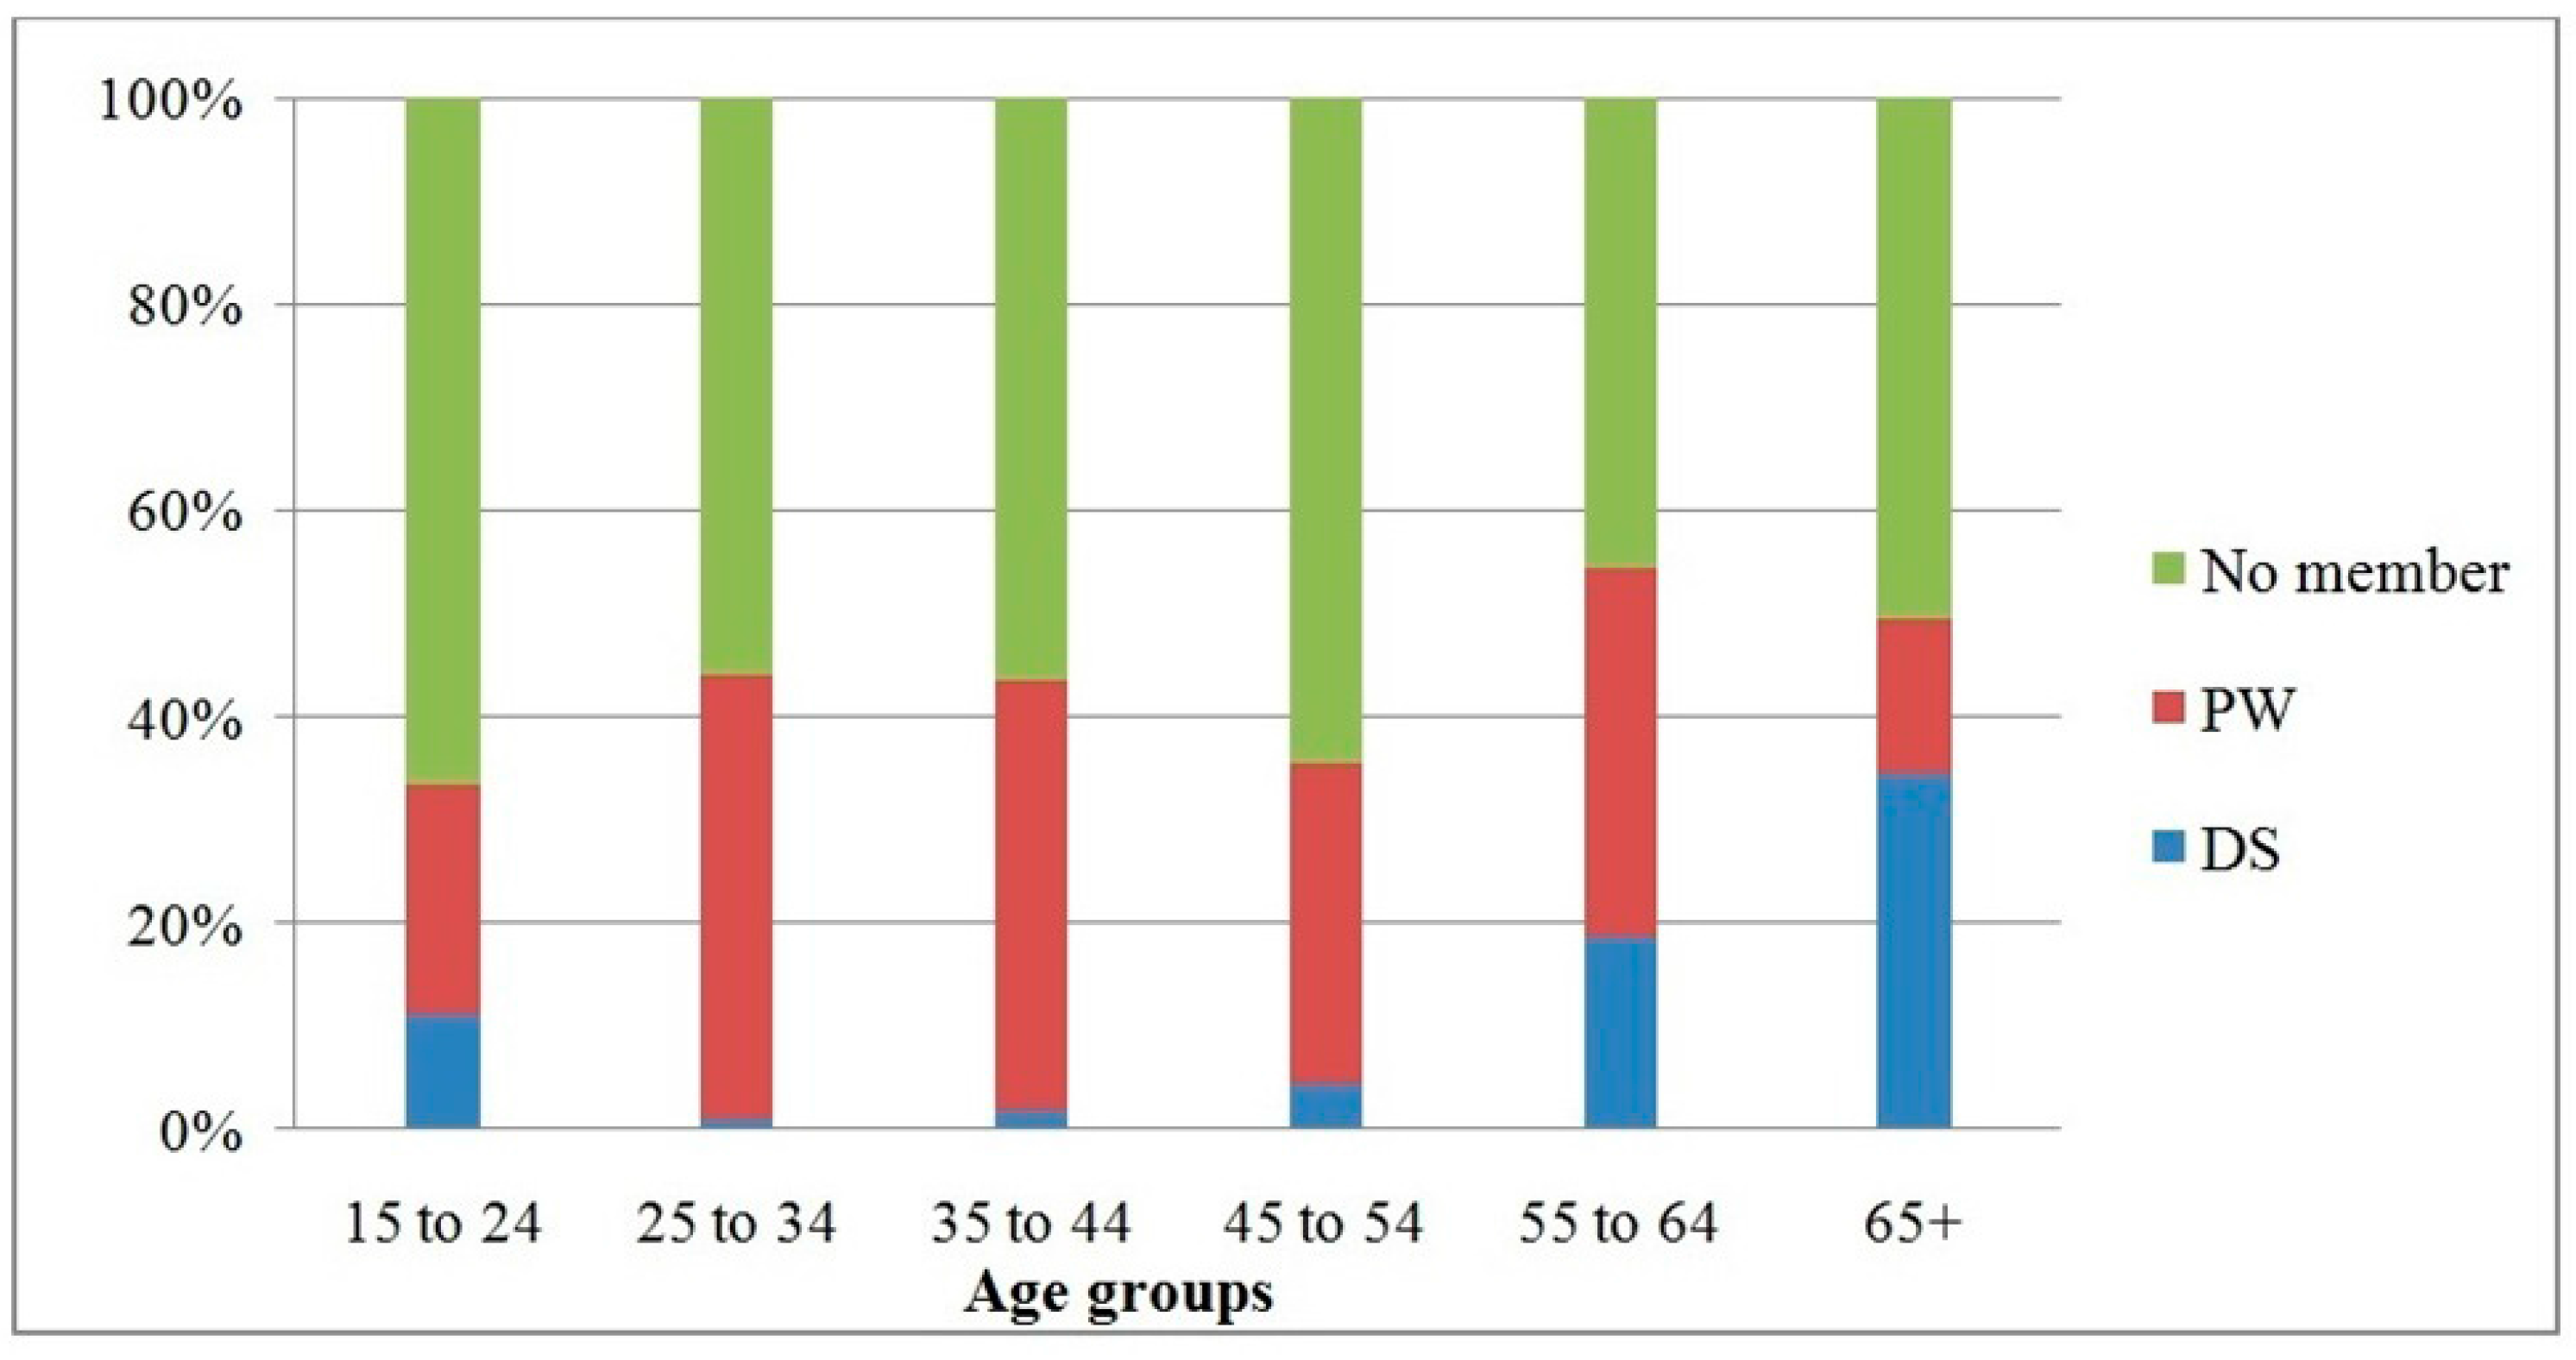
A chi-square test was used to understand the independency of socio-demographic characteristics of the households and their type of membership in PSNP. The independent variables are divided into two categories: socio-demographic characteristics, and other defining characteristics. The first independent variable in the category of socio-demographic characteristics is ‘Age’, for which the chi-square test cannot be used; however, the Cramer’s V value indicates a moderate connection (see Appendix C). Therefore, the variable is reclassified into seven ‘AgeGroups’. The Pearson chi-square value for this variable is statistically significant, meaning that both variables are not independent (see Appendix C). Furthermore, the percentage of people receiving DS in a certain age group (range: 0–30%) is generally lower than the percentage of people receiving PW (range: 5–50%). The PSNP membership type is partially based on the availability of family members who are able to work in a household. Sometimes people receive food or cash for four persons, but only two persons participate in the PW (parents with children for instance). As soon as someone in a household is able to work, s/he would participate in the PW, and is not brought from DS. As shown in Figure 2, from the age of 55, the percentage of people receiving the DS increases (18.6%) and reaches its highest level at 65+ age group (34.5%). To compare, only 1.1% of the respondents between the ages of 25 and 34 receive the DS, while more than half (58.8%) of all the DS is meant for the oldest age group (65+). The percentage of PW households is distributed quite differently compared to those who received DS. More than one-third of the people between the age of 25 and 64 receive the PW, while only 14.9% of the elderly (65+) and 22.2% of the youngest age group (15–24) receive PW. The percentage of people not being a member of PSNP varies between 45.7% (age 55–64) and 66.7% (age 15–24).
The percentage of the women receiving the DS (15.9%) or PW (39.6%) is 55.6%, which is more than the figure (35.5%) of the men (Table 3). It is noticeable that 64.7% of all the DS is attributed to women. Since the main source of income in Ethiopia is self-sufficient agriculture, and farming consists of hard manual labour, women are in a disadvantaged situation that can be aggravated by widowhood, a divorce or old age.
These results reveal that AgeGroups and Gender are not equally significant for DS and PW. The difference in ‘AgeGroup’ is more significant for DS than for PW. This is already explained based on the outcomes of the One-Way ANOVA. 58.8% (30 persons) of all DS goes to household-heads who are older than 65, whilst only 8.6% (13) of all PW goes to the same age group. Gender gives a significantly better indication for people receiving PW than for DS. Out of 207 women, 82 (39.6%) receive PW, whilst for men, 70 out of 248 (28.2%) receive PW. A similar difference can be found for DS (15.9% and 7.3%).
The marital status of people was divided into four main categories: married; widow(er); divorcee, and; not married. Since both the Pearson chi-square and Cramer’s V values are not significant, the variable has been changed into a binary variable, containing only two possible categories as married and not married (widow(er), divorcee and not married grouped together). When the Cramer’s V of the categorical variable ‘MarriedCategoric’ (0.245) is compared to the one from the binary variable ‘MarriedBinary’, there is a significant increase (0.329) (see Appendix C). This means that there is an association between the marital status of a person and his or her type of membership of the PSNP. 29.5% of the people who are not married receive the DS compared to 6.4% of the married people. The percentages of married or unmarried persons receiving the PW are similar (respectively 31.9% and 38.9%), whilst the percentages of people who are not a member are rather divergent (respectively, 61.7% and 31.6%) (Table 3).
Lastly, the number of family members in a household is moderately related to the type of membership of the PSNP (Cramer’s V value: 0.324, see Appendix C). Similarly to the conversion of the independent variable ‘children’, we can use the average size of family members as a threshold value (5.6) and decide which household has small or large (respectively, 0 and 1) size. The Pearson chi-square value (see Appendix C) indicates that the distribution of people across different types of membership is unequal for small and large families where 18.3% of the small families receive the DS, compared to 5.3% of the larger families. The percentages of small and large PW households and those who are not a member of the PSNP are rather similar. Nevertheless, the figure for small (31.7%) and large (34.8%) households receiving PW is smaller than those small (50.0%) and large (59.9%) families that are not a member. Overall, 74.5% of all DS is intended for small families and most of them consist of a widow with one or more children or elder people, which explains the unequal distribution of DS.
4. Discussion
This research aimed to analyse the relationships between household characteristics and of the Productive Safety Net Programme (PSNP) membership type in Tigray region (North Ethiopia). A combination of qualitative and quantitative interviews at a household and woreda level during eight weeks of fieldwork has resulted in the necessary data. An analysis of the household characteristics as related to of the PSNP membership type provided a number of key findings for this targeting system. Socio-demographic characteristics of a household are the main indicators for the PSNP membership type. Age is a decisive factor for a household to receive DS. The average age was significantly higher for the recipients of DS as compared to recipients of public work (PW) or non-members. The major part of all distributed DS goes to people older than 65. The size of a family is inversely related to the type of membership of the PSNP as compared to age. The fewer household members, the greater the odds for a household to receive DS. Inequality between sexes is also a major finding of this study. A significantly higher percentage of women is a member of the PSNP as compared to men. When combined with the marital status, there is a big difference in the percentage of married or unmarried women receiving DS and PW. Unmarried women receive more DS than married ones and married women receive more PW compared to unmarried women. Community work or ‘PW for free’ is another indicator for the differences in type of membership of the PSNP. People who are able to work can participate in the PW projects. The odds of being a member of the PW type of membership increase significantly when a household participates in community projects. This study revealed that characteristics of a household decrease the chances of being a member by improving food security and food aid is less unpredictable and better targeted because a lot of household characteristics are taken into account.
4.1. PSNP Targeting Groups
The earlier research conducted by Devereux et al. [32] is based on household surveys in 2006 after the first year of implementing the PSNP in Ethiopia. In this study the targeting of households for the PSNP has been linked to socio-demographic criteria. Devereux et al. [32], state that households who are a member of the PSNP are significantly more likely to be female-headed than the non-members, and to have elderly as a household head. This means that the share of people who receive DS or PW is not equally divided between both sexes. Single women are more likely to receive food aid as compared to male-headed families. The same goes for the elderly. The older someone becomes, the higher is the chance to become a member of the programme. This finding corresponds to the ones about age, age groups, gender and marital status in this study. In addition, according to Devereux et al. [32] the PSNP was well targeted using labour constraints as targeting criteria. They assessed the labour constraints more thoroughly by using multiple indicators. However, a corresponding indicator between their study and this study is the size of a family as a decisive factor to receive food aids. In this study, the average household size was 5.82 for PW, 3.59 for DS and 5.92 for non-members. While the average household size in the study by Devereux et al. [32] was 5.75 for PW, 3.16 for DS and 5.96 for non-members. However, Lawrence [33] found that the average household size for his study sample was six people, and this was the same for the households that received food aid and the households that did not receive food aid. Dekker [34] also found that the amount of food received from the free distribution programme (DRP) in Zimbabwe depended on the household size, so households tried to achieve this number in order to receive more assistance. These findings are in contrast with our findings about family size, where small families were those who received more PSNP compared to larger families. Moreover, the variability in data points to the fact that there are quite some households that have assets and still are allowed to participate in paid public work (PW) or even receive DS. This can partly be expected by bias that occurs in distribution, and in which farmers with more social or political skills manage to obtain such support [25].
4.2. Age and Family Size as Indicators for PSNP Membership
From the age of 55, the percentage of people receiving the DS increases (18.6%) and reaches to its highest level at 65+ age group (34.5%). To compare, only 1.1% of the respondents between the age of 25 and 34 receive the DS, while more than half (58.8%) of all the DS is meant for the oldest age group (65+). This indicates that the DS is mainly targeted towards the elderly who are unable to work. Between the means of the other variable about family size, similar differences can be observed. Households who receive DS have an average of 3.6 household members, whilst the average for PW is 5.8 and for non-members 5.9. This means that smaller families, often single people or the elderly (possibly with a few children), have a greater chance of receiving DS when compared to larger families. These findings are consistent with the conditions of the PSNP targeting. The PSNP is meant for food-insecure people, such as the elderly. They are not able to cultivate their own crops and this fact makes it difficult to maintain a family in a largely self-sufficient agricultural environment. If they are part of a larger family, this might be an indication of a kind of social safety net. Smaller families are primarily depending on their own income and are therefore more vulnerable to food shortages. Similarly, Quisumbing [35] examined the characteristics that determine participation in food-for-work programmes (FFW) and free distribution (FD) programmes in rural Ethiopia. The author found that membership in FD or FFW programmes are affected by household size and its structure, however, these impacts vary between FFW and FD programmes. Larger households have a higher probability to be a member in FFW, but a lower chance to receive FD. In contrast, Kattenberg [36] made a comparison between food aid receipts in 1995–1996 and receipts between1996–1997 and 1998–1999 in order to evaluate whether or not there was a target regarding the supplying of Drought Relief programme (DRP) food aid programme in Zimbabwe. He found that there is a negative significant relationship between household size and food aid allocation as larger households receive less food aid per capita. Bogale and Shimelis, [37] in this regard, identified specific socioeconomic factors that affect food insecurity of households in rural areas of Dire Dawa and Eastern Ethiopia, using a logit model. They found that family size is one of the factors that showed a theoretically stable and statistically significant influence on household food insecurity, indicating that the probability of being food insecure increases with an increase in the family size.
4.3. Age and Gender as the Indicators for PSNP Membership
The difference in statistical significance emanates from the fact that age gives a better indication whether people will receive help or not for the DS system than for the PW system. In line with our finding, Lawrence [33] in his study in Northern Uganda found that the average age for households that received food aid was 43 years, and this was significantly higher than non-food aid receiver households (37 years). Furthermore, Quisumbing [35] concluded that households in rural Ethiopia with a higher proportion of females aged 15 to 65 are also more likely to be a member in FFW-programmes. Nevertheless, households with a high proportion of females under 15 years of age are less likely to participate in the FFW, whereas households with a greater proportion of children aged 0–15 are more likely to receive FD. Bogale and Shimelis [37] also found that the age of household’s head is one of the main effective variables on the probability of household to be food insecure showing a negative relationship with food insecurity.
The other socio-demographic characteristic ‘Gender’, is inversely related to the type of membership of PSNP. In contrast, Bogale and Shimelis [37] cited that the estimated coefficients for the gender of the household’s head and amount of food aid received were not statistically significant in determining household food insecurity. However, our findings are not only based on the household heads. Hence, a combination of the marital status and gender could give a better indication, since being a single mother is a totally different situation from being a mother in a family with a husband and children. It was found that 37.2% (77) of all women are not married as compared to 7.3% (18) of all men. The percentage of households receiving DS is 7.8% for married and 29.9% for unmarried women. Thus, the marital status can be seen as an important indicator combined with gender. Since there are more women who are unmarried than men, this category should receive more attention in the PSNP targeting system. This is confirmed in the World Food Programme (WFP) that aims to cope with the hunger and provide food aid in emergency situations. WFP’s gender policy and particular programming for women are two important issues noted in its Commitments to Women. Its goals comprise, for example, supplying direct access by women to proper food aid, ensuring women’s equal access to and complete participation in decision-making [38].
Women are not able to maintain a family as easily as men, since agricultural activities like ploughing are hard labour and currently not done by women, hence they need to pay in cash or in kind for this work to be done by someone else. Accordingly, the results of Lawrence [33] study showed that 84% of the sampled households are male-headed, and this is the same for households that receive food aid and those which do not. Besides, in 85% of his study population, the household heads were married, and this was also the same for the households that received food aid and those which did not.
5. Conclusions
The significant differences found in this study, in relation to the influence of gender, age and family size on the type of membership of the PSNP, demonstrate that developing suitable policy responses to implement the PSNP needs precise analysis of such demographic factors to find the important differences for policy consideration between and among the targeted groups. Regarding the gender differences, more accurate data that is sex-disaggregated should be collected to assist such analyses and develop gender determinants to monitor and asses the consequences of the food aid programmes like the PSNP. The findings of this study revealed that considering the socio-demographic characteristics of households in developing target groups of PSNP can help to identify vulnerable groups. Consequently, identifying vulnerable groups help to supply resources to those who are most in need and to improve the capacities of a major proportion of those who are often neglected. Given that, socio-demographic factors can help to identify vulnerabilities and coping strategies of the members of food aid programmes, so that they can be more adequately addressed when an emergency happens.
Acknowledgments
The authors acknowledge the professional assistance and translation services provided by Yohannes Gebreegziabher and Gebrekidan Mesfin during the data collection period, as well as advices by Amaury Frankl, Miró Jacob, Tesfaalem Gebreyohannes and Biadiglign Demissie. The information and knowledge provided by all field respondents, as well as by Aite Gizachew, head of the Productive Safety Net Programme of Tigray Region, is greatly acknowledged. Funding was partly provided by VLIR-UOS (Belgium) and logistic assistance was provided by the VLIR-UOS hub at Mekelle University (Nahusenay Teamer and his colleagues). The constructive suggestions of two anonymous reviewers are gratefully acknowledged.
Author Contributions
This study presents a team work developed by several co-authors. Fien De Rudder performed the study and wrote the main text. Hossein Azadi designed the study and enriched the first draft to come up with the final draft. Koen Vlassenroot and Fredu Nega contributed to the design and revision of the paper. Jan Nyssen critically reviewed the paper and helped with writing the manuscript. With different contributions, all the authors enriched the submitted manuscript and ended it up with the current publication.
Conflicts of Interest
The authors declare no conflict of interest.
Appendix A

Table A1.
Semi-structured interview with a representative of the PSNP in the agricultural office of each woreda.
Table A1.
Semi-structured interview with a representative of the PSNP in the agricultural office of each woreda.
| Questions | |
|---|---|
| How many kebelles are there in this woreda? | |
| Do all the kebelles receive PSNP? | |
| When did the PSNP started in this woreda? | |
| Have there been some changes to the programme? | |
| When have people been working on the PW projects this year? | |
| When have people been working on the DS projects this year? | |
| Which different types of projects does the PW participate in? | |
| Which different types of projects does the DS participate in? | |
| When did people receive the distributed food or cash this year? | |
| How much did they receive per person this year? | |
| Is there some kind of evaluating system to estimate the repercussions of the programme? | |
| Other exceptions that are typical for this woreda? |
Appendix B
Table A2.
Semi-structured interview with rural people.
| Column (Annex III) | Questions | Considerations that Help to Interpret the Answers |
|---|---|---|
| First Name | What is your first name? | |
| Last Name | What is your last name? | In Ethiopia, children receive the first name of their father as a last name |
| Age | How old are you? | Age is less documented in Ethiopia, therefore people estimate when asked |
| Gender | Man or woman? | This answer was derived without asking |
| Married | What is your marital status? | In the Orthodox Christian religion, divorce and possible remarriage are allowed |
| Children | How many children do you have? | |
| Family members | How many of your children live at home? How many family members does your family count? | Sometimes grandchildren live with their grandparents or divorced people live with their parents again |
| Main income | Is farming your main source of income? | |
| Property | Do you own some farmland? | |
| Types of crops | What are your main crops? | |
| Selling crops | Do you sell some of the grain? | |
| Vegetables | Do you cultivate vegetables? | |
| Garden/Irrigation | Do you have a garden or do you use an irrigation system for the vegetables? | Sometimes other crops are cultivated instead of vegetables (maize, sorghum, etc.) |
| Selling vegetable | Do you sell some of the vegetables? | |
| Types of vegetables | Which vegetables do you cultivate? | |
| Cattle | Do you have cattle? | Only oxen, bulls and cows are counted |
| Milking | If so, do you milk cows? Do you use this milk for your own consumption or do you sell it on the market? | |
| Prices | Do you know the variability in market prices throughout the year? | Market prices are subject to a seasonal variability |
| Good prices | Do you keep this in mind when you buy or sell something? | People may sell or buy whenever necessary or wait until the market prices are good (high to sell and low to buy) |
| Secondary income | Do you have some kind of secondary income? If so, how much do you earn this way? | |
| Member of PSNP | Are you or have you ever been a member of the PSNP? If so, what type of membership? How long have you been a member? | |
| PW for free | Do you participate in the community projects providing you free labour? | |
| Bad harvest | What would you do to provide food for your family in case of a bad harvesting season? | |
| Moving | Would you like to move to the city? | |
| Why | What would be your main reason be to stay or move? | |
| Market | How many times in one month do you go to the market in the city (cities) nearby? | Sometimes people go to the city to work or for visiting relatives, but this is about market days. |
Appendix C
Table A3.
Chi-square and Cramer’s V coefficients for the socio-demographic characteristics.
| Independent Variables | Exp. Count < 5 | Chi-Square | df | Sig. | Cramer’s V | Sig. |
|---|---|---|---|---|---|---|
| Age | 88.0% * | 219.664 | 126 | 0.000 | 0.491 | 0.000 |
| AgeGroups | 16.7% | 83.061 | 10 | 0.000 | 0.302 | 0.000 |
| Gender | 0.0% | 20.178 | 2 | 0.000 | 0.211 | 0.000 |
| MarriedBinary | 0.0% | 49.125 | 2 | 0.000 | 0.329 | 0.000 |
| MarriedCategoric | 33.3% * | 54.505 | 6 | 0.000 | 0.245 | 0.000 |
| Children | 33.3% * | 33.229 | 22 | 0.059 ** | 0.191 | 0.590 ** |
| ChildrenBinary | 0.0% | 4.213 | 2 | 0.122 ** | 0.096 | 0.122 ** |
| Family | 36.1% * | 95.724 | 22 | 0.000 | 0.324 | 0.000 |
| FamilyBinary | 0.0% | 19.368 | 2 | 0.000 | 0.206 | 0.000 |
Note: (*) The expected count should be more than five for at least 80% of all cells, so if this value is higher than 19.9%, the chi-square test cannot be used. Note II: (**) These values are higher than 0.050 and therefore, the independent variable is not significantly correlated to the dependent variable.
References
- Jayne, T.S.; Strauss, J.; Yamano, T.; Molla, D. Targeting of food aid in rural Ethiopia: Chronic need or inertia? J. Dev. Econ. 2002, 68, 247–288. [Google Scholar] [CrossRef]
- World Food Programme (WFP). 2011 Food Aid Flows; International Food Aid Information System: Rome, Italy, 2012. [Google Scholar]
- Webb, P.; von Braun, J. (Eds.) Famine and Food Security in Ethiopia: Lessons from Africa; John Wiley & Sons Ltd.: West Sussex, UK, 1994. [Google Scholar]
- Levine, S.; Crosskey, A.; Abdinoor, M. System Failure? Revisiting the Problems of Timely Response to Crises in the Horn of Africa; Network Paper 71; Humanitarian Practice Network: London, UK, 2011. [Google Scholar]
- Kumasi, T.C.; Asenso-Okyere, K. Responding to Land Degradation in the Highlands of Tigray, Northern Ethiopia; Discussion Paper 01142; International Food Policy Research Institute (IFPRI): Washington, DC, USA, 2011. [Google Scholar]
- Rosell, S. Regional perspective on rainfall change and variability in the central highlands of Ethiopia, 1978–2007. Appl. Geogr. 2011, 31, 329–338. [Google Scholar] [CrossRef]
- Sosa, M.; Cardinal, P.; Contarini, A.; Hough, G. Food choice and emotions: Comparison between low and middle income populations. Food Res. Int. 2015, 79, 253–260. [Google Scholar] [CrossRef]
- May, J. Keystones affecting sub-Saharan Africa’s prospects for achieving food security through balanced diets. Food Res. Int. 2017. [CrossRef]
- Del Ninno, C.; Dorosh, P.A.; Subbarao, K. Food aid, domestic policy and food security: Contrasting experiences from South Asia and Sub-Saharan Africa. Food Policy 2007, 32, 413–435. [Google Scholar] [CrossRef]
- Nega, F.; Mathijs, E.; Deckers, J.; Haile, M.; Nyssen, J.; Tollens, E. Rural poverty dynamics and impact of intervention programs upon chronic and transitory poverty in northern Ethiopia. Afr. Dev. Rev. 2010, 22, 92–114. [Google Scholar] [CrossRef] [Green Version]
- Kamenidou, I.; Rigas, K.; Priporas, C.V. Household behavior on food security during an economic crisis. In Food Security and Sustainability; Springer: Berlin, Germany, 2017; pp. 243–261. [Google Scholar]
- Gebremedhin, B.; Swinton, S.M. Reconciling food-for-work project feasibility with food aid targeting in Tigray, Ethiopia. Food Policy 2000, 26, 85–95. [Google Scholar] [CrossRef]
- Sharp, K. Between Relief and Development: Targeting Food Aid for Disaster Prevention in Ethiopia; Discussion Paper 27; Relief and Rehabilitation Network, Overseas Development Institute: London, UK, 1998. [Google Scholar]
- Dercon, S.; Krishnan, P. Food aid and informal insurance. In Insurance against Poverty; Dercon, S., Ed.; Oxford University Press: Oxford, UK, 2004. [Google Scholar]
- Coll-Black, S.; Gilligan, D.; Hoddinott, J.; Kumar, N.; Taffesse, A.S.; Wiseman, W. Targeting Food Security Interventions in Ethiopia: The Productive Safety Net Programme. In Food and Agriculture in Ethiopia: Progress and Policy Challenges; Dorosh, P., Rashid, S., Eds.; University of Pennsylvania Press: Philadelphia, PA, USA, 2012. [Google Scholar]
- Coll-Black, S.; Gilligan, D.O.; Hoddinott, J.; Kumar, N.; Taffesse, A.S.; Wiseman, W. Targeting Food Security Interventions When “Everyone is Poor”: The Case of Ethiopia’s Productive Safety Net Programme; Ethiopia Strategy Support Program (ESSP II), Working Paper 24; International Food Policy Research Institute (IFPRI): Washington, DC, USA; IFPRI-ADDIS ABABA: Addis Ababa, Ethiopia, 2011; Available online: http://www.ifpri.org/sites/default/files/publications/esspwp24.pdf (accessed on 21 September 2017).
- Coll-Black, S.; Gilligan, D.O.; Hoddinott, J.; Kumar, N.; Taffesse, A.S.; Wiseman, W. Targeting Food Security Interventions: The Case of Ethiopia’s Productive Safety Net Programme; Summary of ESSP Working Paper 24, “Targeting Food Security Interventions When ‘Everyone Is Poor’: The Case of Ethiopia’s Productive Safety Net Programme”; ESSP Research Note 26; IFPRI-ADDIS ABABA: Addis Ababa, Ethiopia, 2013; Available online: http://www.ifpri.org/sites/default/files/publications/essprn26.pdf (accessed on 21 September 2017).
- Gilligan, D.O.; Hoddinott, J.; Taffesse, A.S. The Impact of Ethiopia’s Productive Safety Net Programme and Its Linkages; Discussion Paper 00839; International Food Policy Research Institute (IFPRI): Washington, DC, USA, 2008. [Google Scholar]
- Bishop, C.; Hilhorst, V. From food aid to food security: The case of the safety net policy in Ethiopia. J. Mod. Afr. Stud. 2010, 48, 181–202. [Google Scholar] [CrossRef]
- De Rudder, F. Food Insecurity in Rural Tigray (North Ethiopia): Analysis of a Food-Aid Based Response. Master’s Thesis, Ghent University, Ghent, Belgium, 2013. [Google Scholar]
- Riesgo, L.; Louhichi, K.; Paloma, S.G. Modelling farm-household level impacts of fertilizer subsidy programs on productivity and food security: The case of Ethiopia. In Proceedings of the 2016 AAAE Fifth International Conference, Addis Ababa, Ethiopia, 23–26 September 2016; African Association of Agricultural Economists (AAAE): Nairobi, Kenya, 2016. [Google Scholar]
- Daidone, S.; Davis, B.; Dewbre, J.; Miguelez, B.; Niang, O.; Pellerano, L. Linking agriculture and social protection for food security: The case of Lesotho. Glob. Food Secur. 2017, 12, 146–154. [Google Scholar] [CrossRef]
- Ritzema, R.S.; Frelat, R.; Douxchamps, S.; Silvestri, S.; Rufino, M.C.; Herrero, M.; Giller, K.E.; Lόpez-Ridaura, S.; Teufel, N.; Paul, B.K.; et al. Is production intensification likely to make farm households food-adequate? A simple food availability analysis across smallholder farming systems from East and West Africa. Food Secur. 2017, 9, 115–131. [Google Scholar]
- Little, P.D. Food aid dependency in north-eastern Ethiopia: Myth or reality? World Dev. 2008, 36, 860–874. [Google Scholar] [CrossRef]
- Segers, K.; Dessein, J.; Hagberg, S.; Develtere, P.; Haile, M.; Deckers, J. Be like bees—The politics of mobilizing farmers for development in Tigray, Ethiopia. Afr. Aff. 2008, 108, 91–109. [Google Scholar] [CrossRef]
- Hoffman, W.L.; Gardner, B.L.; Just, R.E.; Hueth, B.M. The impact of food aid on food subsidies in recipient countries. Am. J. Agric. Econ. 1994, 76, 733–743. [Google Scholar] [CrossRef]
- Lentz, E.C.; Barrett, C.B.; Hoddinott, J. Food Aid and Dependency: Implications for Emergency Food Security Assessments; World Food Programme (WFP), Emergency Needs Assessment Branch: Rome, Italy, 2005. [Google Scholar]
- United Nations (UN). World Statistics Pocketbook 2011; United Nations Publications: New York, NY, USA, 2012. [Google Scholar]
- United Nations Population Fund (UNFPA). Summary and Statistical Report of the 2007 Populations and Housing Census: Population Size by Age and Sex; Office of the Population and Housing Census Commision: Addis Ababa, Ethiopia, 2008. [Google Scholar]
- Mesfin, M.M. Community-Based Directly Observed Treatment Shortcourse strategy in pilot districts of Tigray: Overview of baseline studies. Ethiop. J. Health Dev. 2015, 19, 3–6. [Google Scholar] [CrossRef]
- Nega, F. Poverty, Asset Accumulation, Household Livelihood and Interaction with Local Institutions in Northern Ethiopia (Unpublished Doctoral Dissertation); Department of Bioscience Engineering, Catholic University of Leuven: Leuven, Belgium, 2008. [Google Scholar]
- Devereux, S.; Sabates-Wheeler, R.; Tefera, M.; Taye, M. Ethiopia’s Productive Safety Net Programme: Trends in PSNP Transfers within Targeted Households; Institute of Development Studies: Brighton, UK, 2006. [Google Scholar]
- Lawrence, O. Effects of Food Aid on Household Consumption and Marketed Production: The Case of Maize in Northern Uganda. Master’s Thesis, School of Graduate Studies, Makerere University, Kampala, Uganda, 2010. Available online: http://news.mak.ac.ug/documents/Makfiles/theses/Oroma_Lawrence.pdf (accessed on 20 May 2014).
- Dekker, M. Risk, Resettlement and Relations: Social Security in Rural Zimbabwe. Ph.D. Thesis, Vrije Universiteit Amsterdam, Amsterdam, The Netherlands, 2004. [Google Scholar]
- Quisumbing, A. Food aid and child nutrition in rural Ethiopia. World Dev. 2003, 31, 1309–1324. [Google Scholar] [CrossRef]
- Kattenberg, M.A.C. Food Aid in Zimbabwe: Is It Pro Child Growth? Master’s Thesis, Faculty of Economics and Business Sciences (FEWEB), Free University, Amsterdam, The Netherlands, 2008. [Google Scholar]
- Bogale, A.; Shimelis, A. Household Level Determinants of Food Insecurity in Rural Areas of Dire Dawa, Eastern Ethiopia. Afr. J. Food Agric. Nutr. Dev. 2009, 9, 1914–1926. [Google Scholar]
- Food and Agriculture Organization (FAO). Socio-Economic and Gender Analysis, SEAGA for Emergency and Rehabilitation Programmes. 2008. Available online: ftp://193.43.36.93/docrep/fao/008/y5702e/y5702e.pdf (accessed on 26 June 2014).
Figure 1.
The studied villages are located in the vicinity of the towns shown on the map.
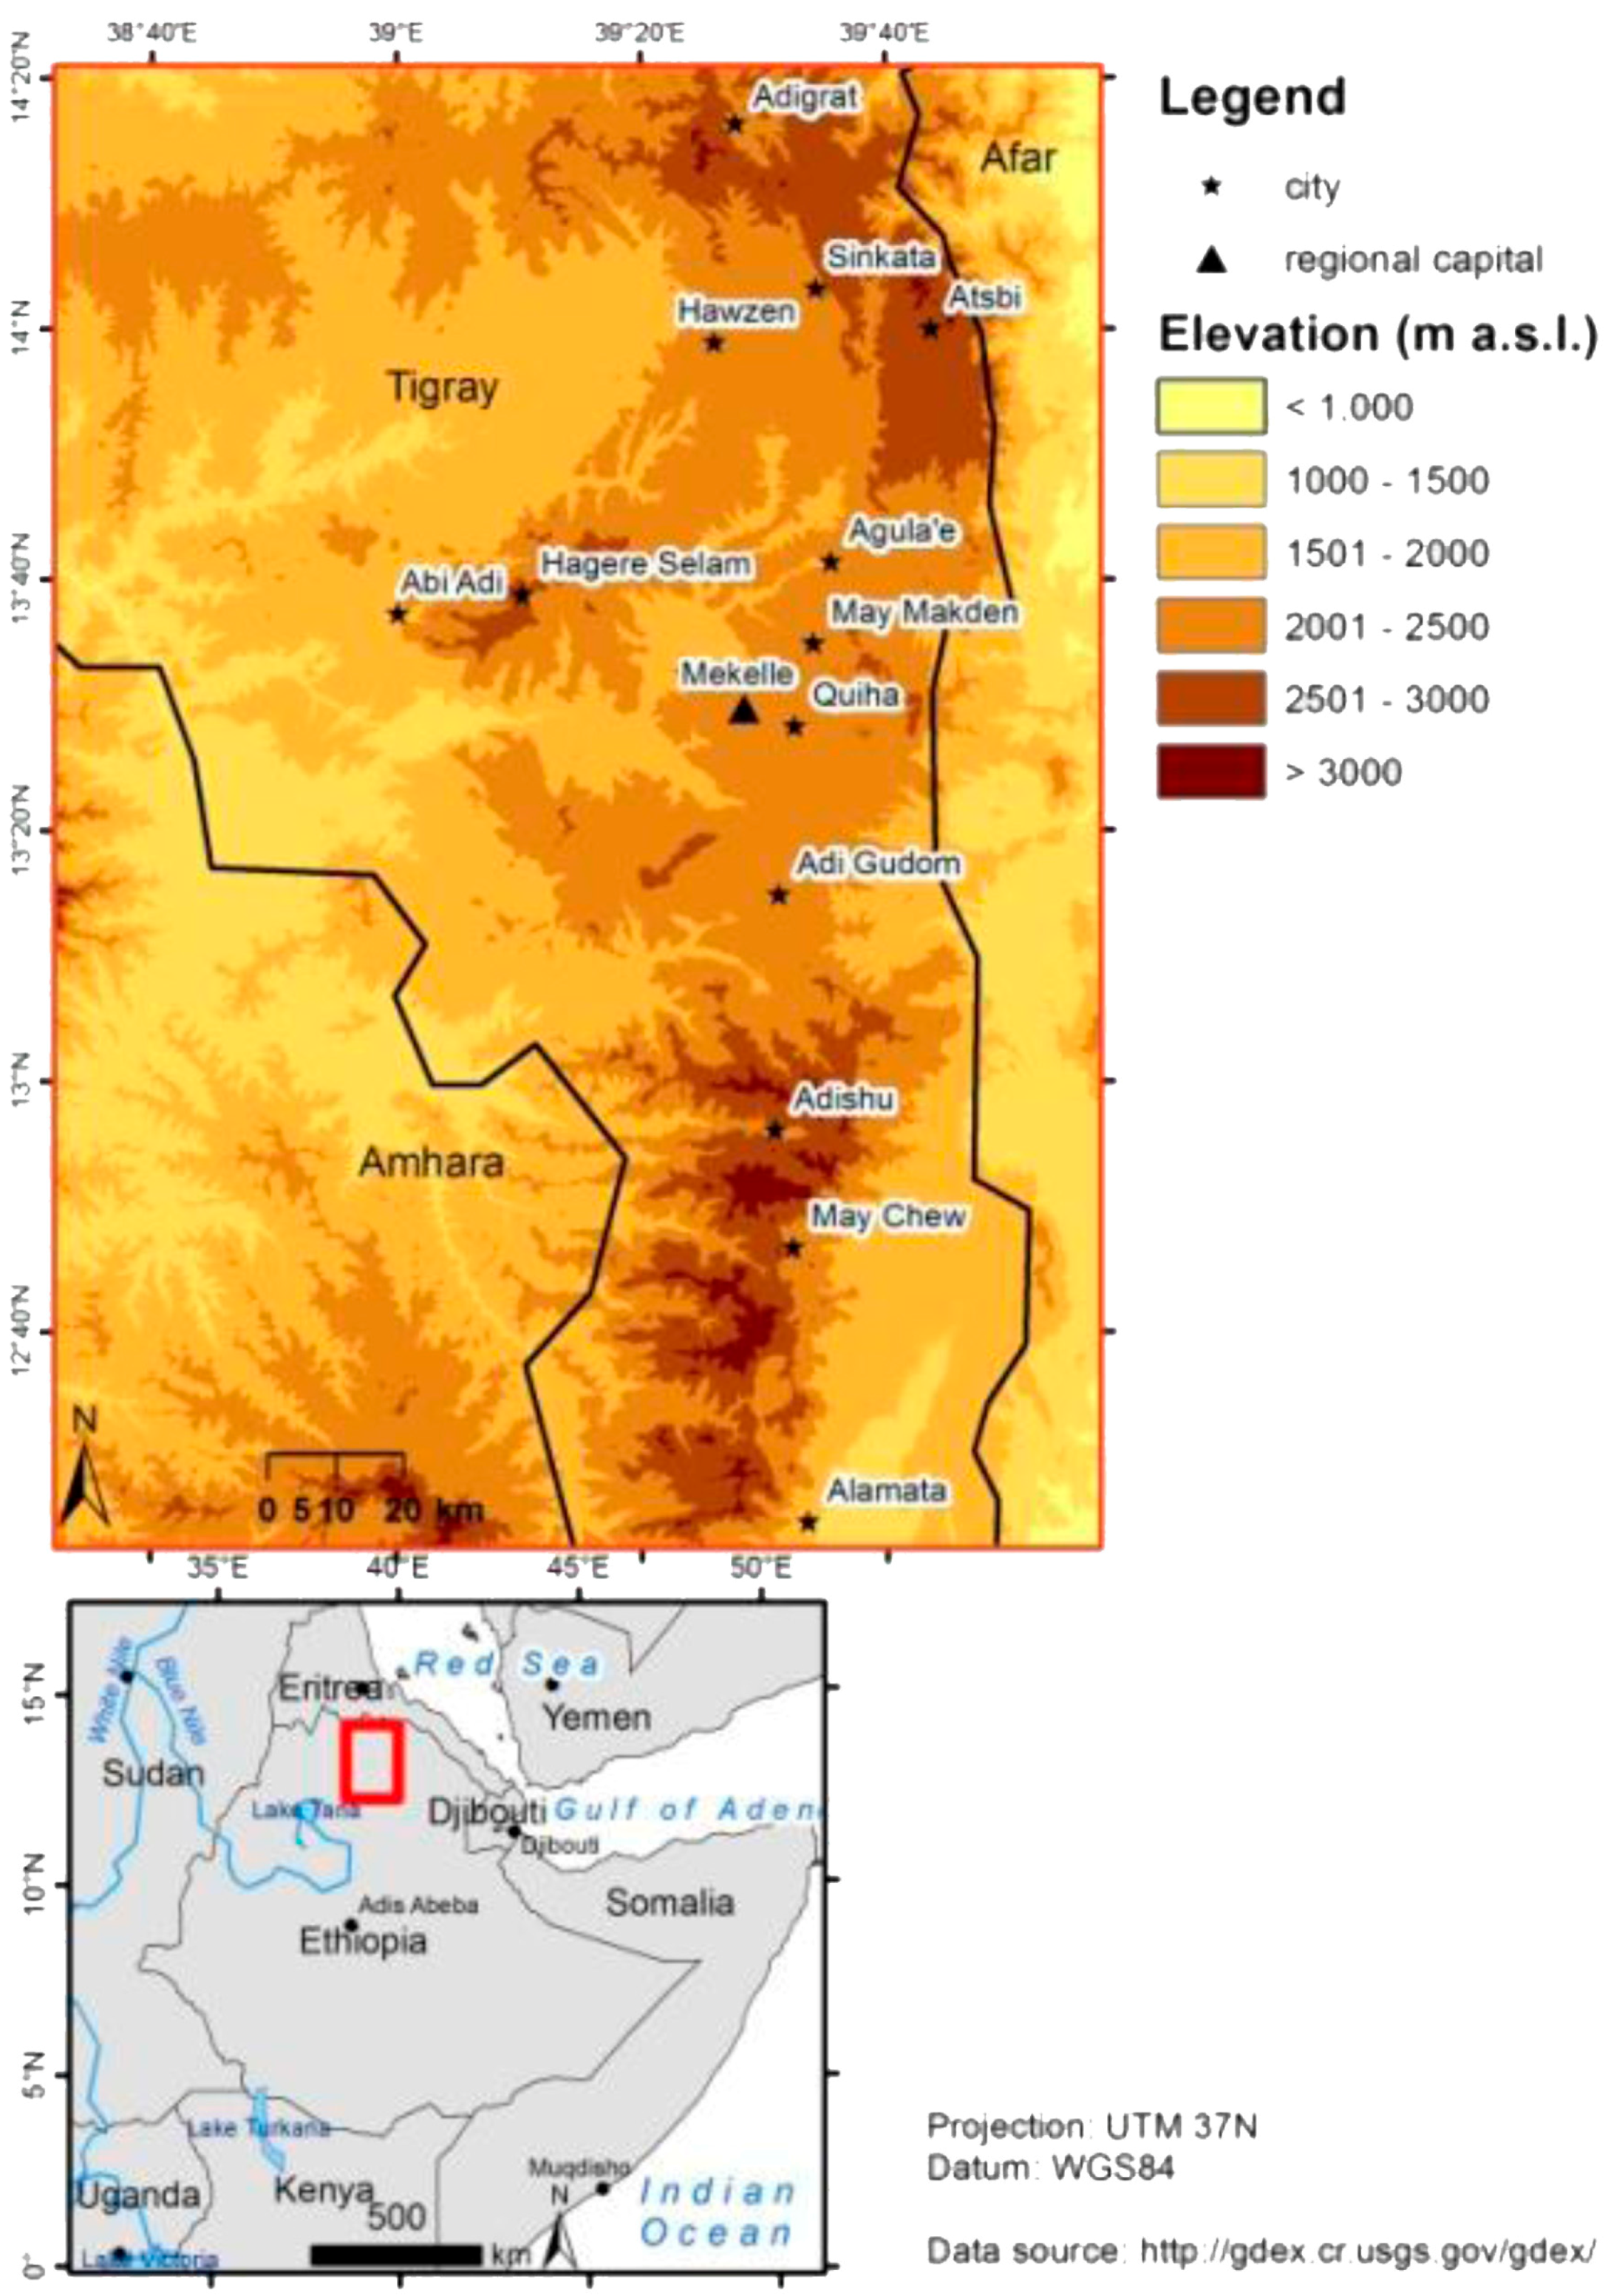
Figure 2.
Total percentage of interviewees divided by age groups and their membership type in Productive Safety Net Programme (PSNP) (PW = Public Work, DS = Direct support).
Figure 2.
Total percentage of interviewees divided by age groups and their membership type in Productive Safety Net Programme (PSNP) (PW = Public Work, DS = Direct support).

Table 1.
Overview of the socio-demographic characteristics of the households.
| Socio-Demographic Characteristics | Category | Frequency | Percentage | Mean |
|---|---|---|---|---|
| Age | 15–24 | 9 | 2.0% | 48.1 |
| 25–34 | 91 | 20.0% | ||
| 35–44 | 108 | 23.7% | ||
| 45–54 | 90 | 19.8% | ||
| 55–64 | 70 | 15.4% | ||
| >65 | 87 | 19.1% | ||
| Gender | Male | 248 | 54.5% | |
| Female | 207 | 45.5% | ||
| Marital status | Married | 360 | 79.1% | |
| Single | 95 | 20.9% | ||
| Family size | 1–5 | 208 | 45.7% | 5.6 |
| 6–12 | 247 | 54.3% | ||
| Other attributes | ||||
| Public work for free | Yes | 341 | 74.9% | |
| No | 114 | 25.1% | ||
| Selling/buying | To benefit | 126 | 27.7% | |
| If necessary | 329 | 72.3% | ||
| Intention or desire to move | Yes | 305 | 67.0% | |
| No | 150 | 33.0% | ||
| Owning farmland | Yes | 422 | 92.7% | |
| No | 33 | 7.3% |
Table 2.
Descriptive analysis of three selected variables (One-Way ANOVA).
| Variable | N | Mean a | Std. Deviation | |
|---|---|---|---|---|
| Age | Direct Support | 51 | 65.24a | 14.94 |
| Public Work | 152 | 43.66b | 13.13 | |
| No member | 252 | 47.33b | 15.31 | |
| Children | Direct Support | 51 | 4.22a | 2.50 |
| Public Work | 152 | 4.46a | 2.14 | |
| No member | 252 | 4.82a | 2.30 | |
| Family size | Direct Support | 51 | 3.59a | 2.41 |
| Public Work | 152 | 5.82b | 1.98 | |
| No member | 252 | 5.92b | 2.36 | |
a Common letters show non-significant mean (estimated by the least significant difference (LSD) test p < 0.05).
Table 3.
Number of interviewees by socio-demographic characteristics and type of membership of PSNP.
Table 3.
Number of interviewees by socio-demographic characteristics and type of membership of PSNP.
| Socio-Demographic Characteristics | DS | PW | Frequency | Total | Percentage |
|---|---|---|---|---|---|
| Type of membership | 51 | 152 | 252 | 455 | 100.0% |
| Man | 18 | 70 | 160 | 248 | 54.5% |
| Woman | 33 | 82 | 92 | 207 | 45.5% |
| Married | 23 | 115 | 222 | 360 | 79.1% |
| Unmarried | 28 | 37 | 30 | 95 | 20.9% |
| Small number of children | 29 | 77 | 109 | 215 | 47.3% |
| Large number of children | 22 | 75 | 143 | 240 | 52.7% |
| Small family | 38 | 66 | 104 | 208 | 45.7% |
| Large family | 13 | 86 | 148 | 247 | 54.3% |
© 2017 by the authors. Licensee MDPI, Basel, Switzerland. This article is an open access article distributed under the terms and conditions of the Creative Commons Attribution (CC BY) license (http://creativecommons.org/licenses/by/4.0/).
Share and Cite
MDPI and ACS Style
Azadi, H.; De Rudder, F.; Vlassenroot, K.; Nega, F.; Nyssen, J. Targeting International Food Aid Programmes: The Case of Productive Safety Net Programme in Tigray, Ethiopia. Sustainability 2017, 9, 1716. https://doi.org/10.3390/su9101716
AMA Style
Azadi H, De Rudder F, Vlassenroot K, Nega F, Nyssen J. Targeting International Food Aid Programmes: The Case of Productive Safety Net Programme in Tigray, Ethiopia. Sustainability. 2017; 9(10):1716. https://doi.org/10.3390/su9101716
Chicago/Turabian StyleAzadi, Hossein, Fien De Rudder, Koen Vlassenroot, Fredu Nega, and Jan Nyssen. 2017. "Targeting International Food Aid Programmes: The Case of Productive Safety Net Programme in Tigray, Ethiopia" Sustainability 9, no. 10: 1716. https://doi.org/10.3390/su9101716
Note that from the first issue of 2016, this journal uses article numbers instead of page numbers. See further details here.