Understanding User Satisfaction Evaluation in Low Occupancy Sustainable Workplaces

1
Simons Group Limited, Lincoln LN6 3AA, UK
2
School of Architecture and the Built Environment, University of Lincoln, Lincoln LN6 7TS, UK
*
Author to whom correspondence should be addressed.
Sustainability 2017, 9(10), 1720; https://doi.org/10.3390/su9101720
Submission received: 21 August 2017
/
Revised: 19 September 2017
/
Accepted: 21 September 2017
/
Published: 25 September 2017
(This article belongs to the Special Issue Advances in Post Occupancy Evaluation)
Abstract
:This paper presents the findings of a post-occupancy evaluation (POE) applied to a building in the UK. The design of the building was generated through an externally funded research project over two years from 2005 to 2007. The construction of the building was completed in 2010. After a period of occupancy, a POE of the building was carried out in 2015. The POE offered an opportunity to investigate the effect of occupant behaviour on the performance of the building and their level of comfort and satisfaction. We adopted a field survey method to evaluate the comfort and satisfaction of users by asking them a series of questions to analyse how they felt in different parts of the building throughout the course of the year. In our analysis, the users were prompted to provide a subjective measure of the building regarding a range of internal conditions such as air temperature, humidity, air movement, air quality, daylight, artificial light, and noise. The analysis supports the notion that in naturally-ventilated buildings some users may find the building to be hot in summer while cold in winter. The high level of control the users have over the operation of the building contributes to their comfort and satisfaction. The users demonstrated a tendency to be satisfied despite environmental factors and to forgive some aspects of the building which are not performing as they should. The paper offers a perspective on statistical user satisfaction in a low occupancy building and attempts to explain the role of workplace wellbeing on occupant perception of comfort in this case.
1. Introduction
Post-occupancy evaluations of buildings provide invaluable insights into the environmental performance and user behaviour of buildings.
The information obtained from a POE can be used for fine-tuning the building’s operation to enhance its performance. The information is also useful for regulating the internal environment of the building to enhance user comfort, wellbeing and satisfaction [1,2]. The wider aspects of performance measured by a POE can address issues such as space utilization, management, environmental impact and cost in use [3]. The POE can also be used as a learning loop to feed-forward lessons learnt to better inform the decision-making process at the design stage [4].
Most post-occupancy user satisfaction evaluations reported in the literature are about conventional large workplaces. They do not adequately cover special cases, for example off-grid workplaces, or cases where there has been heavy involvement of end users in the design and construction of the building. This paper analyses the comfort and satisfaction of users of a naturally-ventilated off-grid building where users were involved in its design and construction. The building users are also heavily involved in controlling the environment of the building and have a tendency to adapt to changing conditions in their environment. In such conditions, as suggested by Nicole and Humphreys [5], the users’ natural tendencies are expressed in their adaptive approach to thermal comfort. Their participation in the procurement of the building and in controlling the environments they inhabit, support the idea that such an approach can result in a wider acceptability of the environmental conditions of the building.
The findings of the paper are of interest for sustainable workplaces where there is emerging interest in employee wellbeing as an indicator of business performance within a context of environmental comfort analysis of the buildings they occupy.
Aims and Objectives
This research aims to identify and test how building user satisfaction may be influenced by parameters such as:
- Occupant engagement and the management approach to maintenance and comfort control;
- Occupant knowledge of the building being low energy and green; and
- Other influences which affect occupant satisfaction beyond the internal environment.
2. Research Methodology
The research adopted a field survey method to evaluate comfort and satisfaction of people using a pilot building. In our post-occupancy evaluation (POE), as recommended by Nicol et al. [6], through a series of questions we attempted to analyse how building users felt in different parts of the building throughout the course of the year. In other words, the building users were prompted to provide a subjective measure of the building and act effectively as its ‘memory’ [7]. The survey asked questions such as: How have you found the temperature in different parts of the building in different seasons? Or: How much time do you spend in different parts of the building in different parts of the year? etc.
In our performance evaluation of the building, we were solely concerned with users’ comfort and satisfaction. In the questionnaire, building users were asked about their experience of the building regarding a range of internal conditions in different parts of the building such as air temperature, humidity, air movement, air quality, daylight, artificial light, and noise. Our emphasis was on measuring the performance of the building through the impressions of its occupants as opposed to through the measurement of the physical characteristics of the environment (temperature, noise, light, etc.). As Nicole and Roaf [7] suggest “…the recording of the instantaneous physical environment is not the issue so much as the evaluation of the overall performance of the building and the impressions of its occupants that contribute one measure of its success”.
The survey was carried out in 2015 after a period of occupancy. The questionnaire consisted of 31 questions covering all the main dimensions of environmental and spatial quality of the buildings in different seasons of the year. Environmental quality questions were formulated based on the commonly used seven-point psycho-physical scale developed by the American Society of Heating, Refrigerating and Air-Conditioning Engineers (ASHRAE) as a measure for the comfort sensation [8], for example with regard to temperature (−3 = very cold), (0 = optimum) and (+3 = very hot); and air movement (−3 = very draughty), (0 = optimum) and (+3 = very stuffy), etc. Respondents were not offered any incentive to participate. The results of the survey were presented to several office workers for discussion, which offered some further insights into the user’s understanding of their own perceptions of comfort and satisfaction.
3. Post-Occupancy Evaluation and Comfort Modelling
One generally accepted definition of thermal comfort is that of ASHRAE [8], suggesting “that state of mind which express satisfaction with the thermal environment”. Different models and indices have been developed to predict the thermal comfort and satisfaction of building users. Broadly speaking, there are two main approaches for analysing the thermal comfort and satisfaction of the occupiers of buildings. The first one is the analytical approach, and the models developed based on this methodology are usually referred to as “rational” or “heat balanced” models [6]. The second method, which has recently attracted considerable attention, is the “empirical approach”, also referred to as the “adaptive approach”, which is based on field surveys and POEs [6,9].
The analytical approach and its heat-balance-based models employ principles of physics and physiology, using the heat flow mechanisms of the body together with the effect of external factors to keep the core temperature of the body around 37 °C. The physical properties of an environment affecting thermal comfort include air temperature, mean radiant temperature, air velocity, and humidity. In addition to these environmental factors, one’s comfort is also affected by two individual factors, being activity level and clothing.
The best-known heat balance models are predicted mean vote (PMV) [10] and standard effective temperature (SET) [11]. The PMV is particularly important because it forms the basis of most national and international comfort standards, e.g., ISO 7730 and ASHRAE 55. Fanger [10], based on experimentally-determined physiological comfort criteria and heat transfer theory, derived the comfort equation using the combination of the six environmental and individual factors. In addition to PMV, which gives the predicted mean vote of a large group of people exposed to a controlled environment (laboratory), Fanger also developed the predicted percentage dissatisfied (PPD), which predicts the degree of discomfort and the percentage of the group who will express discomfort. Fanger used the commonly-used seven-point psycho-physical scale as a measure for the comfort sensation for different environmental variables affecting comfort.
The heat balance approach and models based on it, e.g., PMV, may pose a number of problems for environmental designers due to unknown factors such as the actual clothing occupants may wear and the actual levels of their activities [6]. In addition, the conditions in real buildings may differ considerably from the steady state conditions in the laboratory settings that these models are based on. Nicole et al. [6] suggest that “thermal environment standards derived from the laboratory-based models will typically only be applicable to highly serviced buildings that are capable of producing closely controlled indoor climates in a wide range of outdoor temperatures”. They also suggest that “based on field studies result people worldwide accept a much more diverse set of thermal environments than laboratory-based indices lead us to expect, because people have adapted to their own particular climate” [6].
Where buildings are expected to operate in free running modes (no heating or mechanical ventilation needed), models developed based on analytical approaches can not accurately represent conditions. This has necessitated the development of another approach which is based on surveys of people’s response to the environment using statistical analysis from field surveys. Nicol et al. [6] suggest that “if we want to know how people feel in a particular situation there is no better way to find out than to go and ask them”. This method of the field survey provides the basis of the adaptive approach and the models developed based on this approach are called ‘empirical models’.
The heat balance approach mainly relies on mechanical systems such as air-conditioning for the provision of comfort. On the other hand, the adaptive approach seeks a wider form of comfort and wellbeing in a more natural environment. Haigh [12] suggests that this approach generally provides a broader band of conditions, but with better outside awareness and facilities for discomfort-alleviation. In some cases, it is possible to adopt both approaches where appropriate, by using a mixed-mode concept combining for example natural ventilation with mechanical ventilation and/or cooling systems [13].
The adaptive approach, as explained by Nicol et al. [6], is mainly based on empirical observations in which the adaptive mechanisms operated by individuals, e.g., opening and closing windows, may be predicted to achieve comfort. The behaviour of occupants and their interventions in regulating the internal environment they occupy are the most effective measures in the provision of comfort and wellbeing. Nicol et al. [6] quote that “a most powerful form of human thermoregulation is behavioural—putting on or taking off clothing, changing posture, move, take shelter, etc.” The increasing interest in the adaptive approach has resulted in the ASHRAE Standard 55, Thermal Environmental Conditions for Human Occupancy, including a new adaptive comfort standard (ACS), that allows higher internal air temperatures for naturally-ventilated buildings during summer [14].
4. User Study
The study focuses on a POE of a sustainable building operated by Hill Holt Wood Social Enterprise. The Social Enterprise operates in a 34acre woodland. The woodland is managed as a habitat to be conserved, but also looking to the future and utilising natural resources to achieve employment, education and training goals. Hill Holt Wood (HHW) is a centre for learning for a diverse range of learners of all ages and abilities who may be at risk, excluded from education, or unemployed. In addition, the building is used regularly for events such as conferences, workshops, wedding parties, and other community activities.
The building was designed to be off-grid and built to enable maximum participation of users in the actual construction process. The building complied with Part L 2006 of the UK Building Regulations. The building is off-grid with a centralised energy distribution system for heat and power with variable fuel sources. The energy distribution system also caters for a number of small buildings and operational demands on the site including catering, a sawmill and craft workshops, other small offices, a bunk house, a gallery, and meeting spaces
The building was designed through a two-year Knowledge Transfer Programme (KTP) research project [15] during 2005 to 2007 to meet three main aims:
- To demonstrate sustainable building materials and passive design strategies;
- To enable employees and trainees to develop practical construction skills; and
- To provide a centre for community events, business meetings and conferences.
Sustainability
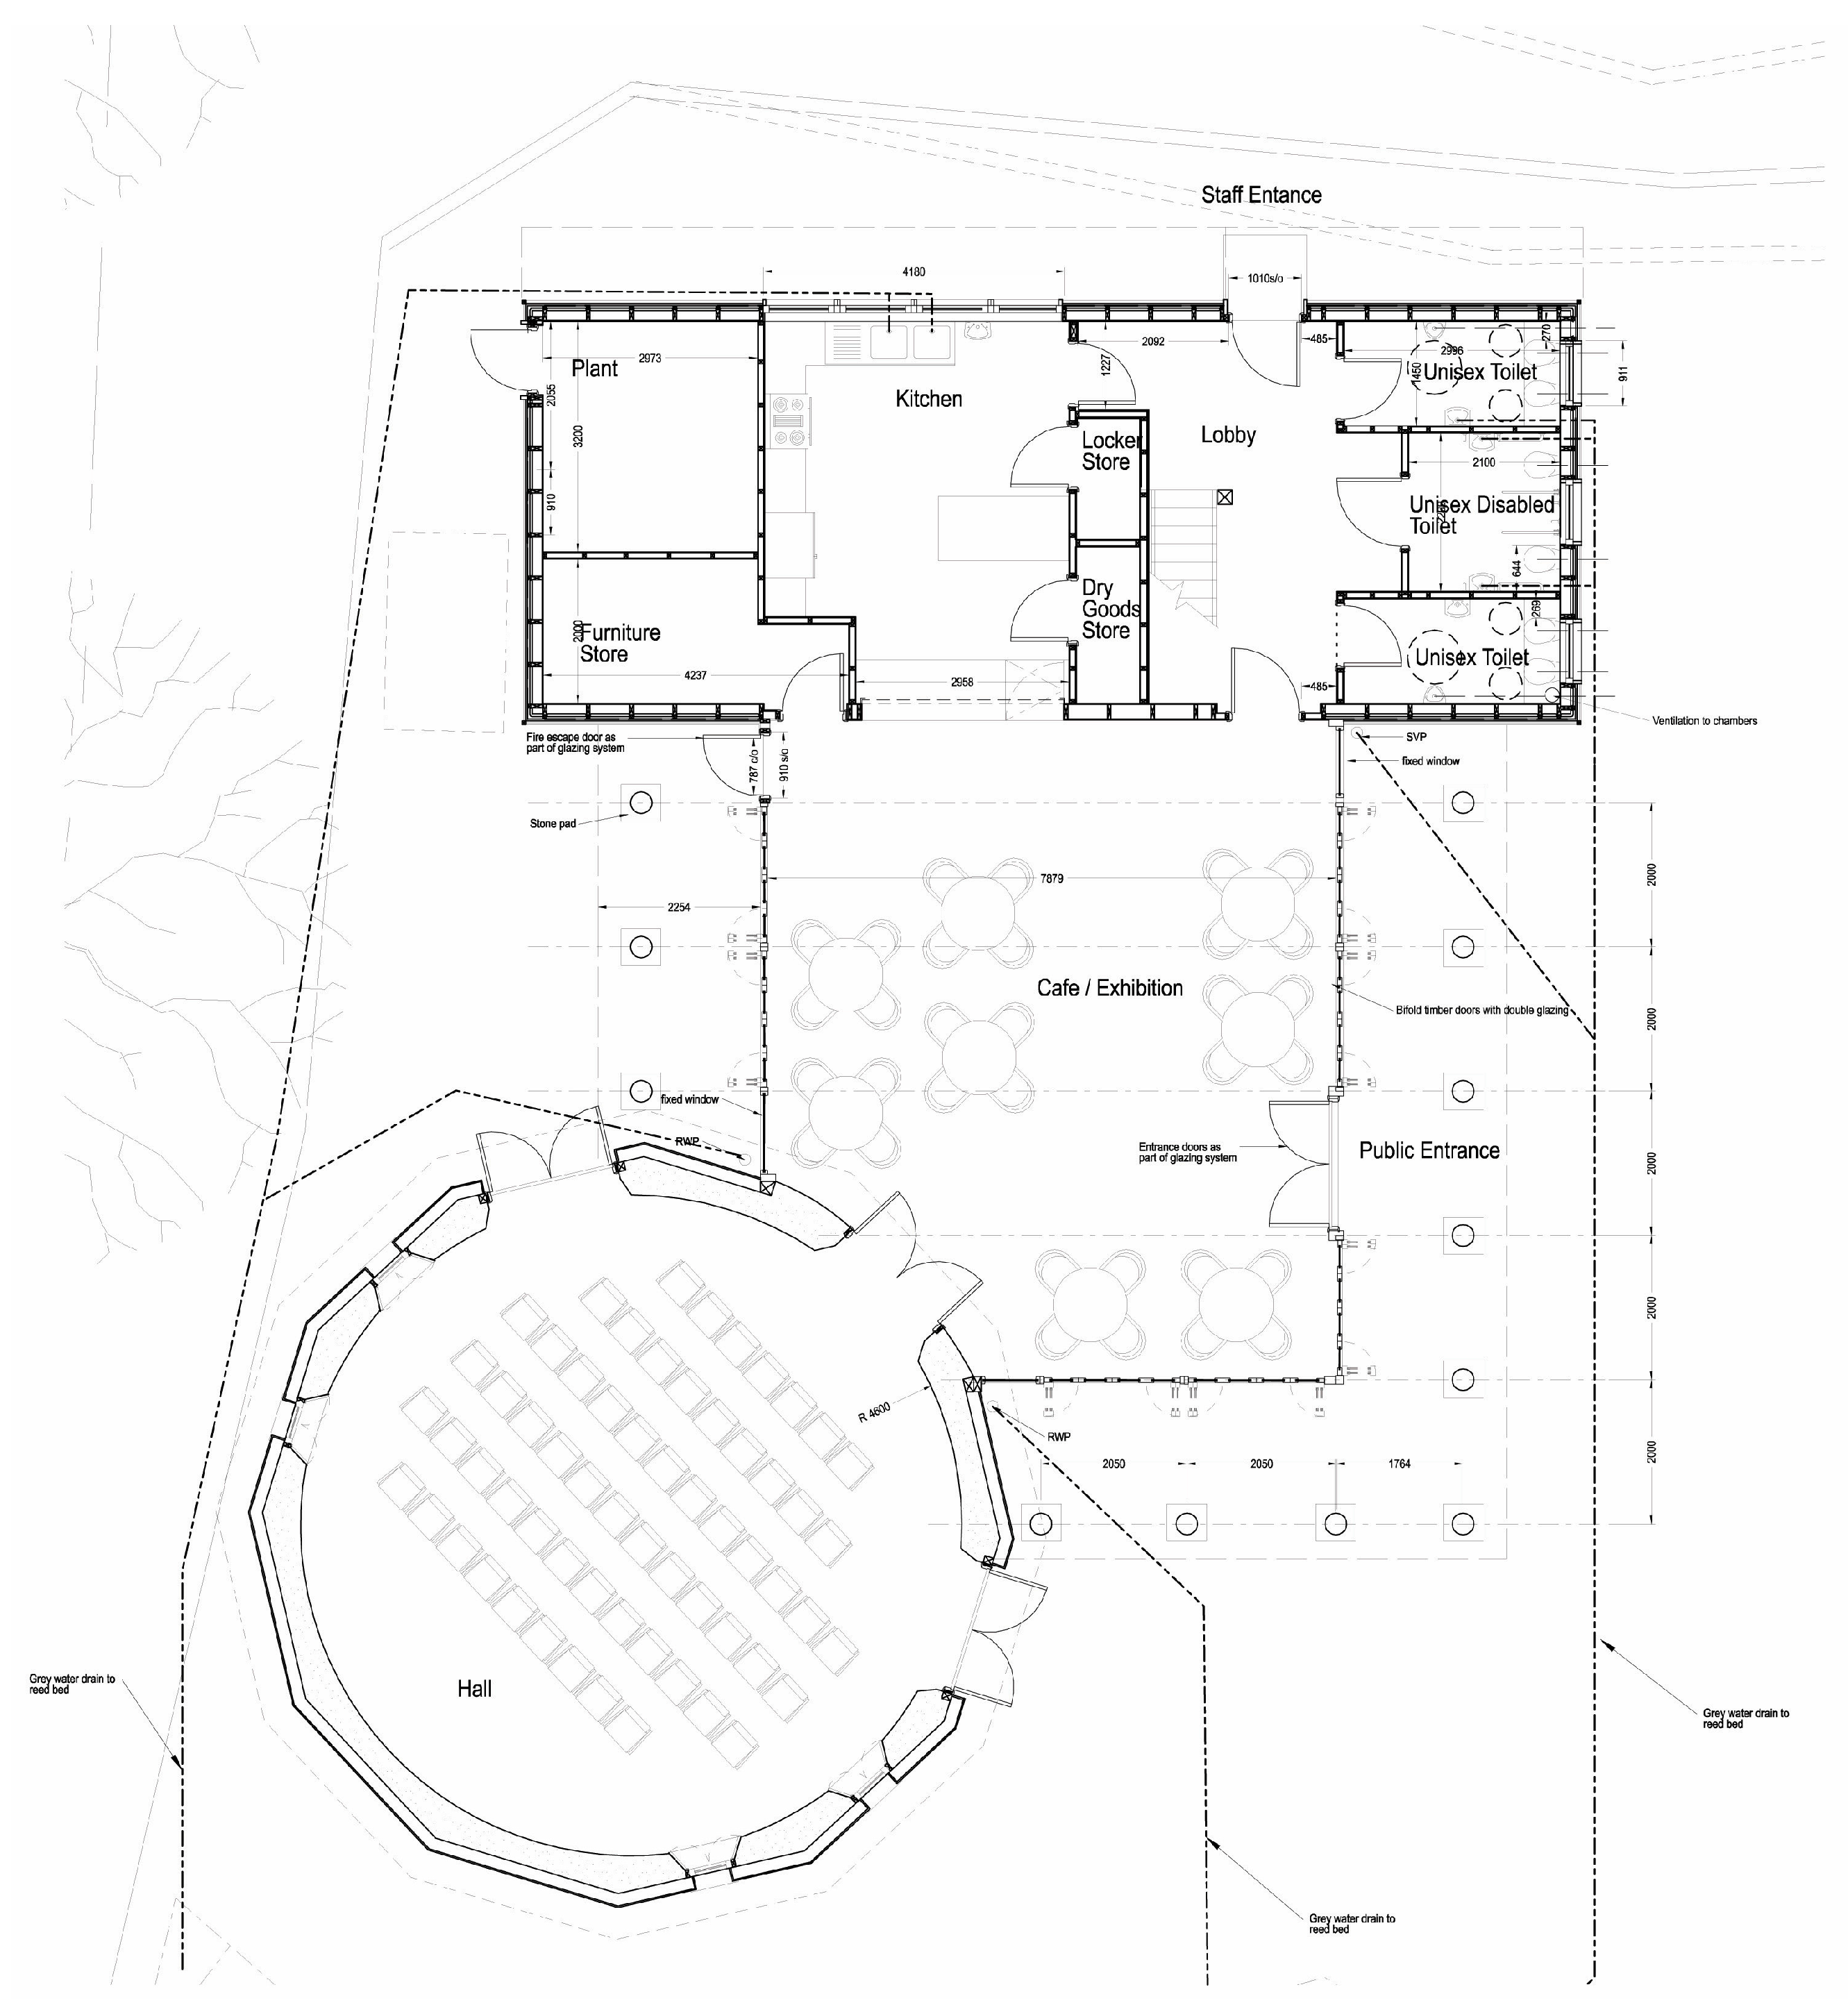
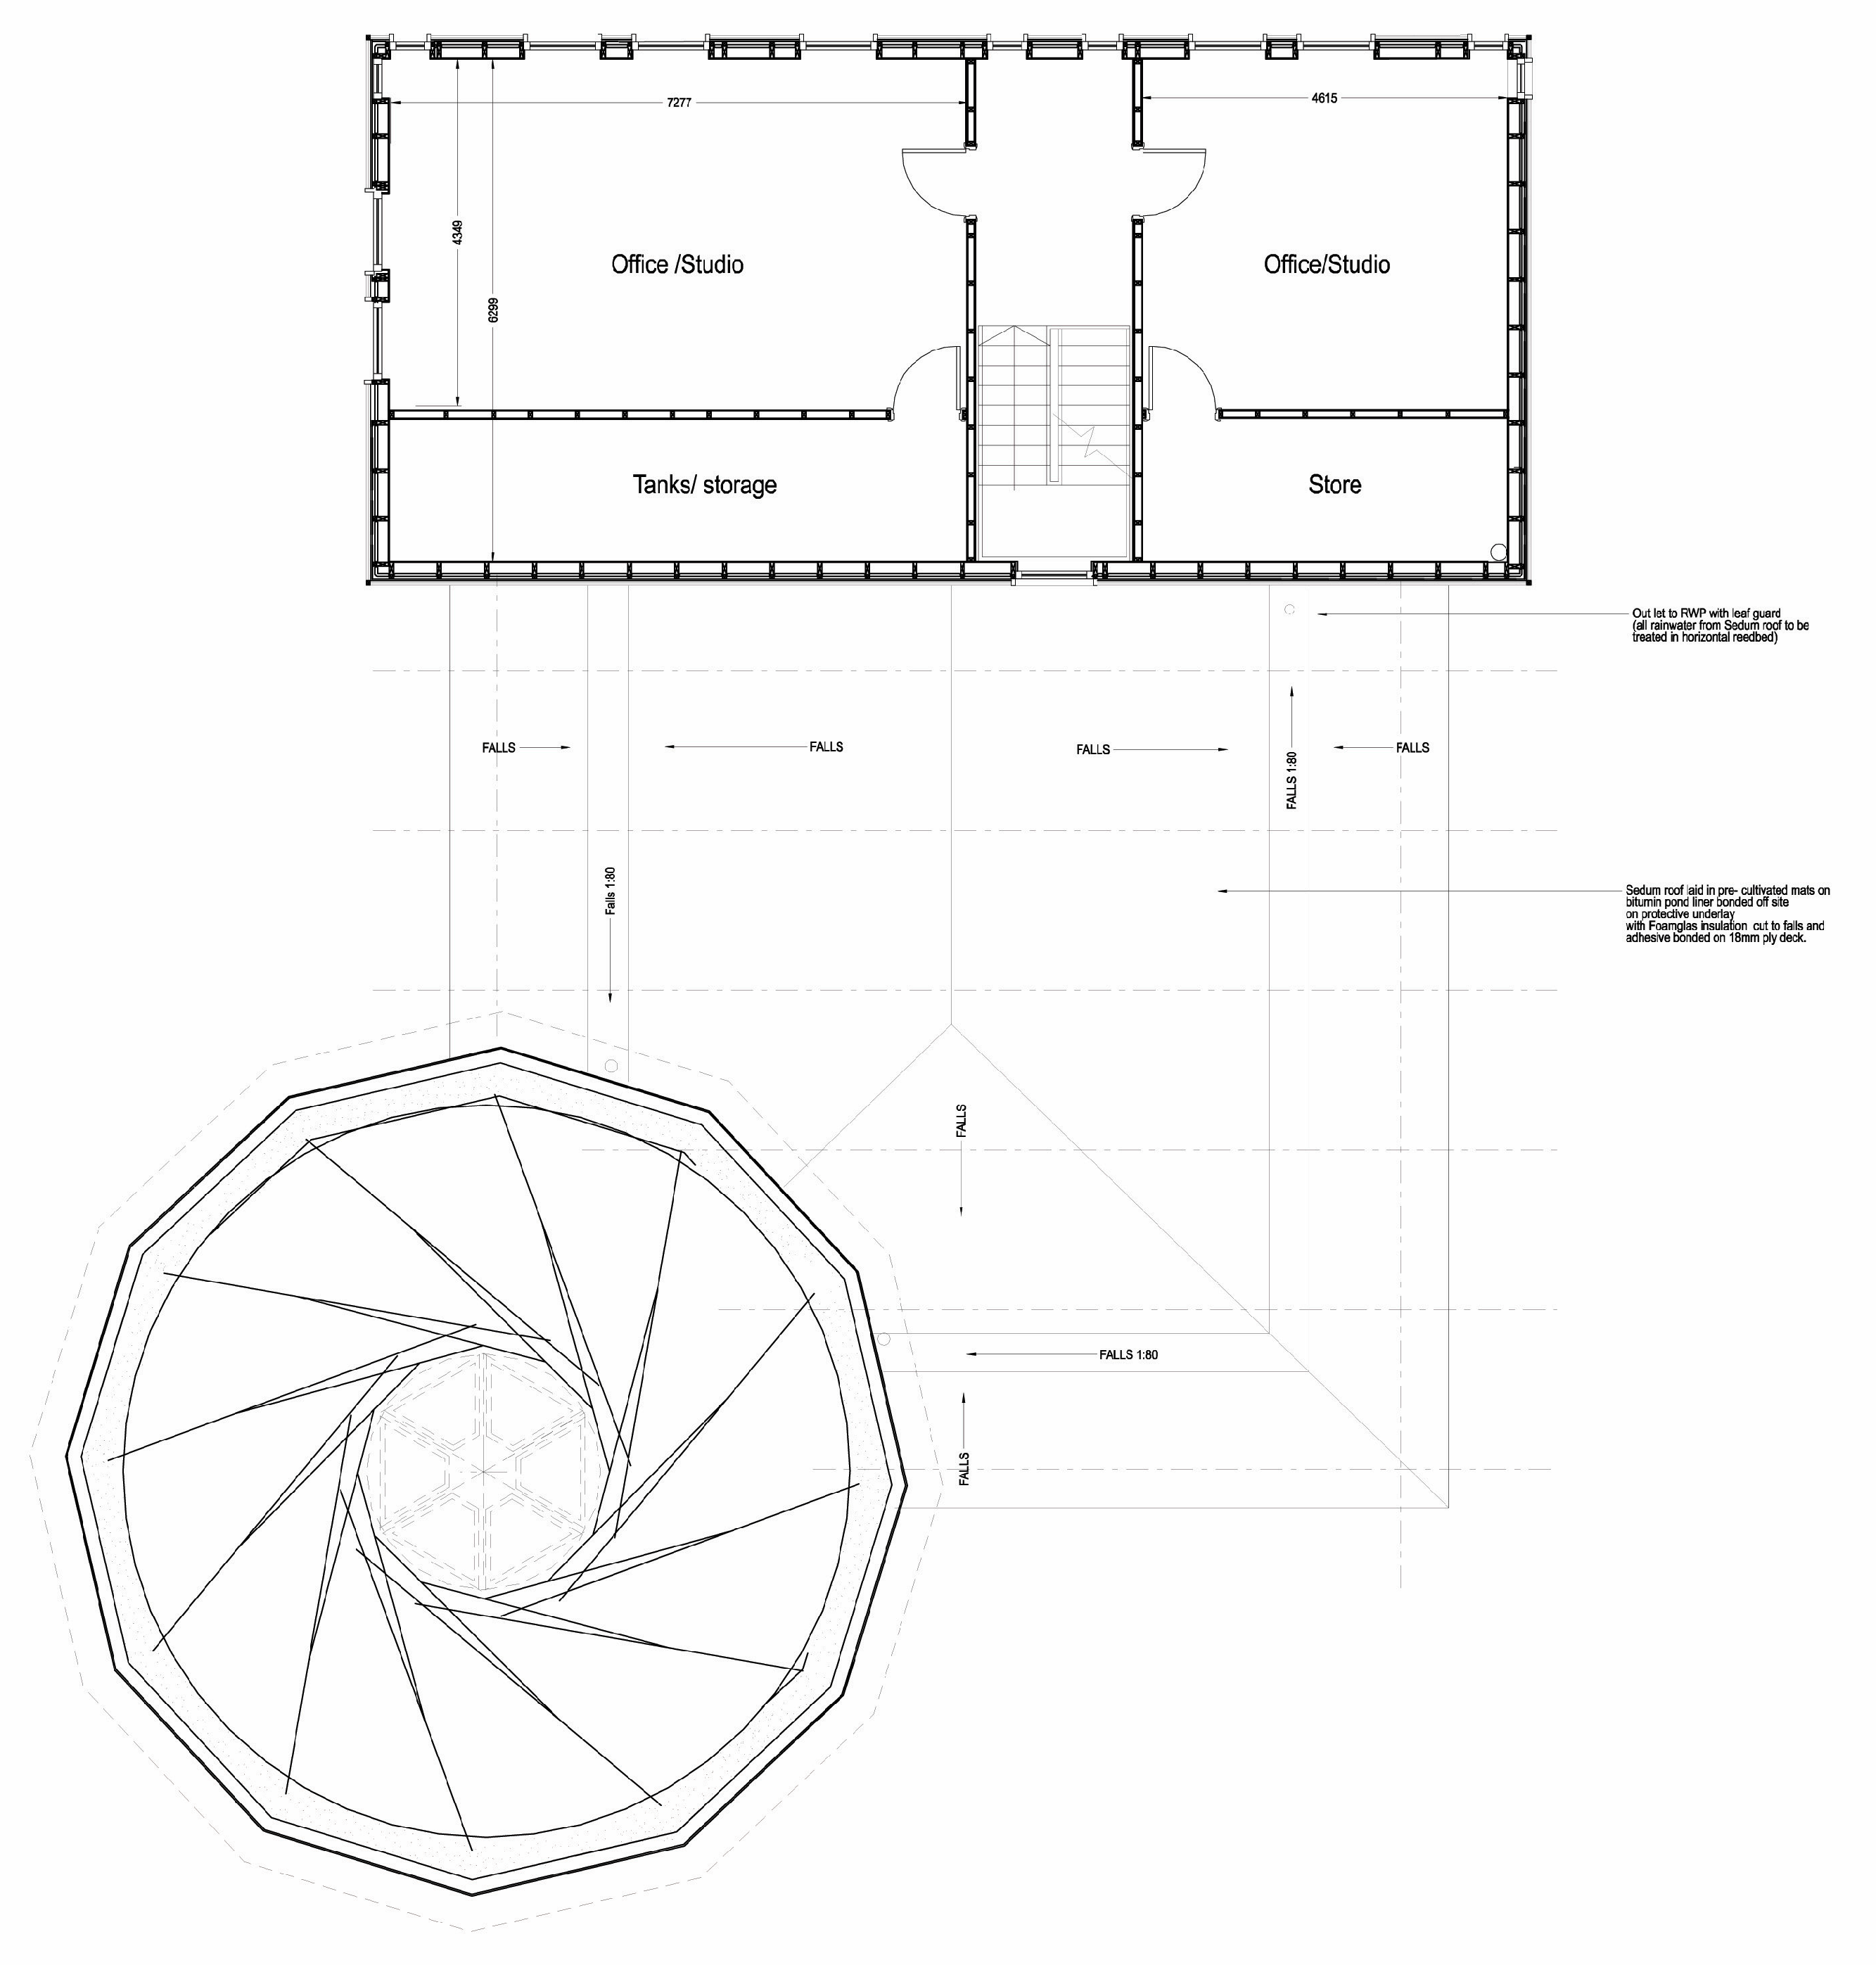
The design of the building is based on the principles of passive solar design utilising natural light, ventilation, thermal mass and insulation [15]. The building is multi-functional and split into three use groups. These are the round rammed earth hall with a reciprocal timber roof; the link, with a green roof housing the café and exhibitions; and the box, housing the plant, kitchen and services on the ground floor and offices on the first floor. The box is constructed with highly insulated timber.
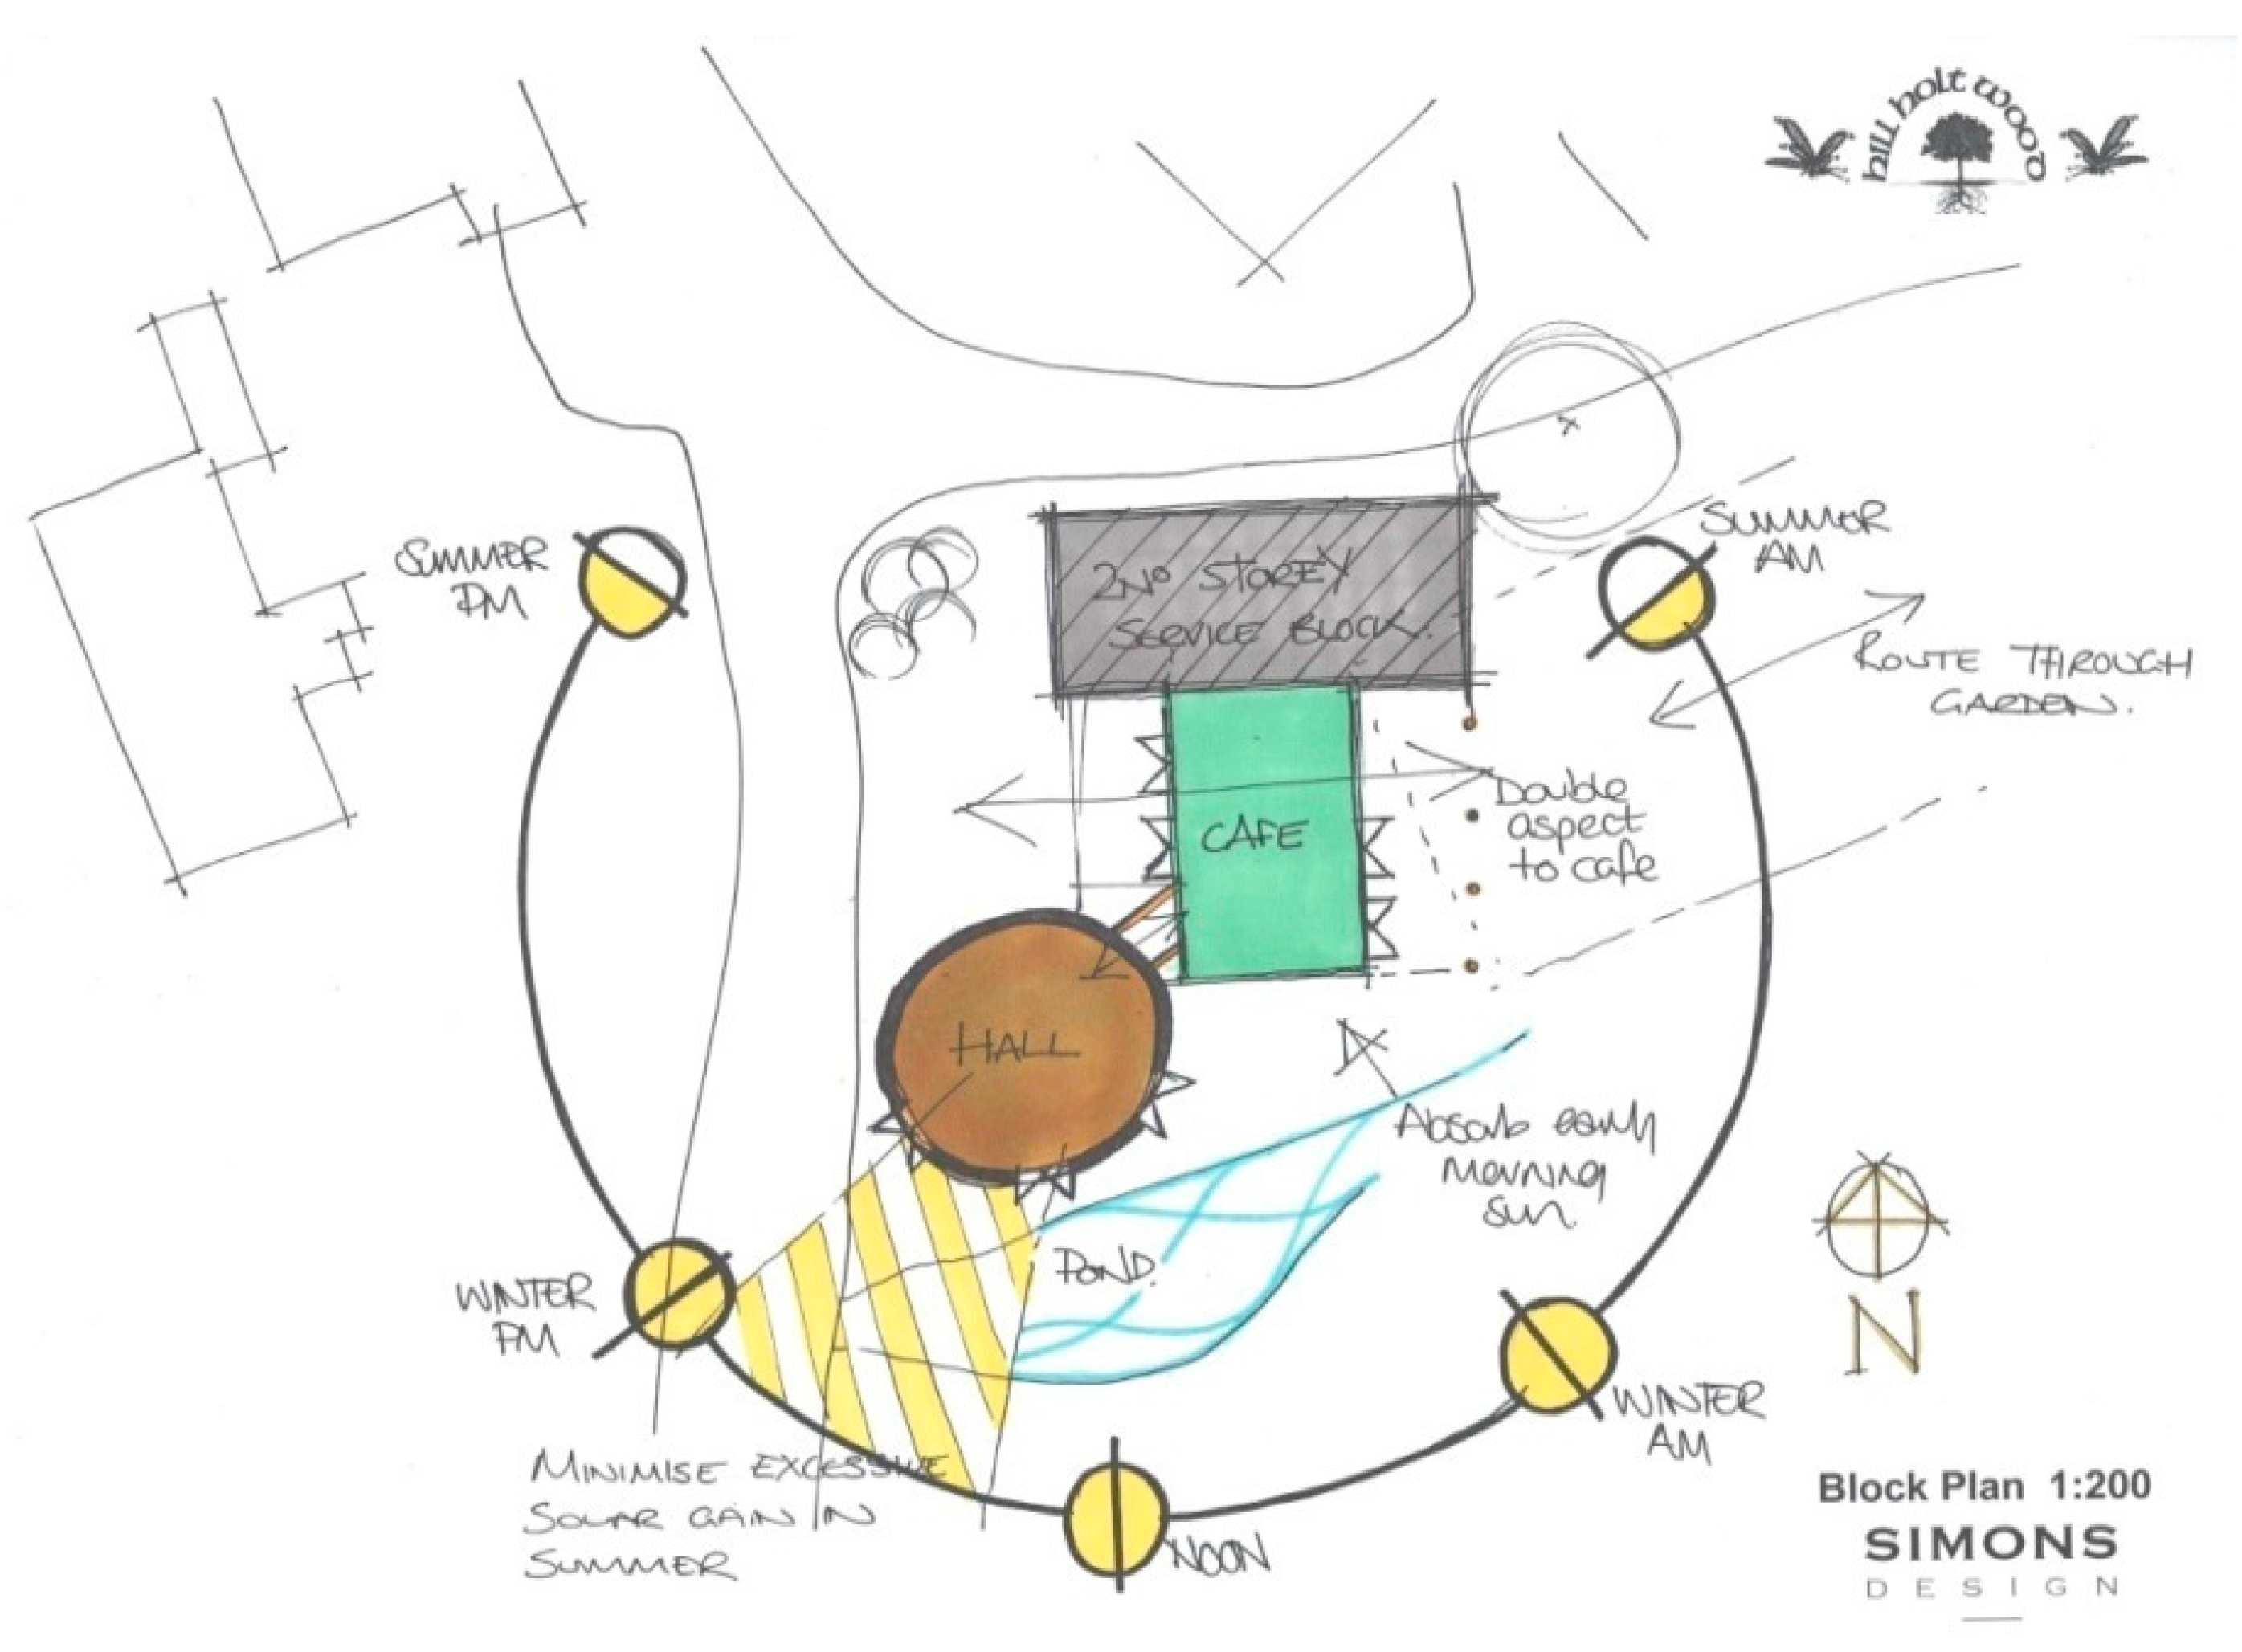
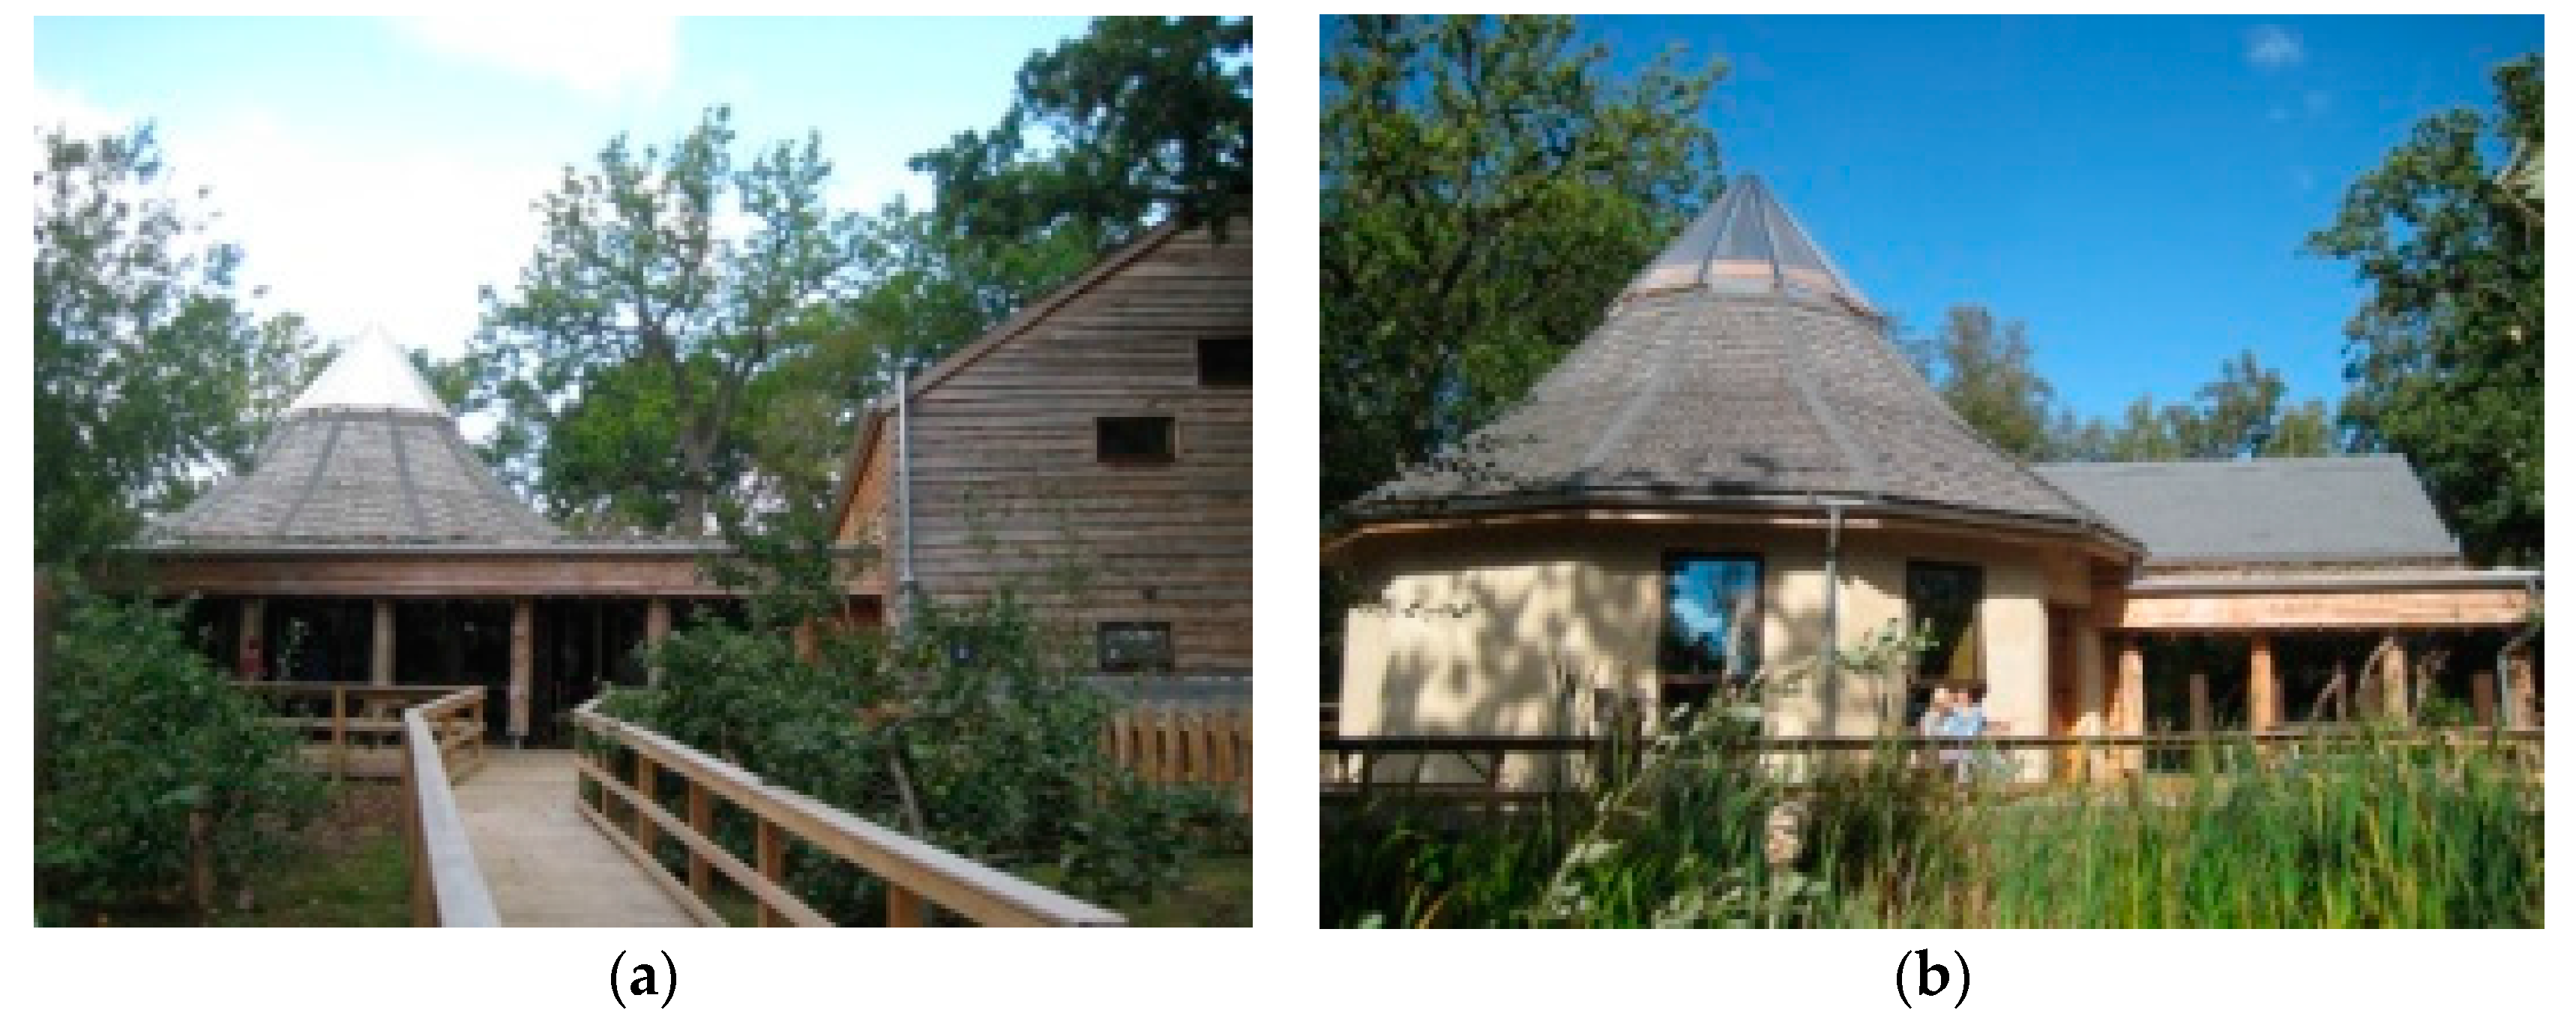
One main aspect of the environmental design of the building was to create a low energy sustainable building. The hall, facing south, is made of rammed earth walls to offer thermal solar storage. On the other hand, the office block, facing north and shaded by mature trees, is a highly-insulated timber frame structure. Figure 1 shows an early design sketch exploring the citing of the building on the site. Figure 2 and Figure 3 show the ground floor and first floor plans of the building as designed. Figure 4 shows images of the completed building.
The building is highly insulated, achieving very low U-values. The U-value of the rammed earth wall of the hall is 0.18 WK/m2, while that of the office block is 0.08 WK/m2 [15]. The roof U-values are of the order 0.08 and 0.09 WK/m2 for the office and the hall, respectively [15]. The U-value of the ground floor, entirely made of reinforced limecrete, is 0.19 WK/m2 [15].
The estimated heating consumption of the building at the design stage using computer simulation was 23 KWh/m2/year [15]. This was better than the heating demand for “good practice” community centres at the time, which was reported to be in the order of 125 KWh/m2/year, while that for “typical practice” was 187 KWh/m2/year [15].
The primary driver for the building was that it should be low carbon in both construction and use. Resource use was intentionally very low carbon, using local materials; rammed earth walls; Hemlock split cladding; roundwood structural timber drawn from the forests managed by HHW and seasoned on site; timber shingles hand split on site; and a floor mosaic created by a local arts group. Innovative materials included Limecrete foundations using aggregate from the nearby quarry (at the time it was the largest reinforced casting in England) and multilayer foil insulation. Recycled materials included insulation from plastic bottles used in the pitched roofs, and recycled plastic slate effect roof tiles. Renewable materials included cork insulation for flat roofs and some walls; an engineered timber structure for the office certified by Programme for the Endorsement of Forest Certification (PEFC), which used thinnings from forestry management to create beams, studs, timber windows, and doors; glulam structural beams fabricated in Hull (50 miles away) and roundwood off-cuts for low-energy light fittings in the café area.
The assessment of the burden of the embodied materials revealed that the material emissions rate for the building is of the order of 332.27 kg CO2/m2 [15]. This estimated design value was much less than that for a conventionally constructed building with a similar function, at 800–1200 kg CO2/m2 [15].
Whole life cycle assessment (LCA) was carried out at the design stage to estimate the burdens of all life stages of the building including project management, materials, the construction process and waste, in-use energy, and finally the deconstruction stage. The whole life emission of the building over its life span was estimated to be of the order of 150 t CO2 or 440 kg CO2/m2 [15], much less than conventional buildings.
The sustainability credentials of the building were communicated with all stakeholders involved in the design and construction of the building, some of whom are still using the building. The fact that the building is the recipient of a range of sustainability awards has also raised the awareness of its users of its green credentials.
5. User Comfort Survey Analysis
The building is designed and operated based on the concept of adaptive comfort. The adaptive model of comfort, which is usually used in naturally ventilated buildings, is based on the principle that if a change occurs in a building so as to produce discomfort, people react in ways which tend to restore their comfort [16]. Such a shift has also been magnified by the desire to shift to a lower-carbon society by moving away from energy demanding conventional systems, to a broader notion that takes into consideration dynamic, integrated, and participatory aspects [17].
The three distinct components of the building, i.e., the offices, the canteen and the rammed earth hall, have different operational modes and requirements. It is hence assumed that users may take different measures to regulate the internal environments of these spaces. In addition, each part has its own characteristics: the offices are thermally light, facing north; the rammed earth hall, with its considerable thermal mass, facing south; whist the canteen is highly glazed to increase the notion of transparency. As a result, in addition to different usages, the thermal characteristics of the different parts of the building affect and demand different interventions to regulate the internal environments. The building sits in a special woodland environment. As a result, it is expected that the comfort and its provision will be influenced by the context within which the building and its activities take place [18,19,20].
The questionnaire we used in our survey required information based on the seven-point psycho-physical scale (−3 to 3) for different comfort variables as summarised in Table 1. Correspondents were also asked to record their votes for different variables for different parts of the buildings (the offices, canteen, and the hall) and for different seasons (spring, summer, autumn and winter). For noise, the questions did not include seasonal variations.
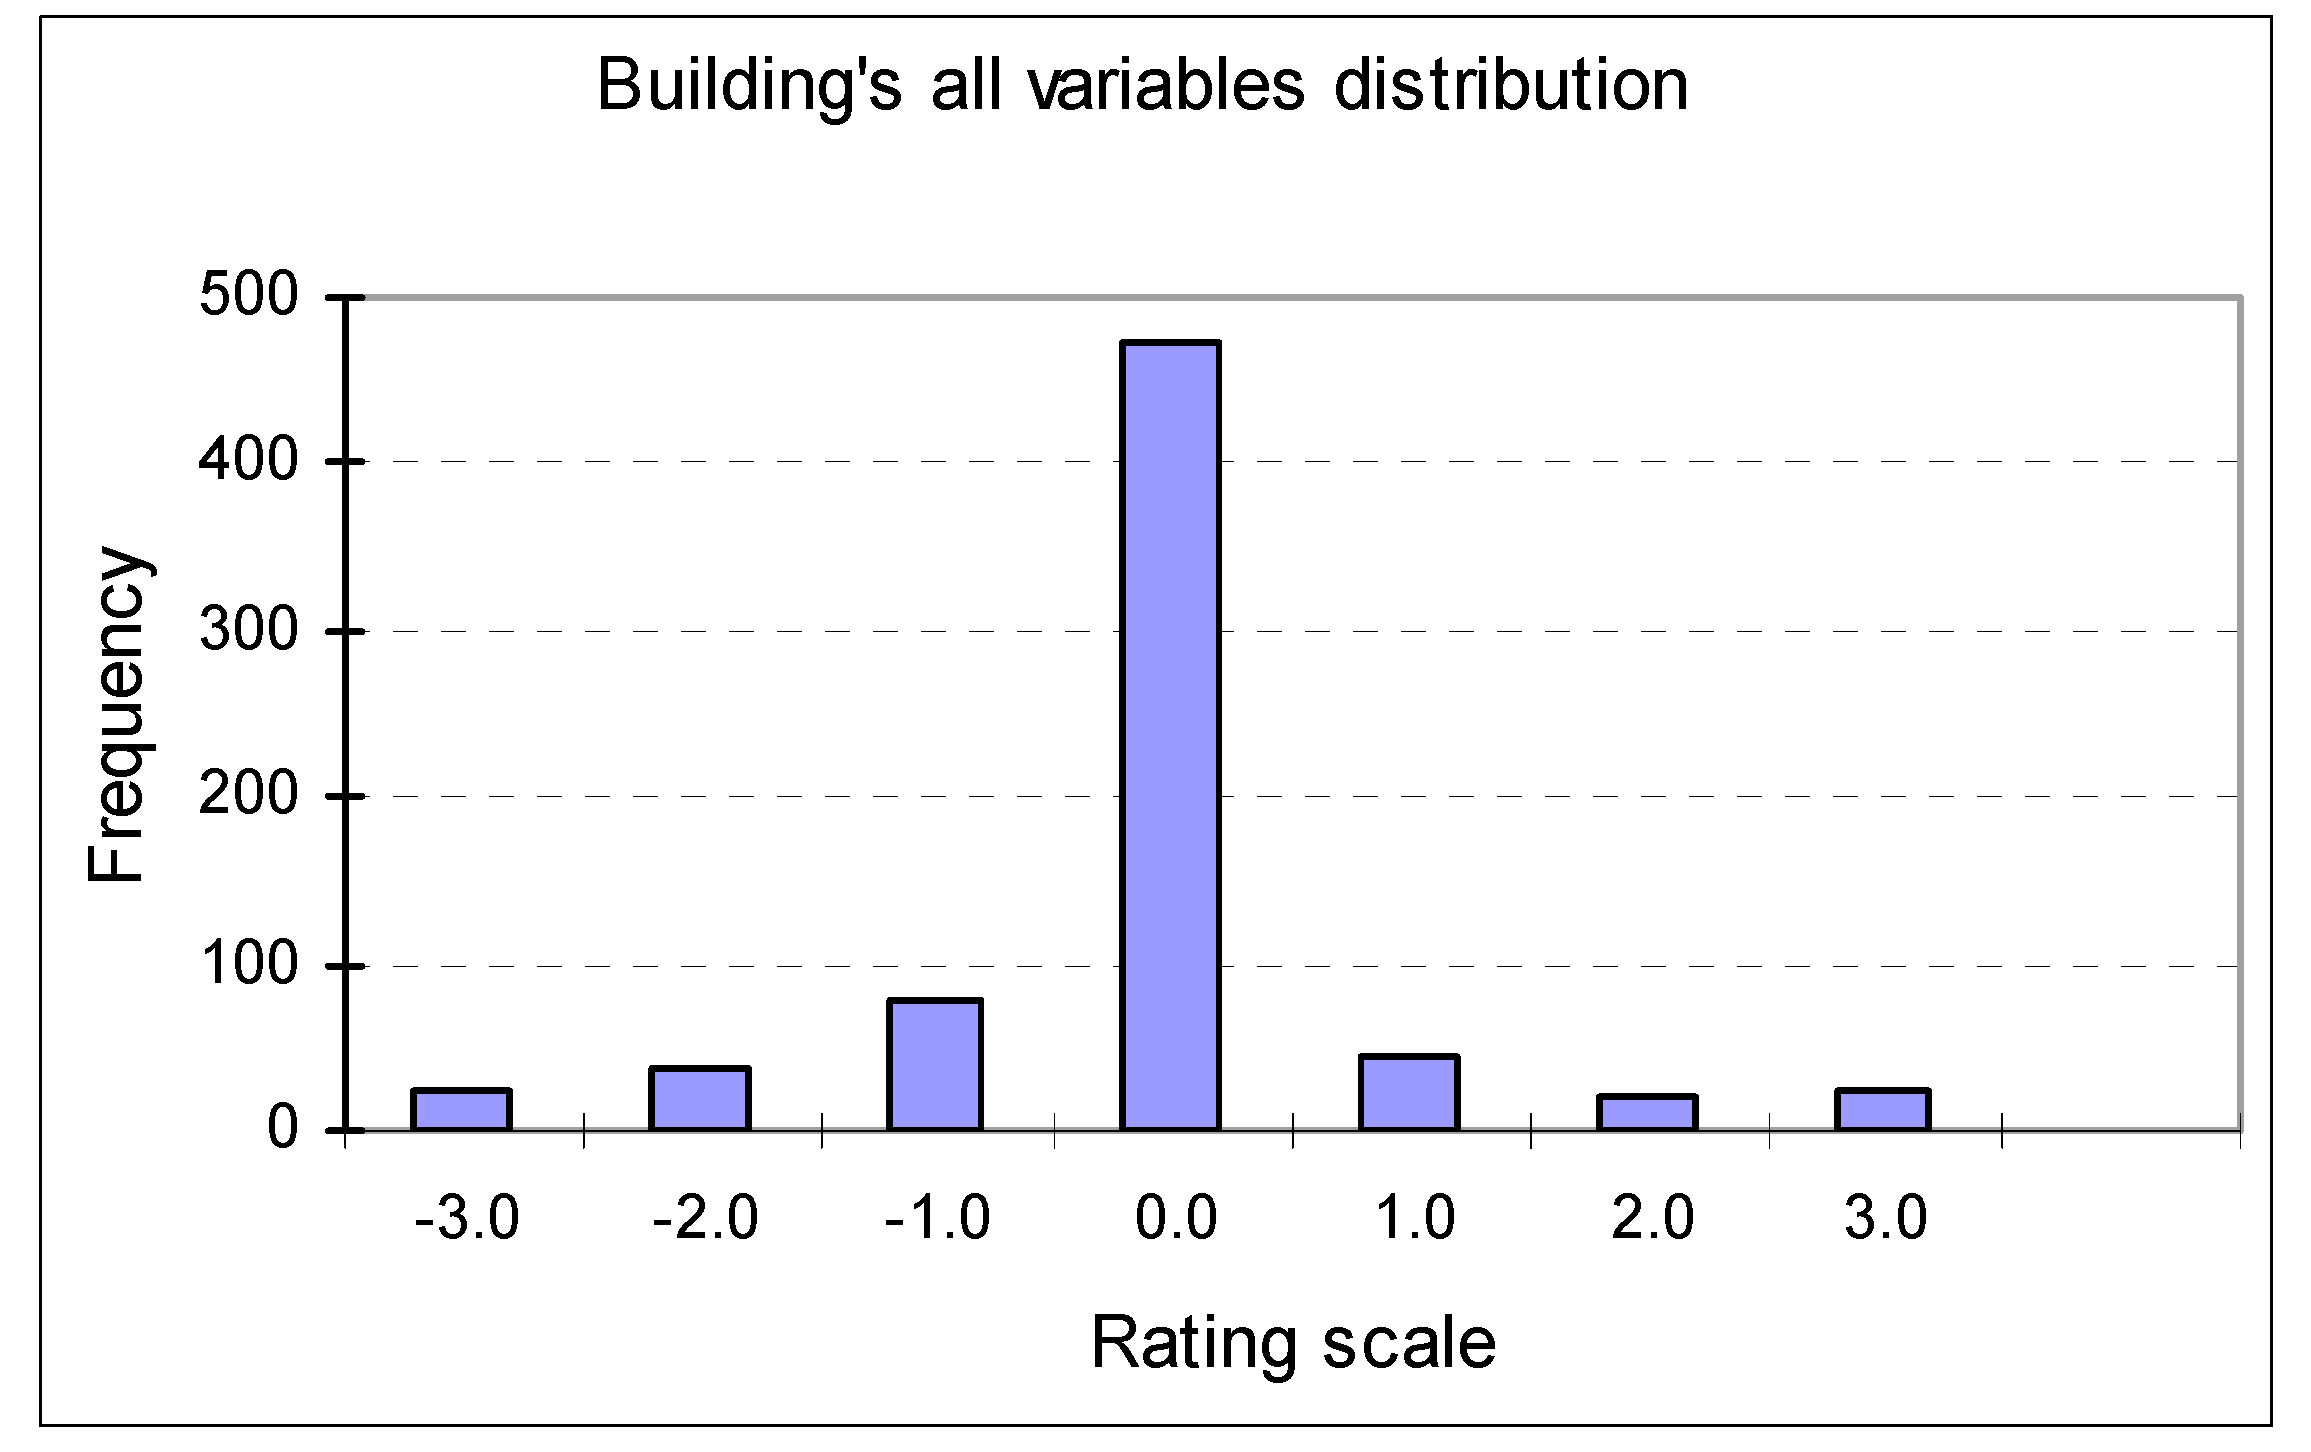
A total of 700 votes were cast covering all variables on the seven-point scale for the whole building throughout the year. Table 2 lists the number of votes (frequency) for different rating scales. The majority of votes are (0) indicating optimum conditions, this corresponds to 67.4% of the votes.
Figure 5 depicts the overall distribution of votes over the rating scale. Although votes were cast for the extreme conditions (−3 and 3), indicating severe discomfort, their frequencies were small.
In addition to the internal conditions that affect the level of user satisfaction with different comfort-related variables, it has been reported that people are usually happier in smaller buildings [21]. From the field surveys, it is also reported that people are more tolerant of green buildings [21,22,23]. These two notions apply to the building. The users’ knowledge of the green credentials of the building and the fact that they are working in a small building should have favourably affected their level of satisfaction.
Leaman and Bordass [21] claim that users tend not to worry about comfort as such, but rather discomfort, and they react when a ‘crisis of discomfort’ has been reached. They also suggest that individuals have different tolerance thresholds and respond differently and at different times, taking different measures to restore comfort. Users of the building have a good level of control over their building. The building has been developed in a way to enable users to have a high level of ownership of the design and building fabric. Although some of the individuals who initially led this process in the organisation have since moved on, there is a collective sense among the current users that the building represents an off-grid sustainable green building. Such a perception is believed to have favourably influenced the level of satisfaction experienced by users [21,22,23,24].
Leaman and Bordass [21] claim that in buildings where control over environmental conditions have been removed from users, people are less tolerant of discomfort conditions. Bordass and Leaman [3] also suggest that in contrast, in buildings where users have a clear understanding of how the building works and can control internal conditions through measures such as opening/closing windows, changing thermostat settings, etc., are more tolerant if things do not turn out quite as well as they should. They also suggest that as far as occupant perceptions are concerned, the influence of the building, its systems and its management are inseparable.
6. Sources of Dissatisfaction and Satisfaction
6.1. Air Temperature
Leaman and Bordass [21] have reported that in summer users usually say that naturally-ventilated buildings are too hot, while they complain that they are too cold in winter. Humphreys and Nicol [25] have reported that people usually become more tolerant of warmer environments compared with the case a generation ago.
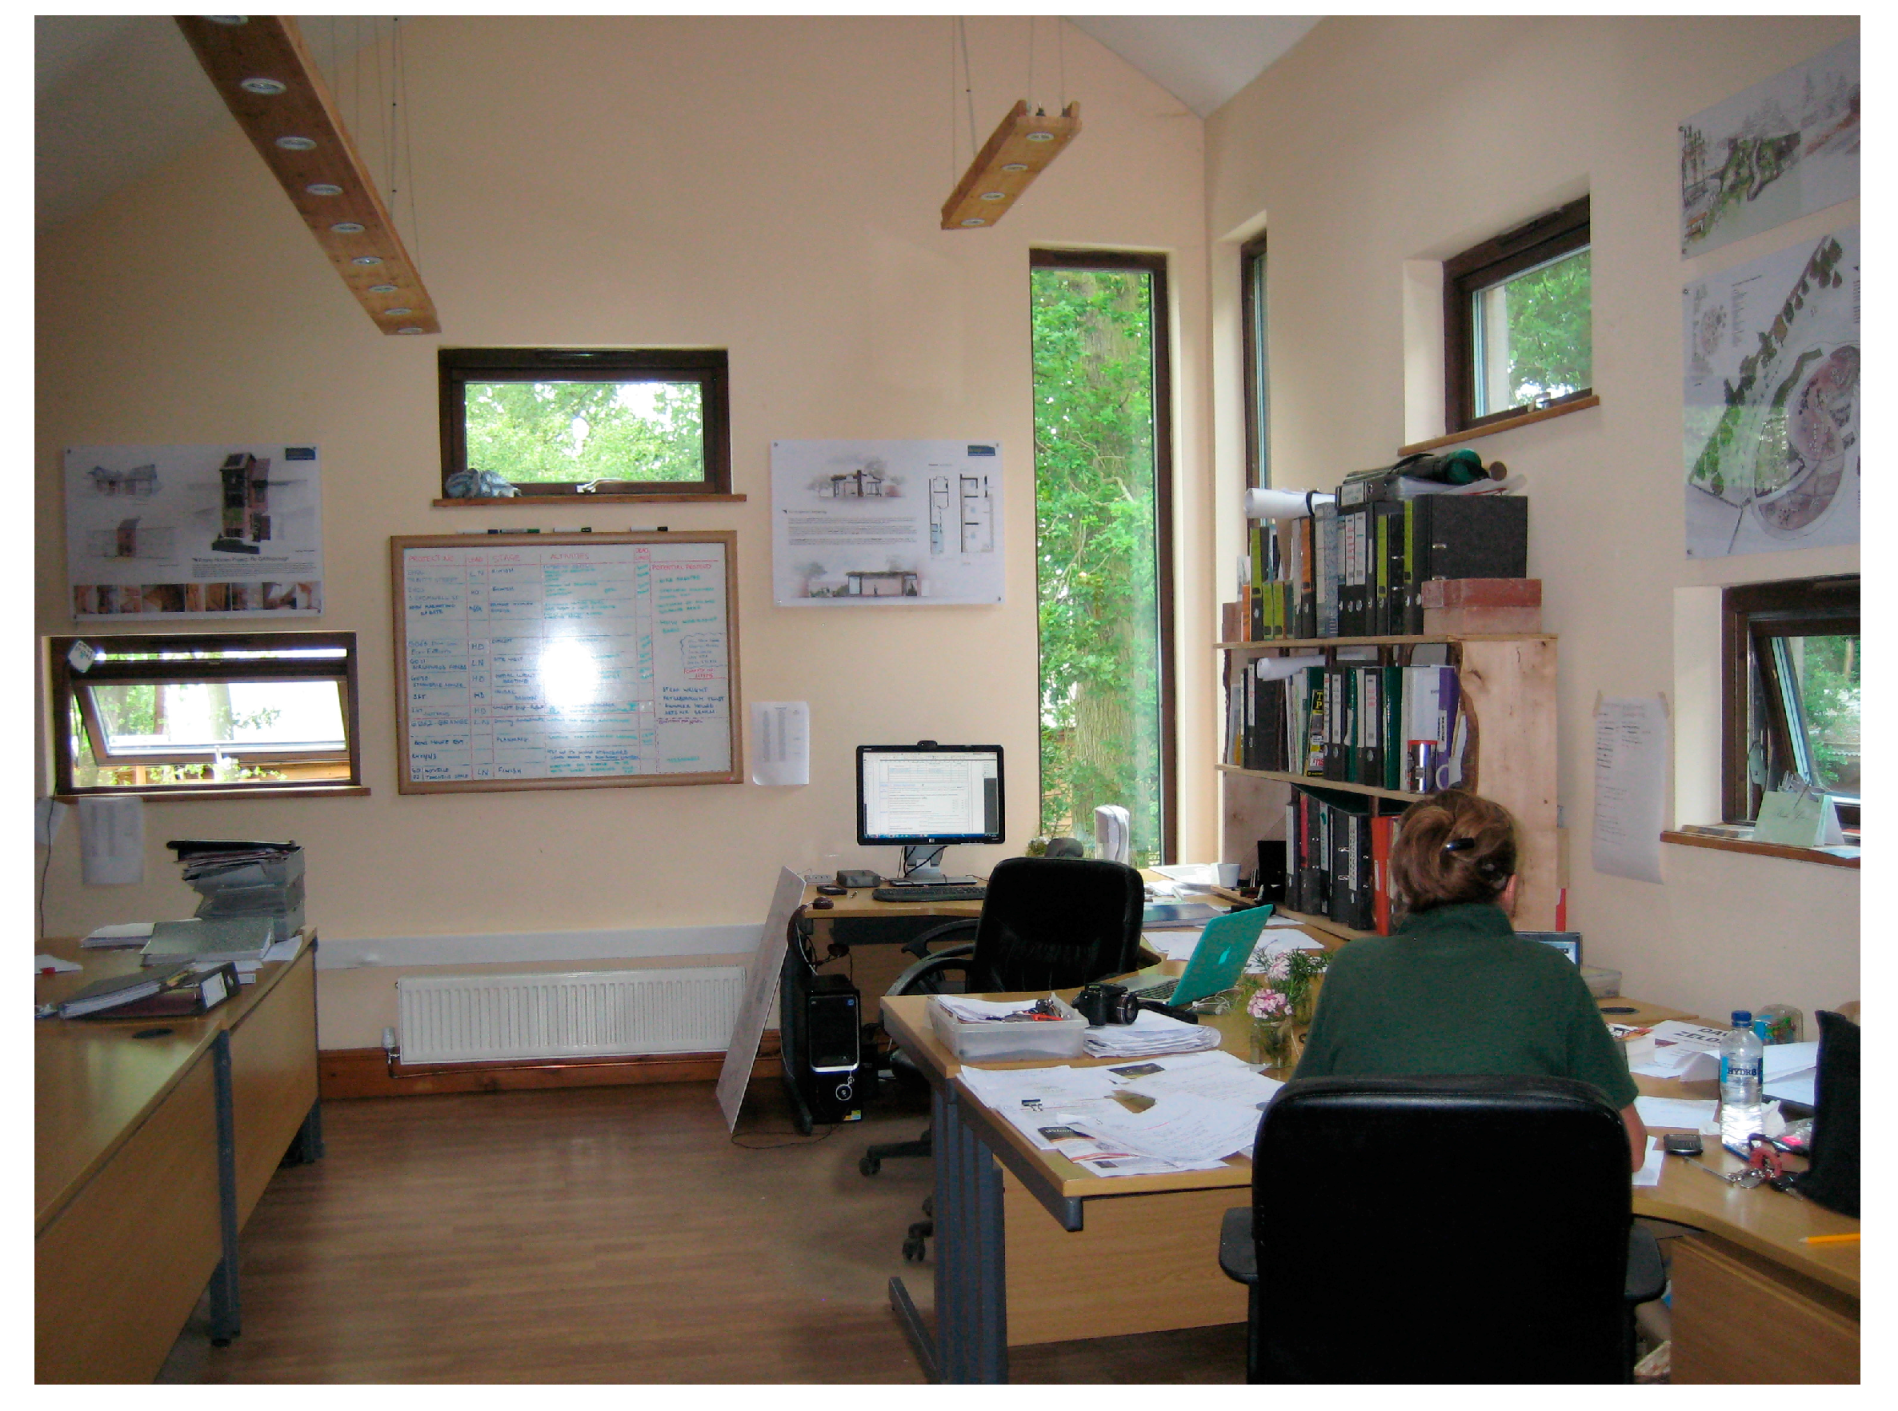
Offices in the building are thermally light, with a highly-insulated timber frame construction. There are nine users working in the two office spaces. The larger office is a shared open plan office with a hot desk arrangement (Figure 6), while the smaller office is a private office used only by one person. The partitions originally designed to provide storage spaces for the offices, as shown in Figure 3, have not been installed to maximise office floor areas.
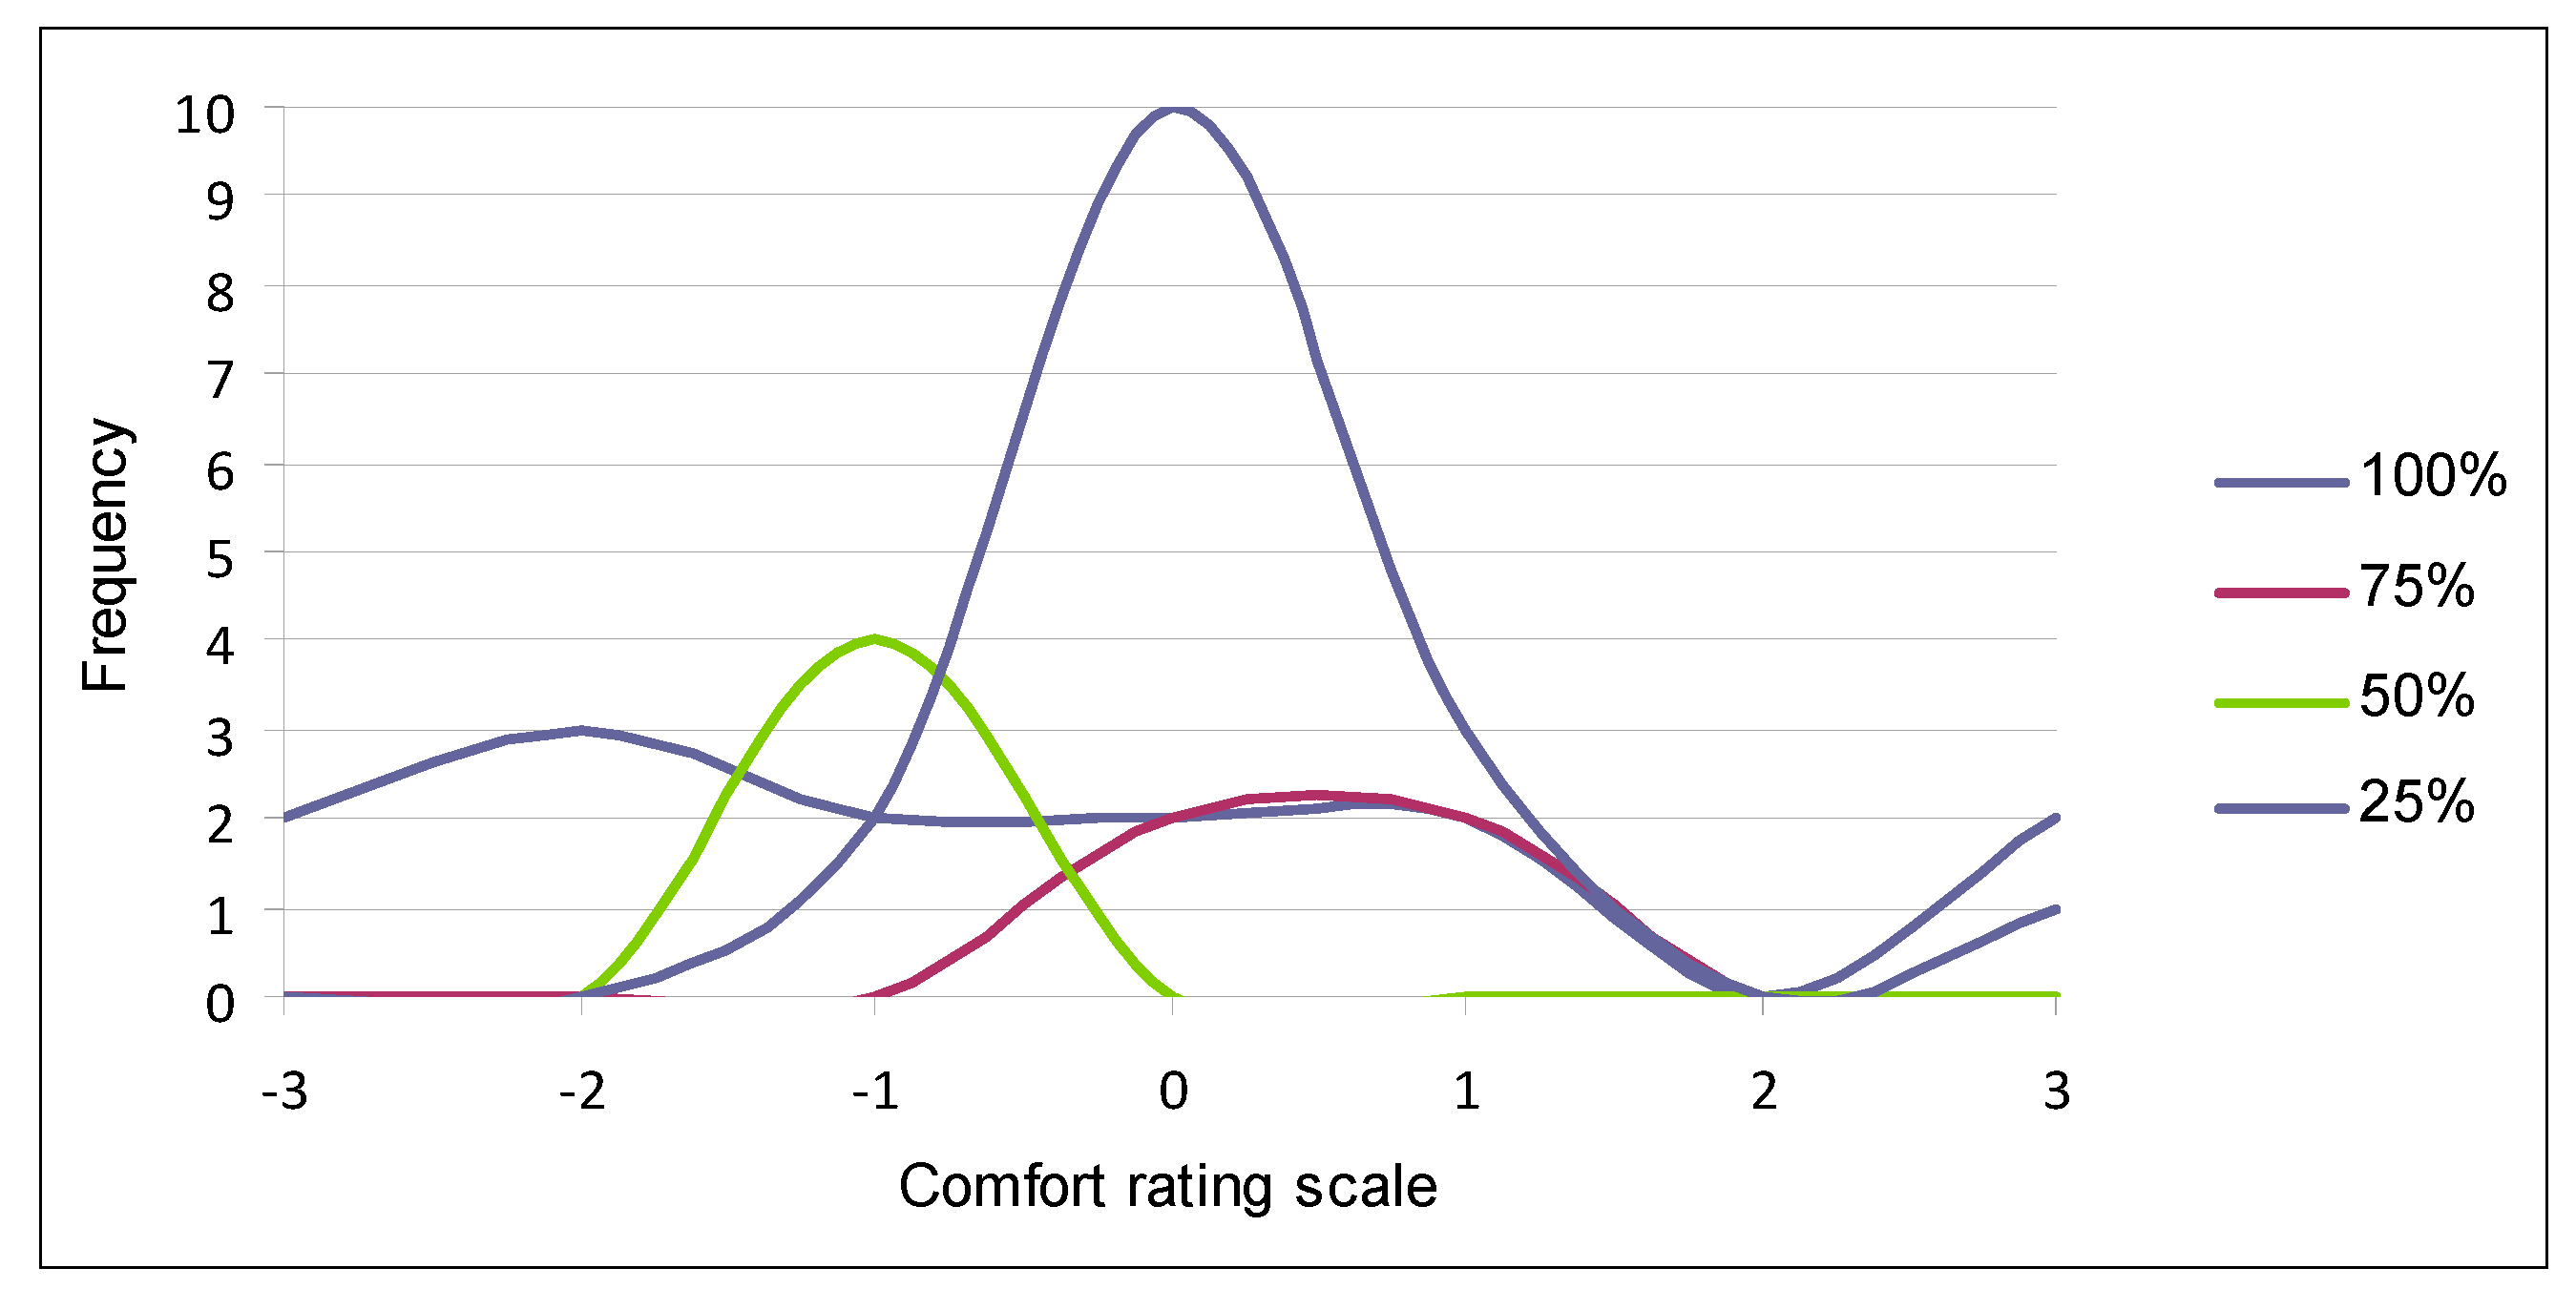
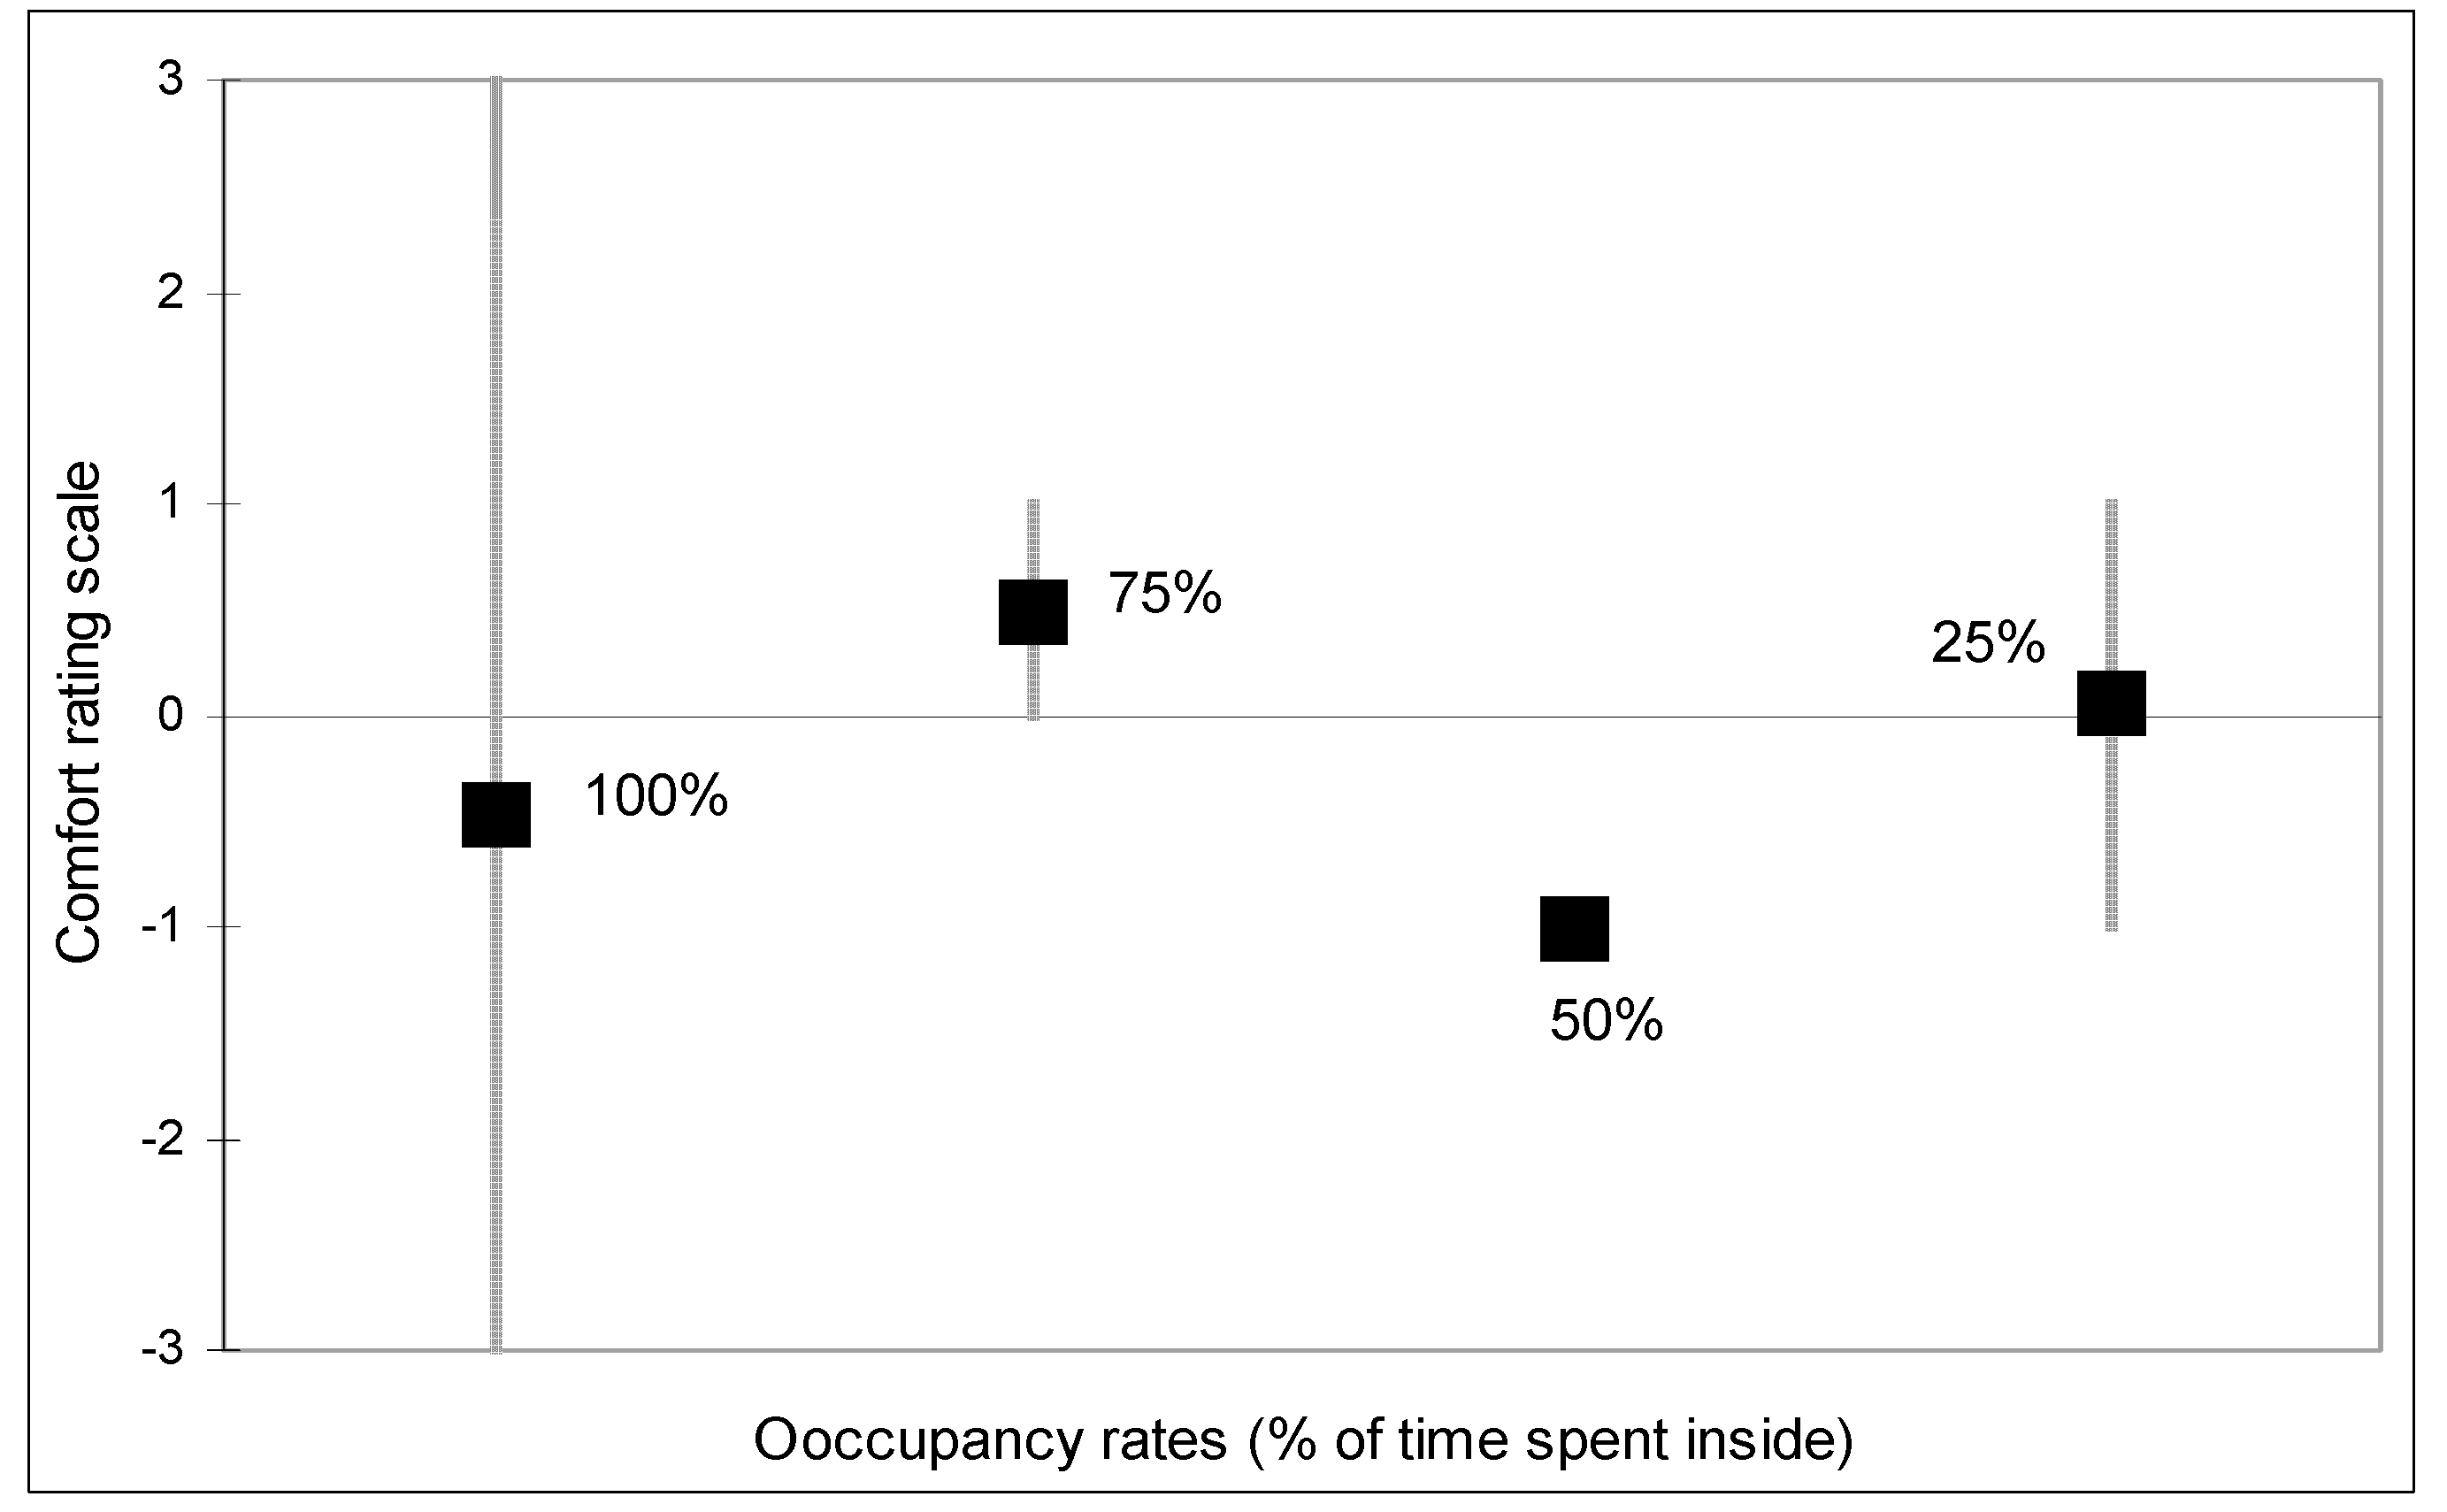
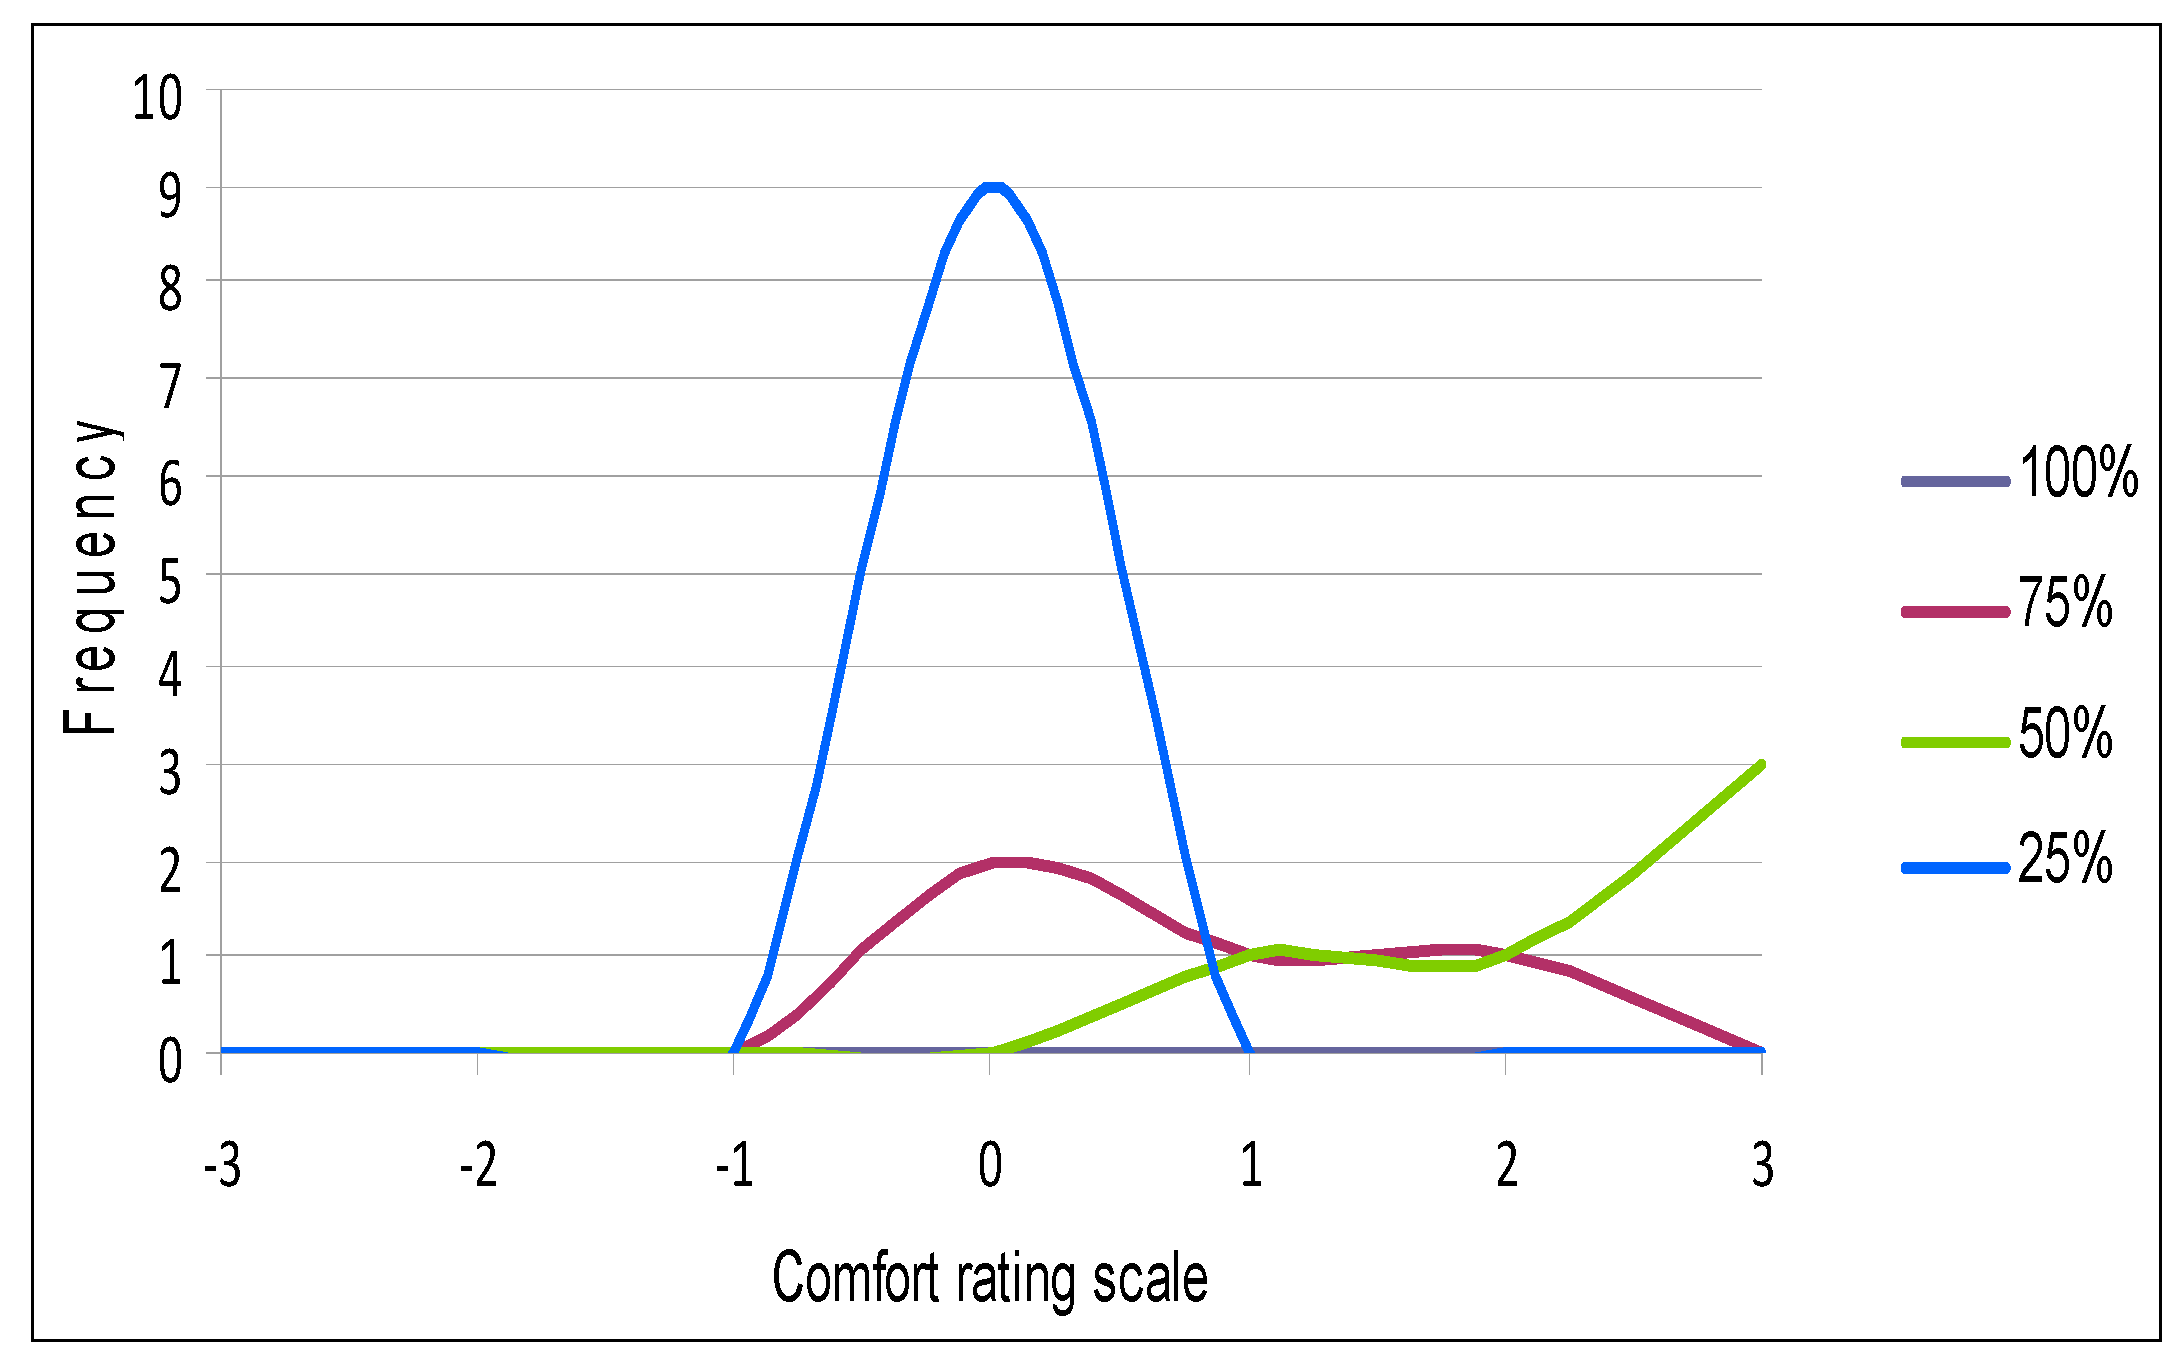
Figure 7 depicts the responses of the office workers for the air temperature throughout the year, spending different amounts of time inside their workplace. Office workers in this building have different roles, some for example are rangers who spent parts of the day outside the building in the woodland. The results suggest that those who have more opportunities to benefit from the natural environments surrounding the building have enhanced perceptions of satisfaction. The results show that those who spent the least amount of time inside (25%) have scored the maximum number of votes for the midpoint 0 (optimum condition). The mean vote for this category of staff, as shown in Figure 8, is very close to neutral (0), being 0.07, with the rating scale ranging from −1 to 1. For the four users who spend 50% of their time inside, they all rated the internal conditions at −1 on the rating scale. For those with 75% occupancy, the rating ranges from 0 to 1 with a mean vote of 0.5. For 100% occupancy, the range spans from one extreme to another on the rating scale, i.e., from −3 to 3. The mean vote for these users was of the order of −0.46.
6.2. Workplace Environment
The building is set in a mature broadleaf woodland benefiting from many natural features and points of interest. Some of the workers spend part of their day outdoors and have the ability to see the woodland through numerous windows. Abbaszadeh et al. [26], in their analysis comparing green with non-green buildings, have concluded that occupants in green buildings were more satisfied with thermal comfort and air quality in their workplace. From the results of their survey they however concluded that the average satisfaction scores for lighting and acoustic quality were comparable to those in non-green buildings. Similar results were also found by Armitage and Murugan [23]. In their survey of ten green office buildings and eleven non-green office buildings, they found that employees in green workplace environments consider themselves to be happier and healthier than employees in non-green workplace environments. The office workers in the building in this study are fully aware of the sustainability credentials of the buildings and hence this awareness may have favourably influenced their satisfaction with the indoor air temperature of their workplace.
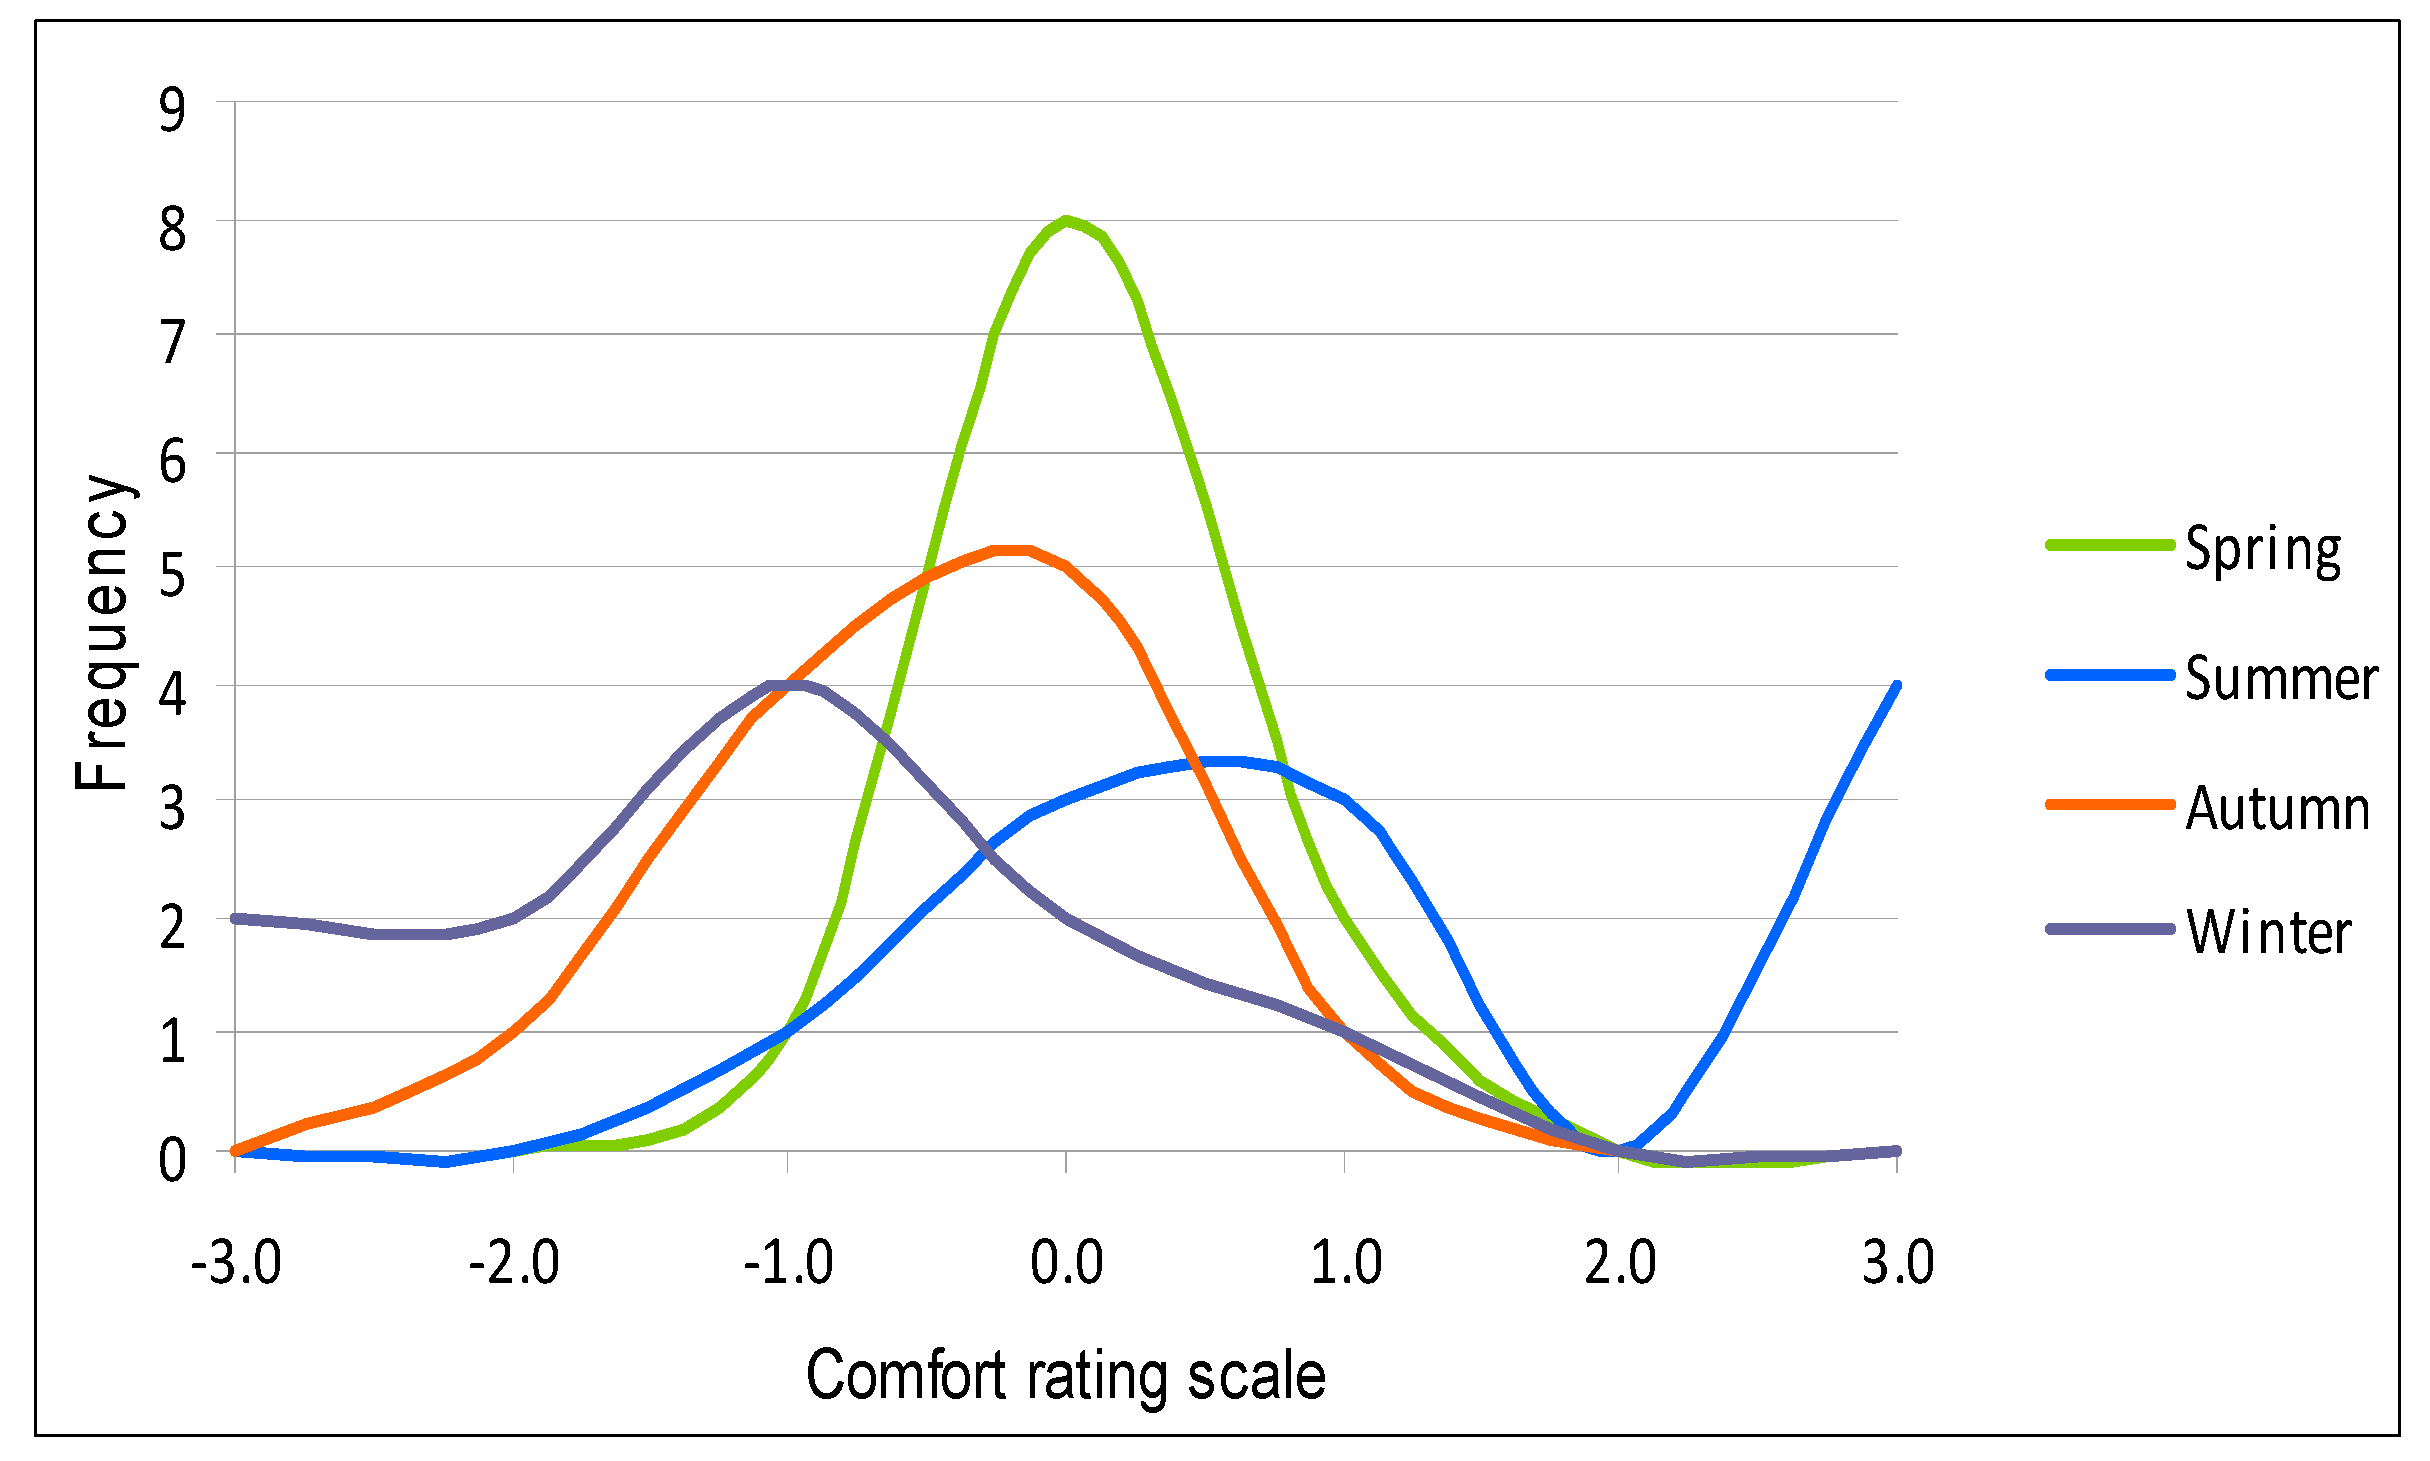
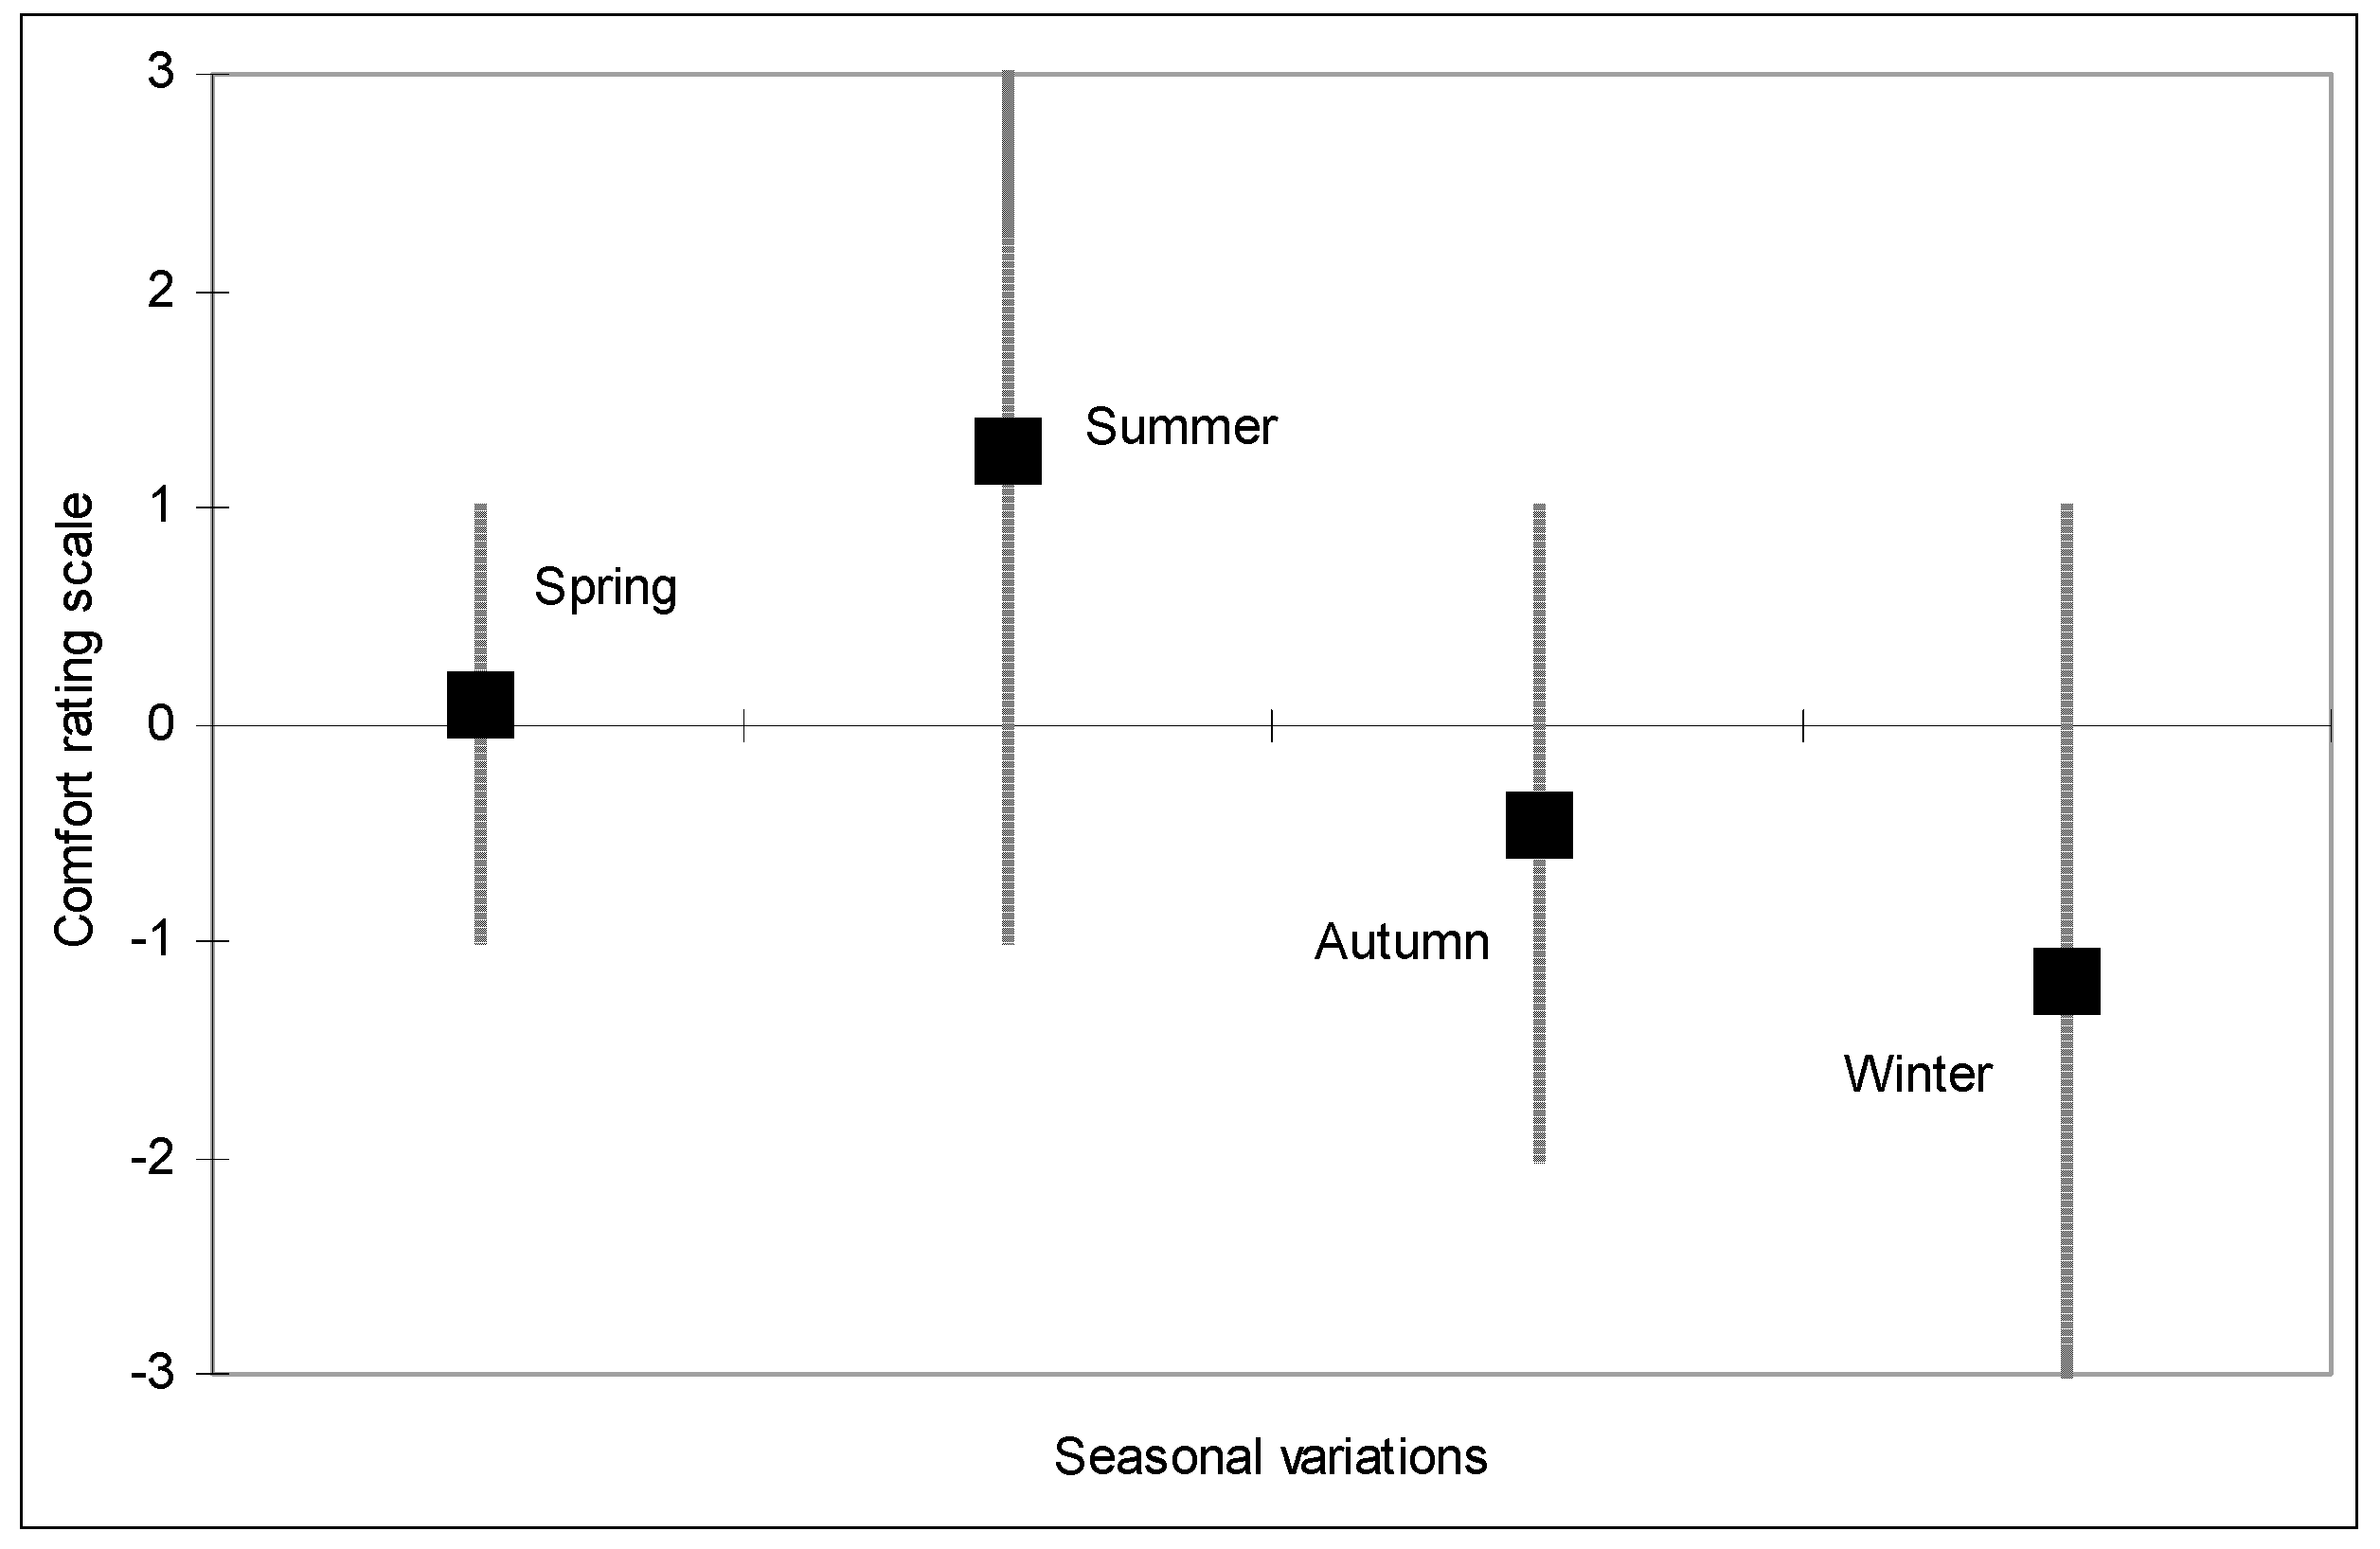
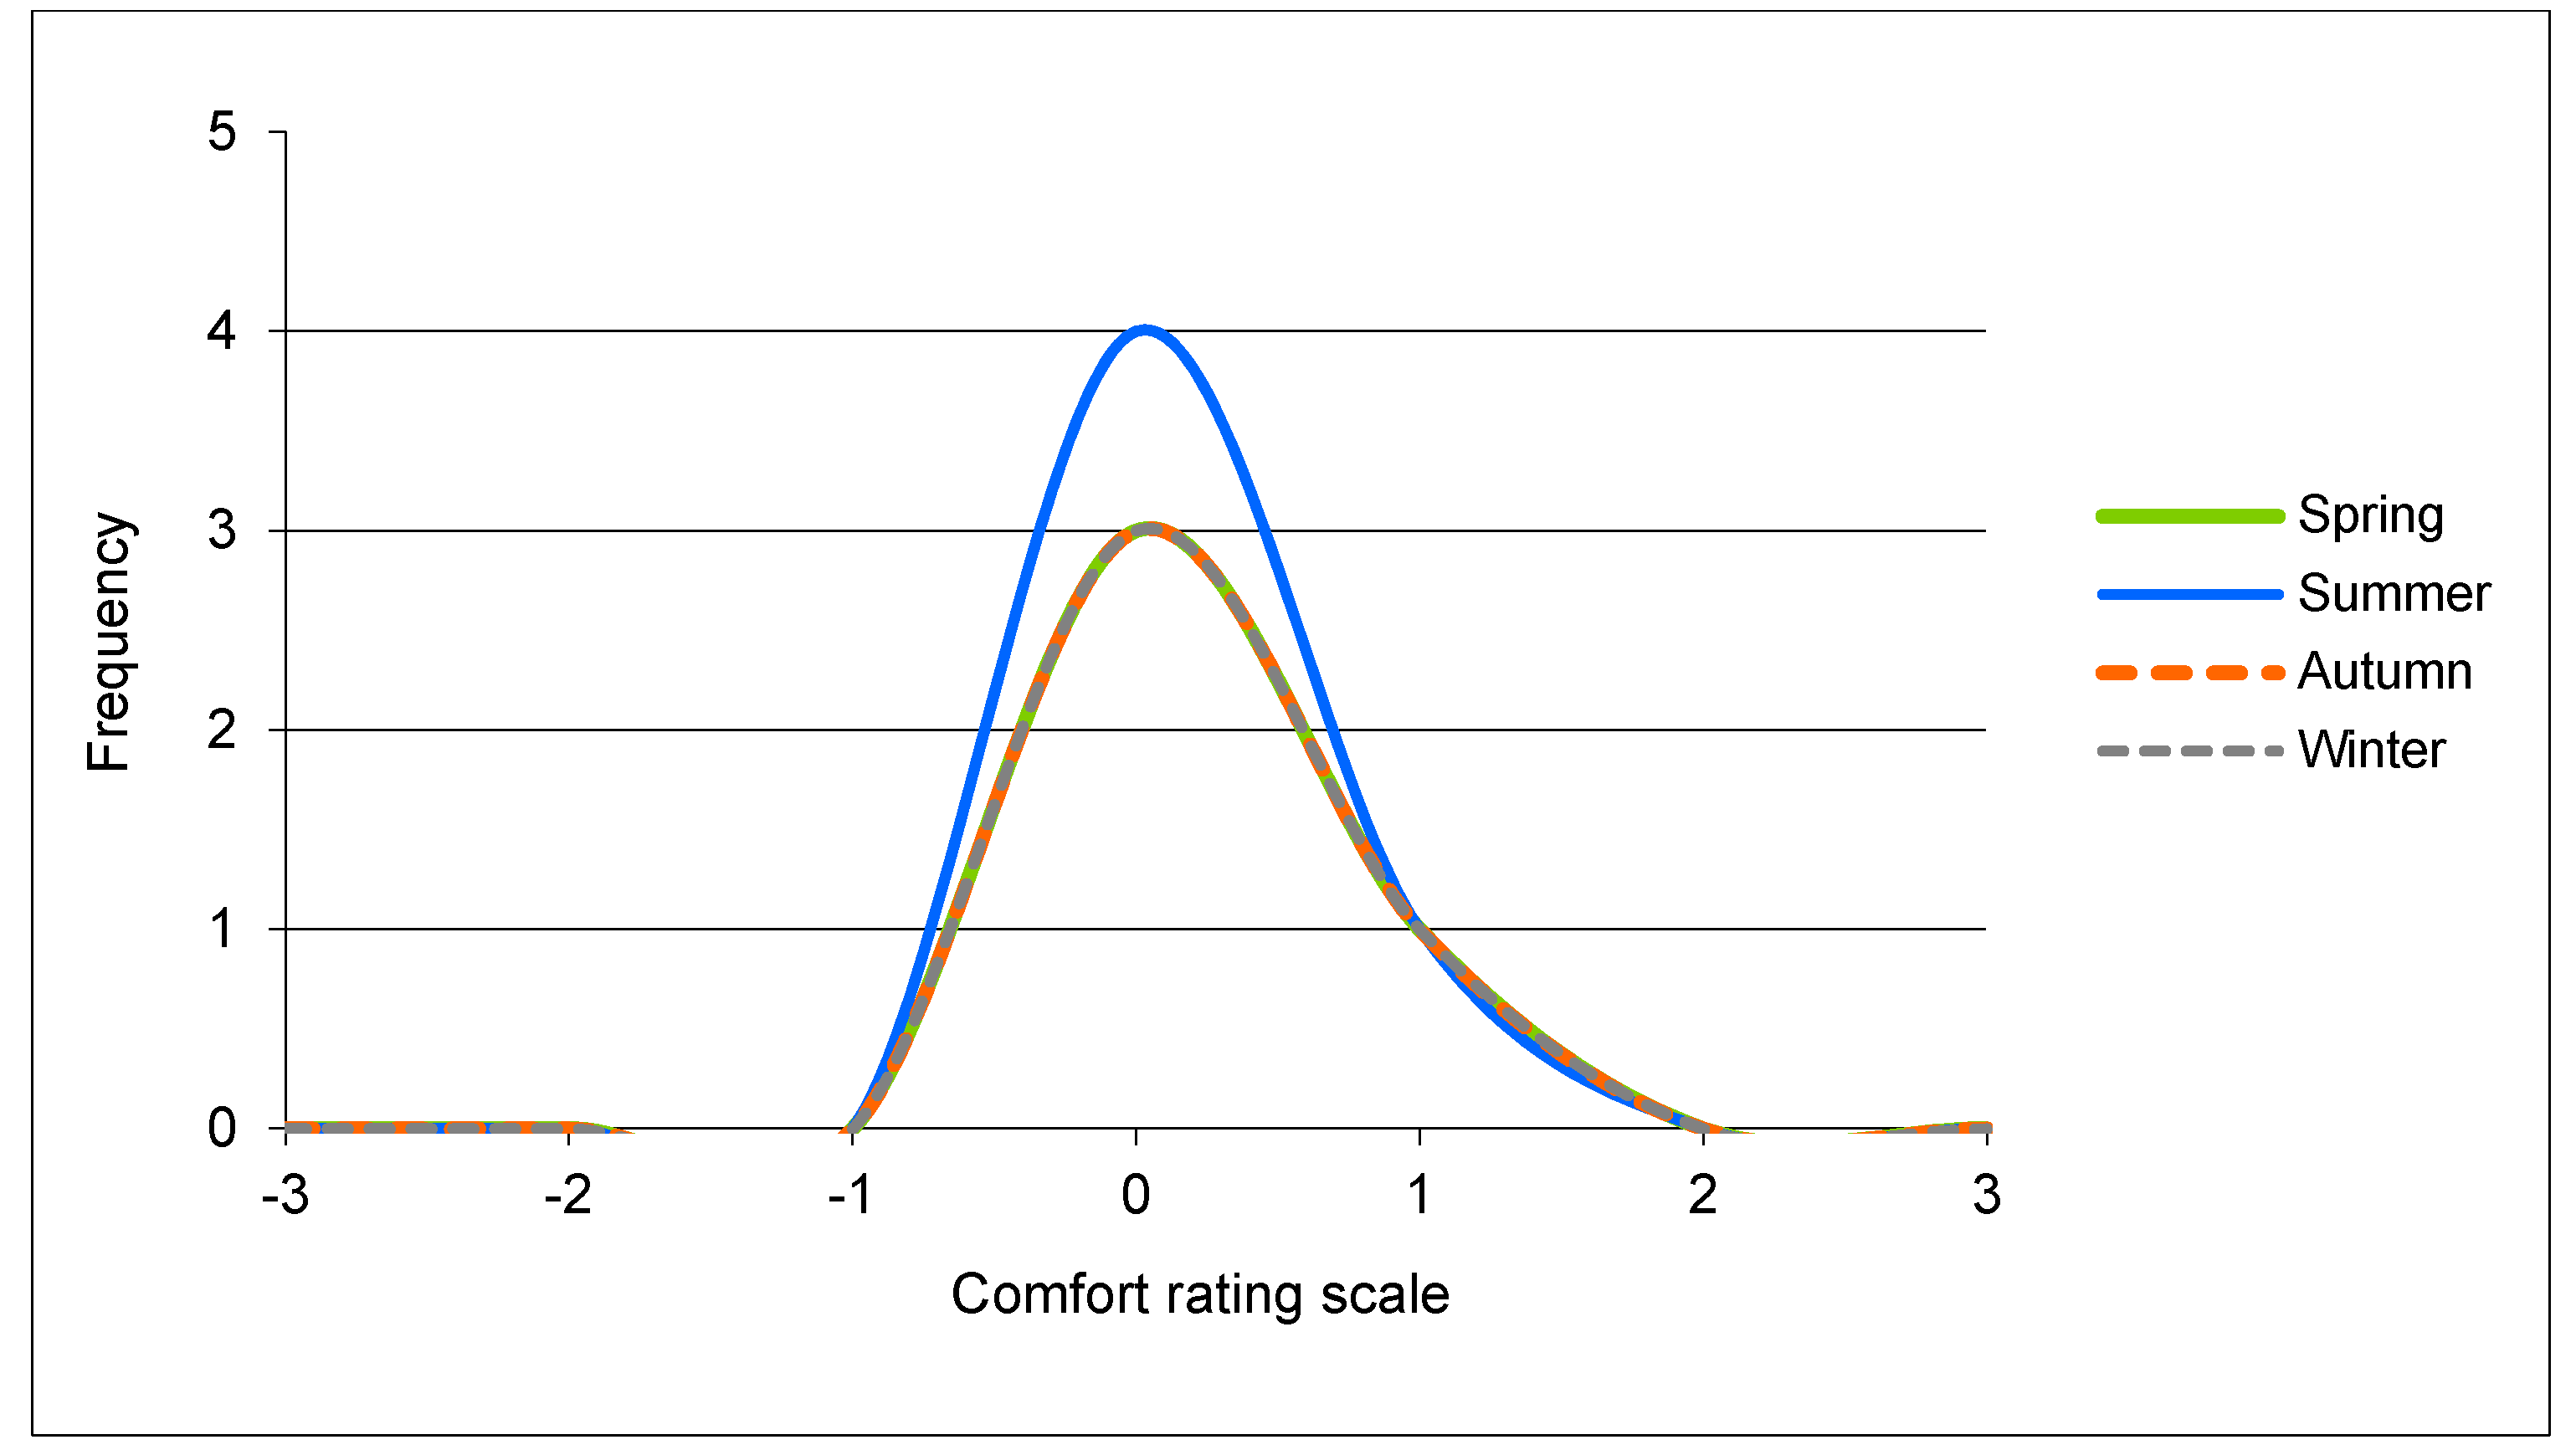
Figure 9 shows the influence of the seasons on the comfort sensation regarding the air temperature in the offices. The results confirm cases reported in the literature that in naturally-ventilated buildings some users find it too hot in summer (four users voted 3) and cold in winter. Spring and autumn had the lowest mean votes, 0.091 and −0.455 respectively. On the other hand, summer and winter had mean votes of 1.273 and −1.182 respectively as shown in Figure 10.
Large windows are provided in the canteen to provide views out (Figure 11). Those who spend less time inside the canteen are happier and there is a tendency for finding the space to be hot for those spending more time inside (Figure 12). Although there are some sensations towards the hot end of spectrum, there are no complaints as such about the space being cold. This could be due the higher activity levels in the canteen, as well as higher internal heat generation, e.g., due to food preparation.
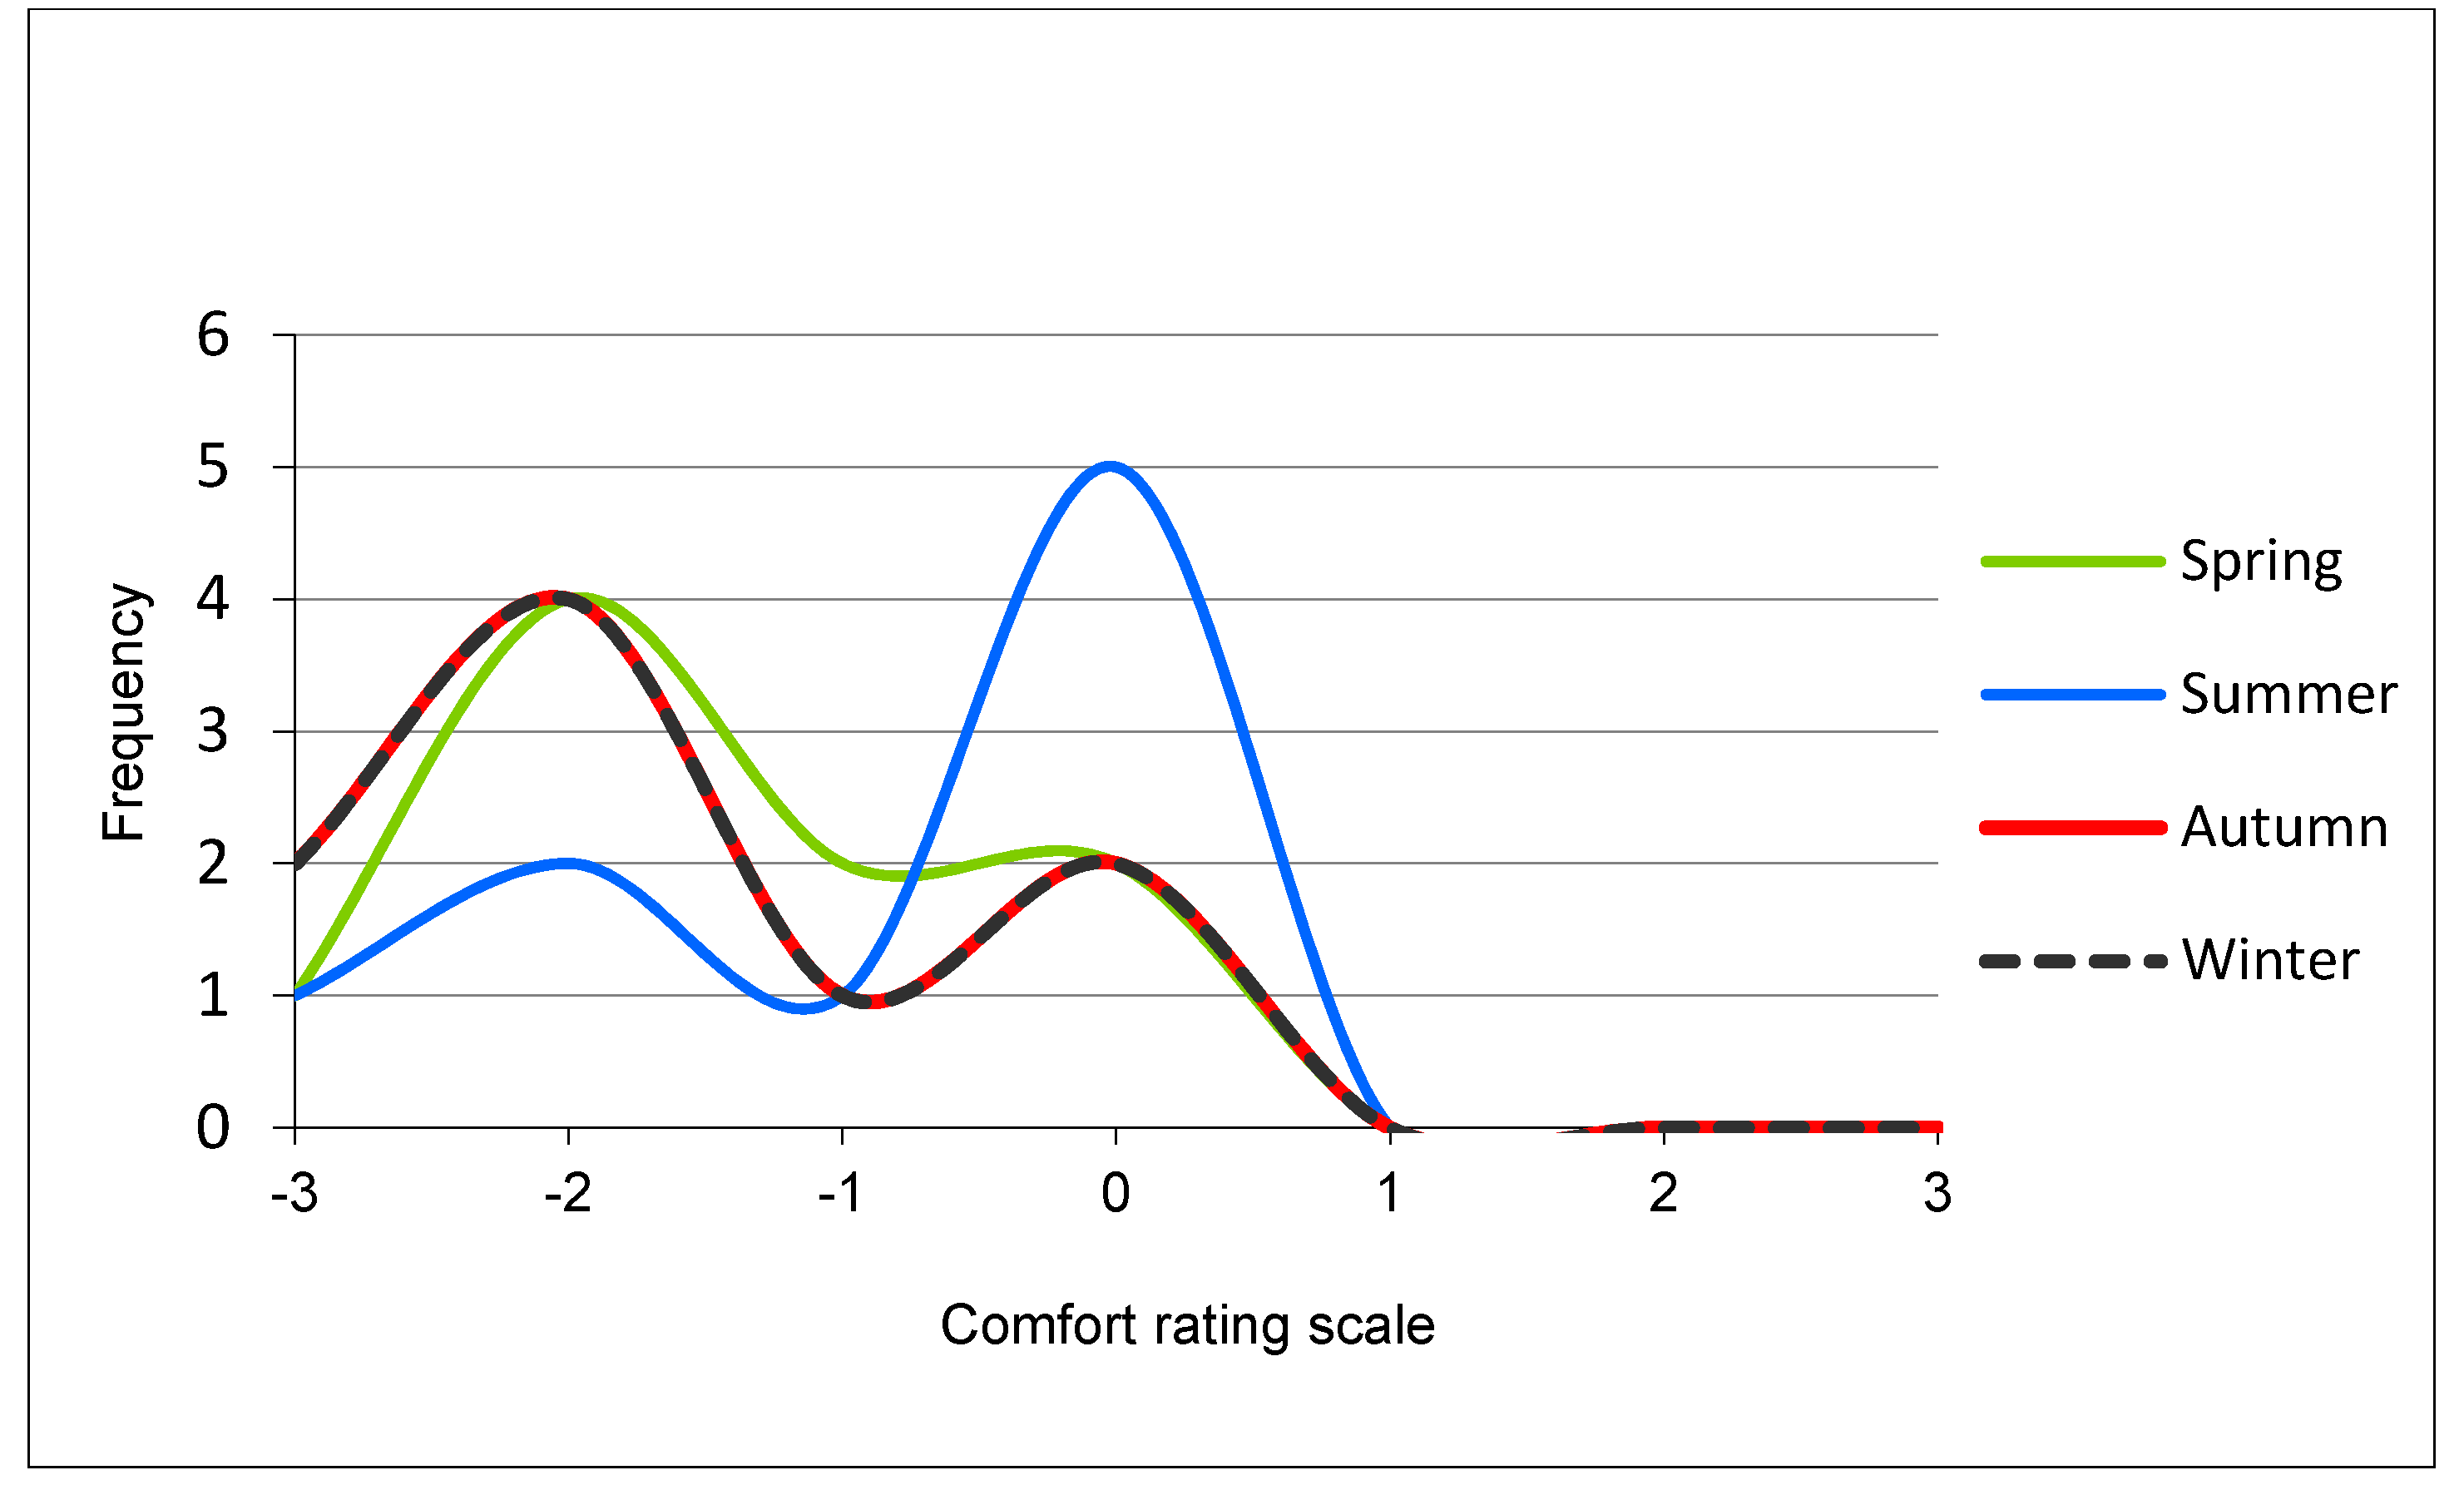
The hall is a thermally heavy construction made of rammed earth. It is mainly used for events, so its use is intermittent throughout the year. As shown in Figure 13, the temperature ratings in the summer are evenly distributed around the midpoint of 0 (optimum conditions), with only one vote expressing that the internal environmental conditions are hot (rating of 3). People however found the space to be cold in autumn and winter.
The mean temperature votes for the hall for spring and summer are close to the midpoint of 0, indicating that a good overall indoor environment is achieved, being of the order of 0 and 0.25, respectively (Figure 14). The mean votes for autumn and winter are of the order of −0.889 and −1.8, respectively, indicating that the overall sensations are towards the cold spectrum of the rating scale.
6.3. Daylight
The addition of the storage spaces to the working area in the offices has resulted in less average daylight factor and poorer light distribution due to the increased depth of the offices than was planned in the original design. Survey results confirm that users feel that the offices are under-lit throughout the year, as shown in Figure 15. The corresponding mean votes were −1.444 for spring, −0.889 for summer, and −1.667 for autumn and winter.
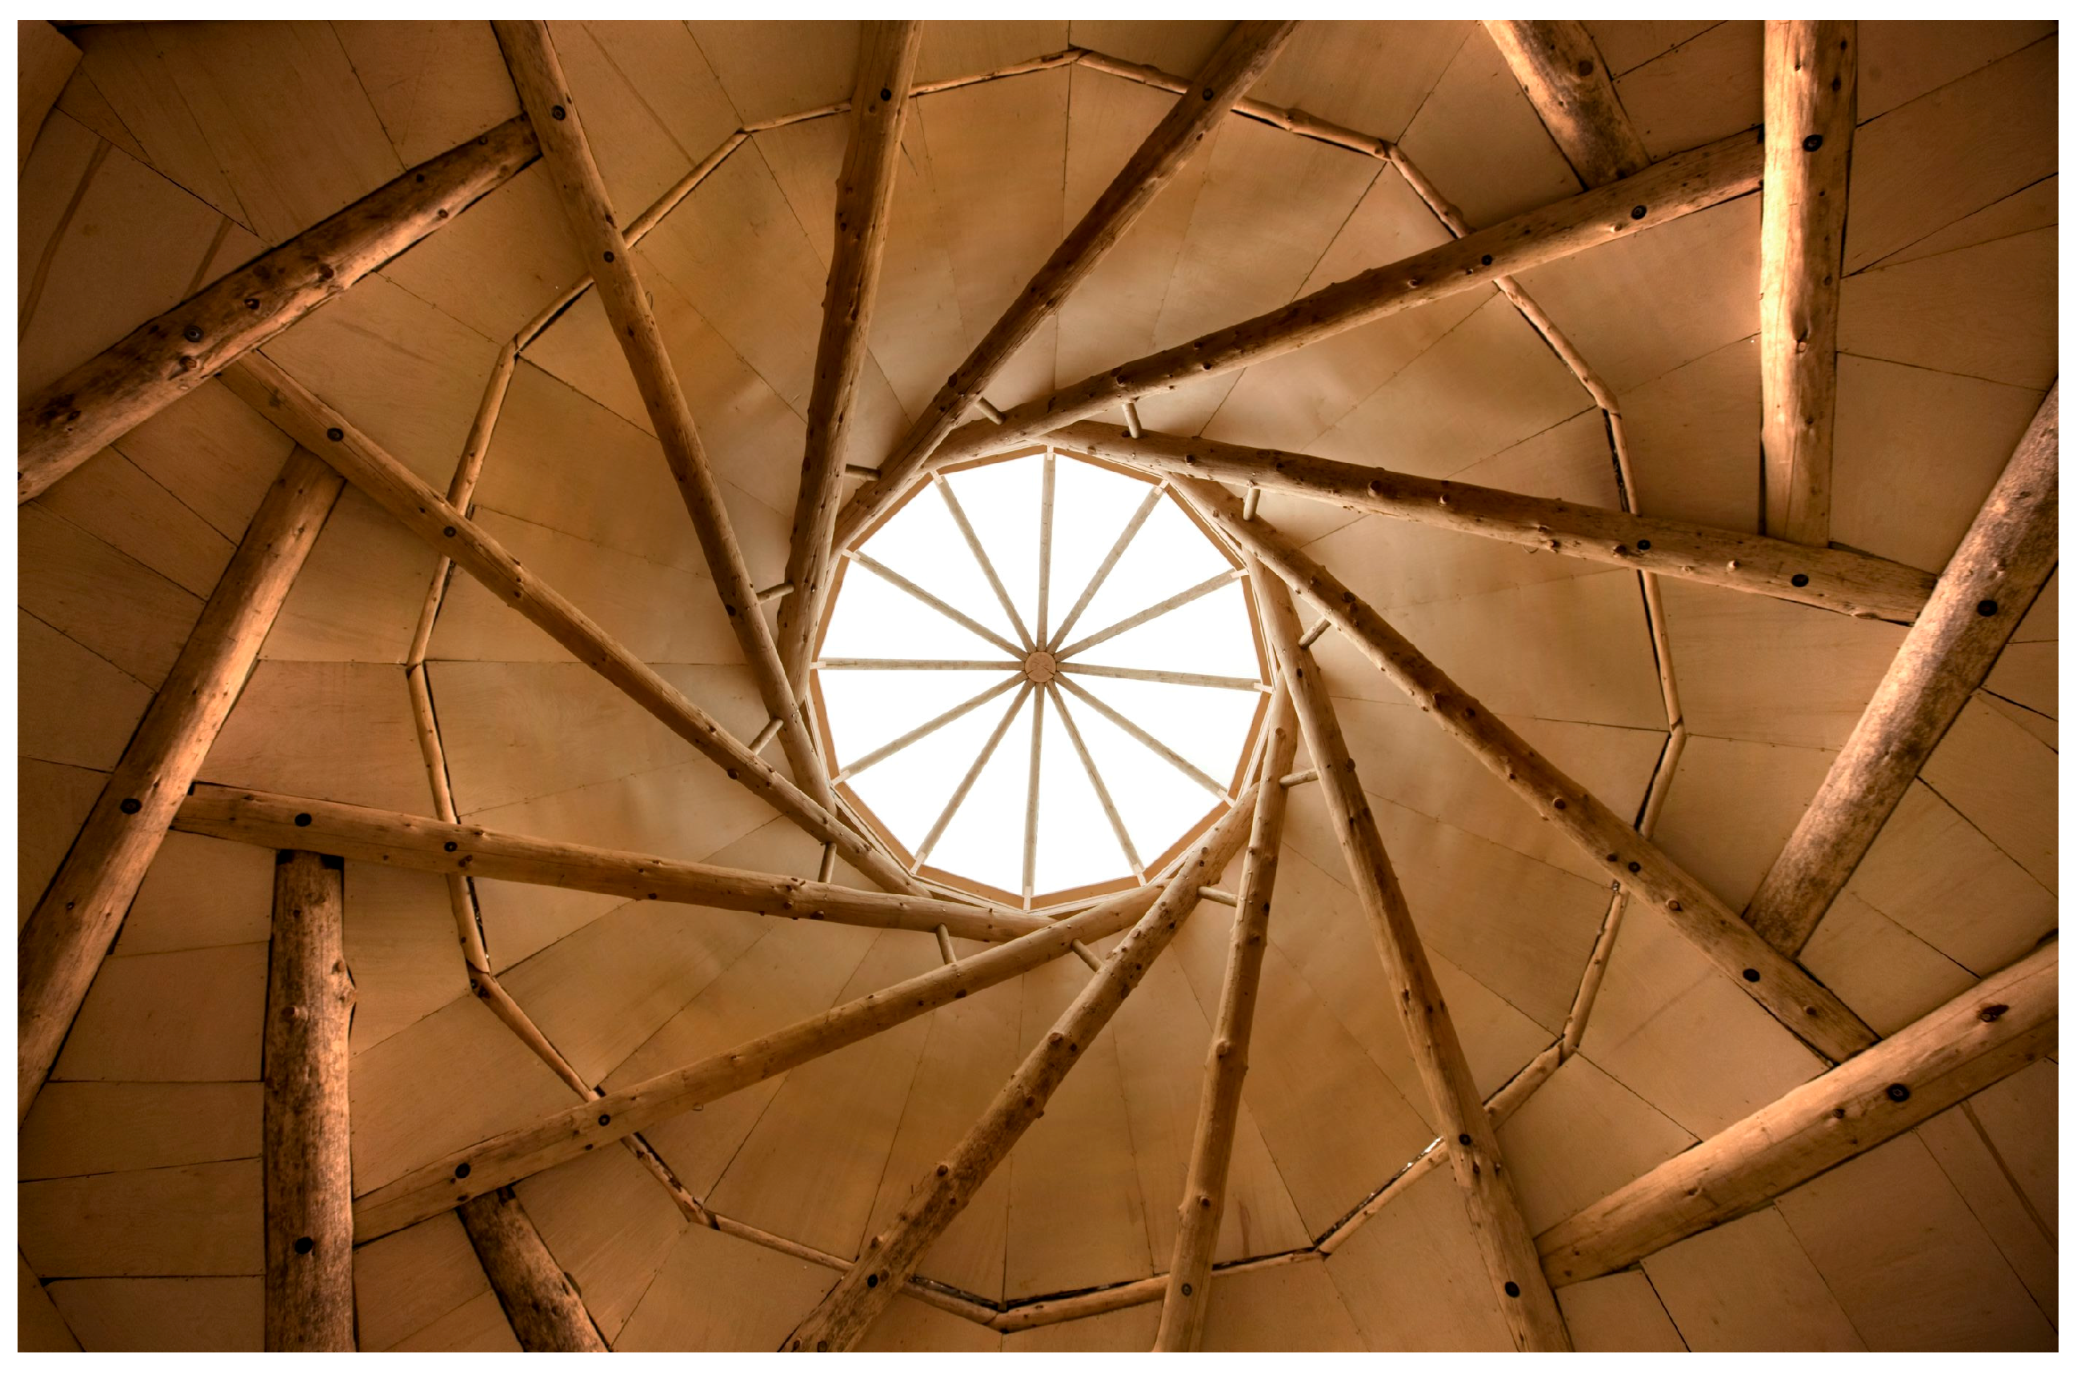
On the other hand, it seems that the hall, due to its openings and especially the roof light in the reciprocal roof (Figure 16), benefits from an adequate level of natural light throughout the year, as depicted in Figure 17. The majority of votes were around the midpoint, indicating good level of daylight.
Similar analyses were carried out for other variables listed in Table 1. Table 3 lists percentile scores for optimum conditions (midpoint 0) and the ratings deviating from the midpoint in the offices for users spending different amount of time in offices. The table also shows the mean votes. Table 4 similarly lists the results for the whole buildings.
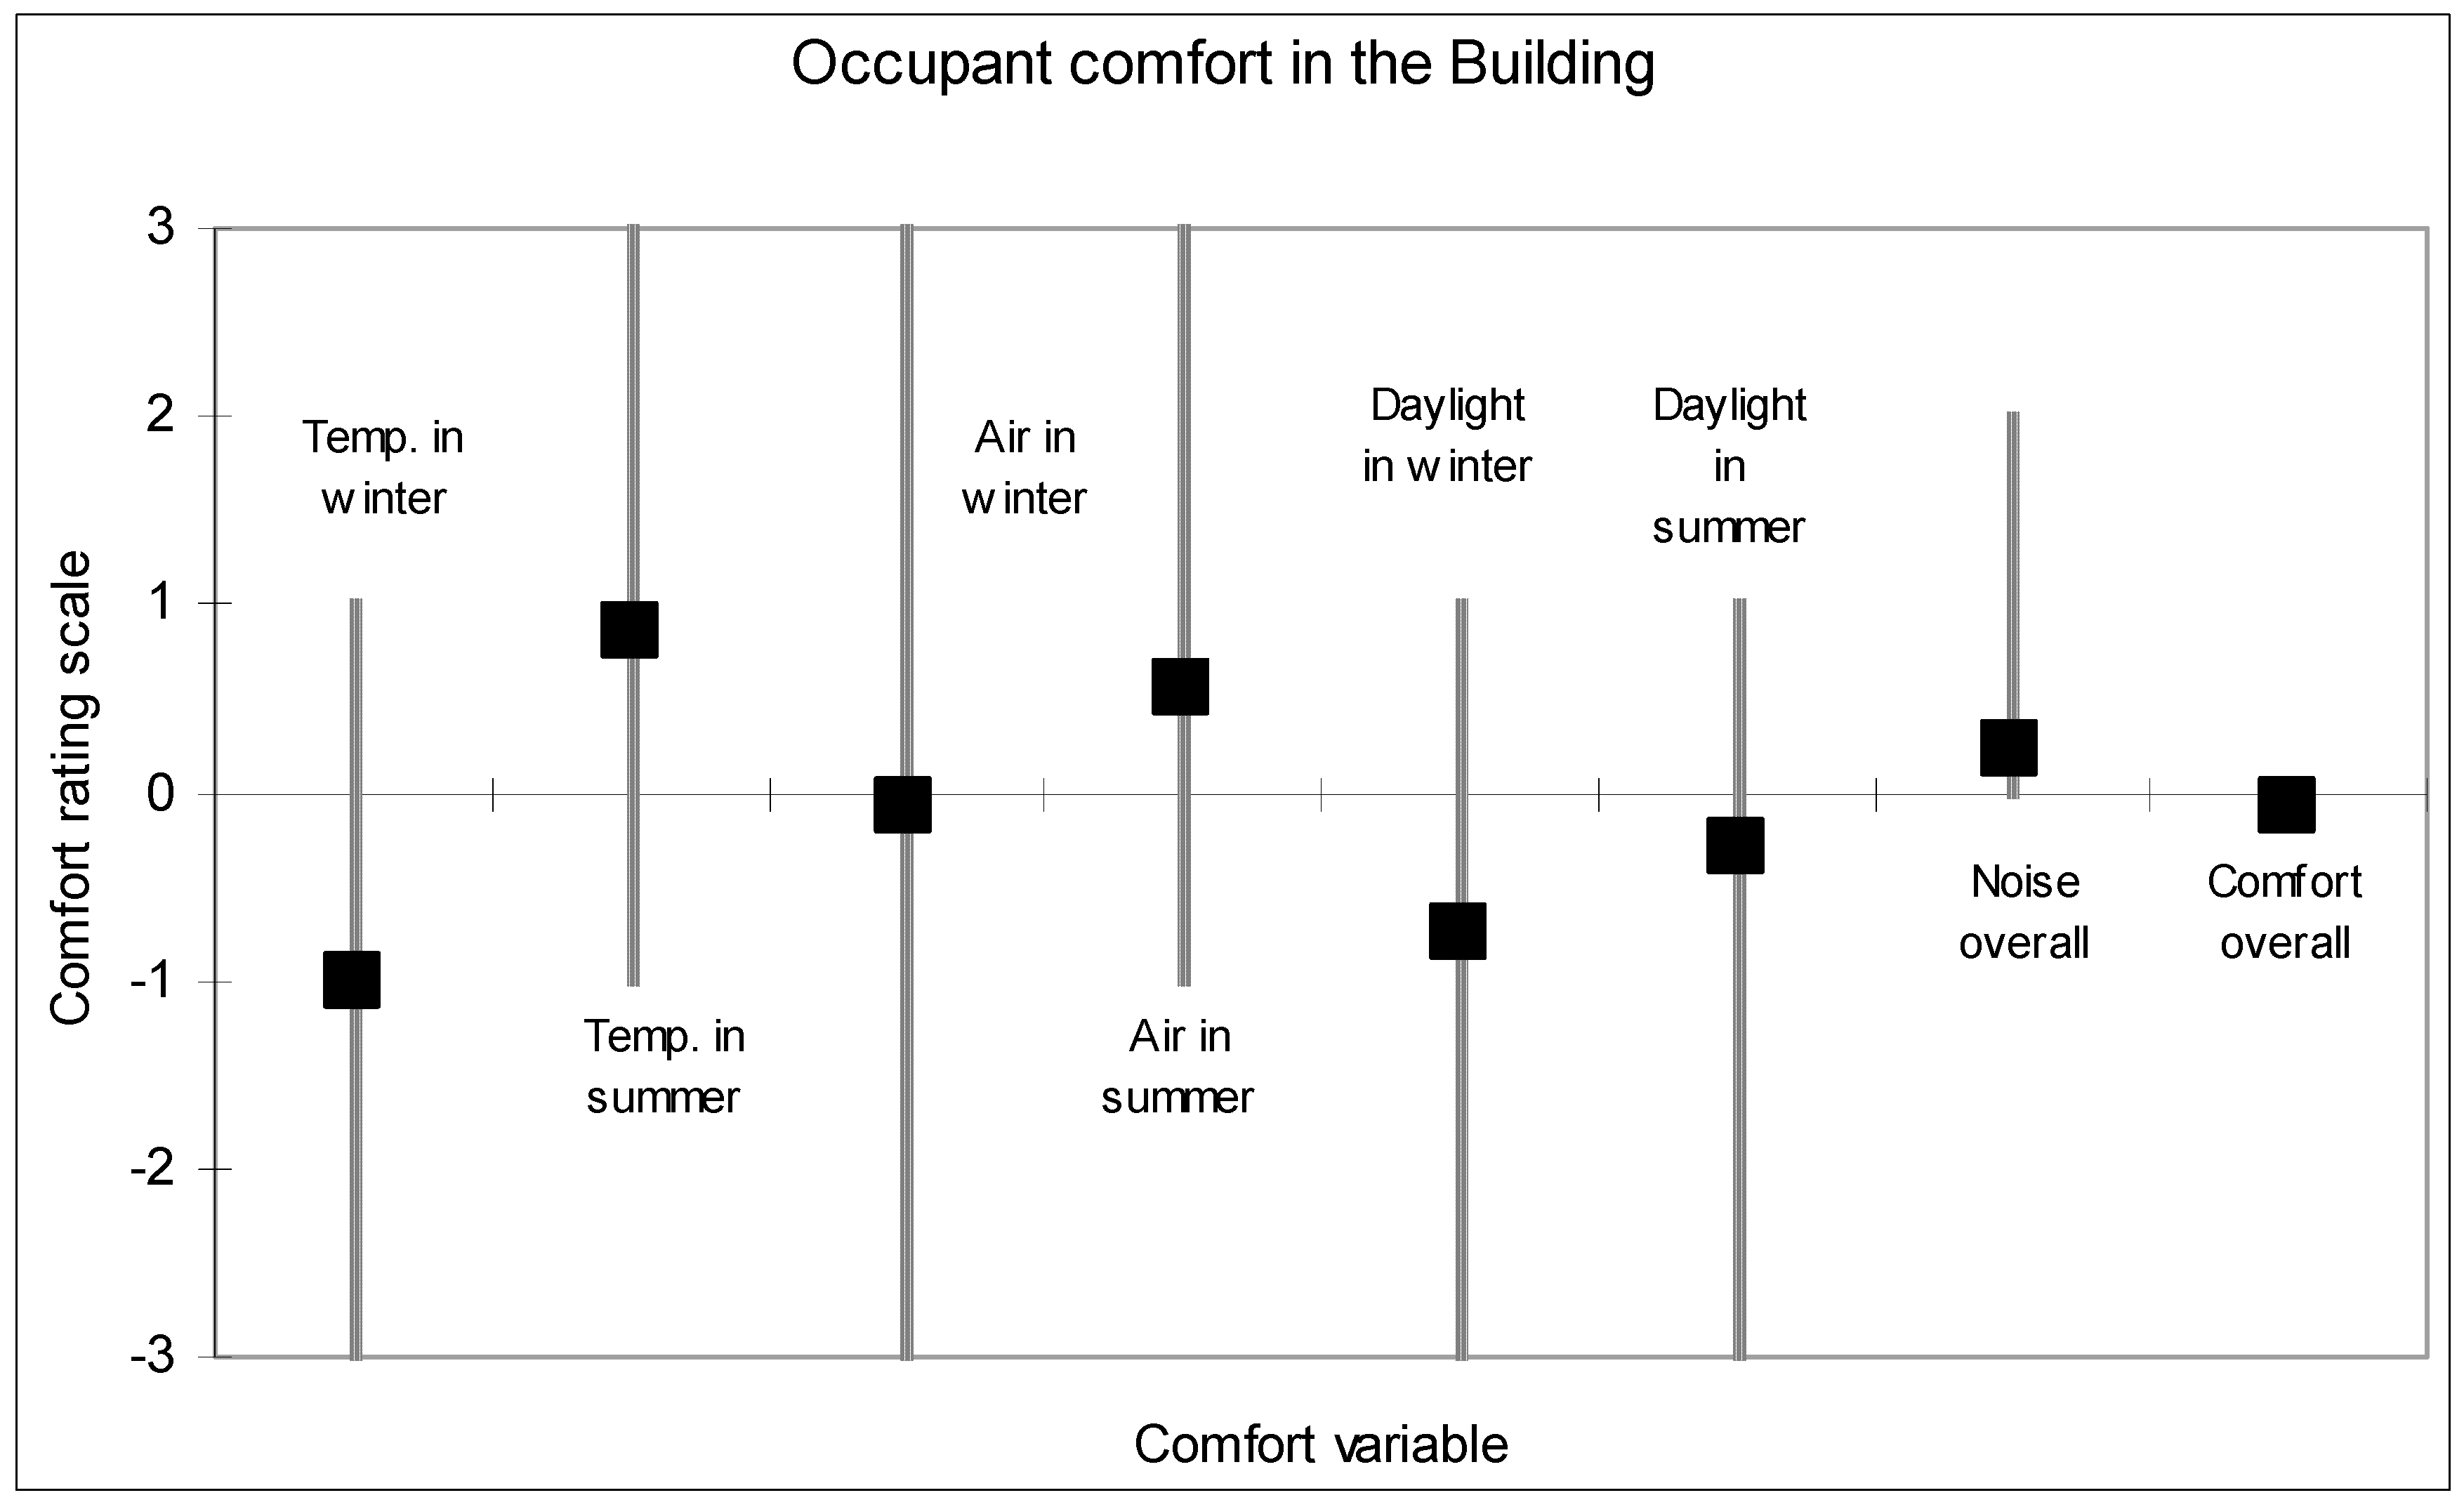
Figure 18 shows the range and mean values for different variables for the whole building. The overall comfort is close to the optimum midpoint (−0.066). This rather good overall satisfaction with the building may have also been influenced by the varied environments existing in the building, as suggested by Heschong [27].
7. Conclusions
In this building, it is clear that many of the regular users have a partly outdoor role and this changes their perceptions of comfort. The office workers who commented on the results felt that they had a unique perspective on comfort in their workplace, primarily because they had chosen to work in the woodland environment and tolerated the indoor environment within a context of outdoor weather. They felt that this has resulted in comfort dissatisfaction to be greater for people who spend a larger proportion of their time desk-bound, because they do not have the stimulation of an outdoor environment with which to interact. It is therefore evident that the quality of the outdoor spaces around the building played a major role in the level of satisfaction of its users
The results of the survey confirm that in buildings where users can take adaptive measures to control their environments, a higher level of comfort and satisfaction can be achieved. It is also evident that in this building, where the users were involved in the procurement process of the building, such as in its design, construction and maintenance, they have developed a sense of attachment to the building resulting in higher levels of acceptance of discomfort.
In naturally-ventilated buildings, as is the case for this building, people may complain that the building is warm in summer and cold in winter. Among the findings of the research is that although users may express some dissatisfaction with their environment, e.g., regarding air temperature and daylight in this case, if other aspects are satisfactory, people usually tend to forgive isolated aspects and find the building as a whole comfortable and satisfactory.
The survey of the users demonstrated that they utilise adaptive mechanisms to achieve desired conditions in different parts of the building. The cumulative effect of the adaptive measures taken has resulted in a good level of comfort and satisfaction in the building. The results confirmed that if people can adjust the conditions of their environment through adaptive measures, this will enhance their sensation of comfort.
The results of this research support that a sustainable workplace and natural environments enhance their users’ perception of satisfaction and acceptance of discomfort. This suggests that measurements of user satisfaction must be considered beyond physiological comfort inside the building and include enhancements of wellbeing and purpose in the occupants working role. Identifying surveying methods to continually monitor occupant satisfaction in workplaces may be beneficial for improving the performance of buildings, it is also important for employers in monitoring the wellbeing of their workforce to maximise productivity and staff retention. This research has not been able to survey the satisfaction that the workers have in their working role or their general physical and mental wellbeing, however it is evident that this has some influence on their perception of comfort and acceptance of discomfort and therefore it must be a high priority for further research to improve the methodology of user satisfaction evaluation.
Acknowledgments
The work described in this paper relies on a research which initially started in 2005 through a two year Knowledge Transfer Programme (KTP) research project (2005–2007) funded by the UK Government. The blueprint of the design of the building was generated as one of the outcomes of the KTP project. Behzad Sodagar of the paper was the Knowledge Base Supervisor for the KTP. The design was further developed through involvement of Rosi Fieldson on a pro bono basis. The authors were involved in some elements of the building process. They were not however involved in the operation and maintenance of the building, which has been managed since its completion (2010) by the occupants.
Author Contributions
The POE survey was jointly designed and conducted by the authors. The paper was jointly written and proof-read by the authors.
Conflicts of Interest
The authors declare no conflict of interest.
References
- Auliciems, A.; Szokolay, S. Thermal Comfort, 2nd ed.; PLEA: Brisbane, Australia, 2007. [Google Scholar]
- Wagner, A.; Gossauer, E.; Moosman, C.; Gropp, T.; Leonhart, R. Thermal comfort and workplace occupant satisfaction—Results of field studies in German low energy office buildings. Energy Build. 2007, 39, 758–769. [Google Scholar] [CrossRef]
- Bordass, W.; Leaman, A. Future buildings and their services. Build. Res. Inf. 1997, 25, 190–195. [Google Scholar] [CrossRef]
- Sodagar, B.; Starkey, D. The monitored performance of four social houses certified to the Code for Sustainable Homes Level 5. Energy Build. 2016, 110, 245–256. [Google Scholar] [CrossRef] [Green Version]
- Nicole, J.F.; Humphreys, M.A. Adaptive thermal comfort and sustainable thermal standards for buildings. Energy Build. 2002, 34, 563–572. [Google Scholar] [CrossRef]
- Nicol, F.; Humphreys, M.; Roaf, S. Adaptive Thermal Comfort—Principles and Practice; Routledge: Abingdon, UK, 2012. [Google Scholar]
- Nicol, F.; Roaf, S. Post-occupancy evaluation and field studies of thermal comfort. Build. Res. Inf. 2005, 33, 338–346. [Google Scholar] [CrossRef]
- ANSI/ASHRAE 55:2010—ANSI/ASHRAE Thermal Environment Conditions for Human Occupancy; ASHRAE: Atlanta, GA, USA, 2010.
- Humphreys, M.; Nicole, F.; Roaf, S. Adaptive Thermal Comfort—Foundation and Analysis; Routledge: Abingdon, UK, 2016. [Google Scholar]
- Fanger, P.O. Thermal Comfort, Analysis and Application in Environmental Engineering; McGraw-Hill Book Company: New York, NY, USA, 1970. [Google Scholar]
- Gagge, A.P.; Fobelets, A.P.; Berglund, L.G. A standard predictive index of human response to the thermal environment. ASHRAE Trans. 1986, 92, 709–731. [Google Scholar]
- Haigh, D. User response in environmental control. In The Architecture of Energy; Hawkes, D., Owers, J., Eds.; Construction Press: Harlow, UK, 1981; pp. 45–63. [Google Scholar]
- Chartered Institution of Building Services Engineers (CIBSE). Mixed Mode Ventilation Systems (CIBSE Application Manual); CIBSE: London, UK, 2000. [Google Scholar]
- De Dear, R.J.; Brager, G.S. Thermal comfort in naturally ventilated buildings: Revision to ASHRAE Standard 55. Energy Build. 2002, 34, 549–561. [Google Scholar] [CrossRef]
- Sodagar, B.; Fieldson, R.; Gilroy Scott, B. Design for sustainable architecture and environments. Int. J. Environ. Cult. Econom. Soc. Sustain. 2008, 4, 73–84. [Google Scholar] [CrossRef]
- Nicole, J.F. Adaptive comfort. Build. Res. Inf. 2011, 39, 105–107. [Google Scholar] [CrossRef]
- Cole, R.J.; Robinson, J.; Brown, Z.; O’Shea, M. Re-contextualizing the notion of comfort. Build. Res. Inf. 2008, 36, 323–336. [Google Scholar] [CrossRef]
- Cooper, G. Air Conditioning America: Engineering and the Controlled Environment, 1900–1960; Johns Hopkins University Press: Baltimore, MD, USA, 1998. [Google Scholar]
- Crowley, J. The Invention of Comfort: Sensibilities and Design in Early Modern Britain and Early America; Johns Hopkins University Press: Baltimore, MD, USA, 2001. [Google Scholar]
- Ackerman, M.E. Cool Comfort: America’s Romance with Air Conditioning; Smithsonian Institution Press: Washington, DC, USA, 2002. [Google Scholar]
- Leaman, A.; Bordass, B. Are users more tolerant of ‘green’ buildings? Build. Res. Inf. 2007, 35, 662–673. [Google Scholar] [CrossRef]
- Brown, Z.; Cole, R.J. Influence of occupants’ knowledge on comfort expectations and behaviour. Build. Res. Inf. 2009, 37, 227–245. [Google Scholar] [CrossRef]
- Armitage, L.; Murugan, A. The human green office experience: Happy and healthy or sick and frustrated? Aust. N. Z. Prop. J. 2013, 4, 35–41. [Google Scholar]
- Leaman, A.J.; Bordass, W.T. Productivity in buildings: The “Killer” variables. In Proceedings of the Workplace Comfort Forum, London, UK, 29–30 October 1997. [Google Scholar]
- Humphreys, M.A.; Nicol, J.F. Outdoor temperature and indoor thermal comfort: Raising the precision of the relationship for the 1998 ASHRAE database of field studies. ASHRAE Trans. 2000, 106, 485–492. [Google Scholar]
- Abbaszadeh, S.; Zagreus, L.; Lehrer, D.; Huizenga, C. Occupant satisfaction with indoor environmental quality in green buildings. In Proceedings of the Healthy Buildings 2006, Lisbon, Portugal, 4–8 June 2006; Volume III, pp. 365–370. [Google Scholar]
- Heschong, L. Thermal Delight in Architecture; MIT Press: Cambridge, MA, USA, 1979. [Google Scholar]
Figure 1.
Site analysis and massing of the building on the site.

Figure 2.
Ground floor plan of the building.

Figure 3.
First floor plan of the building.

Figure 4.
Images of completed building: (a) east-facing elevation; (b) south-facing elevation.

Figure 5.
Building’s all variable distribution for different rating scales.

Figure 6.
Interior image of the open plan office.

Figure 7.
Number of votes (frequency) on the temperature variable cast by office workers spending different time in their workplace thoughout the year.
Figure 7.
Number of votes (frequency) on the temperature variable cast by office workers spending different time in their workplace thoughout the year.

Figure 8.
Scores on the temperature variable for different occupancy rates in the offices. Vertical lines show maximum and minimum scores with squares depicting the mean of scores for each occupancy rate.
Figure 8.
Scores on the temperature variable for different occupancy rates in the offices. Vertical lines show maximum and minimum scores with squares depicting the mean of scores for each occupancy rate.

Figure 9.
Number of votes (frequency) on temperature variable in the offices in different seasons.

Figure 10.
Scores on the temperature variable in the offices in different seasons. Vertical lines show the maximum and minimum scores with squares depicting the mean of scores for each season.
Figure 10.
Scores on the temperature variable in the offices in different seasons. Vertical lines show the maximum and minimum scores with squares depicting the mean of scores for each season.

Figure 11.
Interior image of the canteen.
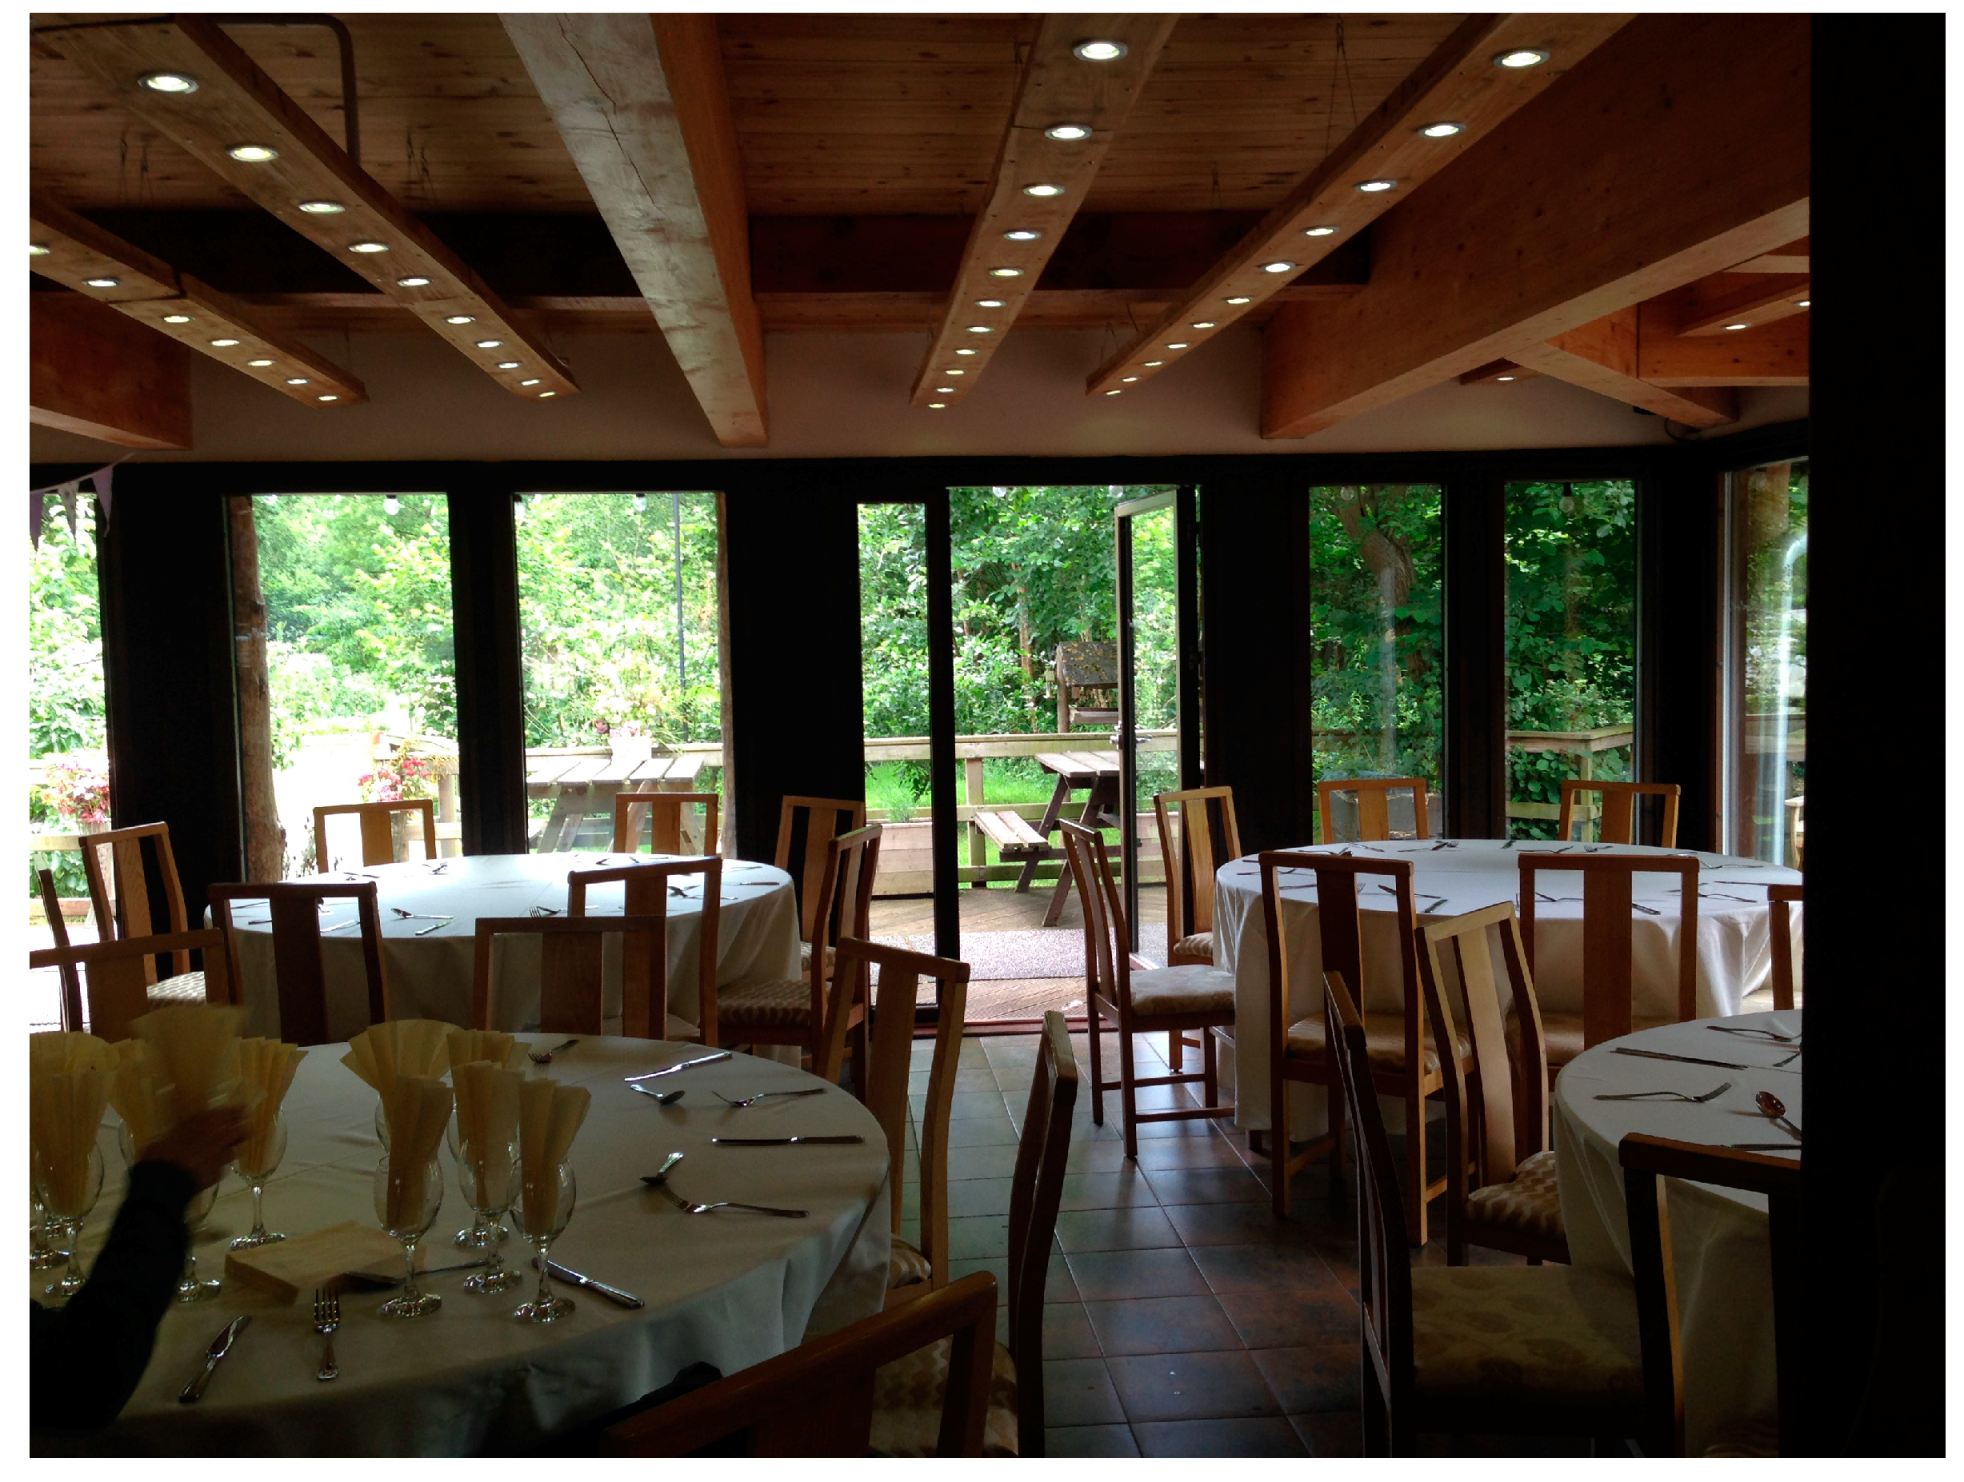
Figure 12.
Number of votes (frequency) on the temperature variable for users spending different times in the canteen throughout the year.
Figure 12.
Number of votes (frequency) on the temperature variable for users spending different times in the canteen throughout the year.

Figure 13.
Number of votes (frequency) on the temperature variable in the rammed earth hall in different seasons.
Figure 13.
Number of votes (frequency) on the temperature variable in the rammed earth hall in different seasons.
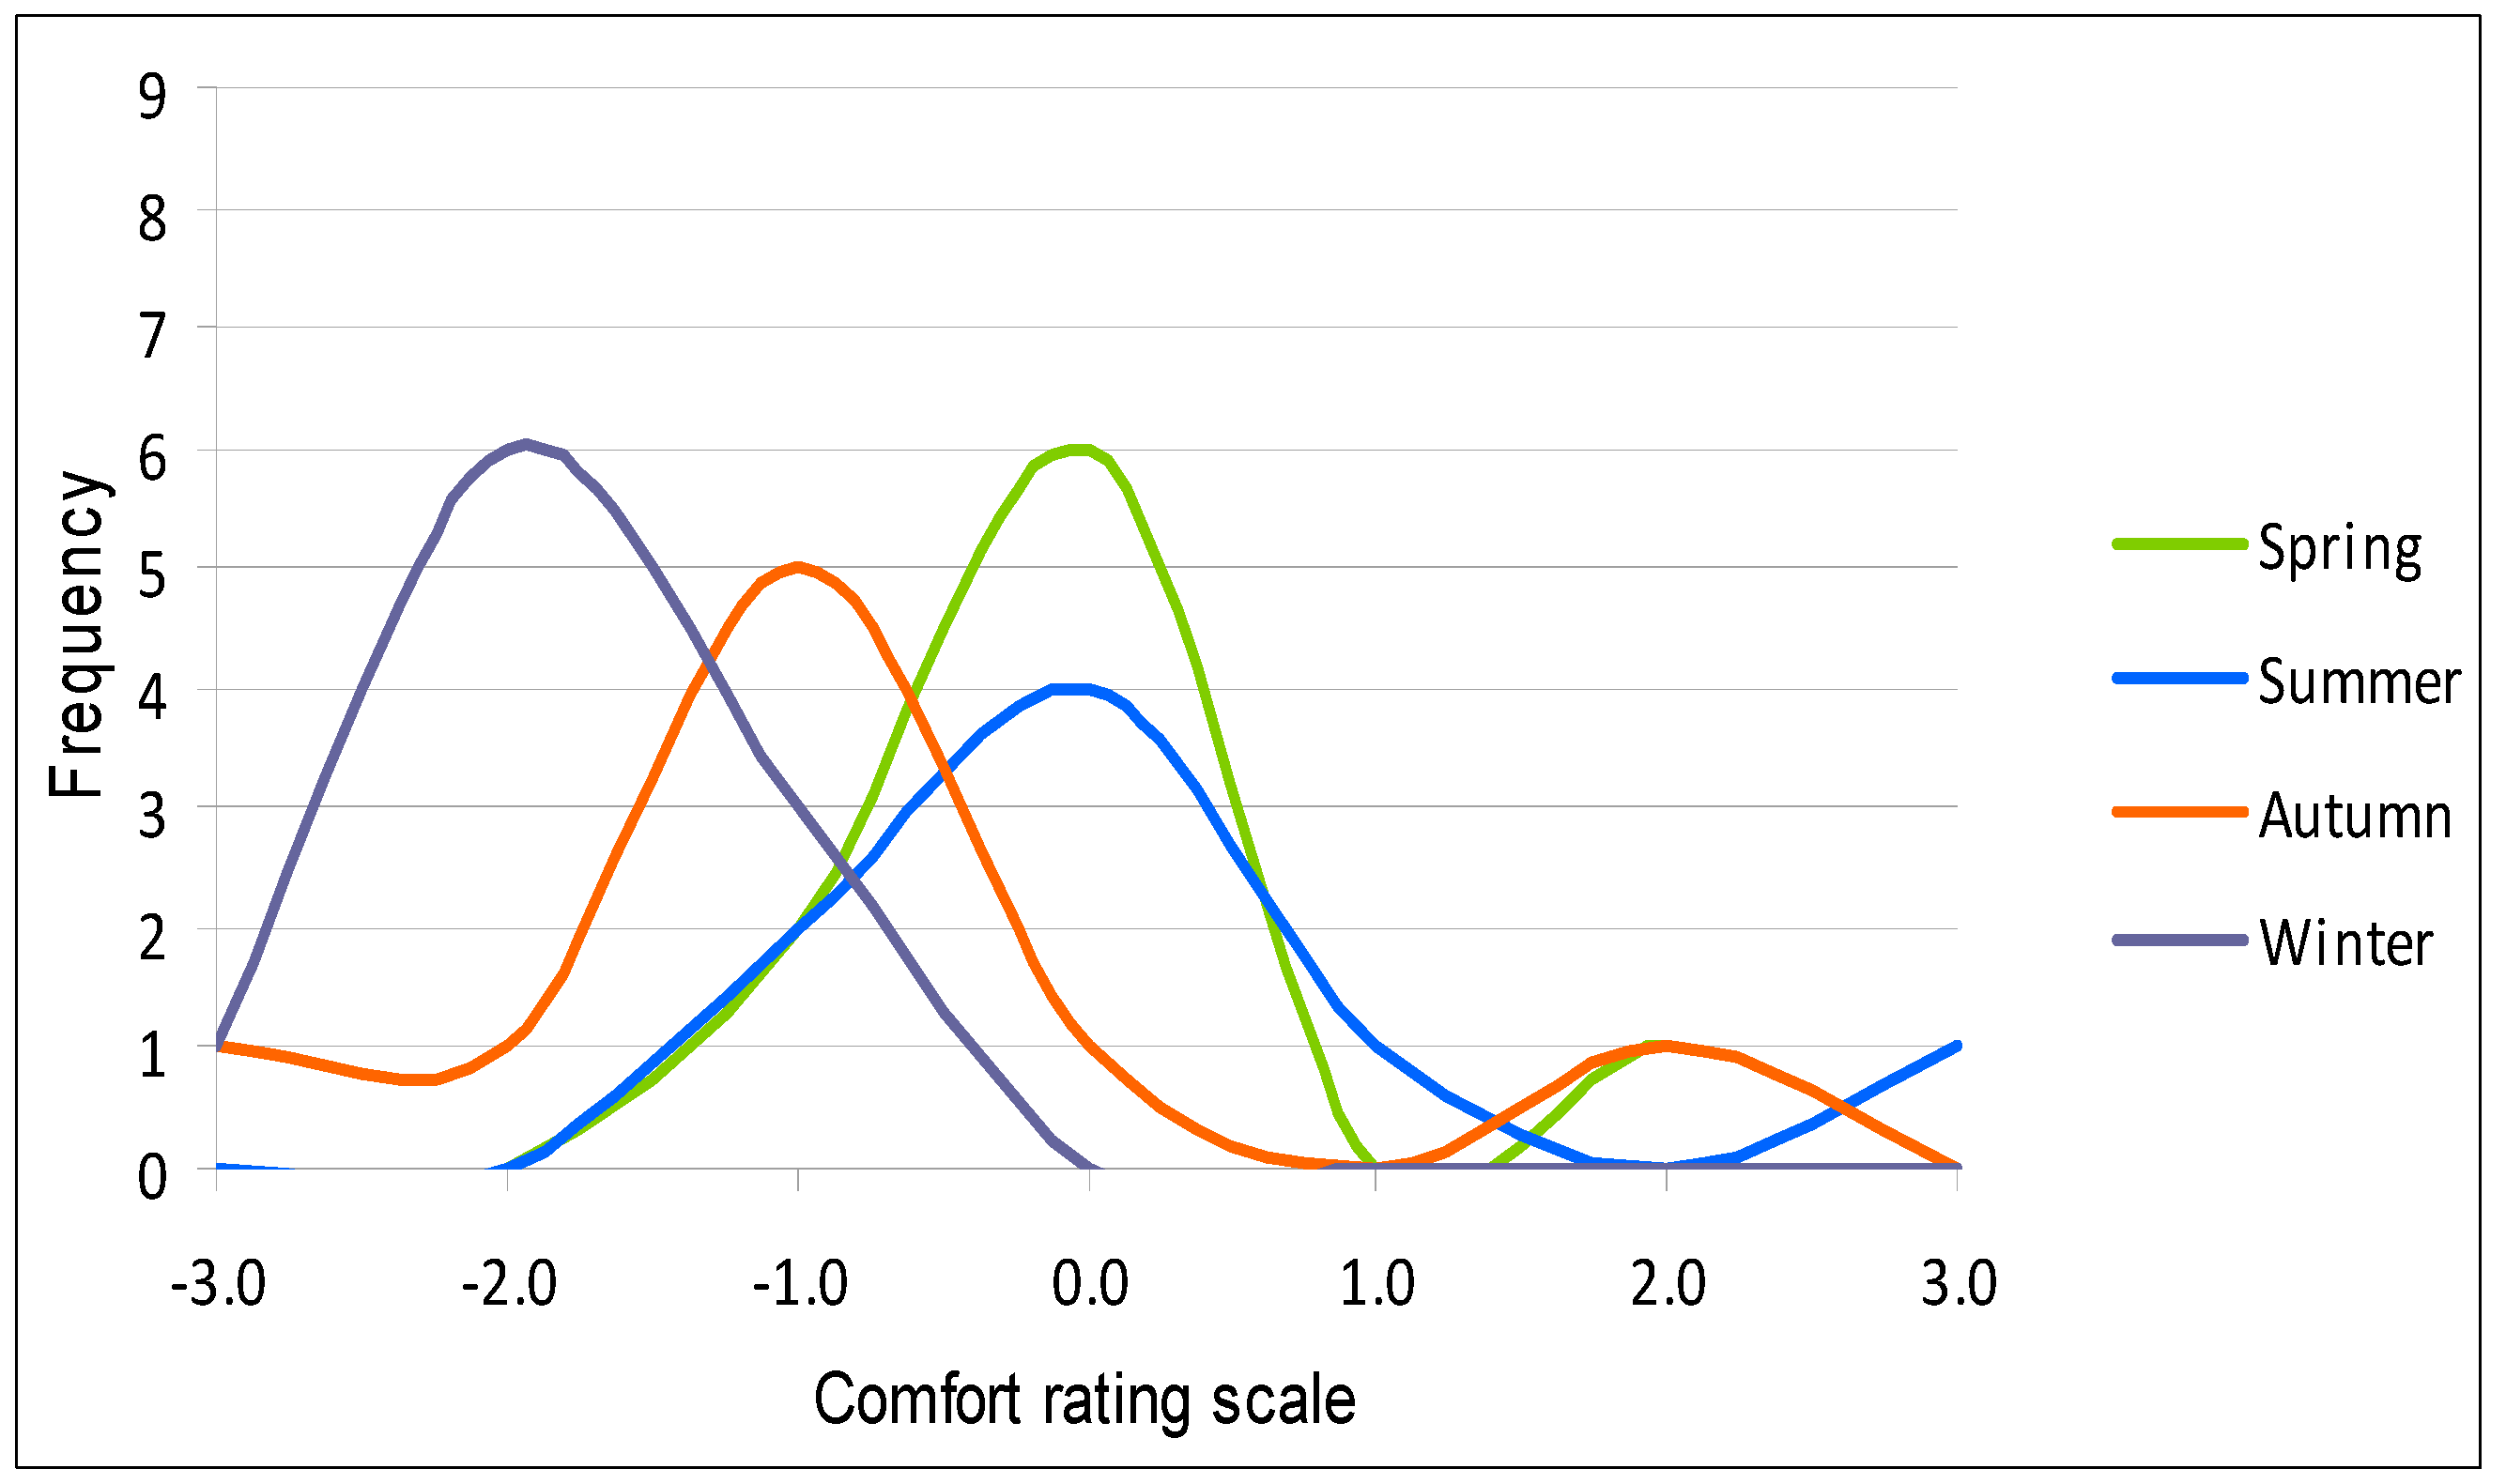
Figure 14.
Scores on the temperature variable in the rammed earth hall in different seasons. Vertical lines show the maximum and minimum scores with squares depicting the mean of scores for each season.
Figure 14.
Scores on the temperature variable in the rammed earth hall in different seasons. Vertical lines show the maximum and minimum scores with squares depicting the mean of scores for each season.
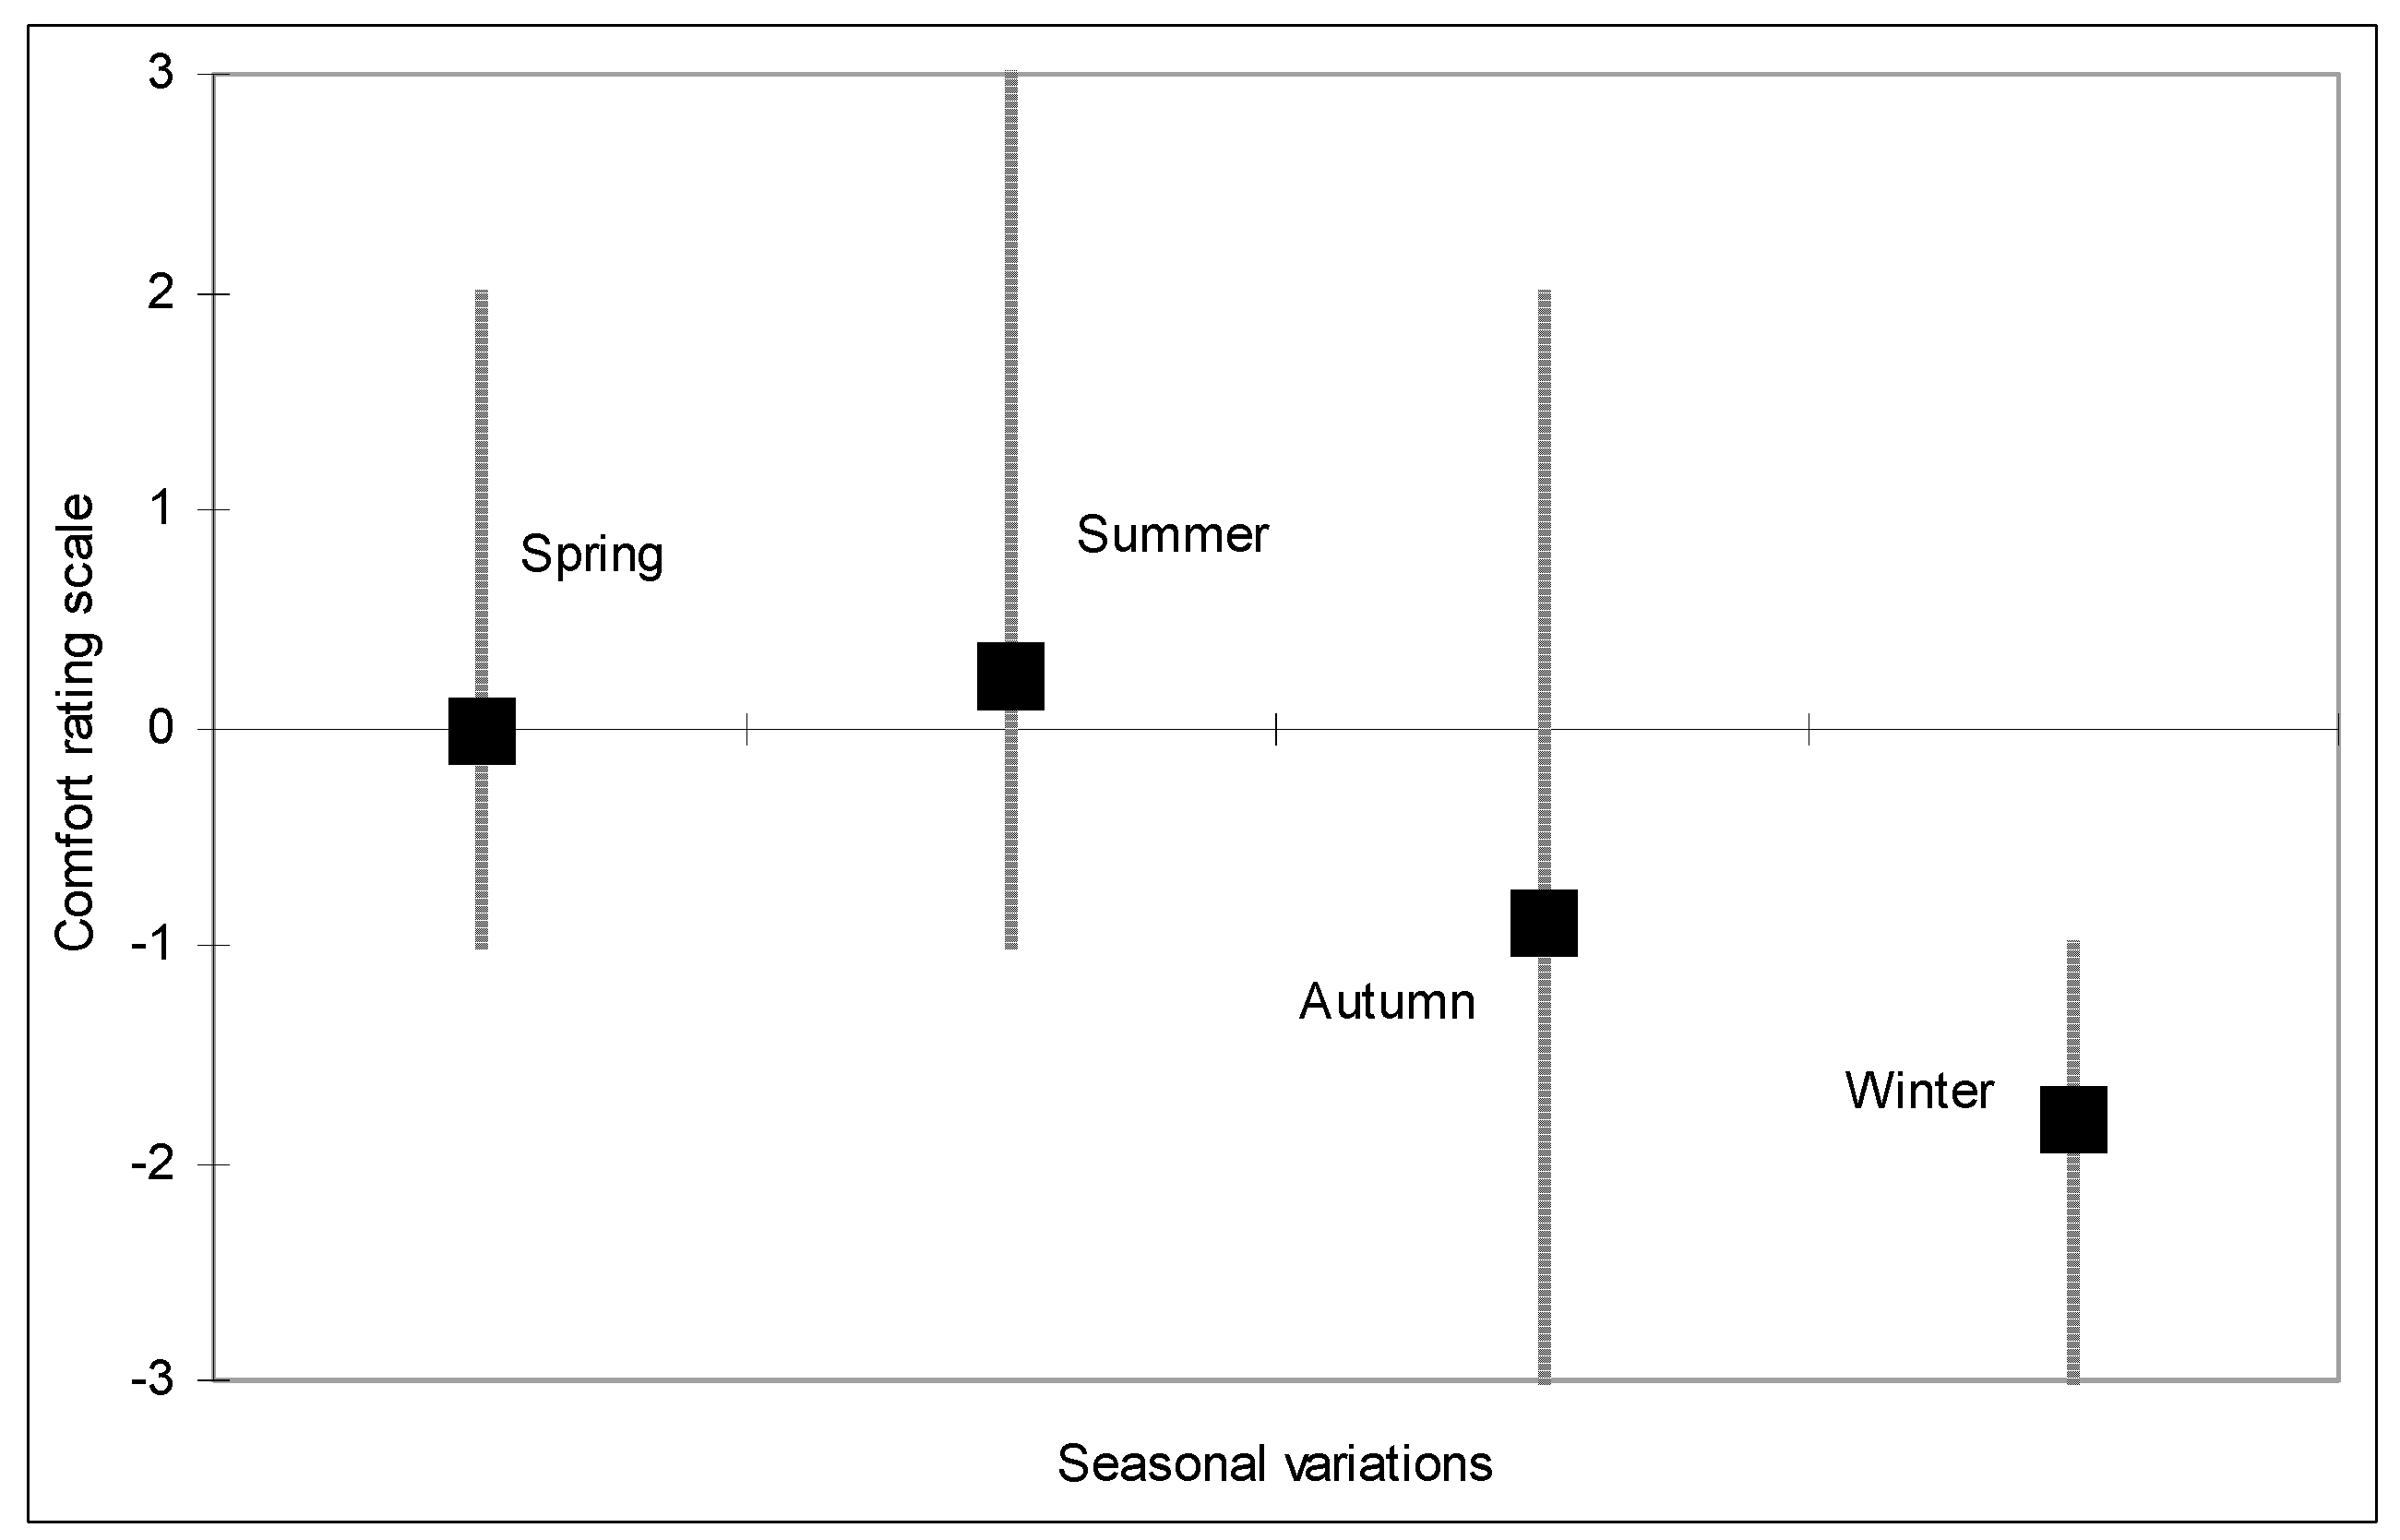
Figure 15.
Number of votes (frequency) on the daylight variable in the offices in different seasons.
Figure 15.
Number of votes (frequency) on the daylight variable in the offices in different seasons.

Figure 16.
Roof light in the reciprocal roof of the hall.

Figure 17.
Number of votes (frequency) on the daylight variable in the hall in different seasons.

Figure 18.
Scores on the principal comfort variables for the whole building. Vertical lines show the maximum and minimum scores with squares depicting the mean of scores for each season.
Figure 18.
Scores on the principal comfort variables for the whole building. Vertical lines show the maximum and minimum scores with squares depicting the mean of scores for each season.

Table 1.
Comfort variables used in the survey using the seven-point scale.
| Variables | Rating Scale | ||||||||
|---|---|---|---|---|---|---|---|---|---|
| Air temperature * | −3 = Too cold | −3 | −2 | −1 | 0 | 1 | 2 | 3 | 3 = Too hot |
| Humidity * | −3 = Too dry | −3 | −2 | −1 | 0 | 1 | 2 | 3 | 3 = Too sticky |
| Air movement (ventilation) * | −3 Too draughty | −3 | −2 | −1 | 0 | 1 | 2 | 3 | 3 = Too stuffy |
| Air quality * | −3 = Stuffy | −3 | −2 | −1 | 0 | 1 | 2 | 3 | 3 = Stale |
| Daylight * | −3 = Too dull | −3 | −2 | −1 | 0 | 1 | 2 | 3 | 3 = Too bright |
| Artificial lighting * | −3 = Too dull | −3 | −2 | −1 | 0 | 1 | 2 | 3 | 3 = Too bright |
| Noise overall ** | −3 = Not audible | −3 | −2 | −1 | 0 | 1 | 2 | 3 | 3 = Too noisy |
* Votes were cast for different seasons (spring, summer, autumn and summer) for different parts of the buildings (offices, canteen and rammed hall); ** Noise votes were cast for different parts of the buildings (offices, canteen and rammed hall) without seasonal variations.
Table 2.
Number of votes (frequency) cast for different rating scales.
| Rating Scale | Frequency |
|---|---|
| −3 | 23 |
| −2 | 39 |
| −1 | 78 |
| 0 | 472 |
| 1 | 43 |
| 2 | 20 |
| 3 | 25 |
| Total = 700 |
Table 3.
Percentile scores and score means for selected variables in the offices.
| Study Variables | <0 (%) | 0 (%) | >0 (%) | Mean | Comments |
|---|---|---|---|---|---|
| Temperature in winter: cold/hot | 78 | 11 | 11 | −1.33 | Scale: −3 = too cold; 3 too hot For example, in winter 78% of users scored less than 0, the scale midpoint (indicating feeling cold). |
| Temperature in summer: cold/hot | 11 | 33 | 56 | 1.11 | Scale: −3 = too cold; 3 too hot For example, in summer 56% scored more than 0 (indicating feeling hot). |
| Air (movement or ventilation) in winter: Draughty/stuffy | 11 | 67 | 22 | 0.22 | Scale: −3 = too draughty; 3 too stuffy For example, in winter 11% of users scored less than 0 (indicating the space feels draughty) |
| Air (movement or ventilation) in summer: draughty/stuffy | 11 | 44.5 | 44.5 | 0.89 | Scale: −3 = too draughty; 3 too stuffy For example, in summer 44.5% scored more than 0 (indicating the space is stuffy). |
| Daylight in winter: dull/bright | 78 | 0 | 22 | −1.67 | Scale: −3 = too dull; 3 too bright For example, in winter 78% scored less than 0 (indicating lack of adequate daylight). |
| Daylight in summer: dull/bright | 44 | 56 | 0 | −0.89 | Scale: −3 = too dull; 3 too bright For example, in summer 56% scored 0 (indicating a good level of daylight). |
Table 4.
Percentile scores and score means for selected variables in the building.
| Study Variables | <0 (%) | 0 (%) | >0 (%) | Mean | Comments |
|---|---|---|---|---|---|
| Temperature in winter: cold/hot | 62 | 28 | 10 | −1 | Scale: −3 = too cold; 3 too hot For example, in winter 62% of users scored less than 0, the scale midpoint (indicating feeling cold). |
| Temperature in summer: cold/hot | 14 | 41 | 45 | 0.86 | Scale: −3 = too cold; 3 too hot For example, in summer 45% scored more than 0, the scale midpoint (indicating feeling hot). |
| Air (movement or ventilation) in winter: Draughty/stuffy | 11 | 82 | 7 | −0.07 | Scale: −3 = too draughty; 3 too stuffy For example, in winter 82% of users scored 0, the scale midpoint (indicating the space feels comfortable) |
| Air (movement or ventilation) in summer: draughty/stuffy | 7 | 67 | 26 | 0.56 | Scale: −3 = too draughty; 3 too stuffy For example, in summer 26% scored more than 0, the scale midpoint (indicating the space is stuffy). |
| Daylight in winter: dull/bright | 37 | 56 | 7 | −0.74 | Scale: −3 = too dull; 3 too bright For example, in winter 37% scored less than 0, the scale midpoint (indicating lack of adequate daylight). |
| Daylight in summer: dull/bright | 19 | 74 | 7 | −0.30 | Scale: −3 = too dull; 3 too bright For example, in summer 74% scored 0, the scale midpoint (indicating good level of daylight). |
| Noise overall | 0 | 81 | 19 | 0.23 | Scale: −3 = not audible; 3 too noisy For example, 81% scored 0, the scale midpoint (indicating good aural environment). |
© 2017 by the authors. Licensee MDPI, Basel, Switzerland. This article is an open access article distributed under the terms and conditions of the Creative Commons Attribution (CC BY) license (http://creativecommons.org/licenses/by/4.0/).
Share and Cite
MDPI and ACS Style
Fieldson, R.; Sodagar, B. Understanding User Satisfaction Evaluation in Low Occupancy Sustainable Workplaces. Sustainability 2017, 9, 1720. https://doi.org/10.3390/su9101720
AMA Style
Fieldson R, Sodagar B. Understanding User Satisfaction Evaluation in Low Occupancy Sustainable Workplaces. Sustainability. 2017; 9(10):1720. https://doi.org/10.3390/su9101720
Chicago/Turabian StyleFieldson, Rosi, and Behzad Sodagar. 2017. "Understanding User Satisfaction Evaluation in Low Occupancy Sustainable Workplaces" Sustainability 9, no. 10: 1720. https://doi.org/10.3390/su9101720
Note that from the first issue of 2016, this journal uses article numbers instead of page numbers. See further details here.