Research on the Sustainable Development of an Economic-Energy-Environment (3E) System Based on System Dynamics (SD): A Case Study of the Beijing-Tianjin-Hebei Region in China

Abstract
:1. Introduction
2. Methodology
2.1. Causal Loop Diagrams (CLD) Analysis
- (1)
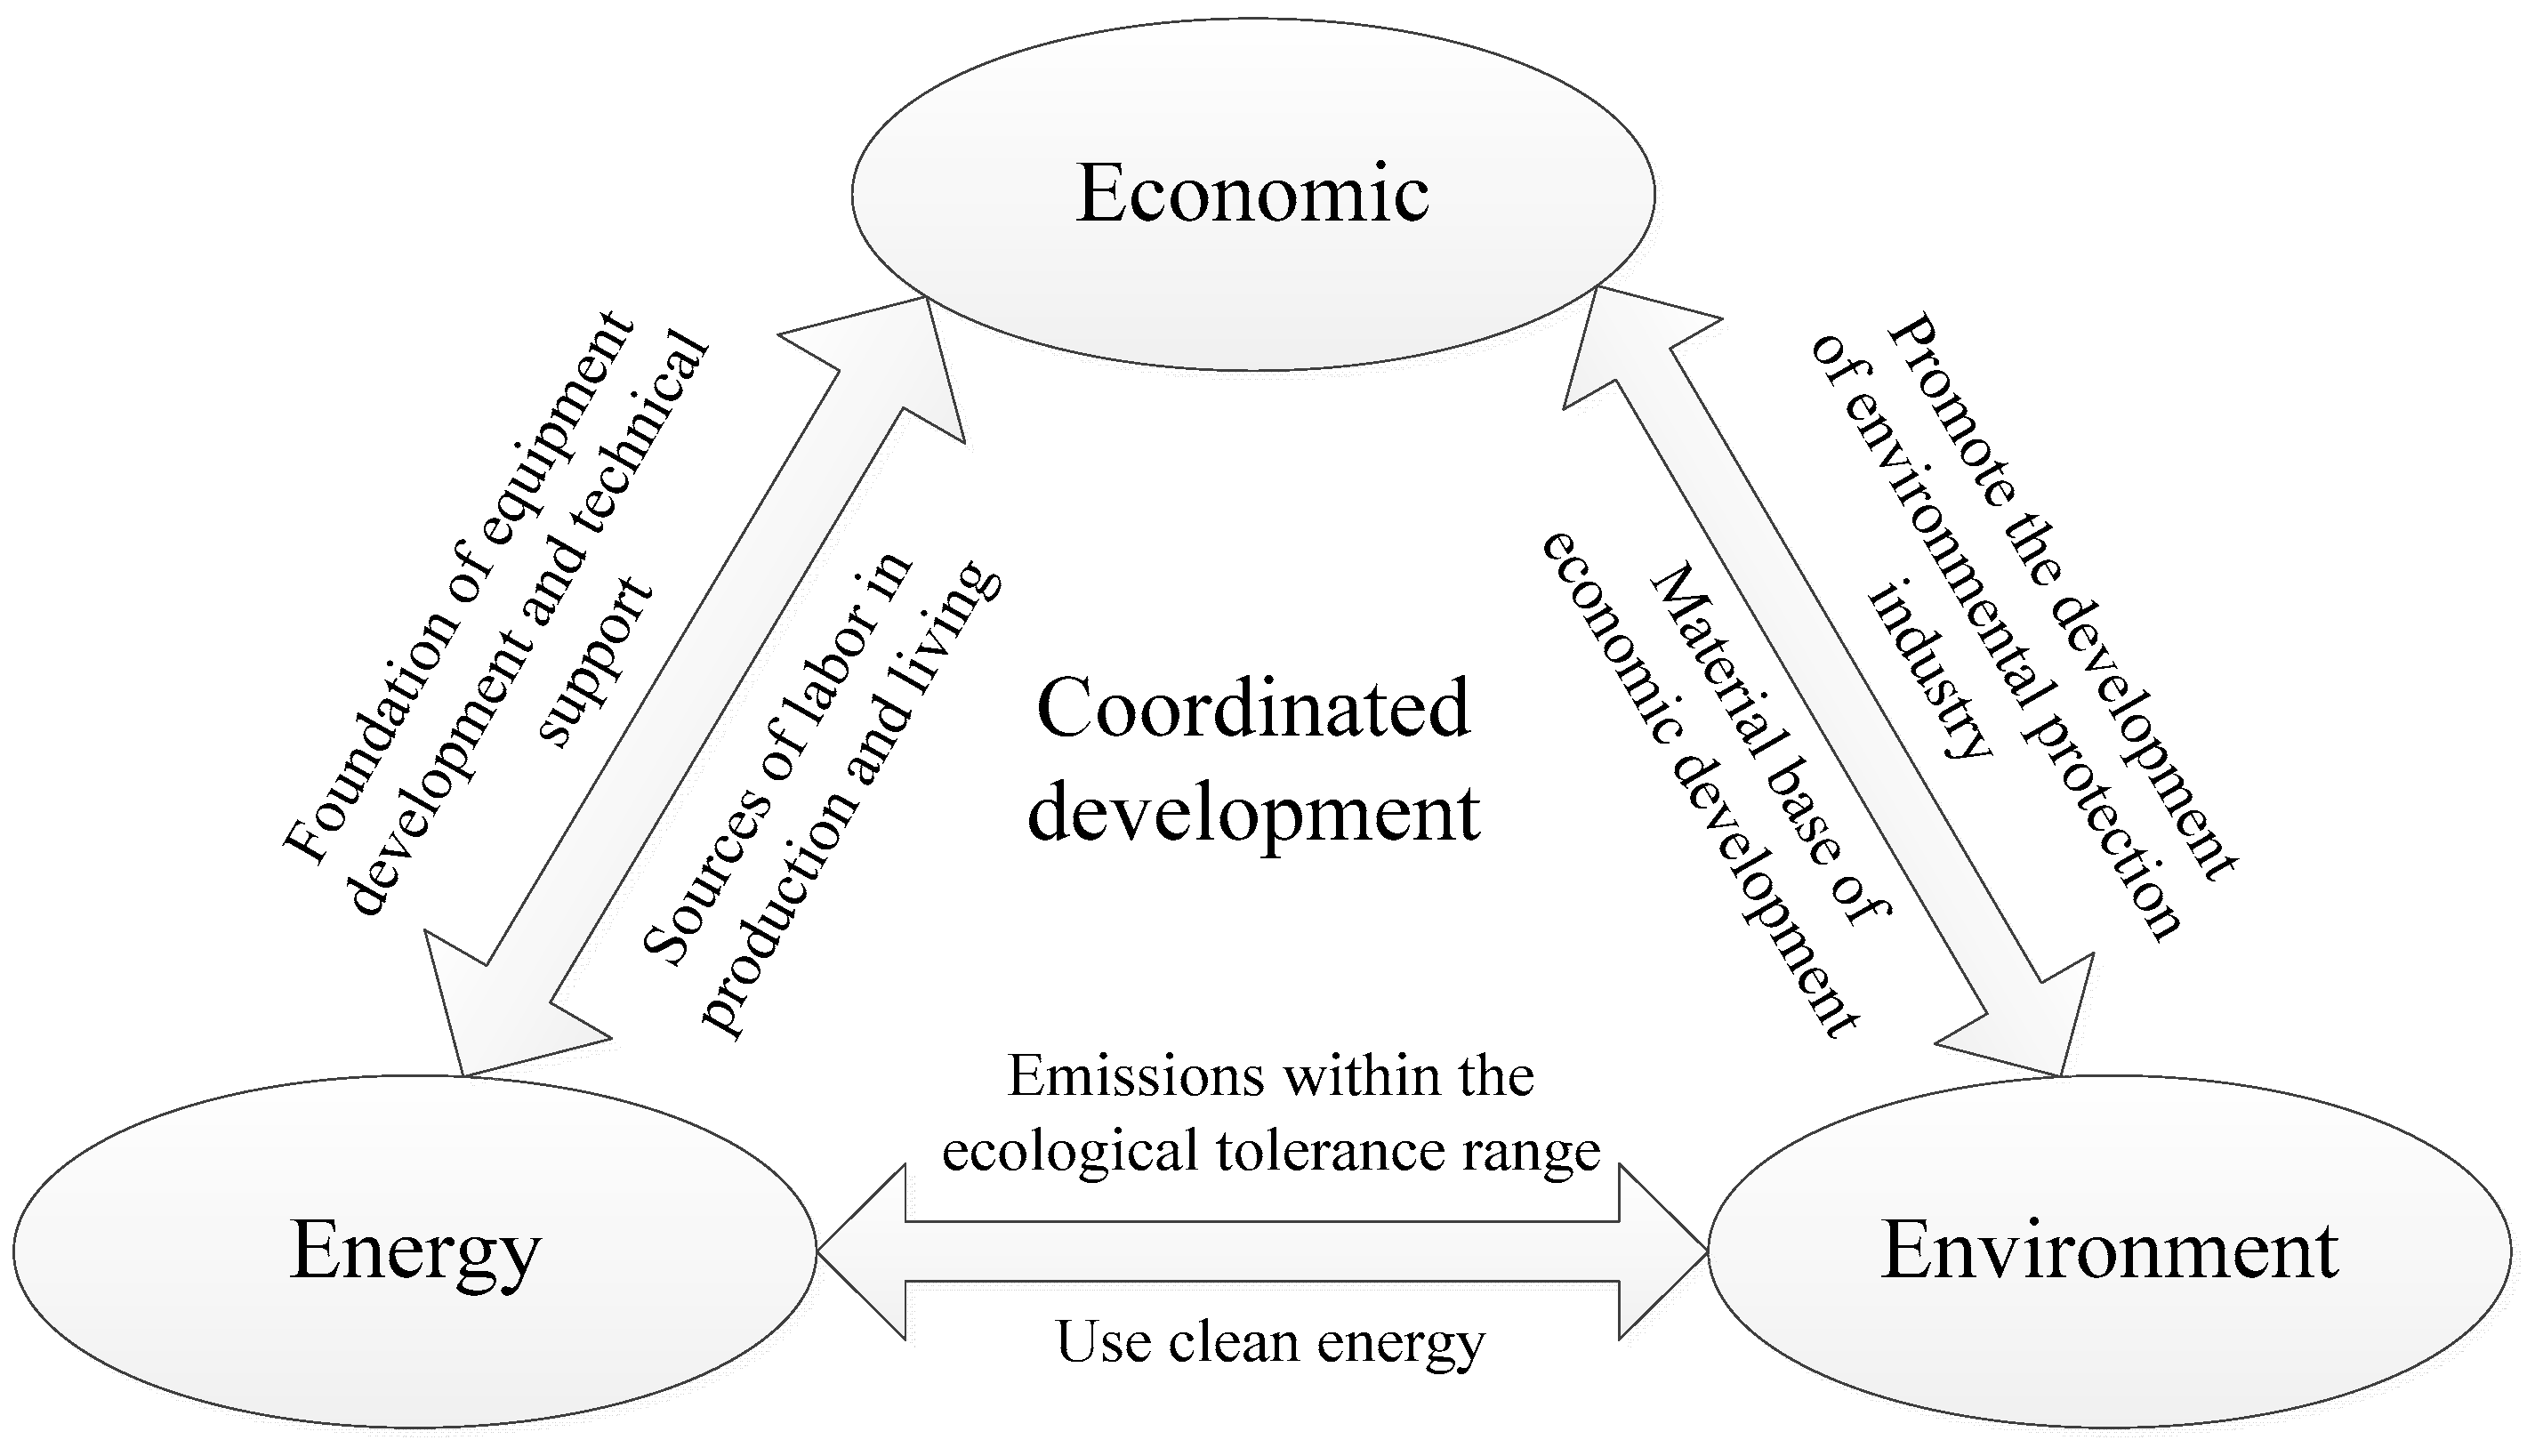
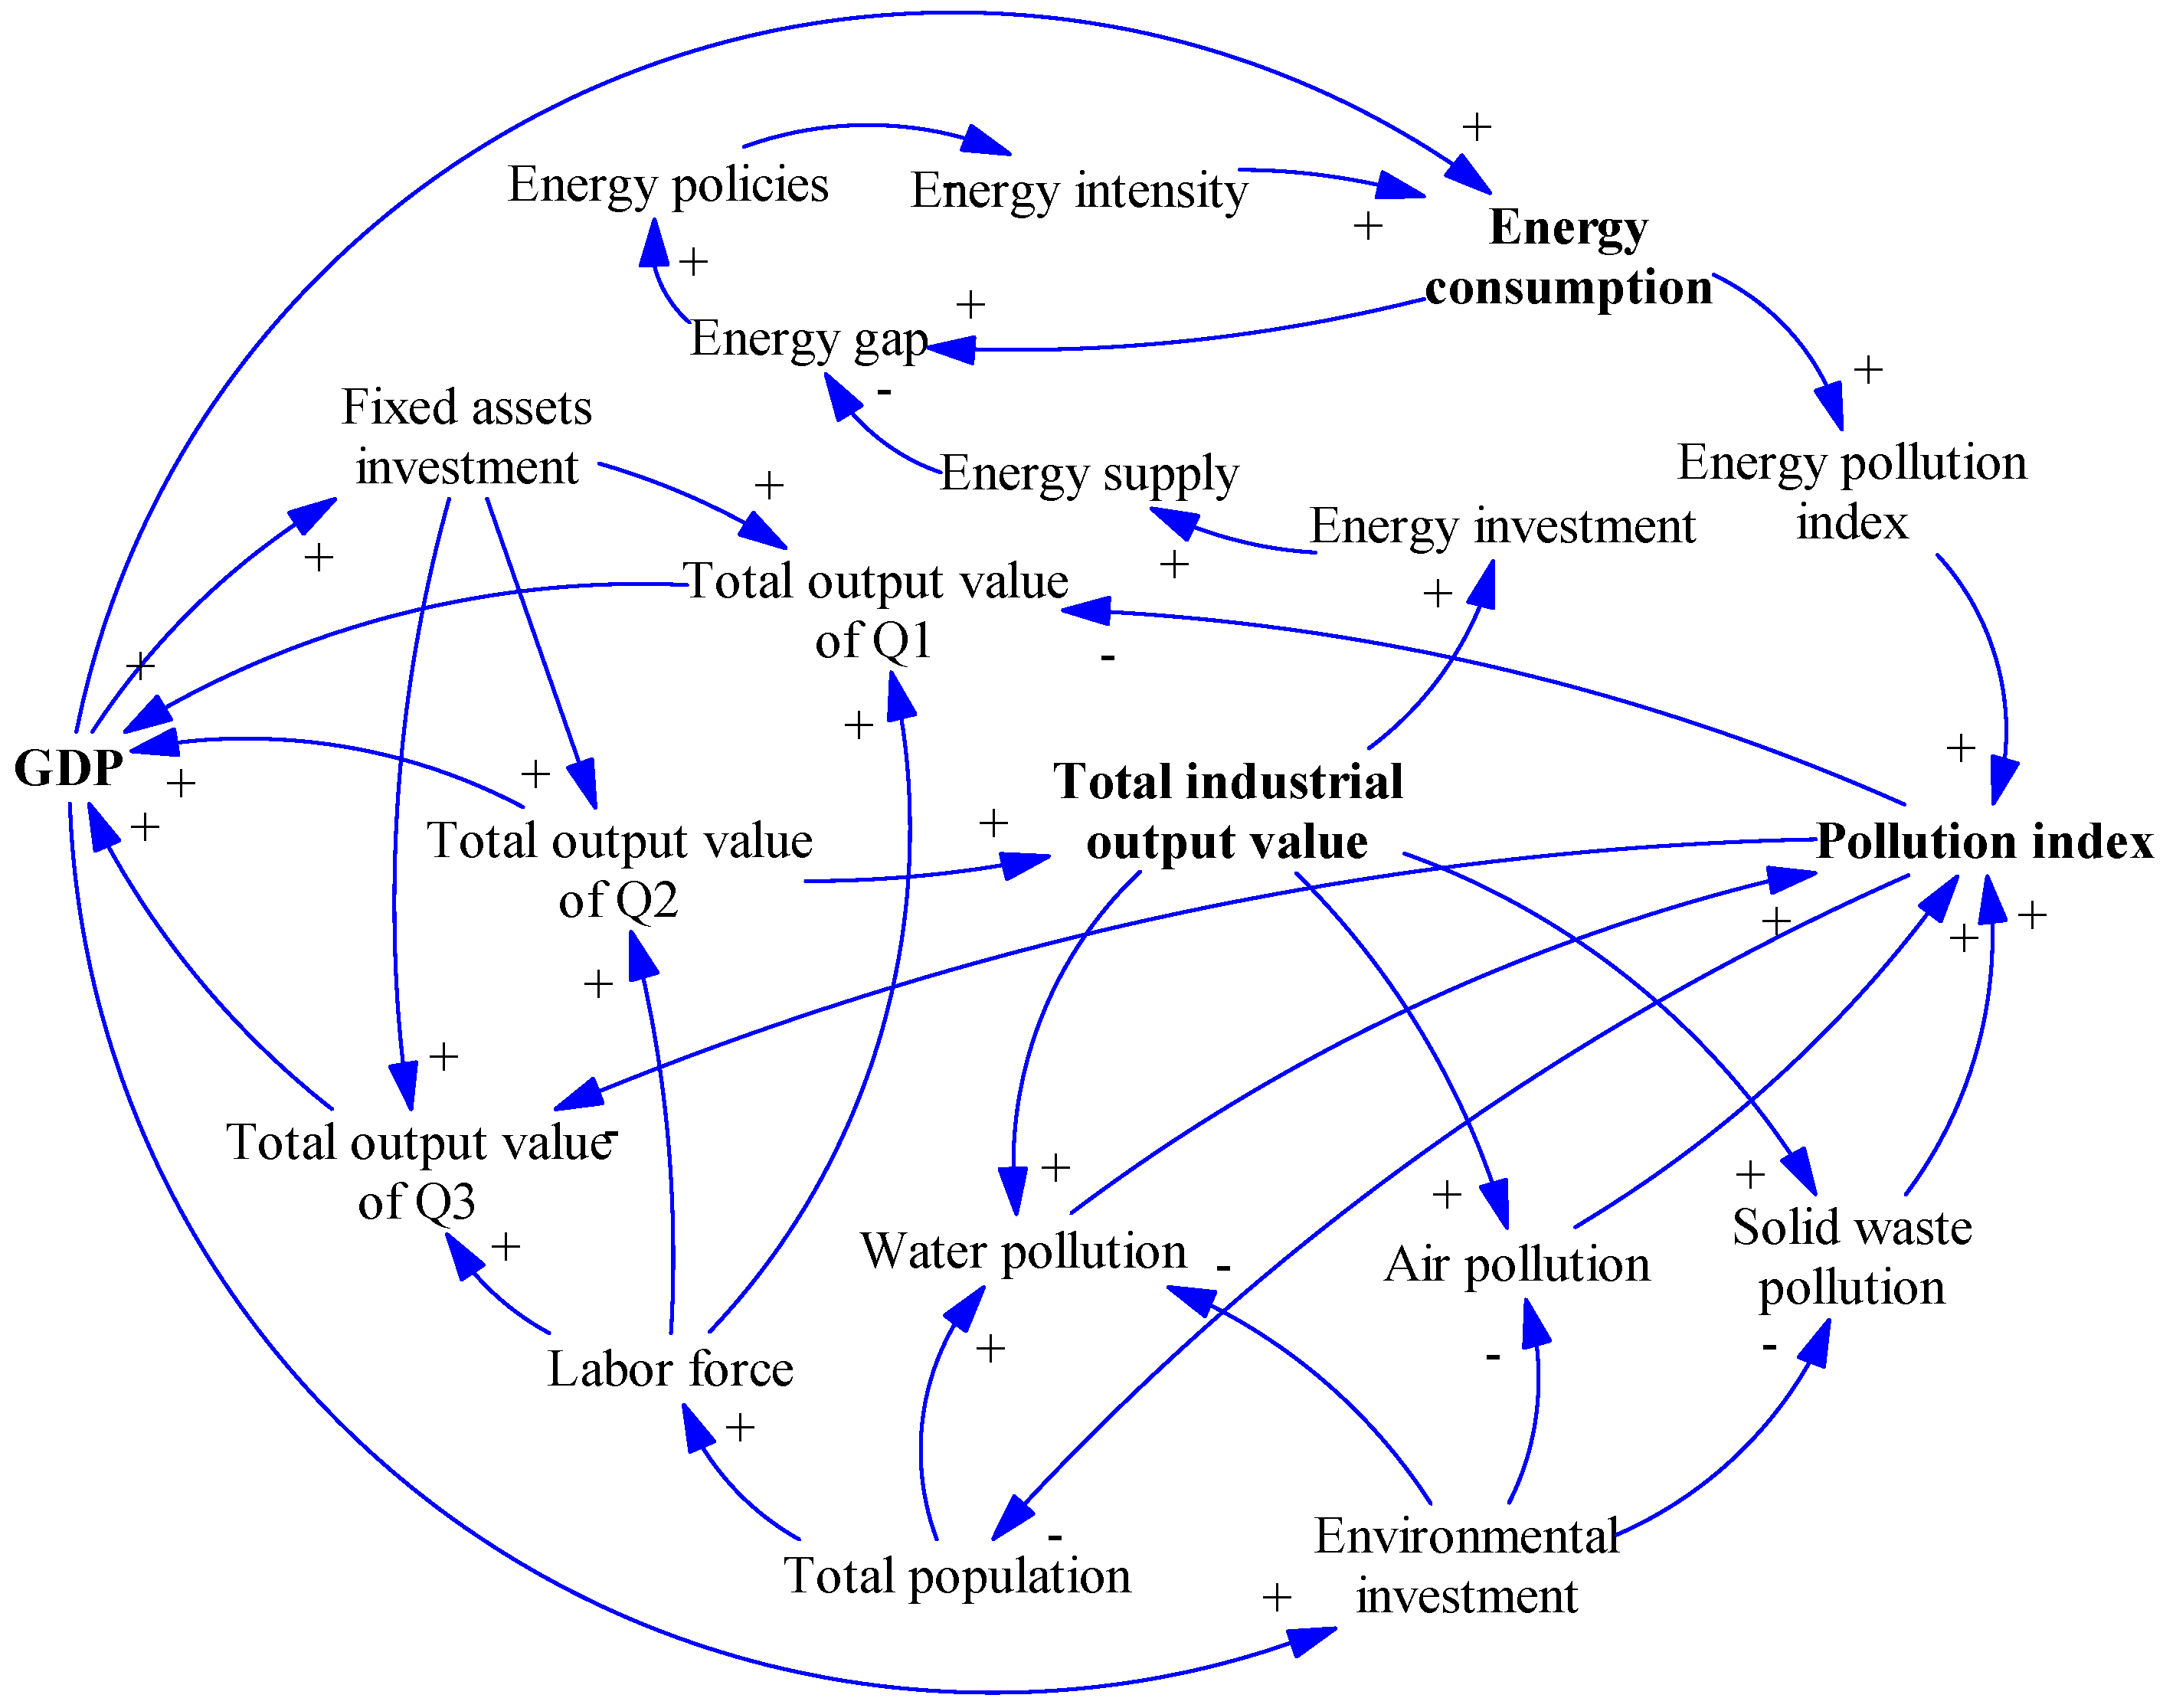
- As the largest developing country, China uses secondary industry, that is, industrial development, as the core to attract input and output and promote the development of other industries, thereby stimulating economic development. At the same time, industrial production will lead to energy consumption and high pollution. Thus, this study argues that the subsystems of the 3E system are linked by industrial output values.
- (2)
- Many factors can reflect the economic development of a country from different angles, and the core variable of them is GDP. GDP is an important indicator to measure the overall economic situation of a country or region. Thus, the core evaluation index of the economic subsystem of this research is set to GDP. The core factor of the energy subsystem in this study is set as the energy consumption. GDP growth will directly enhance the investment in energy, and energy supply and demand will also increase, which will lead to a shortage of energy resources. As the energy gap widens, energy policy will be strengthened to reduce energy intensity, thereby reducing energy demand, and thus bridging the energy gap. The development of industry and the growth of energy consumption further aggravate the pollution of the environment; therefore, we use the pollution index to examine the environmental subsystem.
- (3)
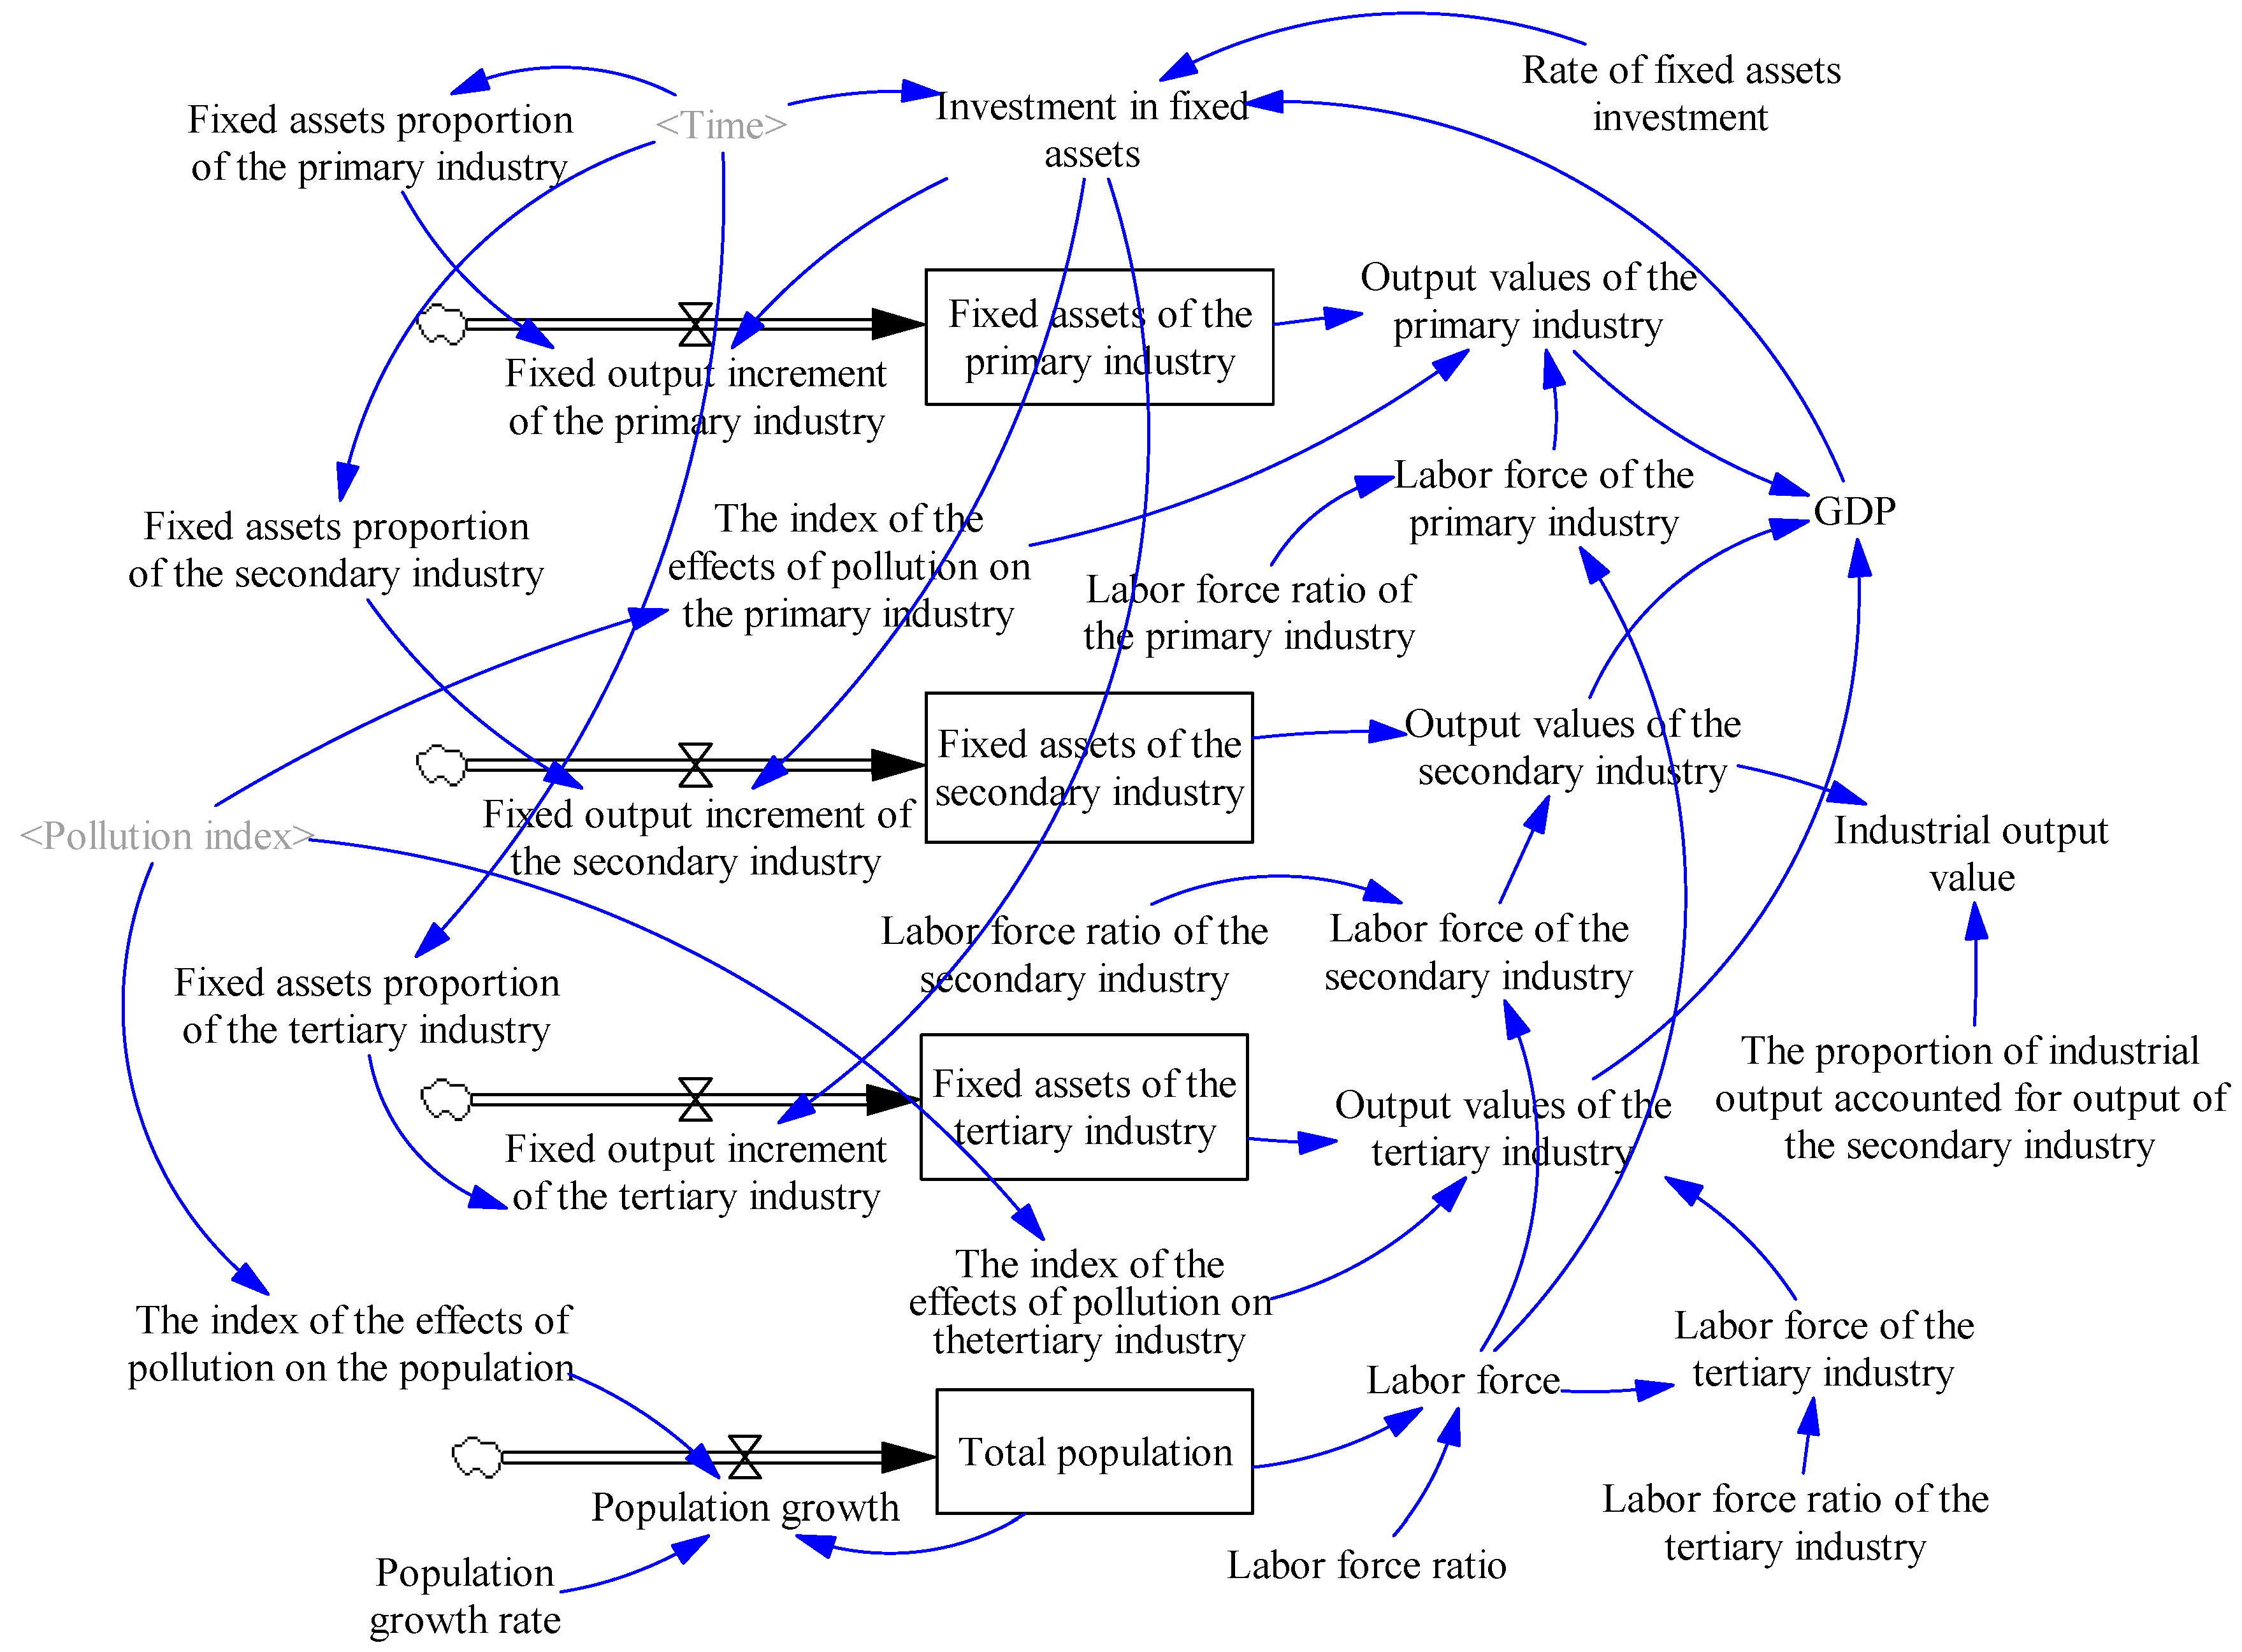
- The feedback path of each subsystem of 3E based on the above two points is as follows. Economic subsystem (According to the division of China’s National Bureau of Statistics, primary industry is agriculture, forestry, fishery and animal husbandry; secondary industry is mining, manufacturing, electric power, the production and supply of gas and water, construction; and the tertiary industry is the service industry.): The total output value of the secondary industry → GDP → fixed assets investment → the total output value of the primary industry (Q1)/the secondary industry (Q2)/the tertiary industry (Q3) → GDP. Energy subsystem: Total industrial output value → energy investment → energy supply → energy gap → energy policies → energy intensity → energy consumption, and GDP → energy consumption. Environment subsystem: Total industrial output value → energy consumption → energy pollution index → pollution index, and total industrial output value → water pollution/air pollution/solid waste pollution → pollution index.
- (4)
- In addition, there is a special cycle, that is GDP → environmental investment → pollution index → total population → the labor force → total output values of Q1/Q2/Q3 → GDP. A change in GDP will affect the environmental investment, thereby affecting the pollution index. The pollution of the environment has a negative impact on people’s health; thus, a change in the pollution index will affect the population, thereby affecting the labor force and total output values of Q1/Q2/Q3, eventually further increasing or decreasing GDP.
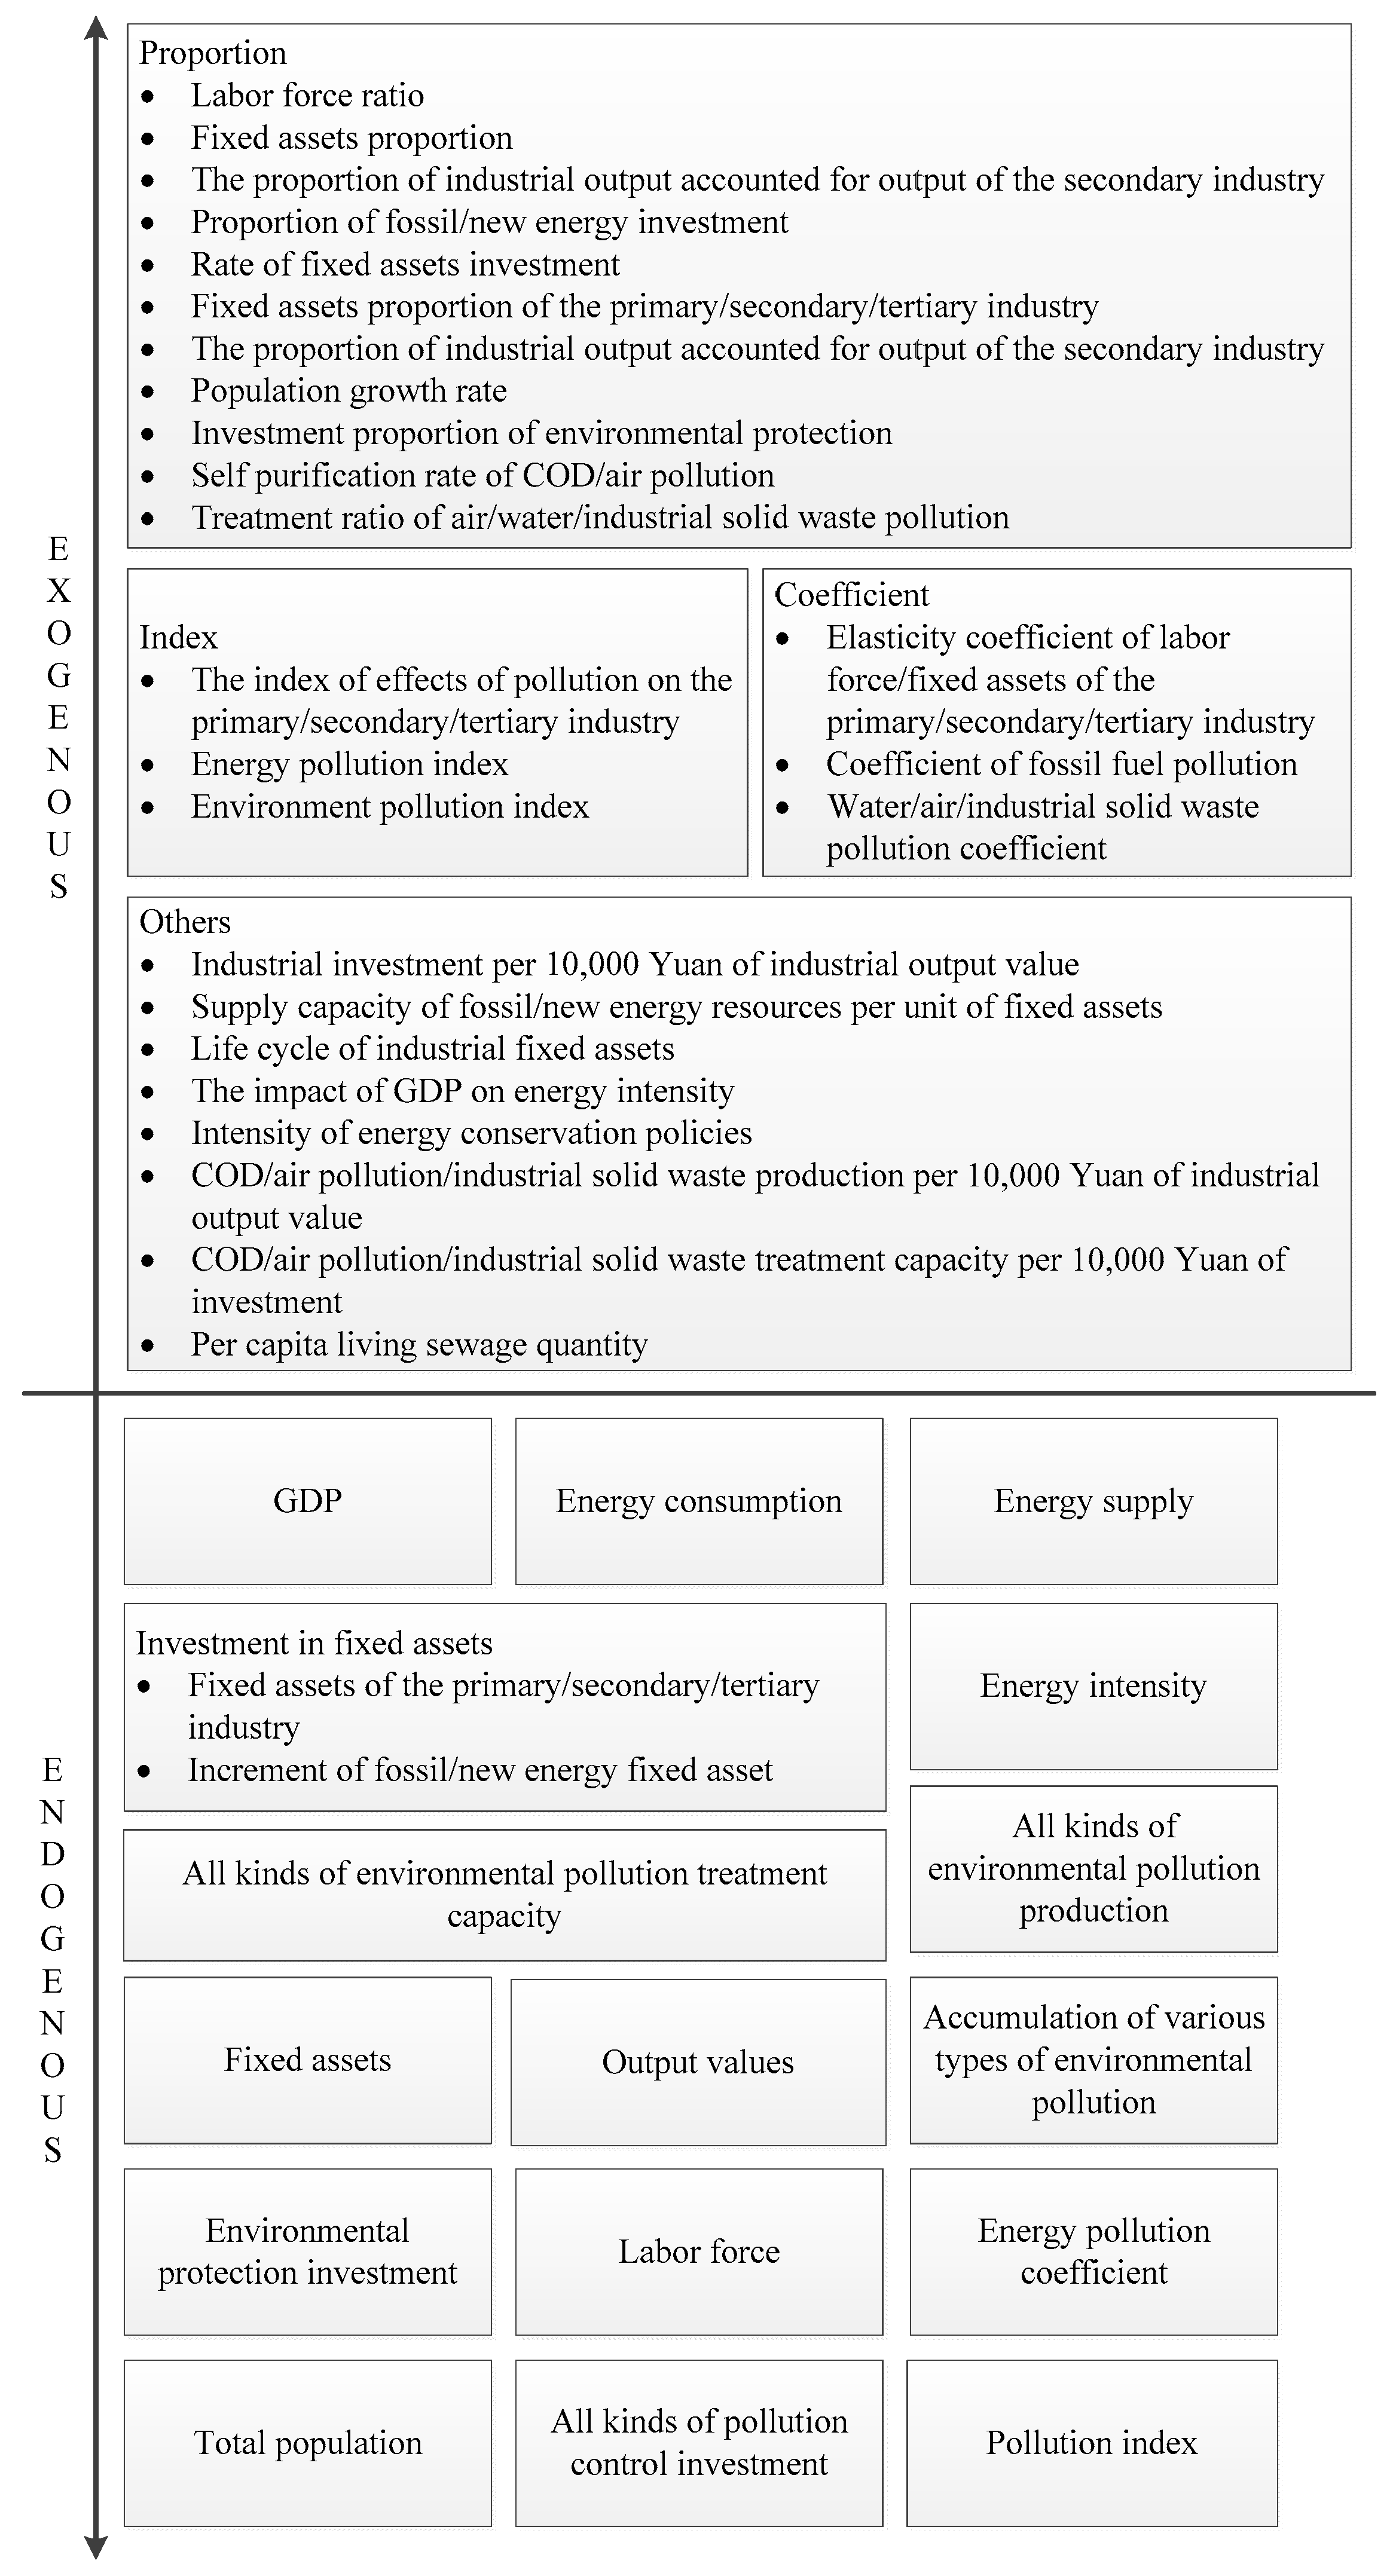
2.2. Model Design
2.2.1. Economic Subsystem
2.2.2. Energy Subsystem
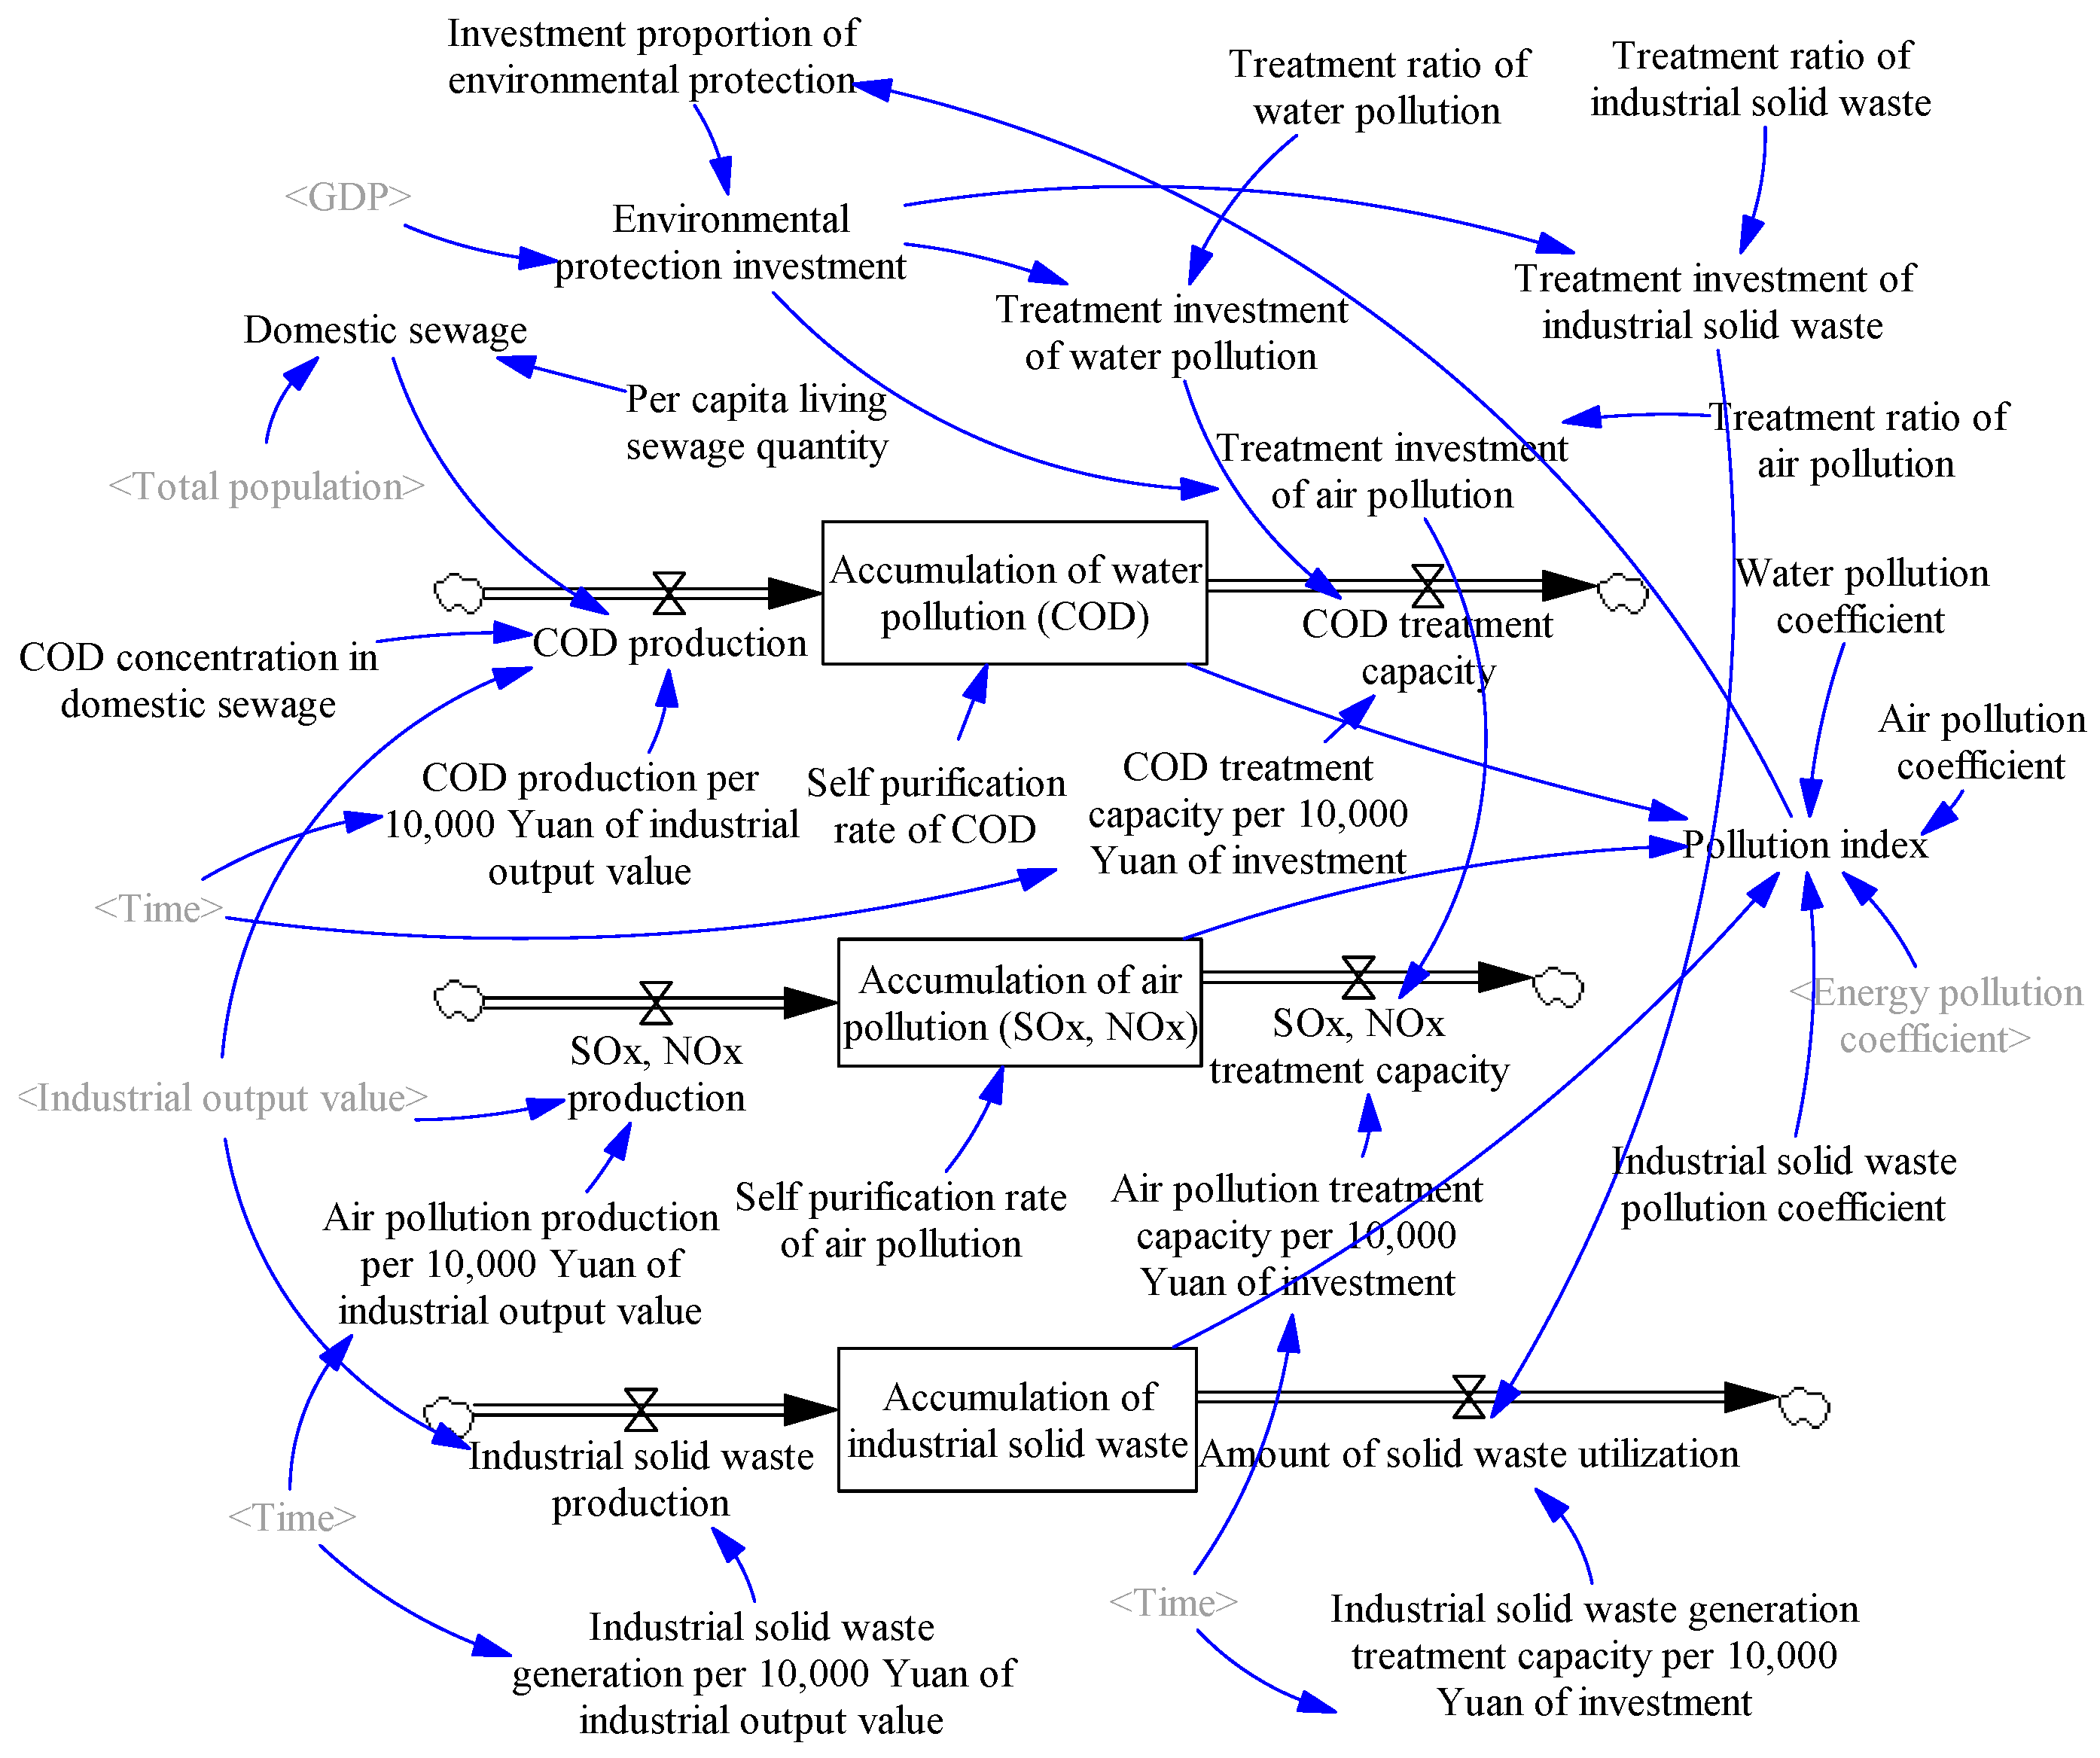
2.2.3. Environment Subsystem
2.3. Validation of Dynamic Models
2.3.1. Boundary Adequacy
2.3.2. Structure Verification
2.3.3. Dimensional Consistency
2.3.4. Parameter Verification
2.3.5. Extreme Condition Test
2.3.6. Structurally Oriented Behavior Test
3. Case Study
3.1. Data
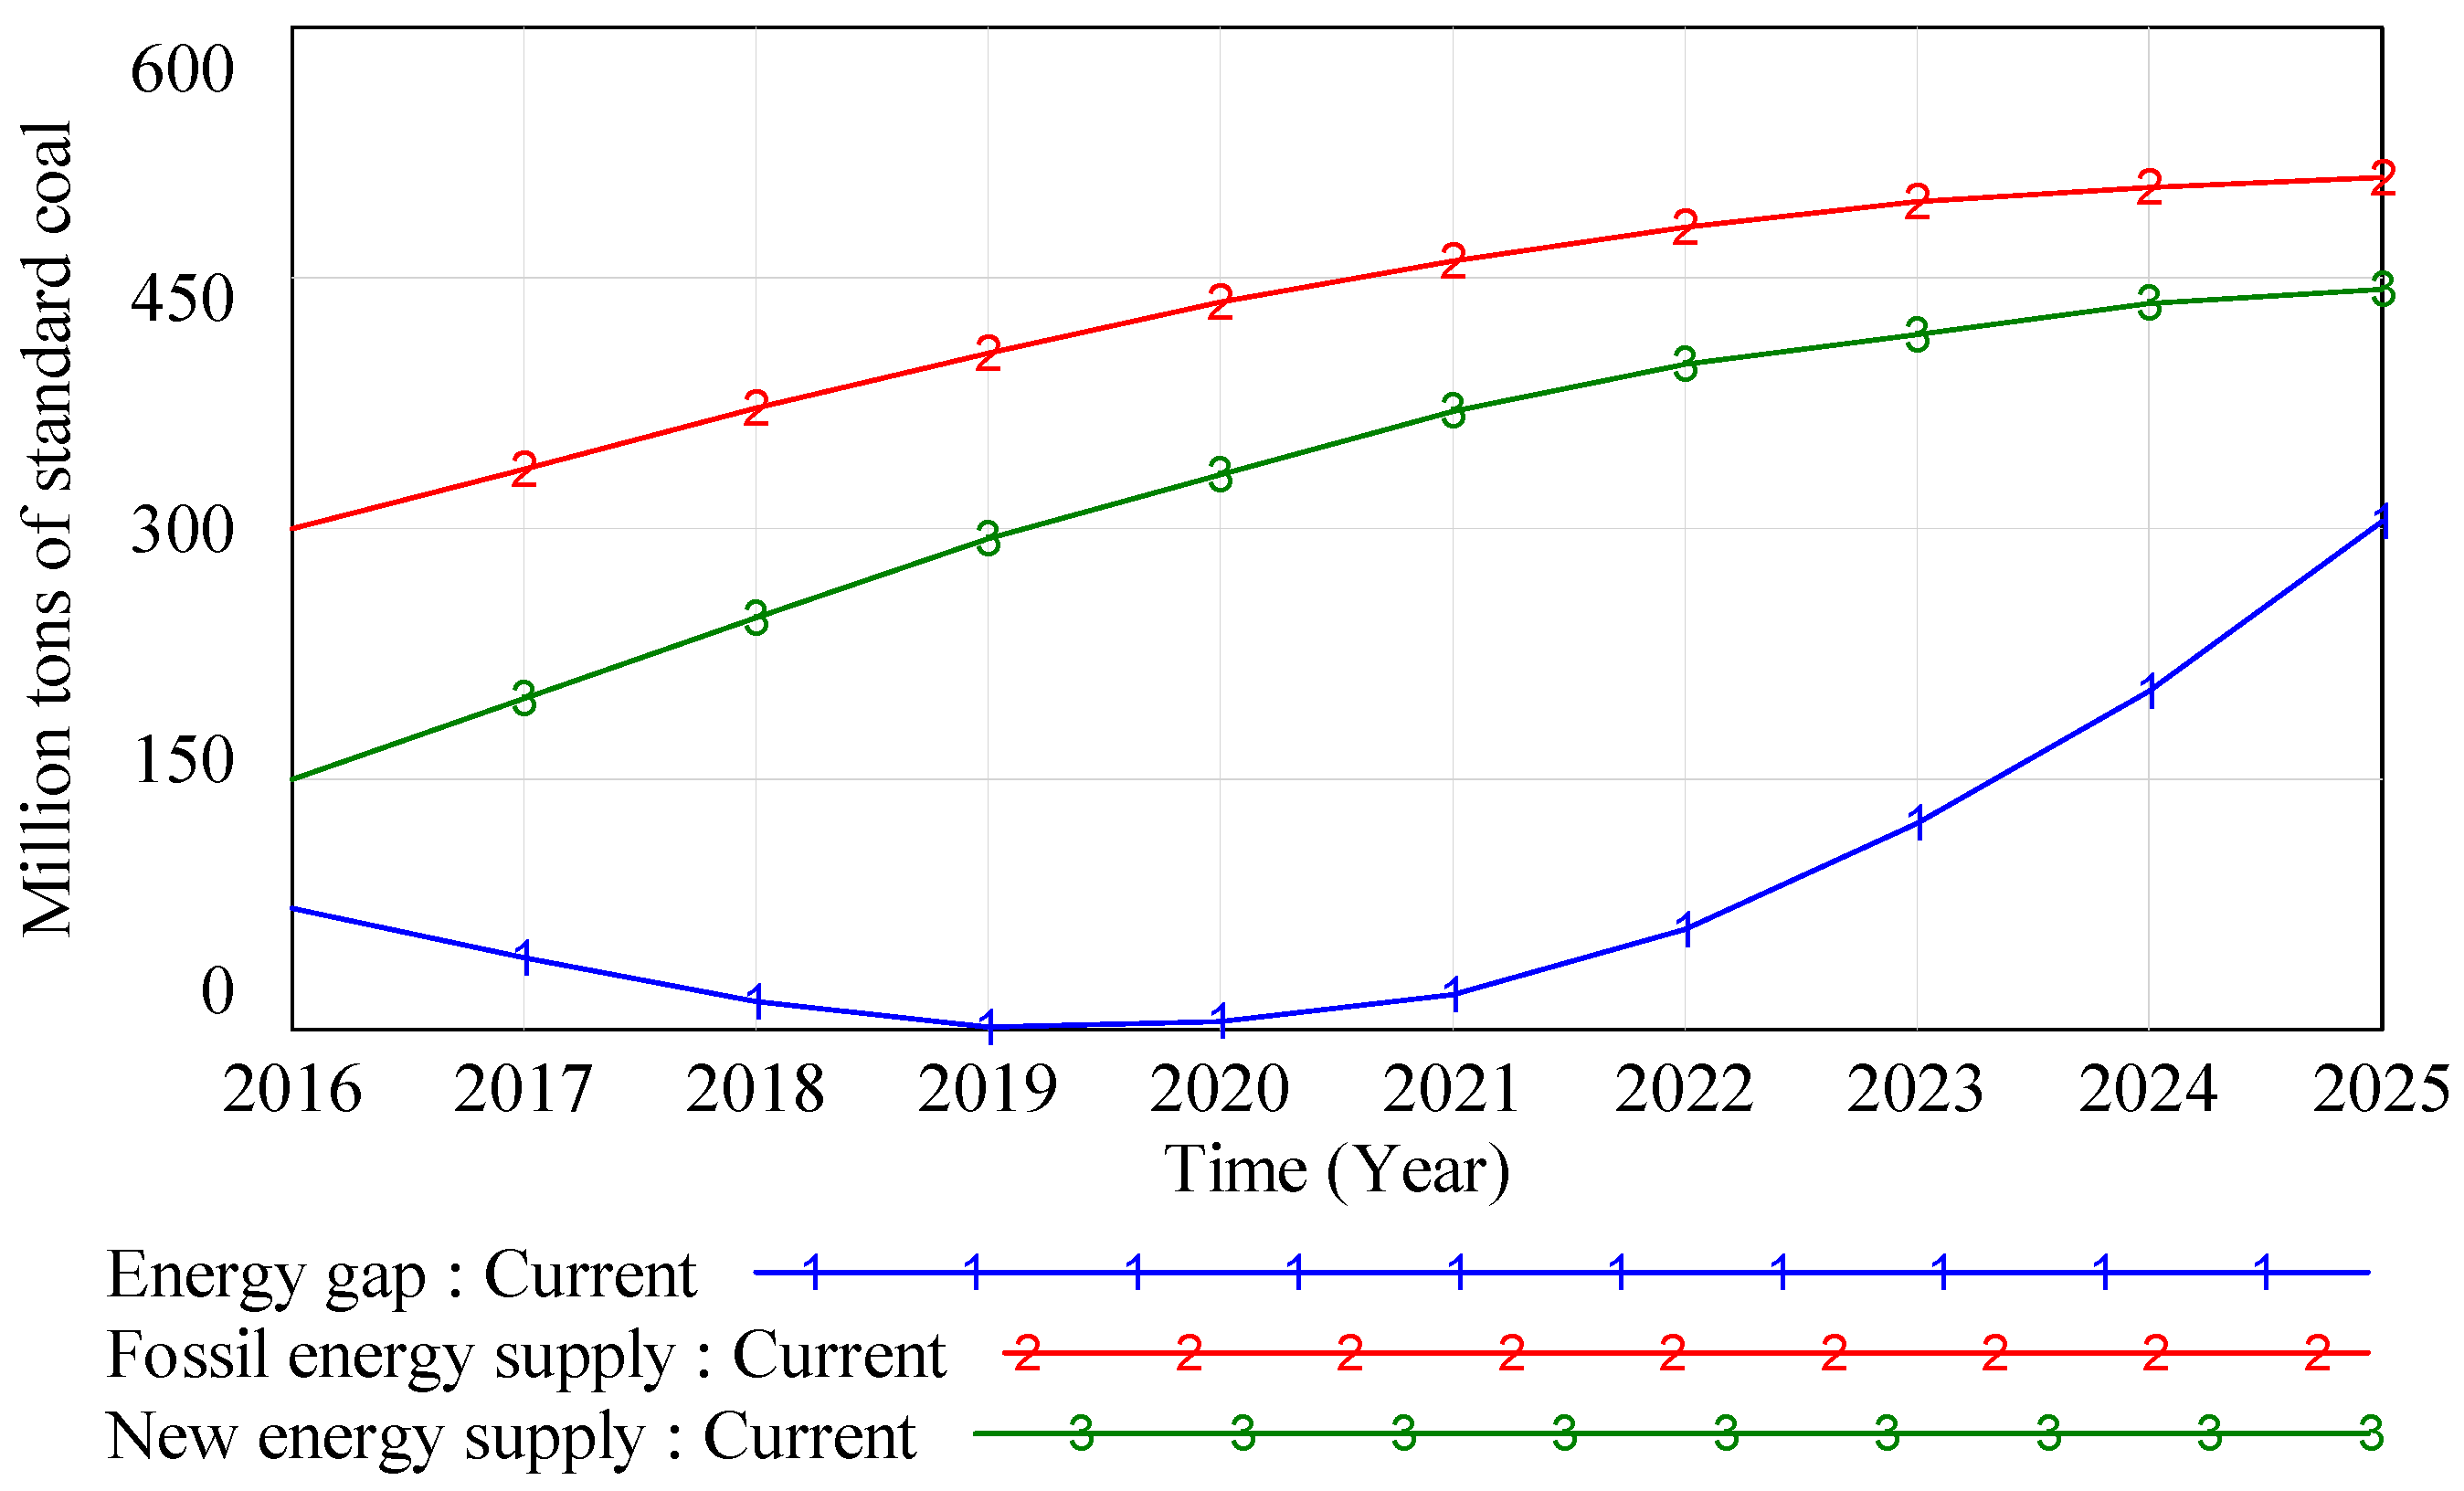
3.2. Simulation Results
4. Discussion
- (1)
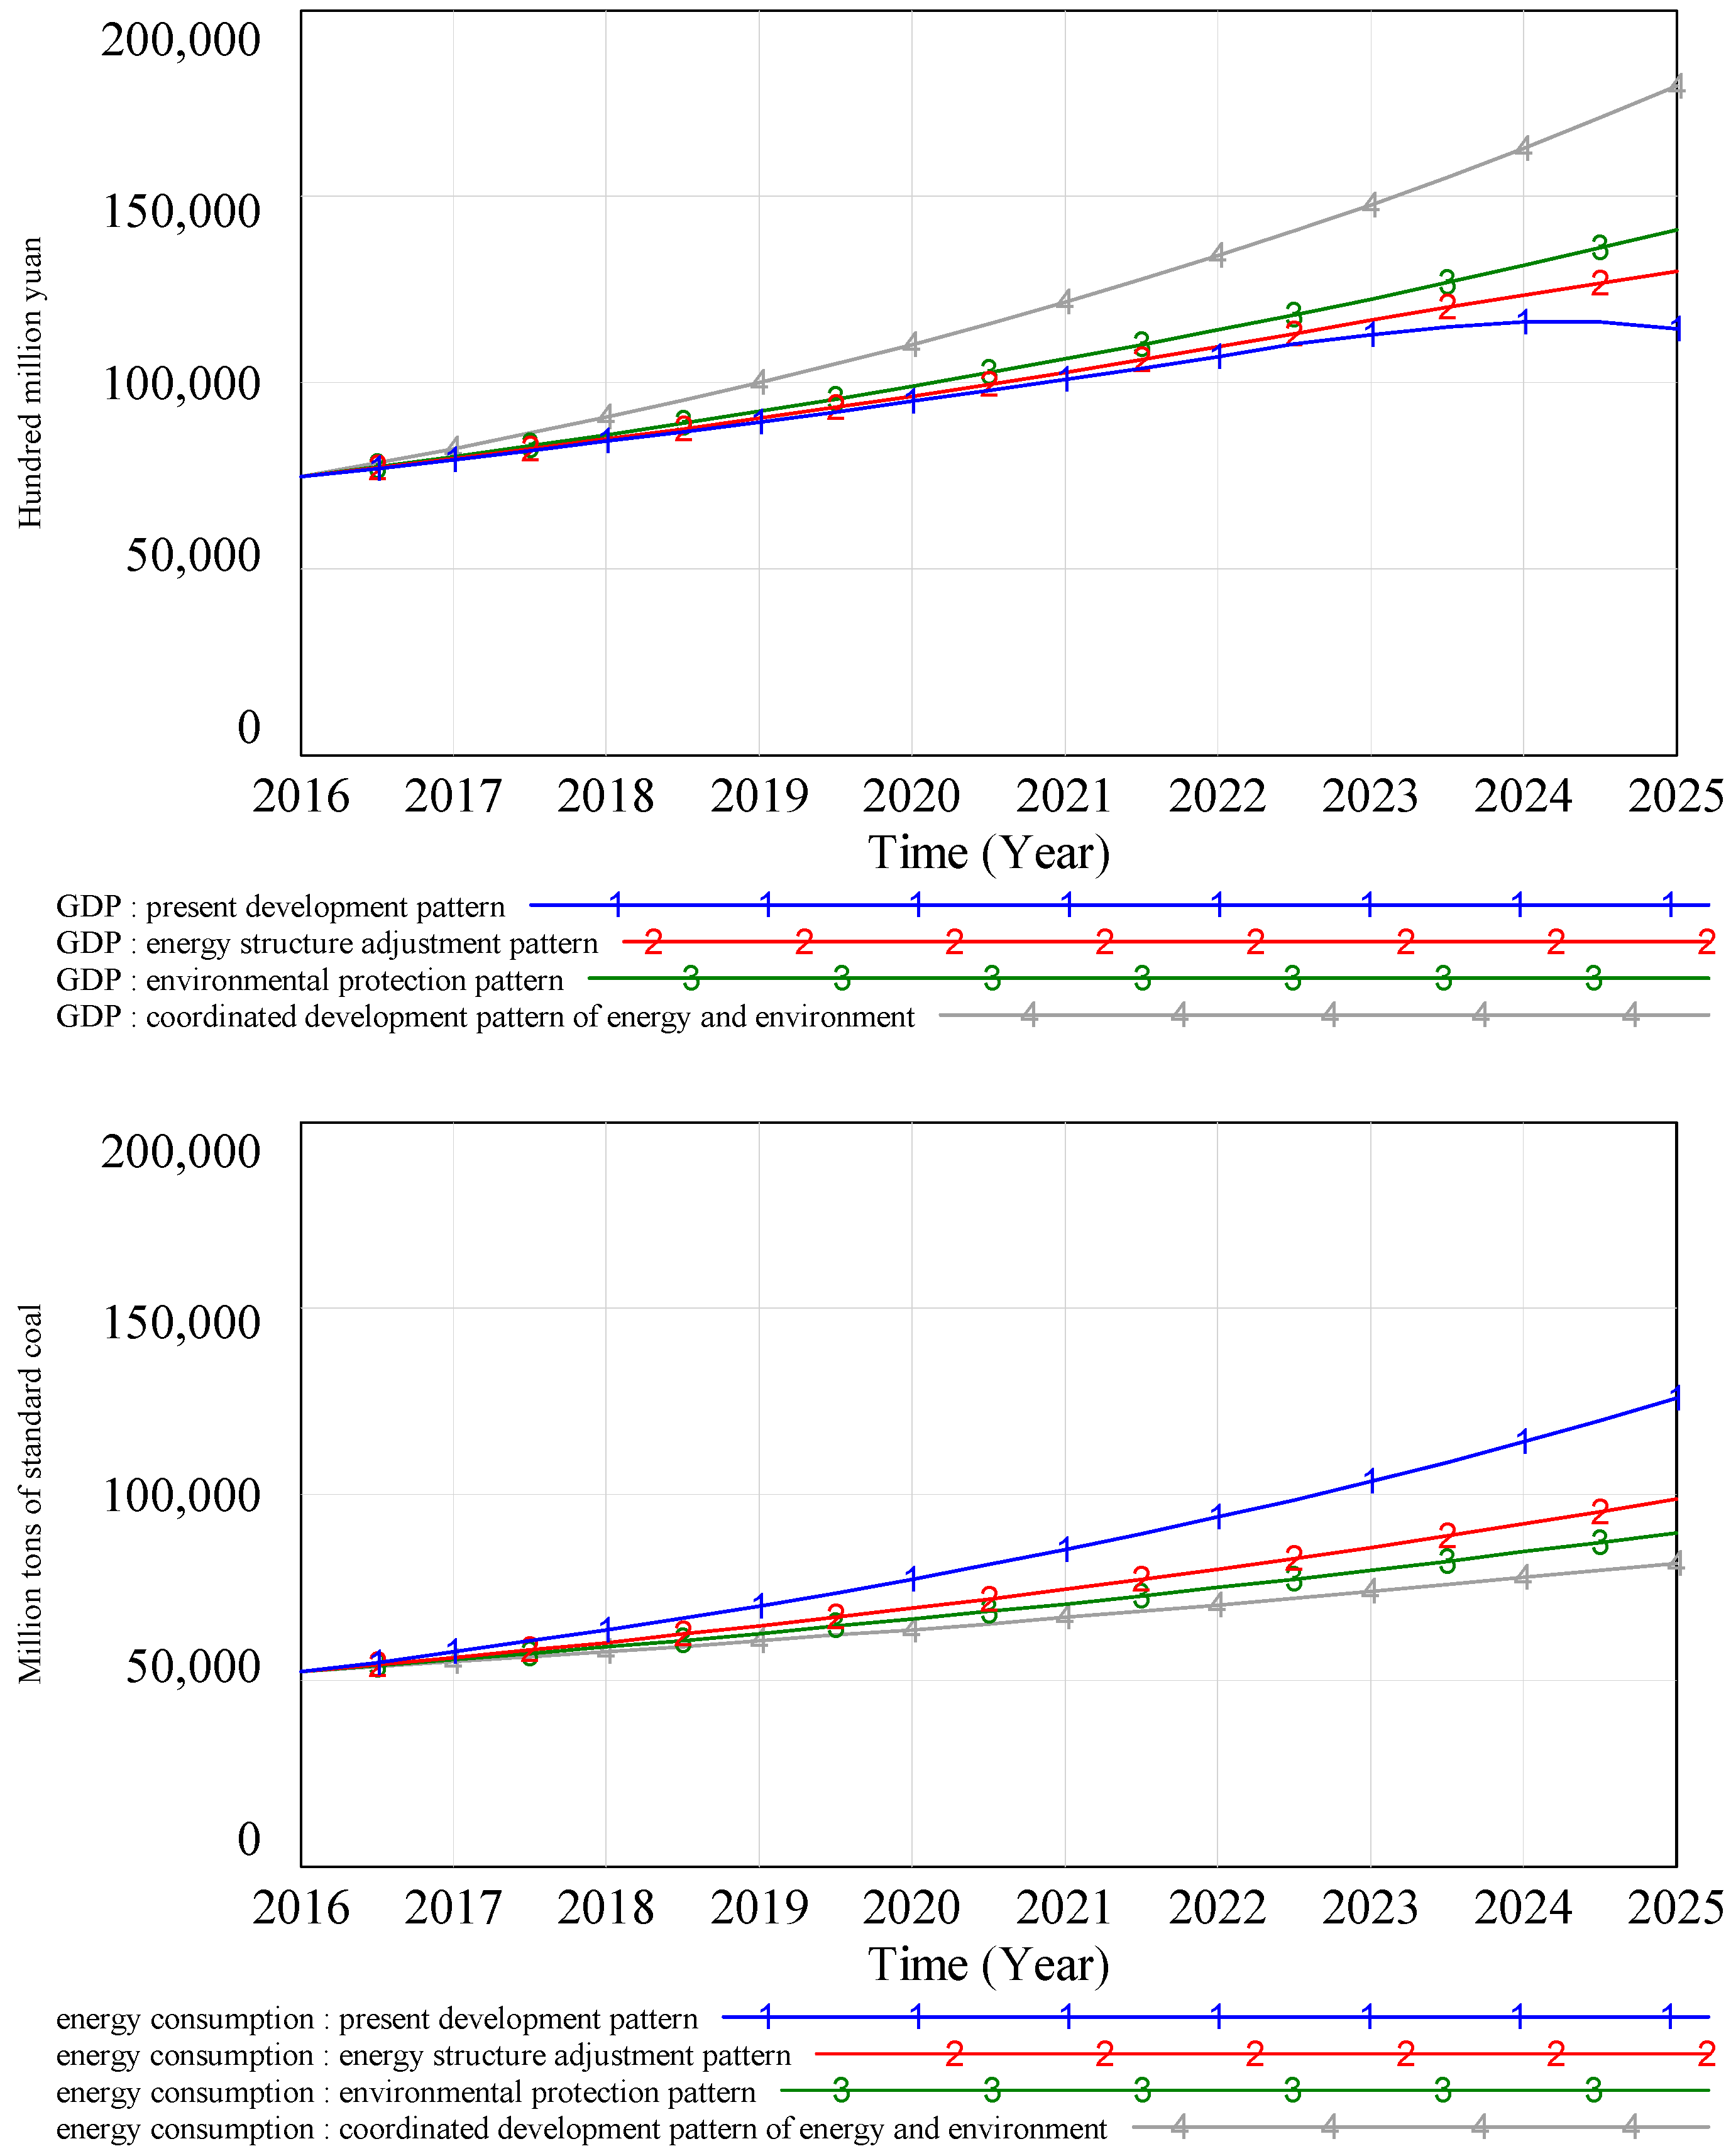
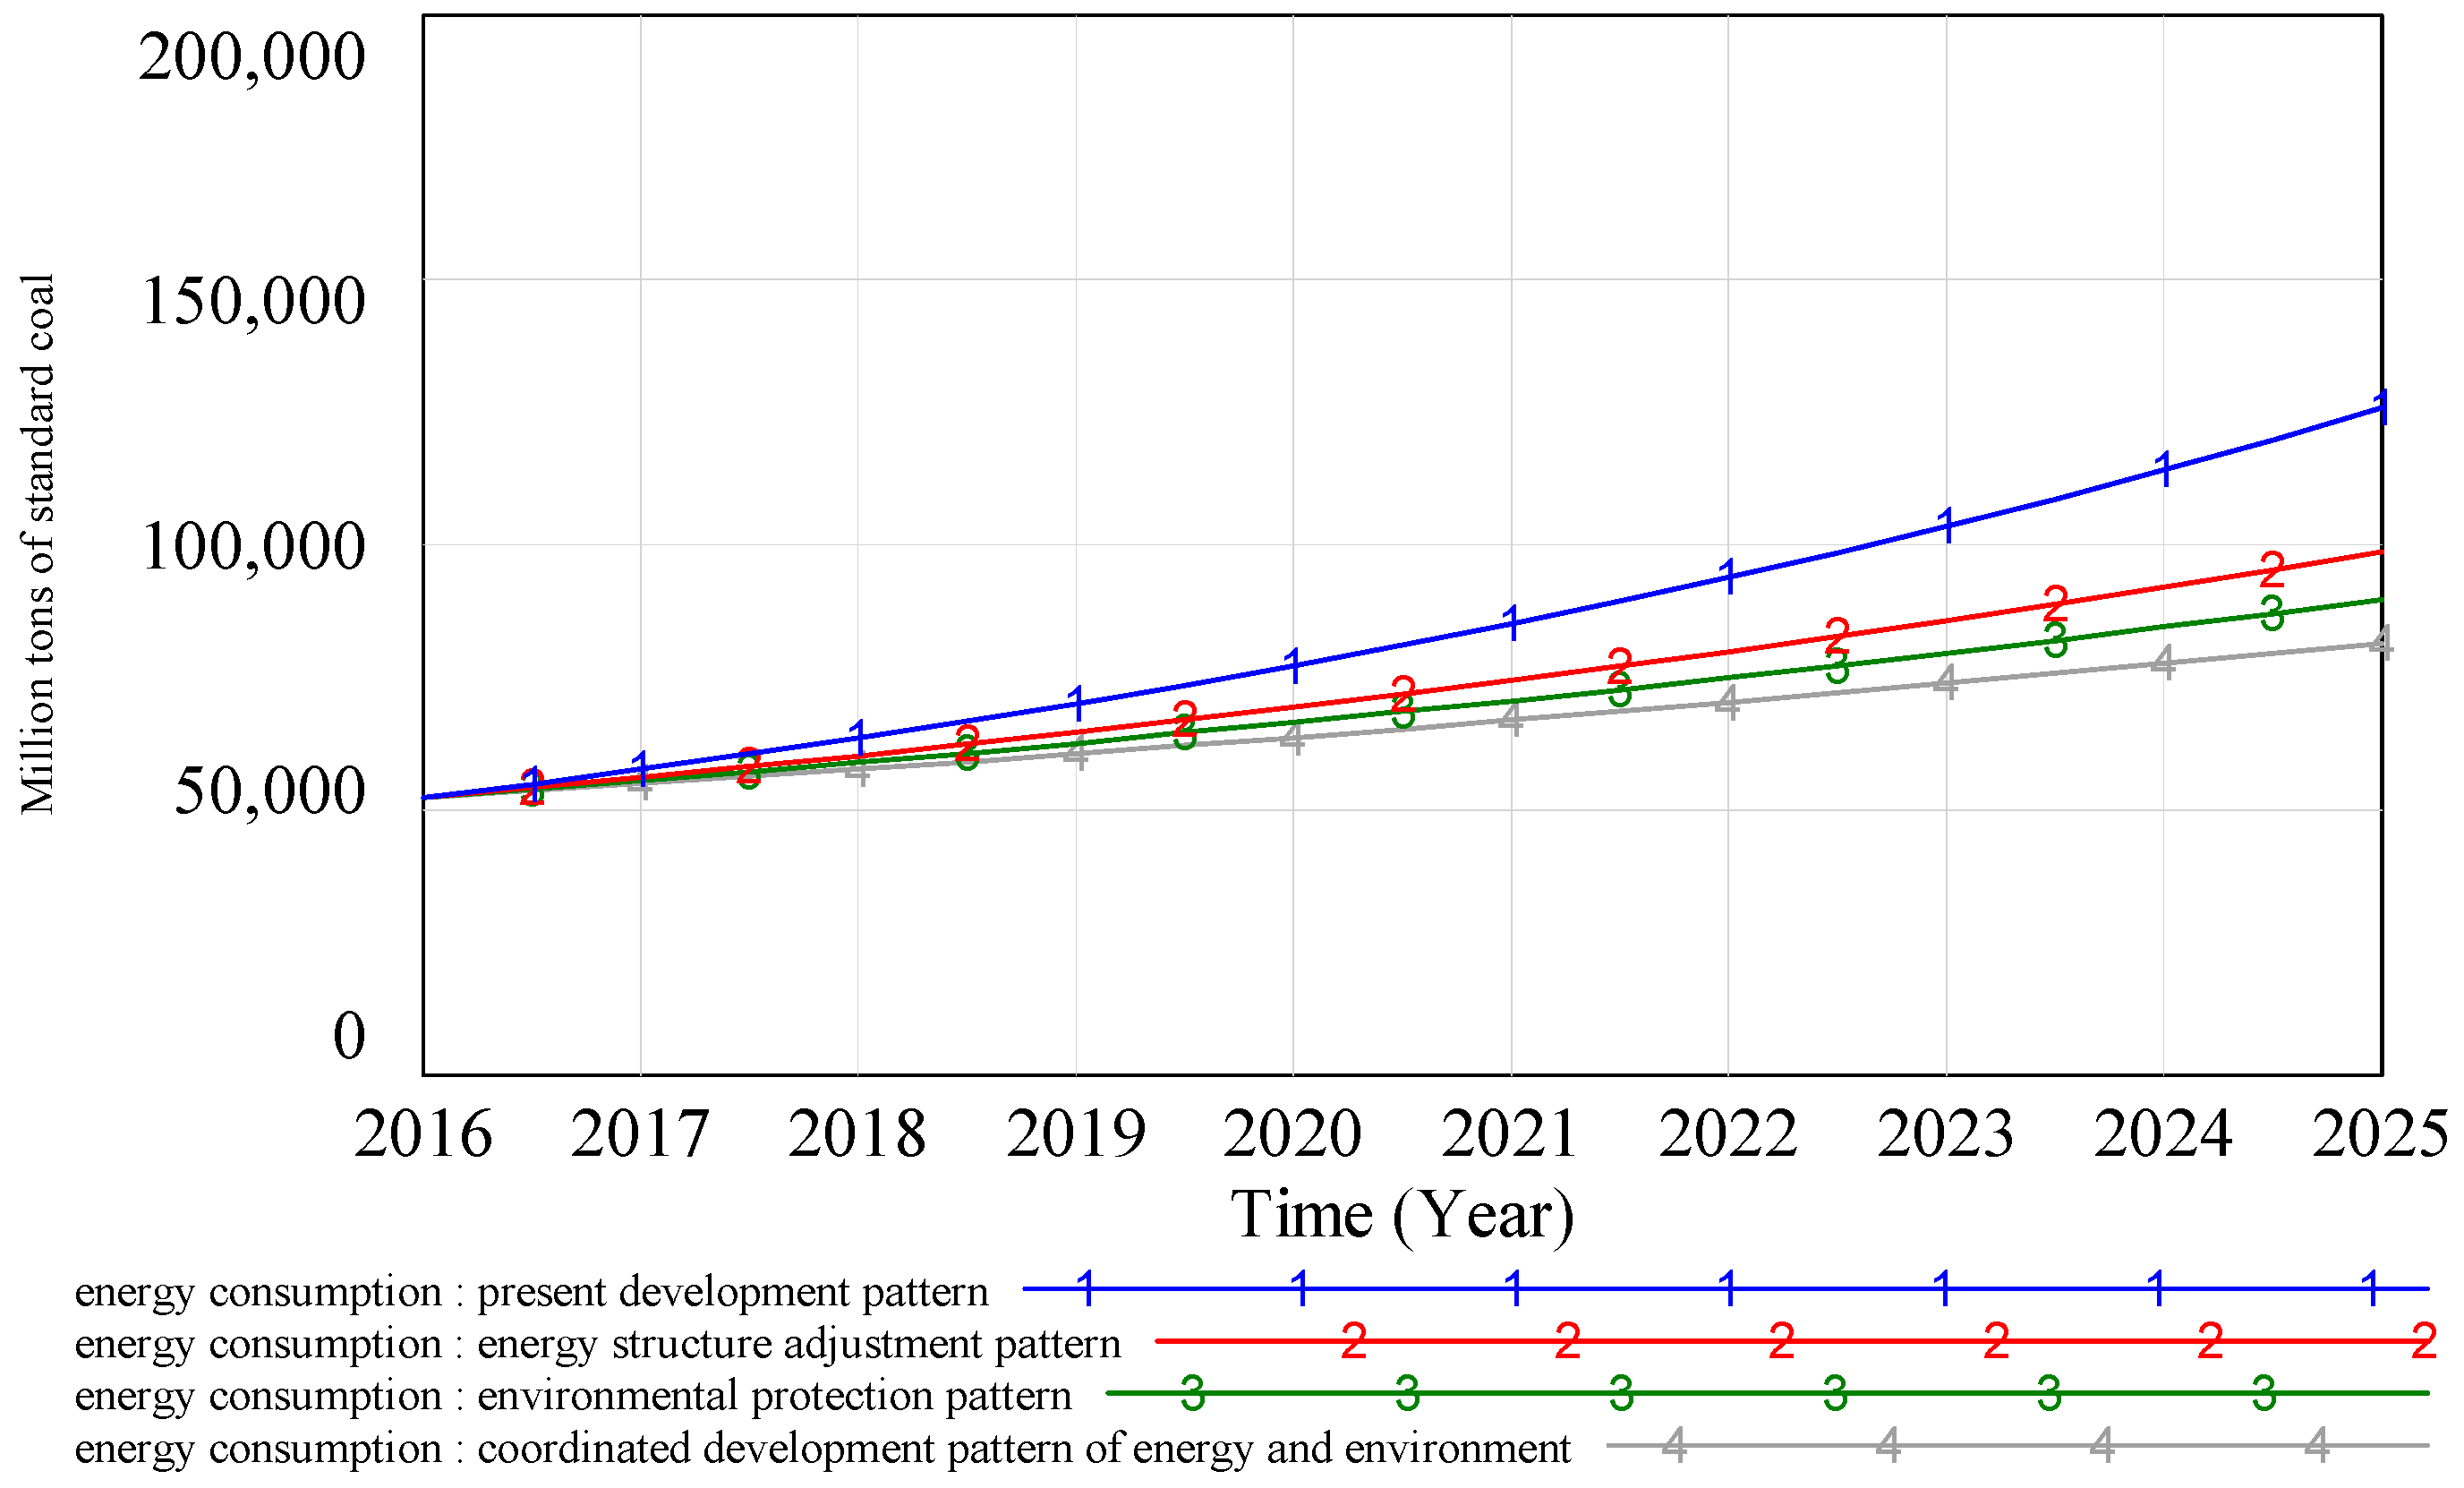
- The present development pattern: The analysis is the same as the results of Section 3.
- (2)
- The energy structure adjustment pattern: This pattern focuses on the adjustment of energy structure and hopes to alleviate environmental pressure through the increase of the proportion of new energy investment in industrial production. We use table functions to adjust the proportion of fossil and new energy power investment to 45% and 55%, respectively, in 2025. The proportion of investment in environmental protection remains at 2.8%. Under the energy structure adjustment pattern, GDP will increase annually to 12.97 trillion Yuan in 2025. The GDP growth rate is higher than that of the present development pattern, which is about 6%. With the development of the economy, energy consumption and the pollution index continue to grow, but they decrease to 9.87 trillion Yuan and 56.86, respectively, in 2025 compared with the present development pattern due to the considerable increase in new energy consumption. The quality of the environment will be improved, and the 3E system will be sustainably developed.
- (3)
- The environmental protection pattern: This pattern emphasizes the impact of increased investment in environmental protection on environmental quality improvement. Under the premise of rapid development of industries and constant energy consumption structure, we use the table function to advance the investment proportion of environmental protection to 4% and 6% when the pollution index reaches 40 and 60, respectively. The results show that GDP, energy consumption, and the pollution index continue to increase. GDP further increases to 14.11 trillion Yuan compared to that of the energy structure adjustment pattern, and energy consumption and the pollution index further decrease to 8.97 trillion Yuan and 52.03 in 2025, respectively. The GDP growth rate is about 7.2%. It shows that the quality of the environment will be improved, and the 3E system will be sustainable developed.
- (4)
- The coordinated development pattern of energy and environment: Integrated energy structure adjustment and environmental protection policies; this pattern not only requires rapid economic development but also pays attention to the use of clean energy and the increase of the environmental investment proportion. That is, the proportion of fossil and new energy power investment is adjusted to 45% and 55%, respectively, and the investment proportion of environmental protection increases to 4% and 6% when the pollution index reaches 40 and 60, respectively. Under this pattern, GDP will maintain rapid growth, with an average growth rate of 9.4%, and reach 17.96 trillion Yuan in 2025. The total energy consumption will further reduce, reaching 8.15 trillion Yuan in 2025. Environmental quality will improve even more, and pollution index reduce to 47.62 in 2025. In summary, this pattern has the best comprehensive benefits and is an ideal pattern for the sustainable development of Beijing-Tianjin-Hebei region’s 3E system.
5. Conclusions
Acknowledgments
Author Contributions
Conflicts of Interest
Appendix A
- [1]
- Accumulation of air pollution (SOx, NOx) = INTEG ((SOx, NOx production − SOx, NOx treatment capacity) × (1 − Self purification rate of air pollution), 124.9)
- [2]
- Accumulation of industrial solid waste = INTEG (Industrial solid waste production − Amount of solid waste utilization, 31,953)
- [3]
- Accumulation of water pollution (COD) = INTEG ((COD production − COD treatment capacity) × (1 − Self purification rate of COD), 147,992)
- [4]
- Air pollution coefficient = 0.81
- [5]
- Air pollution production per 10,000 Yuan of industrial output value = −0.004 × (Time − 2016) + 0.0187
- [6]
- Air pollution treatment capacity per 10,000 Yuan of investment = 0.006 × (Time − 2016) + 0.0012
- [7]
- Amount of solid waste utilization = Treatment investment of industrial solid waste × Industrial solid waste generation treatment capacity per 10,000 Yuan of investment
- [8]
- COD concentration in domestic sewage = 350
- [9]
- COD production per 10,000 Yuan of industrial output value = −1.314 × (Time − 2016) + 26.25
- [10]
- COD production = Domestic sewage × COD concentration in domestic sewage + COD production per 10,000 Yuan of industrial output value
- [11]
- COD treatment capacity per 10,000 Yuan of investment = 0.364 × (Time − 2016) + 19.57
- [12]
- COD treatment capacity = COD treatment capacity per 10,000 Yuan of investment × Treatment investment of water pollution
- [13]
- Coefficient of fossil fuel pollution = 0.67
- [14]
- Decrease of energy intensity = Effect of energy conservation policy − GDP × The impact of GDP on energy intensity × 1.2 × 10⁻⁵
- [15]
- Depreciation of fossil energy fixed assets = Fossil energy fixed assets/Life cycle of industrial fixed assets
- [16]
- Depreciation of new energy fixed assets = New energy fixed assets/Life cycle of industrial fixed assets
- [17]
- Domestic sewage = Per capita living sewage quantity × Total population × 104
- [18]
- Effect of energy conservation policy = Intensity of energy conservation policies × 1.1
- [19]
- Energy consumption = Energy intensity × GDP
- [20]
- Energy gap = Energy consumption − Energy supply
- [21]
- Energy intensity = INTEG (Decrease of energy intensity, 0.7)
- [22]
- Energy pollution coefficient = Coefficient of fossil fuel pollution × Fossil energy supply
- [23]
- Energy supply = Fossil energy supply + New energy supply
- [24]
- Environmental protection investment = GDP × Investment proportion of environmental protection
- [25]
- Fixed assets of the primary industry = INTEG (Fixed output increment of the primary industry, 12,563.5)
- [26]
- Fixed assets of the secondary industry = INTEG (Fixed output increment of the secondary industry, 51,584.9)
- [27]
- Fixed assets of the tertiary industry = INTEG (Fixed output increment of the tertiary industry, 27,543.7)
- [28]
- Fixed assets proportion of the primary industry = 0.081
- [29]
- Fixed assets proportion of the secondary industry = 0.568
- [30]
- Fixed assets proportion of the tertiary industry = 0.351
- [31]
- Fixed output increment of the primary industry = Investment in fixed assets × Fixed assets proportion of the primary industry
- [32]
- Fixed output increment of the secondary industry = Fixed assets proportion of the secondary industry × Investment in fixed assets
- [33]
- Fixed output increment of the tertiary industry = Fixed assets proportion of the tertiary industry × Investment in fixed assets
- [34]
- Fossil energy fixed assets = INTEG (Increment of fossil energy fixed asset-Depreciation of fossil energy fixed assets, 5483)
- [35]
- Fossil energy investment = Industrial investment × Proportion of fossil energy investment
- [36]
- Fossil energy supply = Supply capacity of fossil energy resources per unit of fixed assets × Fossil energy fixed assets
- [37]
- GDP = Output values of the primary industry + Output values of the secondary industry + Output values of the tertiary industry
- [38]
- Increment of fossil energy fixed asset = Fossil energy investment × 104
- [39]
- Increment of new energy fixed asset = New energy investment × 104
- [40]
- Industrial investment per 10,000 Yuan of industrial output value = −0.031 × (Time − 2016) + 0.911
- [41]
- Industrial investment = Industrial investment per 10,000 Yuan of industrial output value × Industrial output value × 104
- [42]
- Industrial output value = Output values of the secondary industry × The proportion of industrial output accounted for output of the secondary industry
- [43]
- Industrial solid waste generation per 10,000 Yuan of industrial output value = −0.021 × (Time − 2016) + 1.143
- [44]
- Industrial solid waste generation treatment capacity per 10,000 Yuan of investment = 0.015 × (Time − 2016) + 0.711
- [45]
- Industrial solid waste pollution coefficient = 0.66
- [46]
- Industrial solid waste production = Industrial solid waste generation per 10,000 Yuan of industrial output value × Industrial output value × 104
- [47]
- Intensity of energy conservation policies = Energy gap × 3 × 10⁻⁴
- [48]
- Investment in fixed assets = GDP × Rate of fixed assets investment
- [49]
- Investment proportion of environmental protection = Pollution index × 9 × 10⁻³
- [50]
- Labor force of the primary industry = Labor force × Labor force ratio of the primary industry
- [51]
- Labor force of the secondary industry = Labor force × Labor force ratio of the secondary industry
- [52]
- Labor force of the tertiary industry = Labor force × Labor force ratio of the tertiary industry
- [53]
- Labor force ratio = WITH LOOKUP (Time, ([(2016,0.67) − (2025,0.63)], (2016,0.668), (2017,0.665), (2018,0.661), (2019,0.654), (2020,0.646), (2021,0.631), (2022,0.63), (2023,0.628), (2024,0.626), (2025,0.621)))
- [54]
- Labor force ratio of the primary industry = 0.381
- [55]
- Labor force ratio of the secondary industry = 0.348
- [56]
- Labor force ratio of the tertiary industry = 0.271
- [57]
- Labor force = Total population × Labor force ratio
- [58]
- Life cycle of industrial fixed assets = 20
- [59]
- New energy fixed assets = INTEG (Increment of new energy fixed asset-Depreciation of new energy fixed assets, 1914)
- [60]
- New energy investment = Industrial investment × Proportion of new energy investment
- [61]
- New energy supply = Supply capacity of new energy resources per unit of fixed assets × New energy fixed assets
- [62]
- Output values of the primary industry = 0.037 × Fixed assets of the primary industry0.341 × Labor force of the primary industry−0.673 × The index of the effects of pollution on the primary industry
- [63]
- Output values of the secondary industry = 0.113 × Fixed assets of the secondary industry0.468 × Labor force of the secondary industry0.544
- [64]
- Output values of the tertiary industry = 0.084 × Fixed assets of the tertiary industry0.325 × Labor force of the tertiary industry0.659 × The index of the effects of pollution on the tertiary industry
- [65]
- Per capita living sewage quantity = 53.5
- [66]
- Pollution index = Energy pollution coefficient × (Accumulation of air pollution (SOx, NOx) × Air pollution coefficient + Accumulation of industrial solid waste × Industrial solid waste pollution coefficient + Accumulation of water pollution (COD) × Water pollution coefficient)/((Accumulation of industrial solid waste + Accumulation of water pollution (COD) + Accumulation of air pollution (SOx, NOx))/28)
- [67]
- Population growth rate = 0.0496
- [68]
- Population growth = Population growth rate × The index of the effects of pollution on the population × Total population
- [69]
- Proportion of fossil energy investment = WITH LOOKUP (Time, ([(2016,0.62) − (2025,0.51)], (2016,0.75), (2017,0.73), (2018,0.72), (2019,0.7), (2020,0.69), (2021,0.66), (2022,0.64), (2023,0.62), (2024,0.59), (2025,0.57)))
- [70]
- Proportion of new energy investment = WITH LOOKUP (Time, ([(2016,0.62) − (2025,0.51)], (2016,0.25), (2017,0.27), (2018,0.28), (2019,0.3), (2020,0.31), (2021,0.33), (2022,0.36), (2023,0.38), (2024,0.41), (2025,0.43)))
- [71]
- Rate of fixed assets investment = WITH LOOKUP (Time, ([(2016,0.66) − (2025,0.75)], (2016,0.658), (2017,0.664), (2018,0.673), (2019,0.686), (2020,0.695), (2021,0.712), (2022,0.724), (2023,0.733), (2024,0.736), (2025,0.741)))
- [72]
- Self purification rate of air pollution = 0.247
- [73]
- Self purification rate of COD = 0.392
- [74]
- SOx, NOx production = Industrial output value × Air pollution production per 10,000 Yuan of industrial output value × 104
- [75]
- SOx, NOx treatment capacity = Air pollution treatment capacity per 10,000 Yuan of investment × Treatment investment of air pollution
- [76]
- Supply capacity of fossil energy resources per unit of fixed assets = 54,716
- [77]
- Supply capacity of new energy resources per unit of fixed assets = 78,352
- [78]
- The impact of GDP on energy intensity = WITH LOOKUP (Time, ([(2016,0.62) − (2025,0.51)], (2016,1), (2017,1.1), (2018,1.2), (2019,1.4), (2020,1.5), (2021,1.6), (2022,1.7), (2023,1.8), (2024,1.9), (2025,2)))
- [79]
- The index of the effects of pollution on the population = Pollution index × 8.5 × 10⁻³
- [80]
- The index of the effects of pollution on the primary industry = Pollution index × 3 × 10⁻³ The index of the effects of pollution on the tertiary industry = Pollution index × 5 × 10⁻³
- [81]
- The proportion of industrial output accounted for output of the secondary industry = 0.914
- [82]
- Total population = INTEG (Population growth, 11,204.9)
- [83]
- Treatment investment of air pollution = Environmental protection investment × Treatment ratio of air pollution
- [84]
- Treatment investment of industrial solid waste = Environmental protection investment × Treatment ratio of industrial solid waste
- [85]
- Treatment investment of water pollution = Environmental protection investment × Treatment ratio of water pollution
- [86]
- Treatment ratio of air pollution = 0.336
- [87]
- Treatment ratio of industrial solid waste = 0.468
- [88]
- Treatment ratio of water pollution = 0.196
- [89]
- Water pollution coefficient = 0.35
Appendix B
- [1]
- ([(2016,0.67) − (2025,0.63)], (2016,0.668), (2017,0.665), (2018,0.661), (2019,0.654), (2020,0.646), (2021,0.631), (2022,0.630), (2023,0.628), (2024,0.626), (2025,0.621))
- [2]
- ([(2016,0.66) − (2025,0.75)], (2016,0.658), (2017,0.664), (2018,0.673), (2019,0.686), (2020,0.695), (2021,0.712), (2022,0.724), (2023,0.733), (2024,0.736), (2025,0.741))
- [3]
- Energy consumption per 10,000 Yuan of industrial output value = −0.031 × (Time − 2016) + 0.911
- [4]
- ([(2016,0.62) − (2025,0.51)], (2016,0.75), (2017,0.73), (2018,0.72), (2019,0.70), (2020,0.69), (2021,0.66), (2022,0.64), (2023,0.62), (2024,0.59), (2025,0.57))
- [5]
- ([(2016,0.62) − (2025,0.51)], (2016,0.25), (2017,0.27), (2018,0.28), (2019,0.30), (2020,0.31), (2021,0.33), (2022,0.36), (2023,0.38), (2024,0.41), (2025,0.43))
- [6]
- ([(2016,0.62) − (2025,0.51)], (2016,1.0), (2017,1.1), (2018,1.2), (2019,1.4), (2020,1.5), (2021,1.6), (2022,1.7), (2023,1.8), (2024,1.9), (2025,2.0))
- [7]
- COD production per 10,000 Yuan of industrial output value = −1.314 × (Time − 2016) + 26.25
- [8]
- Air pollution production per 10,000 Yuan of industrial output value = −0.004 × (Time − 2016) + 0.0187
- [9]
- Industrial solid waste generation per 10,000 Yuan of industrial output value = −0.021 × (Time − 2016) + 1.143
- [10]
- COD treatment capacity per 10,000 Yuan of investment = 0.364 × (Time − 2016) + 19.57
- [11]
- Air pollution treatment capacity per 10,000 Yuan of investment = 0.006 × (Time − 2016) + 0.0012
- [12]
- Industrial solid waste generation treatment capacity per 10,000 Yuan of investment = 0.015 × (Time − 2016) + 0.711
Appendix C

| Year | GDP (108 Yuan) | Energy Intensity (Tons of Standard Coal/104 Yuan) | Energy Consumption (Million Tons of Standard Coal) |
|---|---|---|---|
| 2016 | 74,613 | 0.700 | 522.29 |
| 2017 | 79,233 | 0.727 | 575.82 |
| 2018 | 84,140 | 0.755 | 634.85 |
| 2019 | 89,351 | 0.783 | 699.92 |
| 2020 | 94,885 | 0.813 | 771.66 |
| 2021 | 100,761 | 0.844 | 850.75 |
| 2022 | 107,001 | 0.877 | 937.96 |
| 2023 | 112,654 | 0.918 | 1034.10 |
| 2024 | 116,252 | 0.981 | 1140.09 |
| 2025 | 114,283 | 1.100 | 1256.95 |
References
- Abosedra, S.; Dah, A.; Ghosh, S. Electricity consumption and economic growth, the case of Lebanon. Appl. Energy 2009, 86, 429–432. [Google Scholar] [CrossRef]
- Alam, M.J.; Begum, I.A.; Buysse, J.; Van Huylenbroeck, G. Energy consumption, carbon emissions and economic growth nexus in Bangladesh: Cointegration and dynamic causality analysis. Energy Policy 2012, 45, 217–225. [Google Scholar] [CrossRef]
- Al-mulali, U.; Lee, Y.M.J.; Mohammed, A.H.; Sheau-Ting, L. Examining the link between energy consumption, carbon dioxide emission, and economic growth in Latin America and the Caribbean. Renew. Sustain. Energy Rev. 2013, 26, 42–48. [Google Scholar] [CrossRef]
- Xue, B.; Geng, Y.; Müller, K.; Lu, C.; Ren, W. Understanding the Causality between Carbon Dioxide Emission, Fossil Energy Consumption and Economic Growth in Developed Countries: An Empirical Study. Sustainability 2014, 6, 1037–1045. [Google Scholar] [CrossRef]
- Yang, Z.; Zhao, Y. Energy consumption, carbon emissions, and economic growth in India: Evidence from directed acyclic graphs. Econ. Model. 2014, 38, 533–540. [Google Scholar] [CrossRef]
- Śmiech, S.; Papież, M. Energy consumption and economic growth in the light of meeting the targets of energy policy in the EU: The bootstrap panel Granger causality approach. Energy Policy 2014, 71, 118–129. [Google Scholar] [CrossRef]
- Lim, K.M.; Lim, S.Y.; Yoo, S.H. Oil Consumption, CO2 Emission, and Economic Growth: Evidence from the Philippines. Sustainability 2014, 6, 967–979. [Google Scholar] [CrossRef]
- Bozoklu, S.; Yilanci, V. Energy consumption and economic growth for selected OECD countries: Further evidence from the Granger causality test in the frequency domain. Energy Policy 2013, 63, 877–881. [Google Scholar] [CrossRef]
- Pao, H.T.; Fu, H.C. Renewable energy, non-renewable energy and economic growth in Brazil. Renew. Sustain. Energy Rev. 2013, 25, 381–392. [Google Scholar] [CrossRef]
- Apergis, N.; Payne, J.E. Renewable energy, output, CO2, emissions, and fossil fuel prices in Central America: Evidence from a nonlinear panel smooth transition vector error correction model. Energy Econ. 2014, 42, 226–232. [Google Scholar] [CrossRef]
- Tan, S.T.; Ho, W.S.; Hashim, H.; Lee, C.T.; Taib, M.R.; Ho, C.S. Energy, economic and environmental (3E) analysis of waste-to-energy (WTE) strategies for municipal solid waste (MSW) management in Malaysia. Energy Convers. Manag. 2015, 102, 111–120. [Google Scholar] [CrossRef]
- Yi, Q.; Feng, J.; Wu, Y.; Li, W. 3E (energy, environmental, and economy) evaluation and assessment to an innovative dual-gas polygeneration system. Energy 2014, 66, 285–294. [Google Scholar] [CrossRef]
- Adibhatla, S.; Kaushik, S.C. Energy, exergy and economic (3E) analysis of integrated solar direct steam generation combined cycle power plant. Sustain. Energy Technol. Assess. 2017, 20, 88–97. [Google Scholar] [CrossRef]
- Li, W.C.; Tian, L.X.; He, D. Research on SD model of economics-energy-environment sustainable development-Take China for example. J. Syst. Sci. 2014, 22, 54–57. Available online: http://oversea.cnki.net/kcms/detail/detail.aspx?recid=&FileName=XTBZ201403015&DbName=CJFD2014&DbCode=CJFD&uid=WEEvREcwSlJHSldRa1FhcTdWZDluYUcxVHovNUlJcWtaT3J6V0diK21XRT0=$9A4hF_YAuvQ5obgVAqNKPCYcEjKensW4ggI8Fm4gTkoUKaID8j8gFw!! (accessed on 1 March 2014). (In Chinese).
- Zhang, H. A Study of Coordinated Development Model and Simulation of Shandong Energy-Economy-Environment System Based on System Dynamics. J. China Univ. Pet. 2013, 29, 5–9. Available online: http://xueshu.baidu.com/s?wd=paperuri%3A%28dcff64991c5d66a83b7548a2adf8b7a8%29&filter=sc_long_sign&tn=SE_xueshusource_2kduw22v&sc_vurl=http%3A%2F%2Fen.cnki.com.cn%2FArticle_en%2FCJFDTotal-SYSK201302003.htm&ie=utf-8&sc_us=6052240862574185689 (accessed on 1 February 2013). (In Chinese).
- Zhou, J.; Sheng-Chen, H.E.; Wang, Y.; Gao, Q.; Lu, G.F. System dynamics simulation of the economy-energy-environment system in Suzhou. Energy Environ. Protect. 2011, 25, 10–16. Available online: http://xueshu.baidu.com/s?wd=paperuri%3A%285fa4deb75670415aa9f997b3b4da2953%29&filter=sc_long_sign&tn=SE_xueshusource_2kduw22v&sc_vurl=http%3A%2F%2Fen.cnki.com.cn%2FArticle_en%2FCJFDTotal-NYBH201102003.htm&ie=utf-8&sc_us=5932900915466147697 (accessed on 1 February 2011). (In Chinese).
- Baranzini, A.; Weber, S.; Bareit, M.; Mathys, N.A. The causal relationship between energy use and economic growth in Switzerland. Energy Econ. 2013, 36, 464–470. [Google Scholar] [CrossRef]
- Ocal, O.; Aslan, A. Renewable energy consumption-economic growth nexus in Turkey. Renew. Sustain. Energy Rev. 2013, 28, 494–499. [Google Scholar] [CrossRef]
- Shahbaz, M.; Khanb, S.; Tahir, M.I. The dynamic links between energy consumption, economic growth, financial development and trade in China: Fresh evidence from multivariate framework analysis. Energy Econ. 2013, 40, 8–21. [Google Scholar] [CrossRef] [Green Version]
- Shahbaz, M.; Ozturk, I.; Afza, T.; Ali, A. Revisiting the environmental Kuznets curve in a global economy. Renew. Sustain. Energy Rev. 2013, 25, 494–502. [Google Scholar] [CrossRef] [Green Version]
- Kamarzamana, N.A.; Tan, C.W. A comprehensive review of maximum power point tracking algorithms for photovoltaic systems. Renew. Sustain. Energy Rev. 2014, 37, 585–598. [Google Scholar] [CrossRef]
- Ming, Z.; Zhang, K.; Dong, J. Overall review of China’s wind power industry: Status quo, existing problems and perspective for future development. Renew. Sustain. Energy Rev. 2013, 24, 379–386. [Google Scholar] [CrossRef]
- Guo, X.D.; Guo, X.P. China’s photovoltaic power development under policy incentives: A system dynamics analysis. Energy 2015, 93, 589–598. [Google Scholar] [CrossRef]
- Teng, Y.; Wang, C.; Wu, Y. System dynamics analysis of informatization and sustainable development. J. Quant. Tech. Econ. 2001, 5, 46–49. Available online: http://oversea.cnki.net/kcms/detail/detail.aspx?recid=&FileName=SLJY200105009&DbName=cjfd2001&DbCode=CJFD&uid=WEEvREcwSlJHSldRa1FhcTdWZDluYUcxVHovNUlJcWtaT3J6V0diK21XRT0=$9A4hF_YAuvQ5obgVAqNKPCYcEjKensW4ggI8Fm4gTkoUKaID8j8gFw!! (accessed on 1 May 2001). (In Chinese).
- Sgouridis, S.; Csala, D. A Framework for Defining Sustainable Energy Transitions: Principles, Dynamics, and Implications. Sustainability 2014, 6, 2601–2622. [Google Scholar] [CrossRef]
- Yuan, C.Q.; Liu, S.F.; Guo, B.H. System dynamics modeling and imitation for Chinese energy-economy system. Chin. J. Manag. Sci. 2011, 19, 717–724. Available online: http://oversea.cnki.net/kcms/detail/detail.aspx?recid=&FileName=ZHYJ201110001125&DbName=CPFD2012&DbCode=CPFD&uid=WEEvREcwSlJHSldRa1FhdkJkcGkxUHcxaDdXUGpyRThiOW4vNTVpWUF5OD0=$9A4hF_YAuvQ5obgVAqNKPCYcEjKensW4ggI8Fm4gTkoUKaID8j8gFw!! (accessed on 28 October 2011). (In Chinese).
- Wang, Y.; Liu, H.; Mao, G.; Zuo, J.; Ma, J. Interregional and sectoral linkage analysis of air pollution in Beijing-Tianjin-Hebei (Jing-Jin-Ji) urban agglomeration of China. J. Clean. Prod. 2017, 165, 1436–1444. [Google Scholar] [CrossRef]
- Forrester, J.W. Industrial Dynamics; MIT Press: Cambridge, MA, USA, 1961. [Google Scholar]
- Sterman, J. Business Dynamics: Systems Thinking and Modeling for a Complex World; McGraw Hill Irwin: Boston, MA, USA, 2000. [Google Scholar]
- Qudrat-Ullah, H. On the validation of system dynamics type simulation models. Telecommun. Syst. 2012, 51, 159–166. [Google Scholar] [CrossRef]
- Qudrat-Ullah, H.; BaekSeo, S. How to do structural validity of a system dynamics type simulation model: The case of an energy policy model. Energy Policy 2010, 38, 2216–2224. [Google Scholar] [CrossRef]
- Barlas, Y. Multiple tests for validation of system dynamics type of simulation models. Eur. J. Oper. Res. 1989, 42, 59–87. [Google Scholar] [CrossRef]
- Zhang, Z.; Wang, W.; Cheng, M.; Liu, S.; Xu, J.; He, Y.; Meng, F. The contribution of residential coal combustion to PM 2.5, pollution over China’s Beijing-Tianjin-Hebei region in winter. Atmos. Environ. 2017, 159, 147–161. [Google Scholar] [CrossRef]
- Ikram, M.; Yan, Z.; Liu, Y.; Qu, W. Seasonal effects of temperature fluctuations on air quality and respiratory disease: A study in Beijing. Nat. Hazards 2015, 79, 833–853. [Google Scholar] [CrossRef]
- Zhu, L.; Gan, Q.; Liu, Y.; Yan, Z. The impact of foreign direct investment on SO2 emissions in the Beijing-Tianjin-Hebei region: A spatial econometric analysis. J. Clean. Prod. 2017, 166, 189–196. [Google Scholar] [CrossRef]
- Mensah, J.T. Carbon emissions, energy consumption and output: A threshold analysis on the causal dynamics in emerging African economies. Energy Policy 2014, 70, 172–182. [Google Scholar] [CrossRef]
- Zhao, H.; Zhang, Q.; Huo, H.; Lin, J.; Liu, Z.; Wang, H.; Guan, D.; He, K. Environment-economy tradeoff for Beijing-Tianjin-Hebei’s exports. Appl. Energy 2016, 184, 926–935. [Google Scholar] [CrossRef] [Green Version]


| Structures/Concepts | Remarks |
|---|---|
| Economic subsystem [21] | Structural formulation was adopted |
| Energy subsystem [25,26] | Structural formulation was adopted |
| Environment subsystem [9] | Causal structure was adopted |
| 2006 | 2007 | 2008 | 2009 | 2010 | 2011 | 2012 | 2013 | 2014 | 2015 | MAPE | |
|---|---|---|---|---|---|---|---|---|---|---|---|
| GDP (108 Yuan) | 24,048 | 28,706 | 33,845 | 36,910 | 43,732 | 52,074 | 57,348 | 62,472 | 66,474 | 69,359 | - |
| simulation results | 23,349 | 28,183 | 33,277 | 36,175 | 42,832 | 51,336 | 56,825 | 62,167 | 65,946 | 68,226 | 1.57% |
| Energy consumption (Million tons of standard coal) | 319.68 | 345.83 | 358.11 | 376.41 | 410.6 | 438.39 | 453.55 | 465.22 | 482.96 | 503.37 | - |
| simulation results | 311.83 | 334.26 | 345.72 | 370.31 | 400.42 | 432.94 | 446.26 | 457.24 | 479.66 | 495.43 | 2.02% |
| Energy intensity (Tons of standard coal/104 yuan) | 1.329 | 1.205 | 1.058 | 1.02 | 0.939 | 0.842 | 0.791 | 0.745 | 0.727 | 0.726 | - |
| simulation results | 1.3355 | 1.186 | 1.0389 | 1.0237 | 0.9349 | 0.8433 | 0.7853 | 0.7355 | 0.7274 | 0.7262 | 0.70% |
| Parameter | Value | Unit | Method of Calculation |
|---|---|---|---|
| GDP | 74,612.6 | Hundred million Yuan | Direct determination |
| Total population | 11,204.9 | 10,000 people | Direct determination |
| Investment in fixed assets | 54,430.8 | Hundred million Yuan | Direct determination |
| Labor force ratio | [1] of Appendix B | - | Table function |
| Rate of fixed assets investment | [2] of Appendix B | - | Table function |
| Labor force ratio of the primary industry | 38.1% | - | Average value |
| Labor force ratio of the secondary industry | 34.8% | - | Average value |
| Labor force ratio of the tertiary industry | 27.1% | - | Average value |
| Fixed assets proportion of the primary industry | 8.1% | - | Average value |
| Fixed assets proportion of the secondary industry | 56.8% | - | Average value |
| Fixed assets proportion of the tertiary industry | 35.1% | - | Average value |
| The proportion of industrial output accounted for output of the secondary industry | 91.4% | - | Average value |
| Population growth rate | 4.96% | - | Average value |
| Elasticity coefficient of labor force of the primary industry | −0.673 | - | Logical inference |
| Elasticity coefficient of labor force of the secondary industry | 0.544 | - | Logical inference |
| Elasticity coefficient of labor force of the tertiary industry | 0.659 | - | Logical inference |
| Elasticity coefficient of fixed assets of the primary industry | 0.341 | - | Logical inference |
| Elasticity coefficient of fixed assets of the secondary industry | 0.468 | - | Logical inference |
| Elasticity coefficient of fixed assets of the tertiary industry | 0.325 | - | Logical inference |
| Parameter | Value | Unit | Method of Calculation |
|---|---|---|---|
| Industrial investment per 10,000 Yuan of industrial output value | [3] of Appendix B | Million tons of standard coal/108 Yuan | Metering method |
| Proportion of fossil energy investment | [4] of Appendix B | - | Table function |
| Proportion of new energy investment | [5] of Appendix B | - | Table function |
| Supply capacity of fossil energy resources per unit of fixed assets | 54,716 | Million tons of standard coal/108 Yuan | Average value |
| Supply capacity of new energy resources per unit of fixed assets | 78,352 | Million tons of standard coal/108 Yuan | Average value |
| Life cycle of industrial fixed assets | 20 | Year | Average value |
| The impact of GDP on energy intensity | - | Logical inference | |
| Intensity of energy conservation policies | [6] of Appendix B | - | Table function |
| Coefficient of fossil fuel pollution | 0.67 | - | Logical inference |
| Parameter | Value | Unit | Method of Calculation |
|---|---|---|---|
| COD production per 10,000 Yuan of industrial output value | [7] of Appendix B | Ton/10,000 Yuan | Metering method |
| Air pollution production per 10,000 Yuan of industrial output value | [8] of Appendix B | Ton/10,000 Yuan | Metering method |
| Industrial solid waste generation per 10,000 Yuan of industrial output value | [9] of Appendix B | Ton/10,000 Yuan | Metering method |
| COD treatment capacity per 10,000 Yuan of investment | [10] of Appendix B | Ton/10,000 Yuan | Metering method |
| Air pollution treatment capacity per 10,000 Yuan of investment | [11] of Appendix B | Ton/10,000 Yuan | Metering method |
| Industrial solid waste generation treatment capacity per 10,000 Yuan of investment | [12] of Appendix B | Ton/10,000 Yuan | Metering method |
| Per capita living sewage quantity | 53.5 | Ton/Person | Average value |
| Investment proportion of environmental protection | 2.8% | - | Average value |
| COD concentration in domestic sewage | 350 | - | Average value |
| Self purification rate of COD | 39.2% | - | Average value |
| Self purification rate of air pollution | 24.7% | - | Average value |
| Treatment ratio of water pollution | 19.6% | - | Average value |
| Treatment ratio of air pollution | 33.6% | - | Average value |
| Treatment ratio of industrial solid waste | 46.8% | - | Average value |
| Water pollution coefficient | 0.35 | - | Logical inference |
| Air pollution coefficient | 0.81 | - | Logical inference |
| Industrial solid waste pollution coefficient | 0.66 | - | Logical inference |
| Year | Accumulation of Water Pollution (104 Ton) | Accumulation of Air Pollution (104 Ton) | Accumulation of Industrial Solid Waste (104 Ton) | Pollution Index |
|---|---|---|---|---|
| 2016 | 147,992 | 124.9 | 31,953 | 31.95 |
| 2017 | 154,474 | 130.4 | 33,352 | 34.82 |
| 2018 | 161,280 | 136.1 | 34,822 | 37.98 |
| 2019 | 168,426 | 142.2 | 36,365 | 41.47 |
| 2020 | 175,930 | 148.5 | 37,985 | 45.32 |
| 2021 | 183,808 | 155.2 | 39,686 | 49.56 |
| 2022 | 192,081 | 162.1 | 41,472 | 54.23 |
| 2023 | 200,767 | 169.5 | 43,347 | 59.38 |
| 2024 | 209,888 | 177.2 | 45,317 | 65.06 |
| 2025 | 219,464 | 185.3 | 47,384 | 71.32 |
© 2017 by the authors. Licensee MDPI, Basel, Switzerland. This article is an open access article distributed under the terms and conditions of the Creative Commons Attribution (CC BY) license (http://creativecommons.org/licenses/by/4.0/).
Share and Cite
Zuo, Y.; Shi, Y.-l.; Zhang, Y.-z. Research on the Sustainable Development of an Economic-Energy-Environment (3E) System Based on System Dynamics (SD): A Case Study of the Beijing-Tianjin-Hebei Region in China. Sustainability 2017, 9, 1727. https://doi.org/10.3390/su9101727
Zuo Y, Shi Y-l, Zhang Y-z. Research on the Sustainable Development of an Economic-Energy-Environment (3E) System Based on System Dynamics (SD): A Case Study of the Beijing-Tianjin-Hebei Region in China. Sustainability. 2017; 9(10):1727. https://doi.org/10.3390/su9101727
Chicago/Turabian StyleZuo, Yi, Ying-ling Shi, and Yu-zhuo Zhang. 2017. "Research on the Sustainable Development of an Economic-Energy-Environment (3E) System Based on System Dynamics (SD): A Case Study of the Beijing-Tianjin-Hebei Region in China" Sustainability 9, no. 10: 1727. https://doi.org/10.3390/su9101727