Resolving Stack Effect Problems in a High-Rise Office Building by Mechanical Pressurization

1
Department of Architectural Engineering, Graduate School, Hanyang University, Seoul 04763, Korea
2
Department of Architecture and Architectural Engineering, Hanyang University, ERICA Campus, Ansan, Gyeonggi-Do 15588, Korea
3
Korea Institute of Civil Engineering & Building Technology, 283 Goyangdae-Ro, Ilsanseo-gu, Goyang-Si, Gyeonggi-Do 10223, Korea
*
Author to whom correspondence should be addressed.
Sustainability 2017, 9(10), 1731; https://doi.org/10.3390/su9101731
Submission received: 5 September 2017
/
Revised: 19 September 2017
/
Accepted: 22 September 2017
/
Published: 26 September 2017
Abstract
:In high-rise buildings, the stack effect causes various problems, especially problems related to excessive pressure differences across main entrance doors and elevator doors, particularly in heating seasons. To reduce the stack effect, this study aims to find effective operation schemes for the HVAC systems in a 60-story commercial building, located in Seoul, Korea. Field measurements were conducted to identify the problems related to the stack effect in the building. Computer simulations were conducted to examine the effectiveness of various HVAC operation schemes in reducing the stack effect. Then, an optimum and effective operation scheme was adopted from the computer simulation results and applied in the field. The adopted scheme was used to pressurize the upper zone of the building. Through field application and an adjustment process, a proper amount of air volume was found to effectively pressurize the upper zone of this building, solving the problems related to the stack effect. The required air volume for pressurization was maintained in the building by reducing the volume of the exhaust air (EA) while maintaining a constant volume of outdoor air (OA).
1. Introduction
Stack effect takes place in buildings due to buoyancy of heated air moving upward. The stack effect in buildings plays a positive role in intermediate and cooling seasons by increasing the natural ventilation through the buildings [1,2]. Buildings having an atrium space, large scale factory buildings having a high ceiling combined with operable openings, and solar chimneys are some good examples.
However, the stack effect in high-rise buildings in heating seasons causes various problems [3] such as malfunctioning elevator doors, annoying whistling noises in elevator halls, increased infiltration through the main entrance, increased heating loads, and the rapid spread of fire and smoke if a fire breaks out [4,5]. Therefore, many studies have been conducted to develop architectural and mechanical methods to reduce the stack effect in high-rise buildings [3,4,5,6,7,8,9,10,11,12,13,14,15,16,17,18,19,20,21,22,23,24].
In Korea, many high-rise buildings have been built for residential and commercial uses since the early 1980s. Up until the early 2000s, many of these high-rise buildings were designed without considering proper architectural and mechanical methods to reduce the stack effect. As a result, many of these buildings have been remodeled or are being investigated in an attempt to solve problems related to the stack effect, and the stack effect has emerged as an important issue in designing high-rise buildings.
According to previous studies [3,4,6,7,8,9,10], one effective architectural measure to reduce the stack effect is to increase the number of walls between the elevator shaft and the building envelope. However, many commercial buildings require more openness on typical floors for office spaces consisting of multiple work stations divided by low-height interior partitions. For these types of buildings, mechanical methods may be considered to reduce infiltration at floors below the neutral pressure level, such as pressurization of the building interior by HVAC systems [3,4,5,11,12,13,14,15,16].
The goal of this study was to find effective operation schemes for the HVAC systems in a 60-story commercial building located in Seoul, Korea to reduce the stack effect during the heating season. The building had suffered a severe stack effect problem related to large pressure differences across the elevator doors on the first floor. HVAC operation schemes were developed to reduce this problem by pressurizing floors in a vertical range; various floor ranges were considered and compared, as well as various quantities of air for pressurization. This study was conducted by taking the following steps.
- (1)
- Field measurements were conducted to identify the magnitude of the pressure difference causing the malfunction of elevator doors in this particular building.
- (2)
- Computer simulations were conducted to identify the proper vertical grouping of floors and the required volume of air for pressurization by the HVAC systems considering the winter outdoor design dry bulb temperature condition in the Seoul area.
- (3)
- The results from the computer simulations were then applied to the actual building by pressurizing the upper part of the building, including floors 40–60. During this phase, the actual volume of air for pressurization was adjusted according to measured pressure differences across the elevator doors.
2. Literature Review
2.1. Stack Effect in High-Rise Buildings
When the stack effect occurs in a high-rise open-plan office building, the greatest pressure differences across the elevator doors are usually measured at the first floor and the top floor (Figure 1a). However, when the upper floors are pressurized by the HVAC systems, the air flow rate from the elevator shaft to the office spaces on the upper floors is reduced, and the air flow rate from the lobby space on the first floor to the elevator shaft is also reduced (Figure 1b). This method can greatly alleviate problems such as malfunctioning elevator doors and noise by reducing the pressure differences across the elevator shaft. Pressurizing every floor uniformly has little effect on the pressure differences across the floors and vertical shafts. If stack pressure across the entrance door is a concern, the pressurization of the first floor is often adopted [17]. In addition, when the inside of an elevator or stairwell shaft is pressurized, the pressure difference across the elevator doors on the first floor decreases while one on each floor of the neutral pressure level or above increases [18,19].
2.2. Previous Studies
Tamura [4] used field measurements and computer simulations to identify various pressure profiles under which the stack effect occurs according to the outdoor temperature, partitioning schemes, and operation conditions of the ventilation systems. Tamura developed a stack effect evaluation index called the thermal draft coefficient (TDC). The TDC indicates the level of air-tightness of the building envelope relative to the interior divisions. In that study, various architectural and mechanical measures were suggested to reduce the stack effect. While Tamura and Wilson originally applied the TDC concept to a whole building, Hayakaya et al. [6] applied the TDC to individual floors. Jo et al. [7] evaluated the characteristics of pressure distributions in high-rise residential buildings according to interior partitioning and elevator zoning schemes, and suggested a separation method by installing so-called “air lock doors” between the elevator doors and entrances to the residential units to reduce the pressure differences across those doors. Lstiburek [8] suggested the inclusion of air barriers to control infiltration and exfiltration, thereby maintaining the air-tightness of the interior spaces and the building as a whole. Based on the information and the design guidelines suggested by these studies to reduce the stack effect, most high-rise buildings recently built in Korea have been designed to include various architectural measures such as air-tightened building envelopes, revolving doors for the main entrance, air-lock doors for elevator halls, dedicated elevators for underground parking lots, and vertical zoning of elevator shafts.
These architectural measures have practically solved stack effect problems in high-rise residential buildings, in which numerous walls separate the housing units. However, because commercial buildings have many open-plan office spaces, the stack effect in these buildings has not been effectively reduced by architectural measures alone. Therefore, other measures to reduce the stack effect in high-rise commercial buildings have been developed and applied to several buildings. These measures include natural or mechanical cooling of elevator shafts and mechanical pressurization of elevator shafts and office spaces. Yu et al. [9] suggested that elevator shafts should be located in the perimeter zone to lower the air temperature within elevator shafts. In the study, stack effects were measured and compared between an elevator shaft located in the core zone and another one located in the perimeter zone with a glass wall exposed to the outdoors. The study found that the perimeter shaft had a much weaker stack effect owing to the lower air temperature within the shaft, resulting in a pressure difference across the elevator door in the perimeter shaft that is about half that of the core shaft. Lee et al. [20] conducted computer simulations and measurements of a building with multiple elevator shafts, located in Seoul, to investigate the effectiveness of mechanically cooling the elevator shafts with cold OA to reduce the pressure difference across elevator doors. In the computer simulations, the pressure difference was reduced by about 27% by cooling the elevator shafts from 22 °C to 12 °C; field measurements showed a reduction of about 25% in air velocity through the elevator door on the first floor and by about 10% on the upper floors when the elevator shafts were cooled. However, this method requires extra building space for fan systems and ductwork, which should be prepared from the design stages, and also incurs extra costs for the mechanical systems. Therefore, this method may not be a practical solution for existing high-rise buildings if there is not enough space to accommodate the added mechanical systems and ductwork.
Some notable studies [3,4,5,11,12,13,14,15,16] mostly related to mechanical measures to reduce stack effect were conducted with various operation schemes using the HVAC systems to pressurize building spaces. Tamura and Wilson [11] used the ventilation system to reduce the air pressure in the upper zone and increase the pressure in the lower zone to reduce infiltration through the building skins. As a result, the operation could reduce infiltrated air volume by reducing the pressure differences across the building skins, but the pressure differences across the vertical shafts, including elevator doors and stairwell doors, increased.
On the other hand, Tamblyn [12] suggested increasing air pressure in the upper zone and decreasing pressure in the lower zone in order to reduce the pressure difference across the elevator shaft. Tamblyn emphasized the importance of airtightness of the building envelope to suppress infiltration, which might increase due to the lowered interior air pressure at the lower zone.
In the research project conducted by ASHRAE [13] for an existing high-rise building, the upper zone and mid zone were pressurized and the lower zone excluding the first floor for the lobby was depressurized. The results showed that the pressure differences across the elevator doors for the upper zone, mid zone, and the lobby floor were reduced. However, it was found that the pressure differences across the elevator doors for the lower zone exceeded 25 Pa, which was known as the maximum pressure difference that does not cause the malfunction of the elevator doors. The research suggested that the mechanical balancing of air pressures for a limited number of floors at the top and bottom would be effective for buildings with loose airtight skins and buildings of more than 180 m in height.
From these previous studies, it was revealed that the depressurization of the lower zone caused high pressure differences across the elevator doors and building envelope for the lower zone. Therefore, pressurization of the upper zone only was adopted and tested in this study. Then, this study focused on finding the optimum vertical floor ranges and volumes of air for pressurization.
3. Methods
3.1. Identifying Stack Effect Problems by Field Measurements
A series of field measurements were conducted in a high-rise office building located in Seoul, Korea to identify problems related to the stack effect. As shown in Figure 2, the building has a total height of 245 m, including the lobby height of 9 m and a typical floor height of 4 m. The area of the lobby on the first floor is 2250 m2, and the areas of most floors vary from 1800 to 2250 m2, varying due to the curved shape of the building. The total volume of the building is about 500,000 m3. The passenger elevator shafts are designed for three separate vertical zones: the low-rise zone elevators serve Floors 1–20, mid-rise zone elevators depart from the first floor and stop at Floors 20–37, and high-rise zone elevators depart from the first floor and stop at the 37th floor and Floors 40–60. The 38th, 39th, 61st and 62nd floors are used as mechanical rooms, so the passenger elevators do not stop at these floors. In addition, two emergency staircases serve all 60 floors.
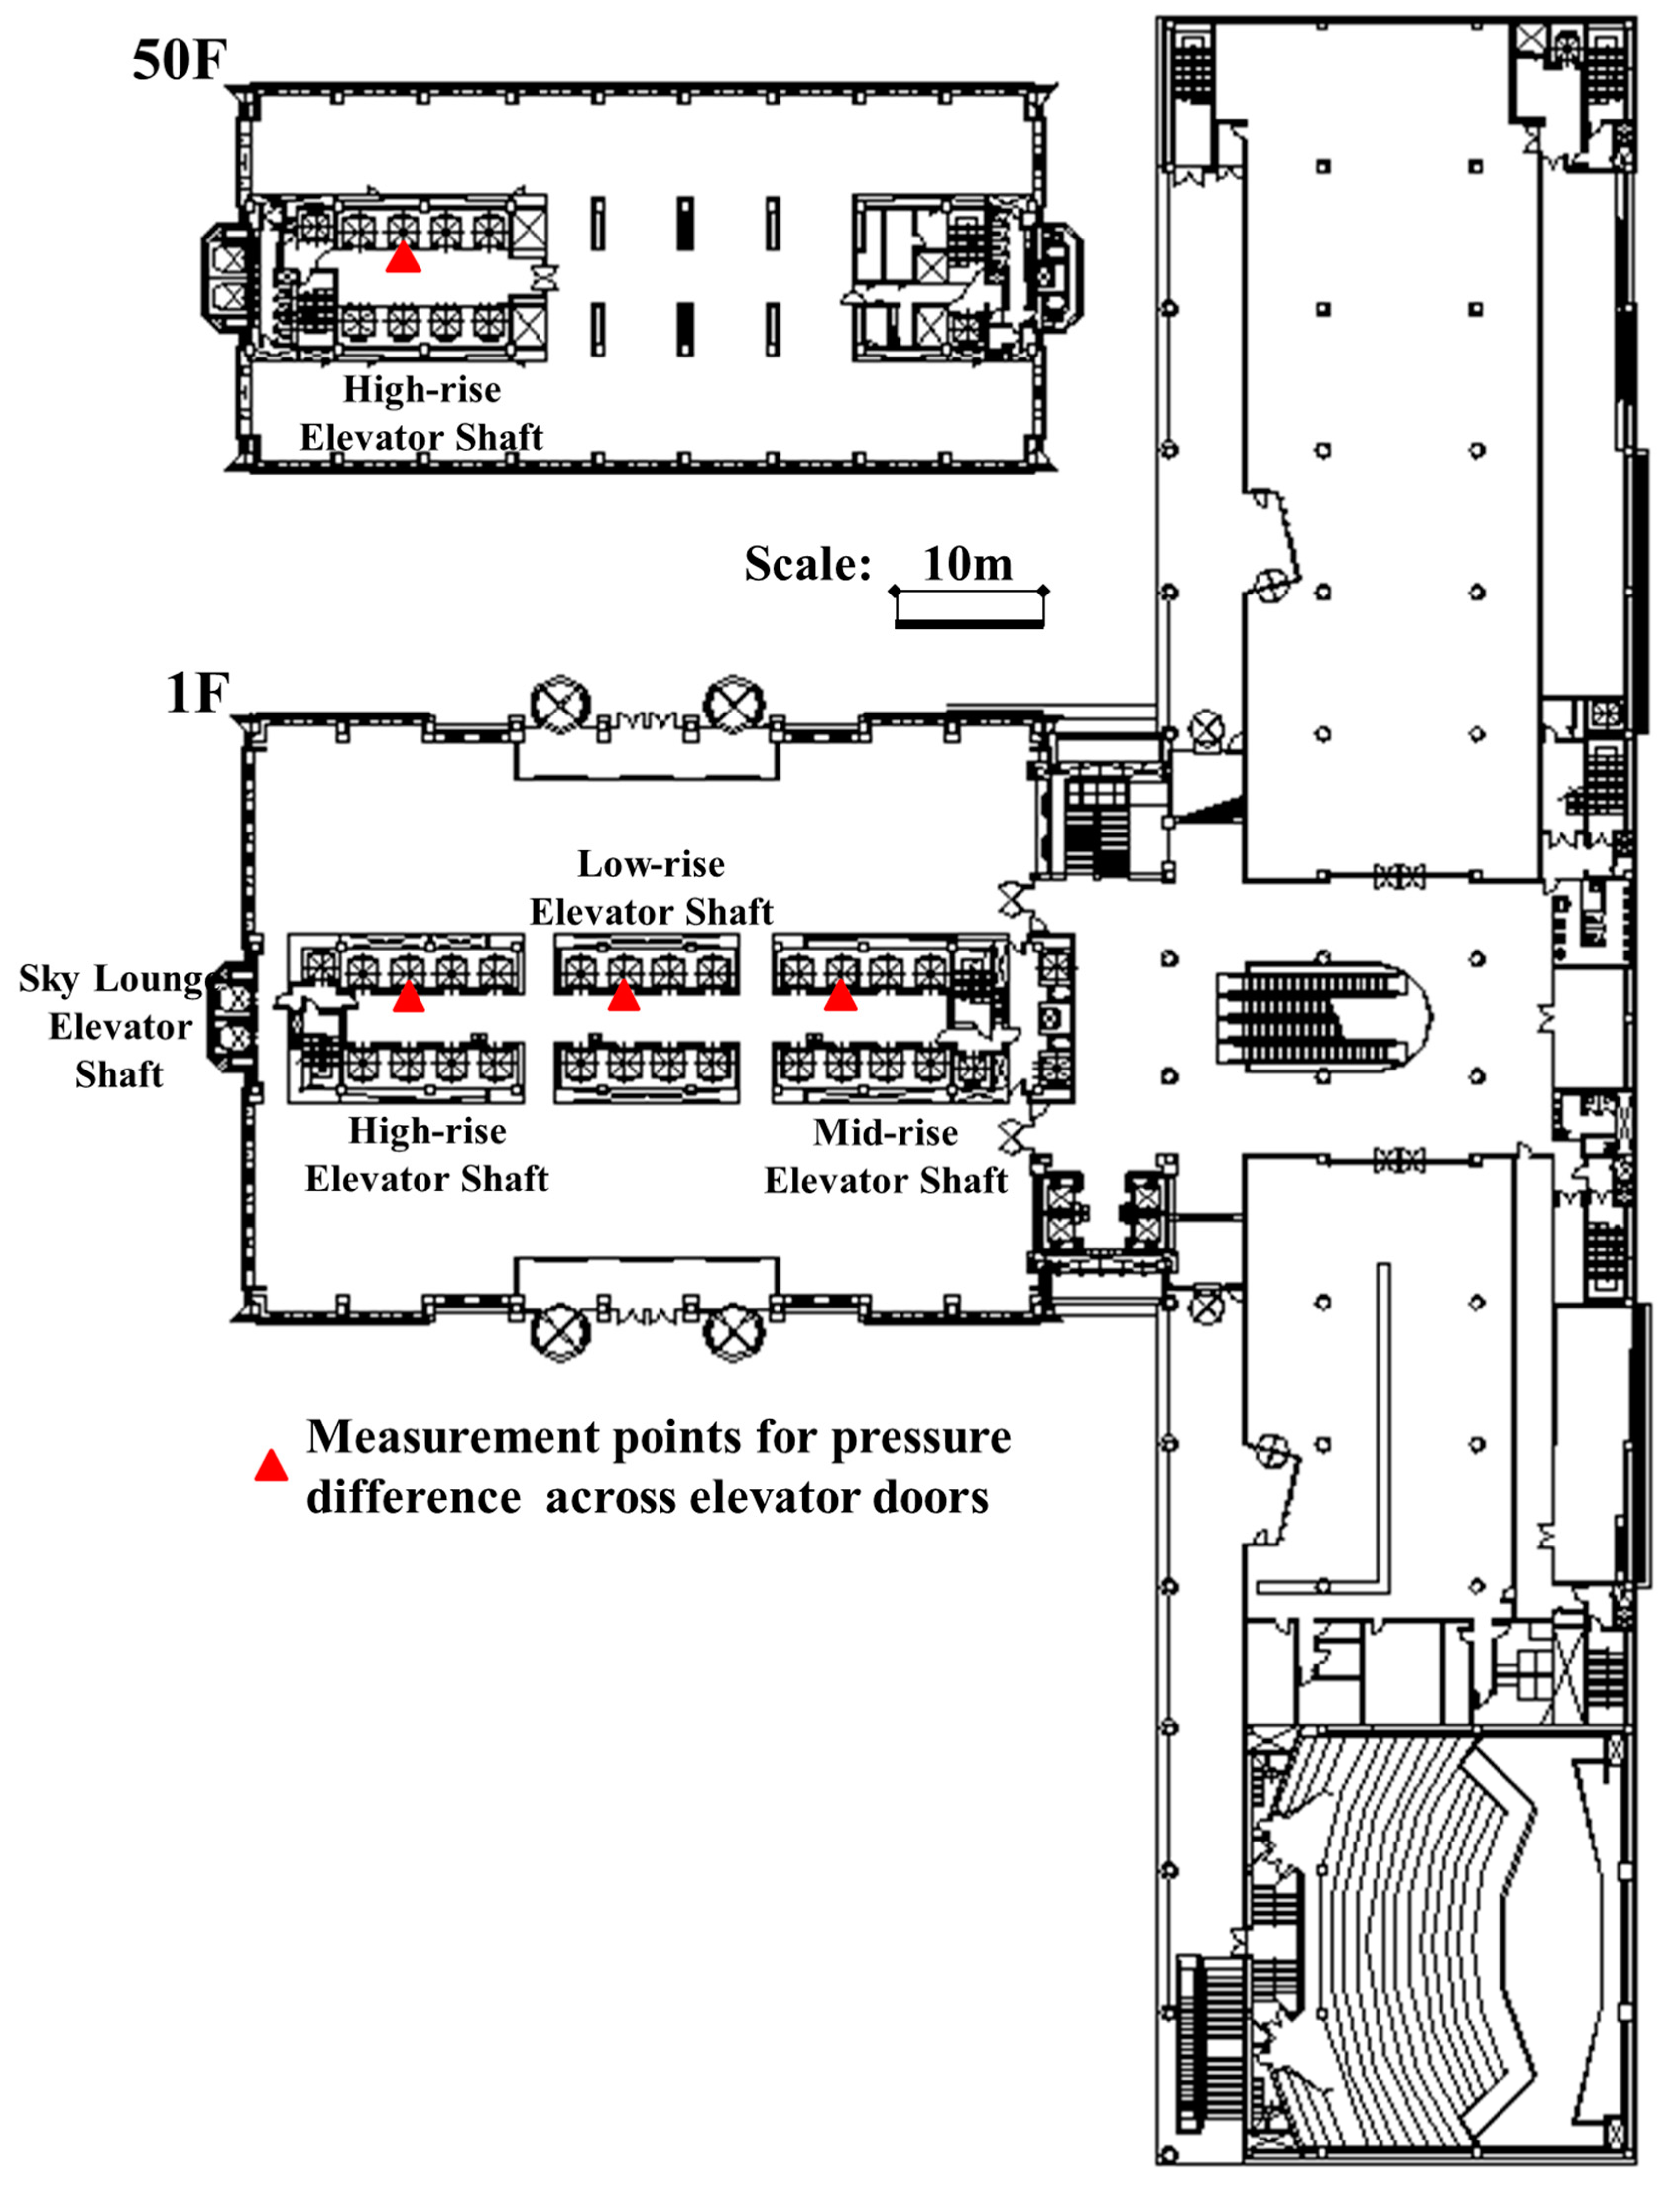
Measurements of pressure differences (ΔPs) across the elevator doors were conducted on selected floors between the first and 60th floors: Floors 1, 4, 8, 12, 16, 20, 25, 29, 33, 37, 41, 45, 48, 52 and 56. During the measurements, the outdoor and indoor air temperatures were, respectively, −5.2 °C and 22 °C, and the outdoor wind velocity was less than 1 m/s at a height of 16 m from the ground level, which means that external wind pressure on the building was negligible. Figure 3 shows floor plans of the first floor and a typical floor (50th floor) between the 40th and 60th floors of the test building, including the measurement points.
Figure 4 shows the measured ΔPs across the elevator doors at different floors and shafts. The greatest ΔP was 121 Pa across one of the first-floor doors of the high-rise elevator shaft. When the ΔP was recorded at 121 Pa, the elevator doors for the high-rise elevator shaft on the first floor were not closed. These malfunctions completely ceased when the ΔP was reduced to about 100 Pa. This value was much greater than the maximum value of 25 Pa recommended by ASHRAE [13] because the elevator doors installed on the first floor of this building were manufactured to properly operate at large ΔP across the doors that exceeded ASHARE standards. The ΔP for the low-rise and mid-rise elevator doors on the first floor were measured as −25 Pa and 52 Pa, respectively. Therefore, in this study, the evaluation criterion for pressure difference was set to 100 Pa.
3.2. Computer Simulations of HVAC Operations
An initial computer simulation was conducted to validate the accuracy of the computer model by comparing the calculated results with the results obtained from the initial measurements mentioned above for the existing conditions without pressurization when the outdoor and indoor air temperatures were −5.2 °C and 22 °C, respectively.
3.2.1. Validation of Computer Model
The computer program used in this study was CONTAM [25], developed by the National Institute of Standards and Technology (NIST) in the United States. Figure 5 shows CONTAM models for the first floor and a typical floor (50th floor) serviced by the high-rise elevator shaft. The computer model includes major elevator shafts, stairwell shafts, ceiling-mounted air diffusers, doors for the office zones and the building envelope.
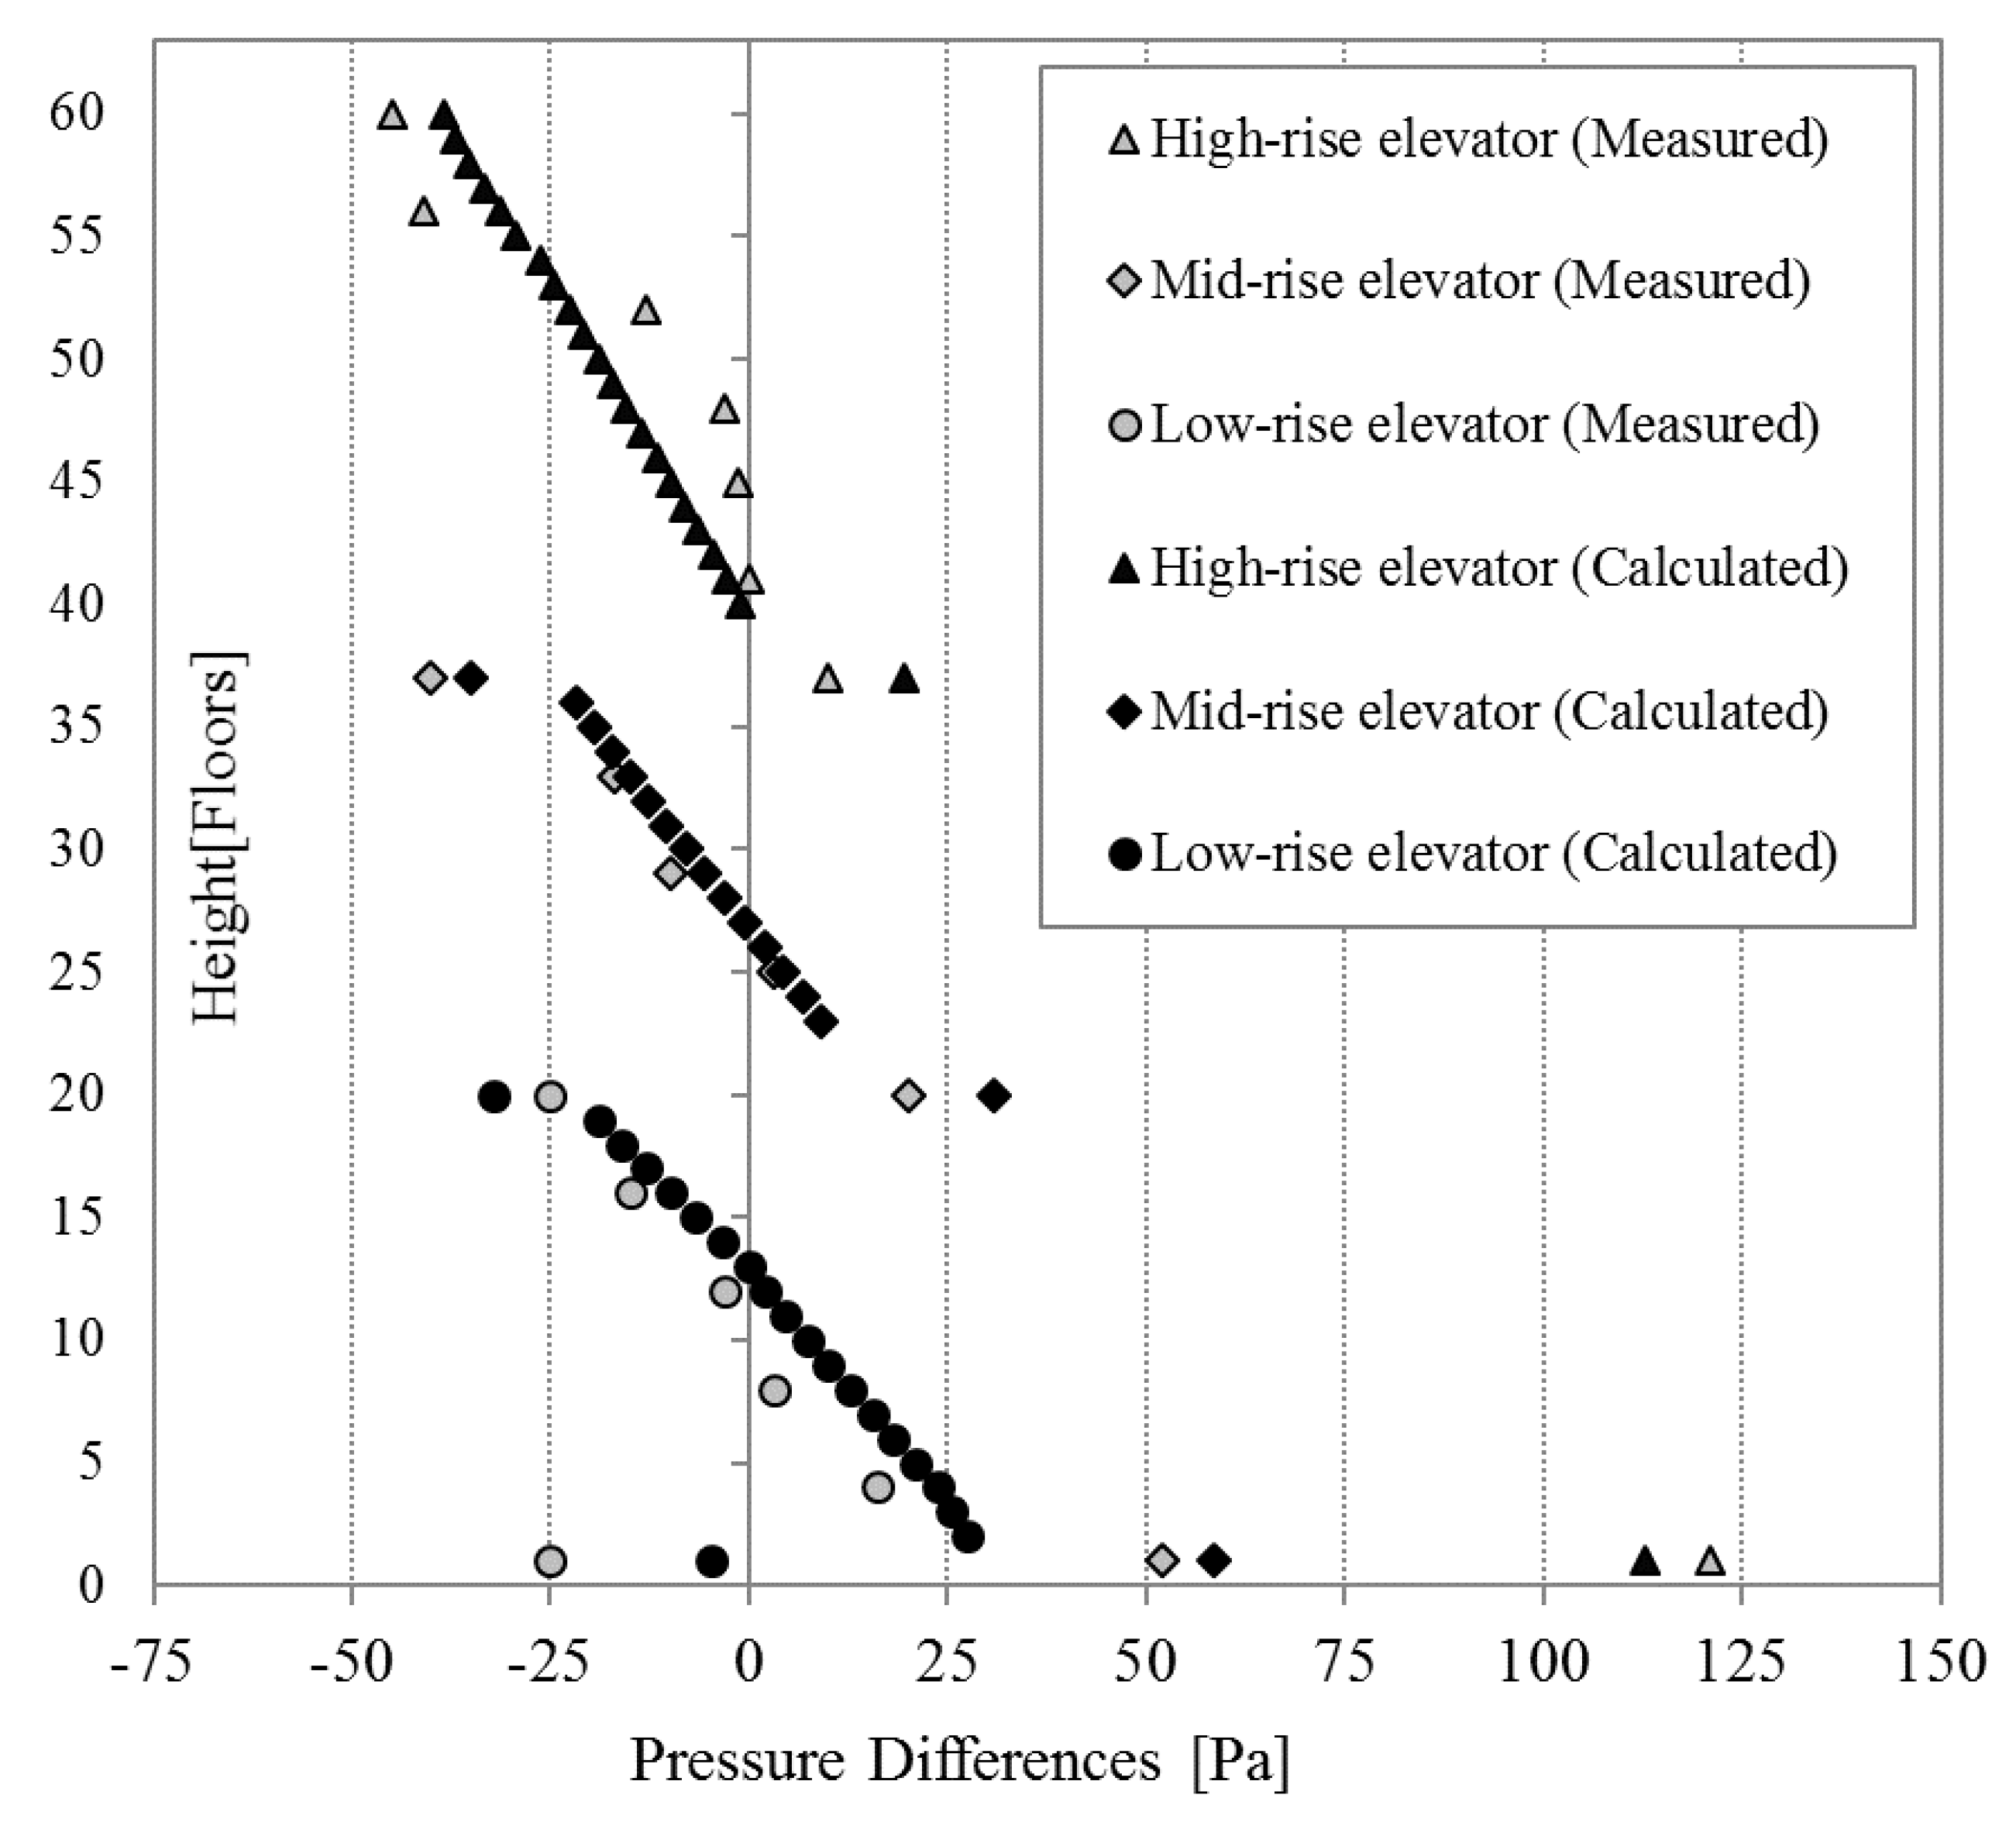
Table 1 shows the air leakage data for the computer simulation which were measured values or values recommended by Tamura [4] and ASHRAE [26]. Figure 6 shows the measured and calculated ΔPs. As shown in the figure, the ΔP profiles of the two values showed a close pattern and the relative error between the greatest measured and calculated ΔPs was 7%.
3.2.2. Computer Simulation
As mentioned above, this study suggested pressurization of the upper part of the building by the HVAC systems to reduce the great ΔPs across the elevator doors that were confirmed by field measurements. In this study, the group of floors on the upper part of the building to be pressurized was determined through computer simulations. In addition, the required air volume for pressurization (VPA) was also determined.
The design outdoor and indoor air temperatures for heating in the computer simulations were −11.3 °C and 20 °C [27], respectively. The outdoor wind velocity was set to 0 m/s to eliminate the effects of external wind. Table 2 shows the pressurization conditions for different groups of floors. The base case refers to the existing condition without pressurization. Cases 1–3 involve various pressurization conditions. Case 1 was where the whole building was pressurized. Case 2 was where Floors 23–60 were pressurized, where the mid-rise and high-rise elevators were operated. In Case 2, Floors 38 and 39 were excluded because they are mechanical floors. Case 3 was where Floors 40–60 were pressurized, where only the high-rise elevators were operated. For each case, HVAC operations were simulated with three different VPA volumes; these are denoted as A, B, and C in the case names. For Cases 1–3, the respective volumes of VPA of 3000, 6000 and 9000 m3/h were used for each floor.
3.2.3. Simulation Results
Figure 7, Figure 8 and Figure 9 show the simulation results of ΔP across the elevator doors obtained from Cases 1, 2, and 3 compared to the base case. As shown in the figures, most of the ΔPs across the elevator doors except for the high-rise elevator doors on the first floor were smaller than 100 Pa. Therefore, only the ΔPs across the high-rise elevator doors on the first floor were summarized in Table 3 with the required air volume for each case. As shown in the table, ΔP for the base case was 141.5 Pa, exceeding the threshold of 100 Pa.
When the whole building was pressurized, ΔP was smaller than 100 Pa (96.9 Pa) for Case 1B and the required total air volume was calculated as 360,000 m3/h. When the mid zone (Floors 23–37) and upper zone (Floors 40–60) were pressurized, ΔP was 87.6 Pa for Case 2B and the required total air volume was 216,000 m3/h. Finally, ΔP and the total air volume were further reduced to 89.3 Pa and 126,000 m3/h, respectively for Case 3B, in which only the upper zone was pressurized. From this comparative computer simulation process, Case 3B was selected as a candidate pressurization scheme, because this scheme required a comparatively smaller volume of air than the other schemes did. However, Case 3B could not be considered an optimum scheme because ΔP (89.3 Pa) was noticeably smaller than 100 Pa, suggesting the possibility of further reducing the total air volume.
Therefore, further computer simulations were performed to find an optimum scheme by reducing the air volume for pressurization until ΔP became smaller than but closer to 100 Pa. Finally, it was found that when the total air volume was reduced to 105,000 m3/h, the ΔP was increased to 99.8 Pa. Figure 10 shows the floor-by-floor distributions of ΔP across the elevator doors due to this final pressurization scheme.
3.3. Field Application and Adjustment
3.3.1. Implementing the Simulation Result in an Actual Building
The optimum pressurization scheme identified by the computer simulation was implemented in an actual building by controlling the HVAC system, shown schematically in Figure 11. The diagram represents the groups of fans and dampers for the pressurized zone (Floors 40–60). It shows fans for the supply air (SA) and return air (RA) and various dampers for OA, recirculated air (CA) and EA. It also shows the dedicated exhaust fans for the rest rooms.
At first, a simple operation was tried by admitting outdoor air but not allowing exhaust air from the HVAC system and the restrooms in order to increase the air pressure in the office rooms. As depicted in Figure 11, only the SA fans were operated at a constant speed and the OA and CA dampers were operated to bring in outdoor air and circulate the air through the HVAC system, while the EA dampers were closed. At the same time, the RA fans and EA fans for the rest rooms were not operated. Then, measurements were conducted to examine if the evaluation criterion of 100 Pa or smaller for ΔP across high-rise elevator doors on the first floor was achieved. The measurements were conducted from 10:00 p.m. to 12:00 a.m. on 2 February 2012 when the outdoor air temperatures were between −10.6 and −11.2 °C, which were typical design outdoor temperatures in heating seasons for the Seoul area. The indoor temperature was maintained at 20 °C.
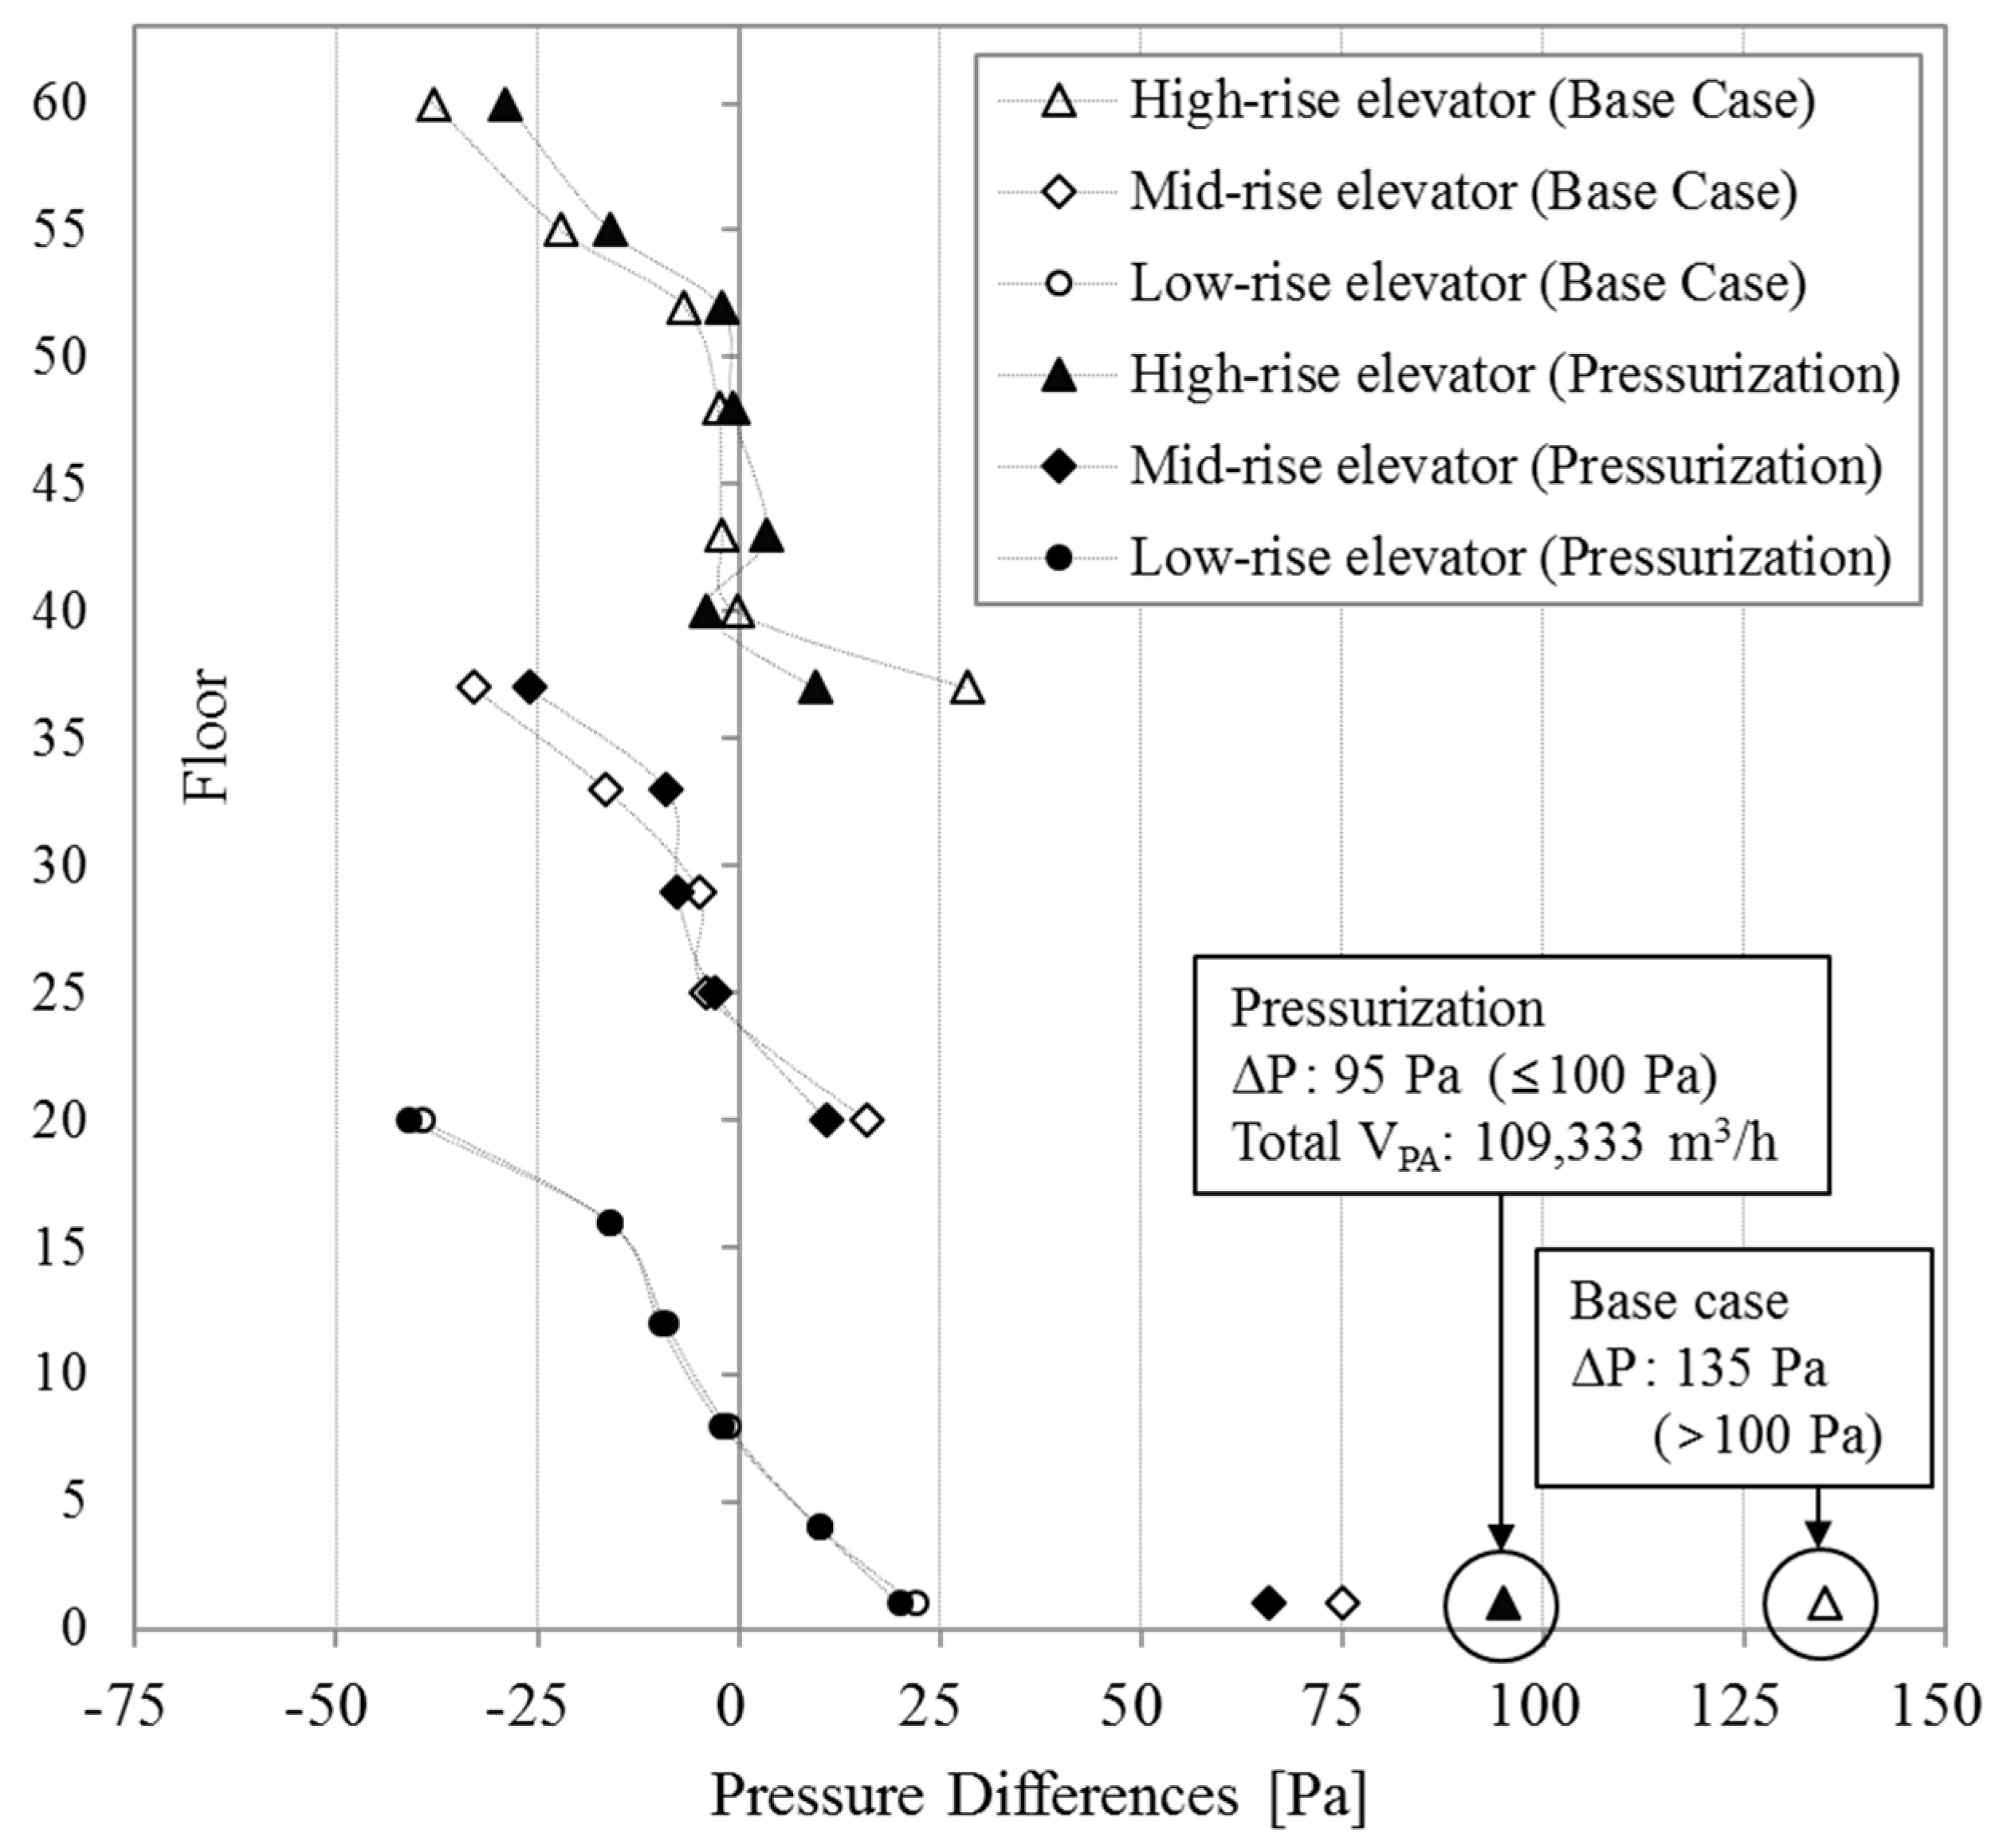
From this simple HVAC system operation, a VPA close to the simulation result was obtained as shown in Table 4. By controlling the HVAC system with the various combinations of damper operations, a VPA of 109,000 m3/h was obtained by opening the OA dampers by 40% and CA dampers by 60%, while the EA dampers were closed. The measured ΔP across the high-rise elevator doors on the first floor was 95 Pa by this operation, while it was 135 Pa and the elevator doors could not be closed when the target zone (Floors 40–60) was not pressurized. Figure 12 shows the floor-by-floor ΔPs before and after pressurization.
3.3.2. Actual HVAC Operation
After deciding the total VPA needed to solve the stack effect problem without considering the ventilation requirement as described above, actual volumes of OA and EA were adjusted according to the required ventilation. When the test building was ventilated as recommended by ASHRAE [28], in which 29 m3/h/person of fresh OA is required for about 200 people/floor in the pressurized zone consisting of 21 floors (Floors 40–60), the actual required OA was about 121,800 m3/h. Since the VPA for pressurization was 109,333 m3/h, the dampers for EA and exhaust fans for the restrooms, shown in Figure 12, were operated by the building operators such that the sum of EA from the HVAC system and the restrooms was maintained at about 12,467 m3/h.
4. Conclusions
This study was conducted to find an effective HVAC operation scheme to solve the stack effect problem in a 60-story commercial building located in Seoul, Korea. A series of field measurements were conducted in the winter to identify problems related to the stack effect. Then, a series of computer simulations were conducted to find an effective HVAC operation scheme to reduce the stack effect. The results from the computer simulations were implemented in the field and adjusted to find an optimum HVAC system operation scheme. The whole process and results can be summarized as follows:
- (1)
- From the initial field measurements, the evaluation criterion was established for the pressure difference (ΔP) across the high-rise elevator doors on the first floor to be below 100 Pa to ensure smooth opening and closing of these elevator doors.
- (2)
- The CONTAM computer program was used to find effective HVAC operation schemes. From this procedure, the decided upon scheme was to pressurize the upper zone of the building, from the 40th to 60th floor. Then, further computer simulations were conducted to find a scheme to minimize the total air volume for pressurization (VPA). The scheme selected as the most effective and efficient HVAC operation for this particular building was to pressurize the upper building zone (Floors 40–60) with 105,000 m3/h of VPA.
- (3)
- This optimized pressurization scheme identified by the computer simulation was implemented in the actual building by controlling the dampers and fans in the HVAC system. At first, a simple operation was attempted to bring in outdoor air (OA) while not allowing exhaust air (EA) in order to increase the air pressure in the office rooms. From this procedure, it was found that when the upper zone of the building (Floors 40–60) was pressurized with 109,333 m3/h of VPA under the winter design outdoor temperature condition in heating seasons in the Seoul area, the ΔP across the first-floor elevator door for the high-rise elevator shaft was reduced from 135 Pa to 95 Pa and the elevator door started closing smoothly.
- (4)
- Finally, the actual OA was adjusted to 121,800 m3/h by considering ventilation requirements and about 12,467 m3/h of air was exhausted from the zone.
Even though the specific number of floors to be pressurized and the specific air volume for pressurization were applicable to this specific building, the four steps summarized above can be applied to other high-rise buildings to identify and solve the stack effect related problems.
This study was conducted under the design outdoor air temperature condition in the Seoul area with negligible effects of external wind. Therefore, further work should be conducted to find more flexible, generalizable, and effective HVAC operation schemes for different boundary layer conditions such as outdoor air temperature, wind speed, and humidity, as discussed in the previous study [29].
Author Contributions
All authors contributed substantially to all aspects of this article.
Conflicts of Interest
The authors declare no conflict of interest.
References
- Chen, Y.; Tong, Z.; Malkawi, A. Investigating natural ventilation potentials across the globe: Regional and climatic variations. Build. Environ. 2017, 122, 386–396. [Google Scholar] [CrossRef]
- Oropeza-Perez, I.; Østergaard, P.A. Energy saving potential of utilizing natural ventilation under warm conditions—A case study of Mexico. Appl. Energy 2014, 130, 20–32. [Google Scholar] [CrossRef]
- Lovatt, J.E.; Wilson, A.G. Stack Effect in Tall Buildings; American Society of Heating, Refrigerating and Air-Conditioning Engineers, Inc.: Atlanta, GA, USA, 1994; pp. 420–431. [Google Scholar]
- Tamura, G.T. Smoke Movement and Control in High-Rise Buildings; National Fire Protection Association: Quincy, MA, USA, 1994. [Google Scholar]
- Klote, J.H.; Evans, D.H. A Guide to Smoke Control in the 2006 IBC; International Code Council: Washington, DC, USA, 2007. [Google Scholar]
- Hayakaya, S.; Togari, S. Study on the stack effect of tall office building (Part1). J. Archit. Inst. Jpn. 1988, 387, 42–52. [Google Scholar]
- Jo, J.H.; Lim, J.H.; Song, S.Y.; Yeo, M.S.; Kim, K.W. Characteristics of pressure distribution and solution to the problems caused by stack effect in high-rise residential buildings. Build. Environ. 2007, 42, 263–277. [Google Scholar] [CrossRef]
- Lstiburek, J.W. Understanding air barriers. ASHRAE J. 2005, 47, 24–30. [Google Scholar]
- Yu, J.Y.; Cho, D.W.; Song, K.D. Case Studies of the Design Alternatives to Minimize Stack Effect Problems in Tall Buildings. In Proceedings of the BUEE 2006, Tokyo, Japan, 10–13 July 2006; pp. 415–420. [Google Scholar]
- Yu, J.Y.; Cho, D.W.; Song, K.D. The Design Procedure for Reducing Stack Effect Problems in Tall Complex Building. In Proceedings of the 11th International Conference on Indoor Air Quality and Climate, Copenhagen, Denmark, 17–22 August 2008; p. 773. [Google Scholar]
- Tamura, G.T.; Wilson, A.G. Building pressures caused by chimney action and mechanical ventilation. ASHRAE Trans. 1967, 73, 2.2.1–2.2.12. [Google Scholar]
- Tamblyn, R.T. Coping with air pressure problems in tall buildings. ASHRAE Trans. 1991, 97, 824–827. [Google Scholar]
- ASHRAE. Field Verification of Problems Caused by Stack Effect in Tall Buildings; ASHRAE Research Project Report RP-661; American Society of Heating, Refrigerating, and Air-Conditioning Engineers: Atlanta, GA, USA, 1993. [Google Scholar]
- Ross, D.E. HVAC Design Guide for Tall Commercial Buildings; ASHRAE: Atlanta, GA, USA, 2004. [Google Scholar]
- Tamblyn, R.T. HVAC system effects for tall buildings. ASHRAE Trans. 1993, 99, 789–792. [Google Scholar]
- Klote, J.H. The ASHRAE Design manual for smoke control. Fire Saf. J. 1984, 7, 93–98. [Google Scholar] [CrossRef]
- ASHRAE. ASHRAE Handbook 2009 Fundamentals; ASHRAE: Atlanta, GA, USA, 2009. [Google Scholar]
- Schmidt, W. Stairwell and elevator shaft pressurization. Fire Saf. J. 1984, 7, 115–116. [Google Scholar] [CrossRef]
- Miller, R.S.; Beasley, D. On stairwell and elevator shaft pressurization for smoke control in tall buildings. Build. Environ. 2009, 44, 1306–1317. [Google Scholar] [CrossRef]
- Lee, J.H.; Song, D.S.; Park, D.R. A study on the development and application of the E/V shaft cooling system to reduce stack effect in high-rise buildings. Build. Environ. 2010, 45, 311–319. [Google Scholar] [CrossRef]
- Klote, J.H.; Milke, J.A. Principle of Smoke Management; ASHRAE: Atlanta, GA, USA, 2002. [Google Scholar]
- Klote, J.H. NISTIR 4588: A General Routine for Analysis of Stack Effect; NIST, U.S. Department of Commerce: Gaithersburg, MD, USA, 1991.
- NRC-CNRC. National Building Code of Canada; NRC-CNRC: Ottawa, ON, Canada, 2005. [Google Scholar]
- Lstiburek, J.W. Multifamily Buildings: Controlling Stack Effect-Driven Airflows. ASHRAE J. 2005, 47, 30–39. [Google Scholar]
- Dols, W.S.; Walton, G.N. NISTIR 7251-CONTAM User Guide and Program Documentation; National Institute of Standards and Technology: Gaithersburg, MD, USA, 2013. [Google Scholar]
- ASHRAE. ASHRAE Handbook 1997 Fundamentals; ASHRAE: Atlanta, GA, USA, 1997. [Google Scholar]
- Ministry of Land, Infrastructure and Transport. Energy Saving Design Standard of Building; Ministry of Land, Infrastructure and Transport: Sejong-si, Korea, 2017.
- ASHRAE. STD 62.1 Ventilation for Acceptable Indoor Air Quality; ASHRAE: Atlanta, GA, USA, 2004. [Google Scholar]
- Tong, Z.; Chen, Y.; Malkawi, A. Estimating natural ventilation potential for high-rise buildings considering boundary layer meteorology. Appl. Energy 2017, 193, 276–286. [Google Scholar] [CrossRef]
Figure 1.
Typical air pressure distributions in high-rise buildings when the stack effect exists with HVAC pressurization on floors above neutral pressure level: (a) without pressurization; and (b) with pressurization on upper floors.
Figure 1.
Typical air pressure distributions in high-rise buildings when the stack effect exists with HVAC pressurization on floors above neutral pressure level: (a) without pressurization; and (b) with pressurization on upper floors.
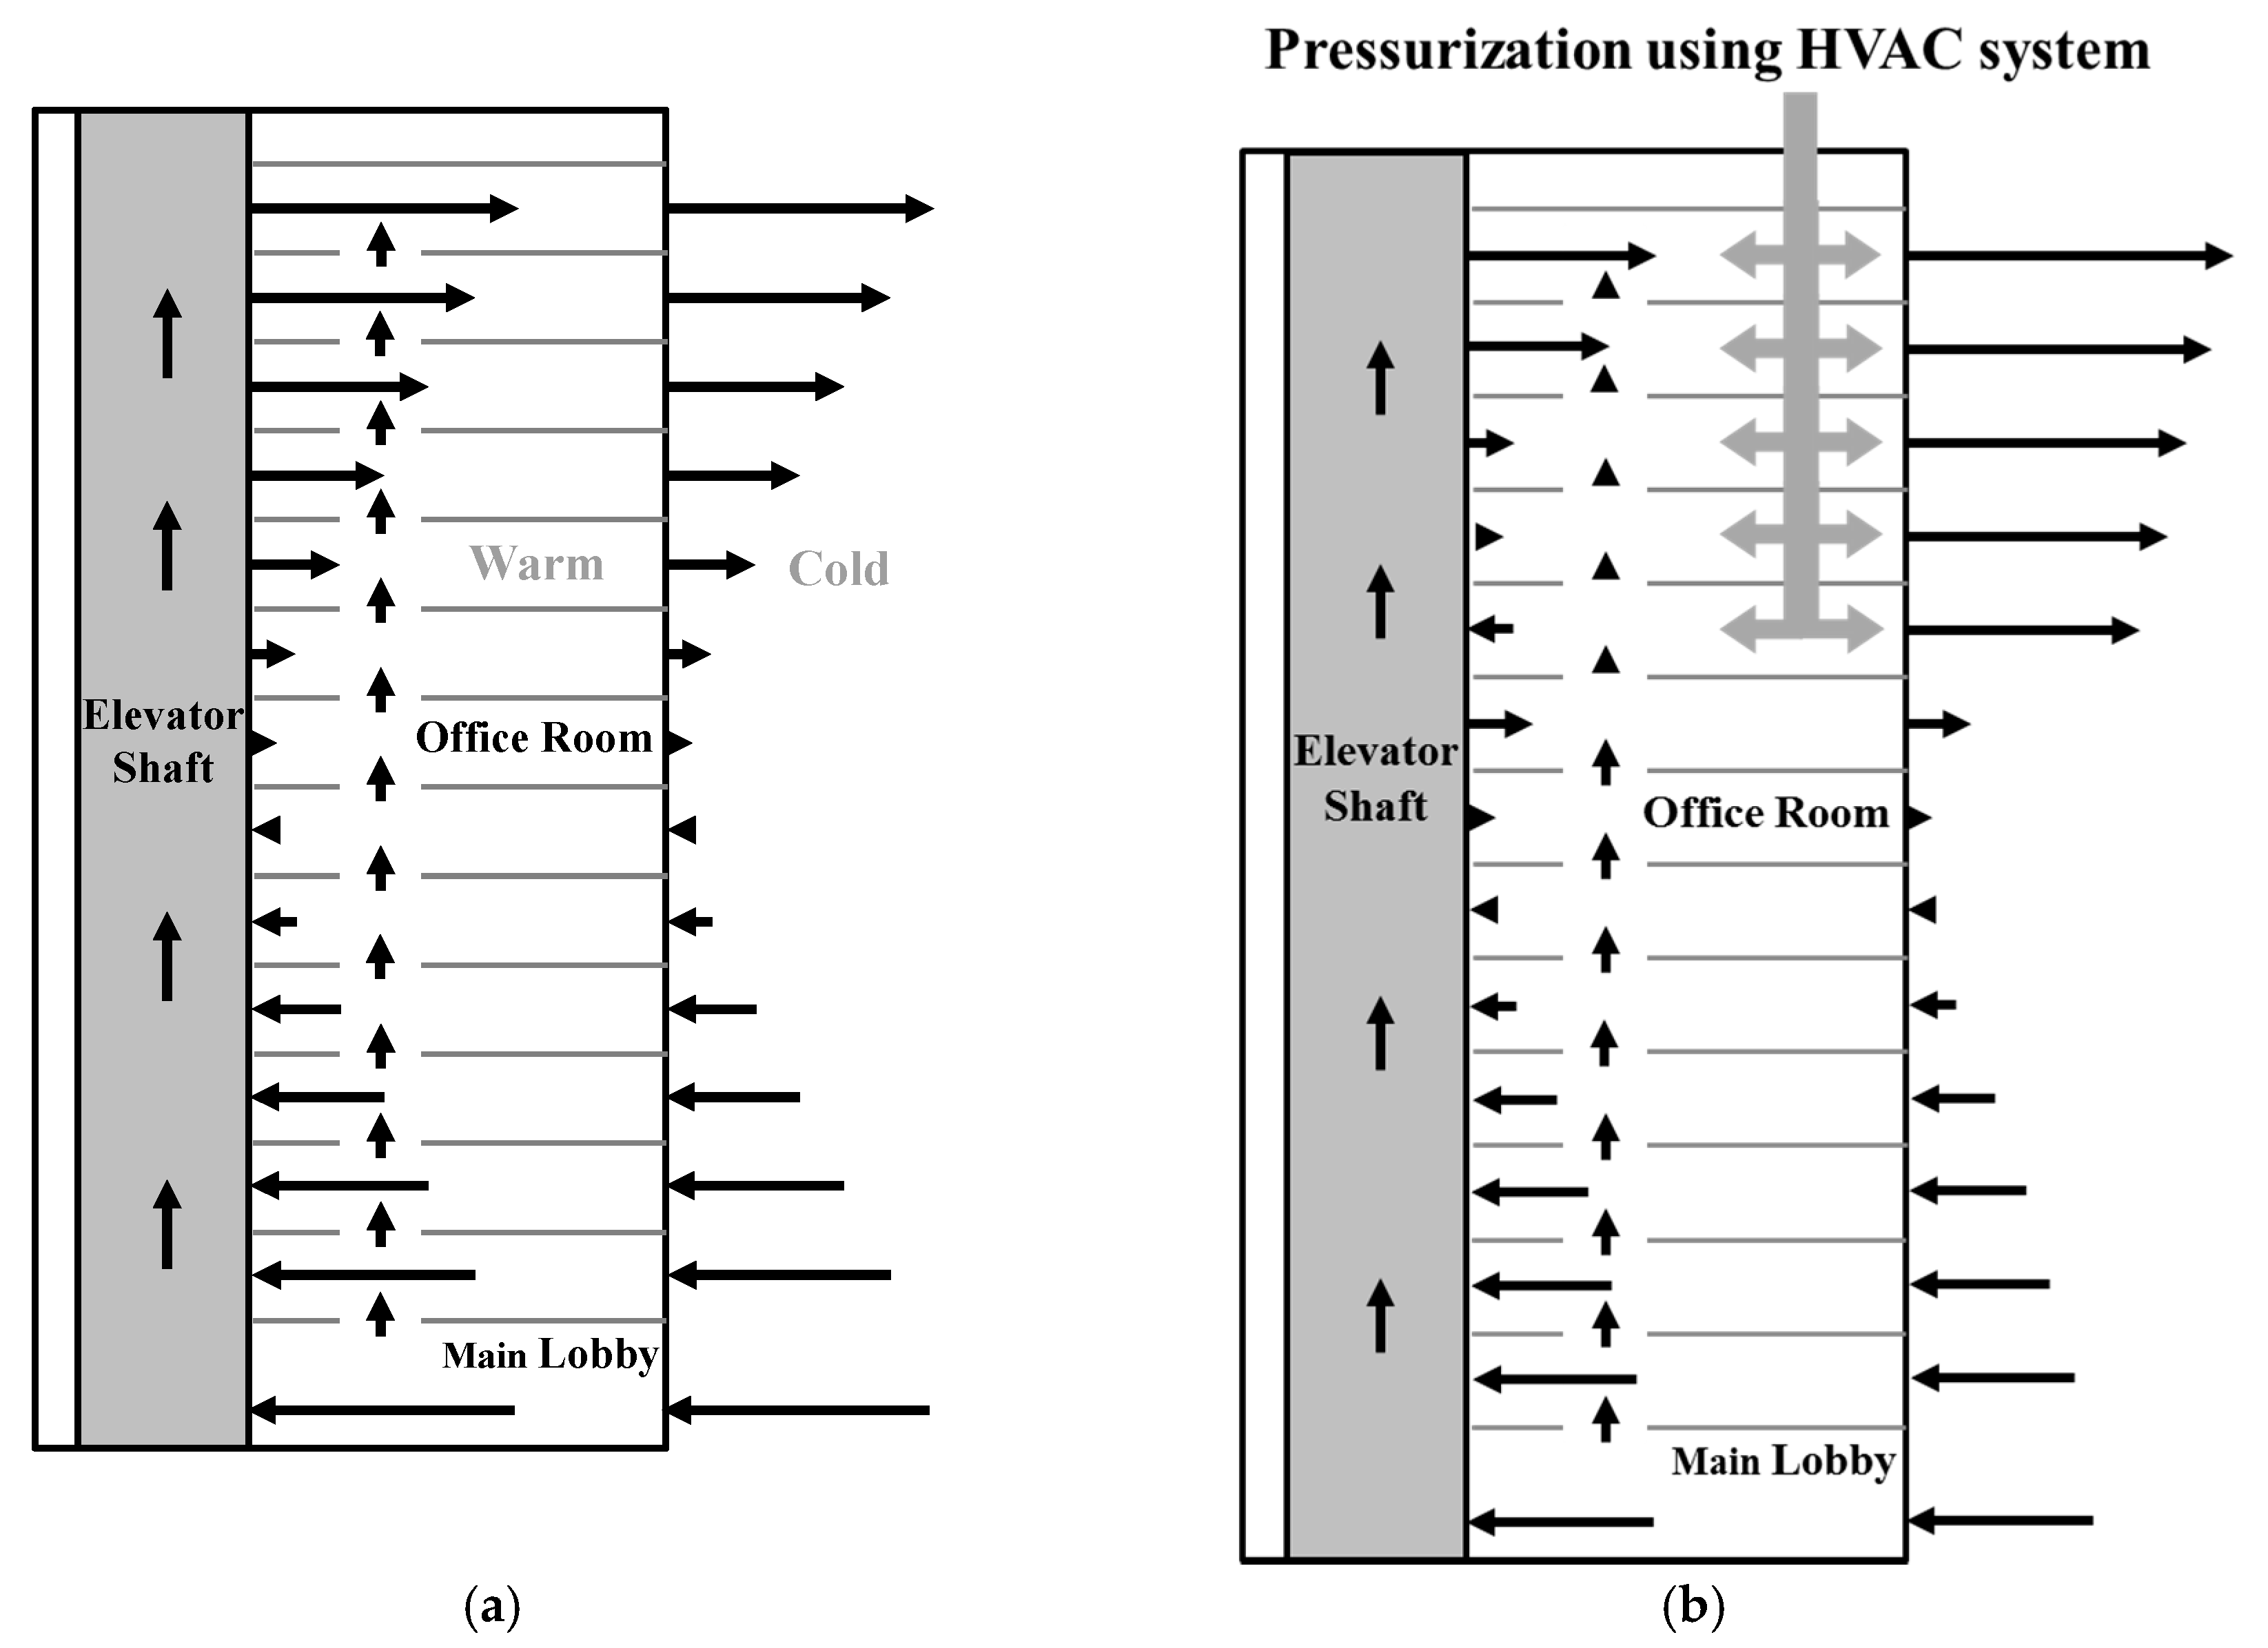
Figure 2.
Section and elevator shaft zones of the test building.

Figure 3.
Floor plans and measurement points on the 1st floor and a typical floor (50th floor) serviced by a high-rise elevator shaft.
Figure 3.
Floor plans and measurement points on the 1st floor and a typical floor (50th floor) serviced by a high-rise elevator shaft.

Figure 4.
Pressure differences across the elevator doors (outdoor air temperature: −5.2 °C, indoor air temperature: 22 °C).
Figure 4.
Pressure differences across the elevator doors (outdoor air temperature: −5.2 °C, indoor air temperature: 22 °C).
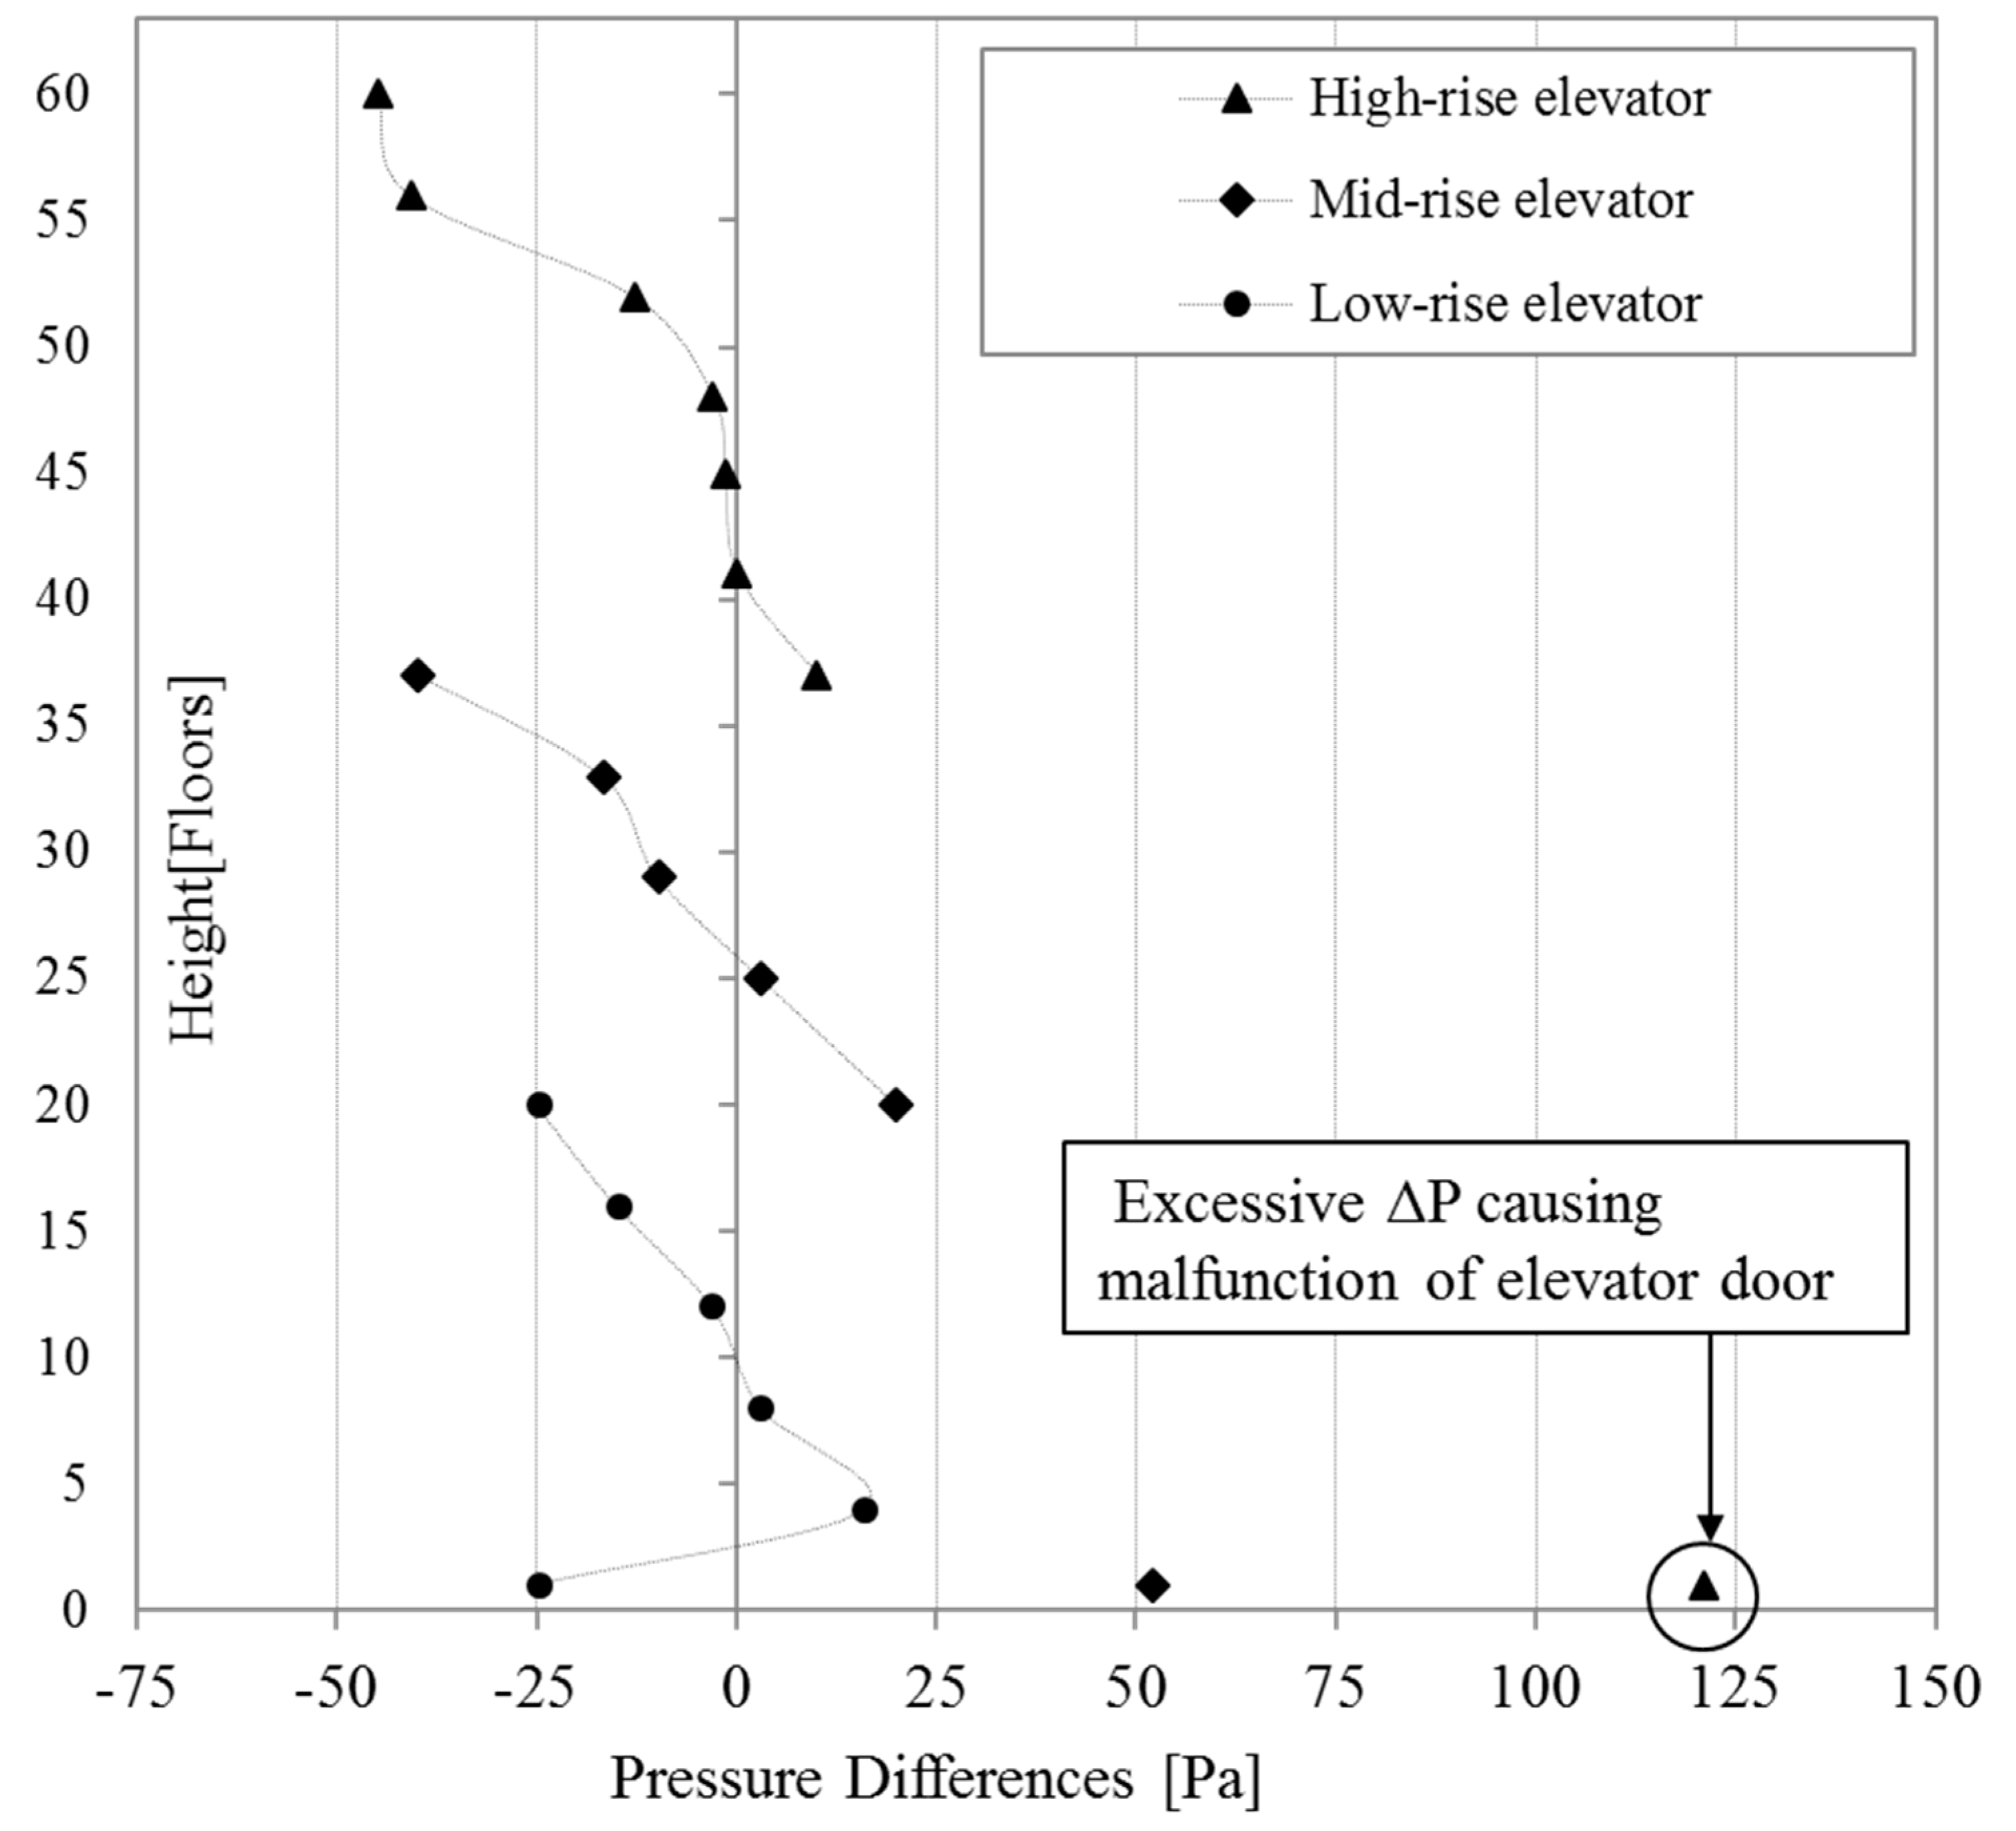
Figure 5.
The CONTAM model for the 1st floor and a typical floor (50th floor) serviced by a high-rise elevator shaft.
Figure 5.
The CONTAM model for the 1st floor and a typical floor (50th floor) serviced by a high-rise elevator shaft.
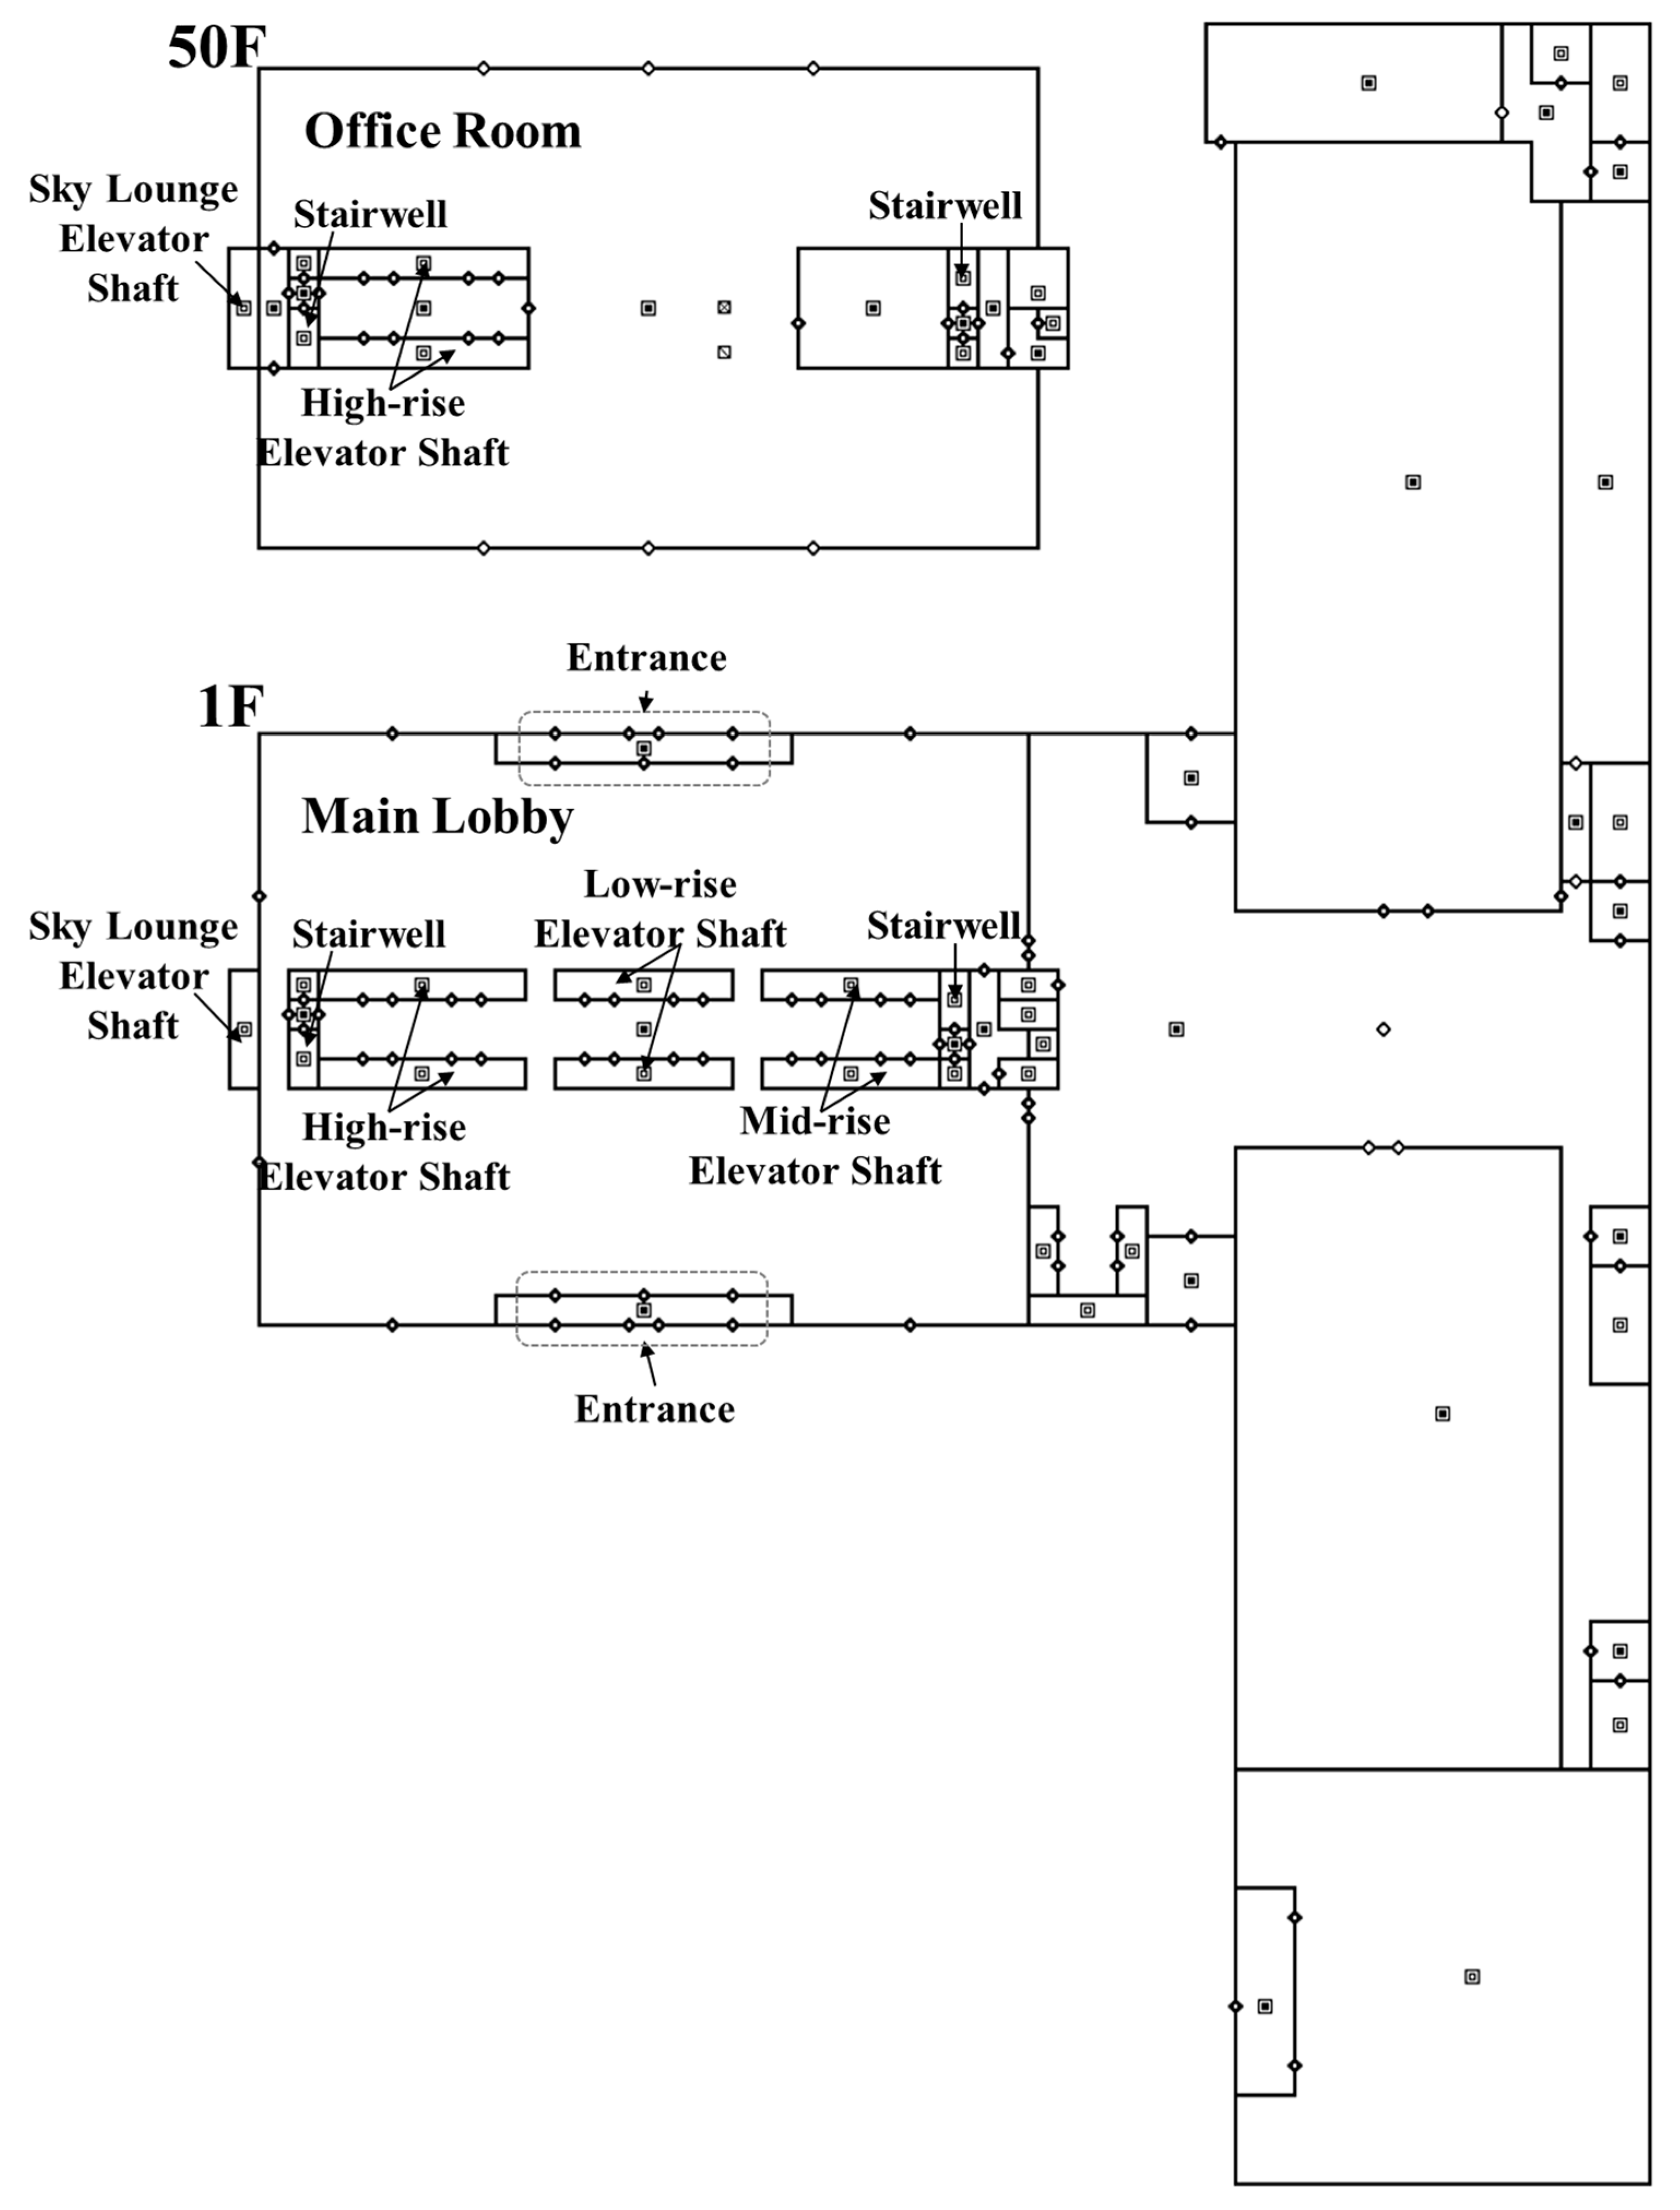
Figure 6.
Measured and calculated ΔPs without pressurization (outdoor air temperature: −5.2 °C, indoor air temperature: 22 °C).
Figure 6.
Measured and calculated ΔPs without pressurization (outdoor air temperature: −5.2 °C, indoor air temperature: 22 °C).

Figure 7.
Comparison of pressure differences across the elevator doors: Case 1 vs. the base case.
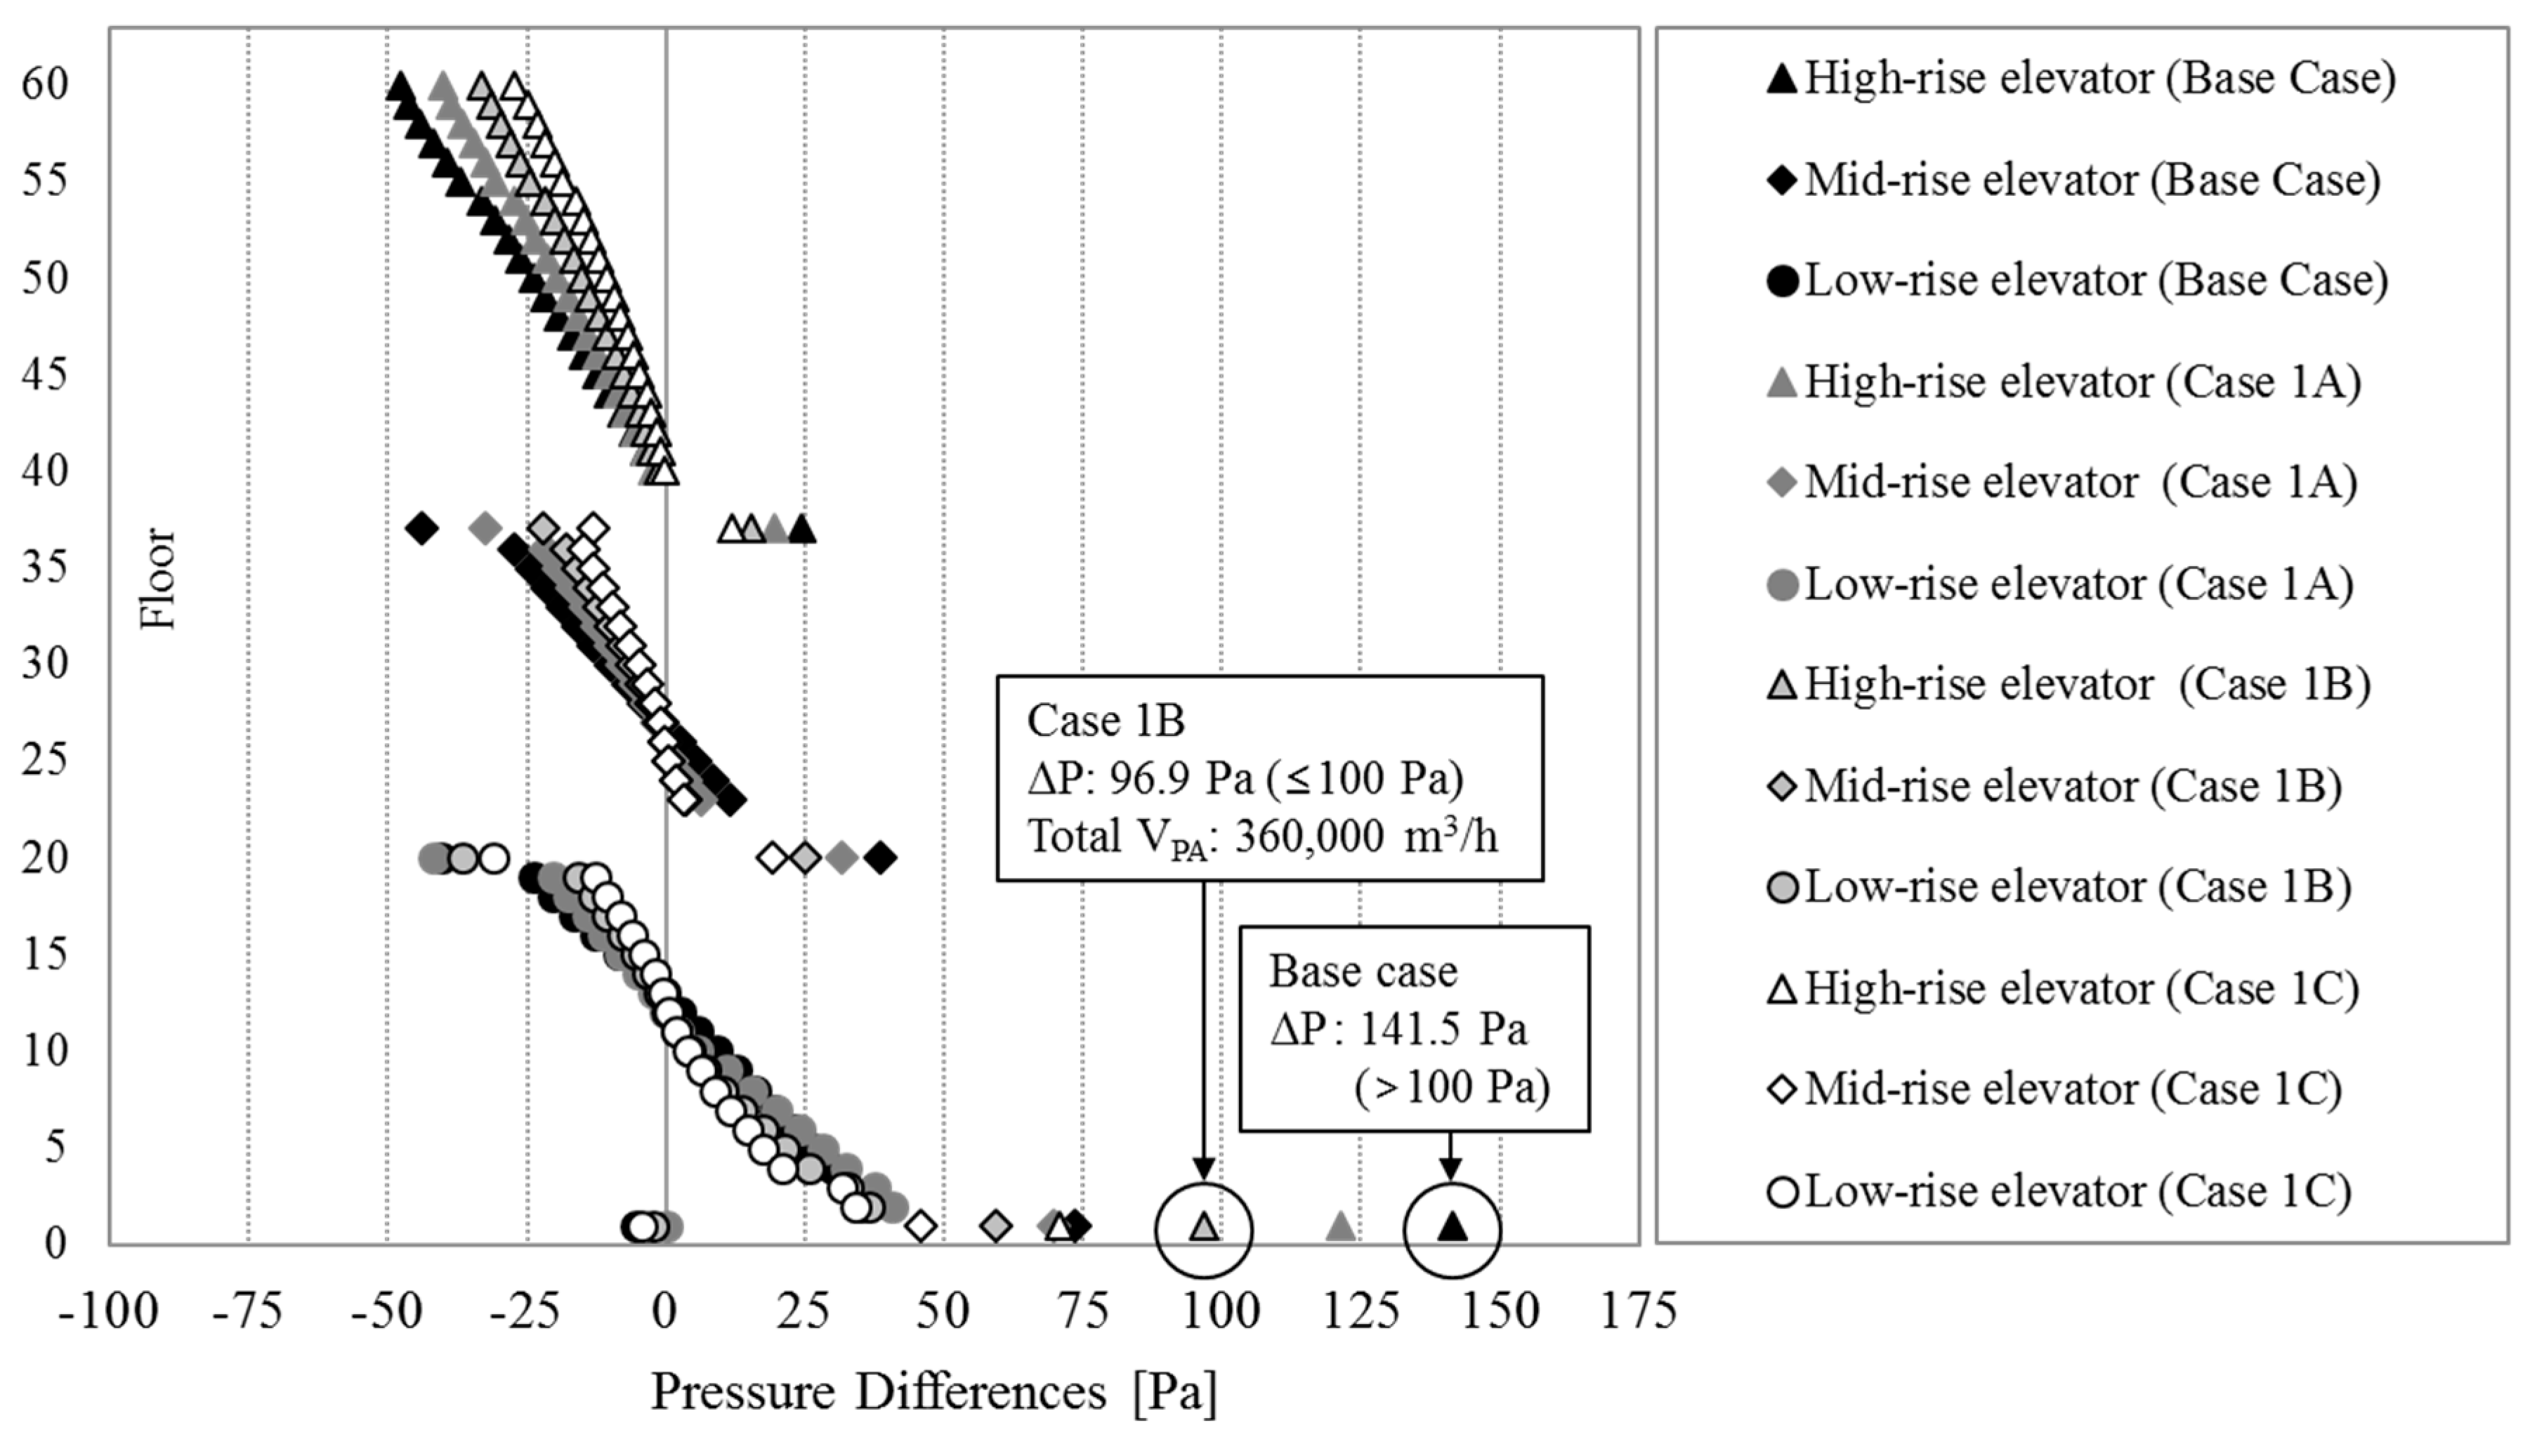
Figure 8.
Comparison of pressure differences across the elevator doors: Case 2 vs. the base case.
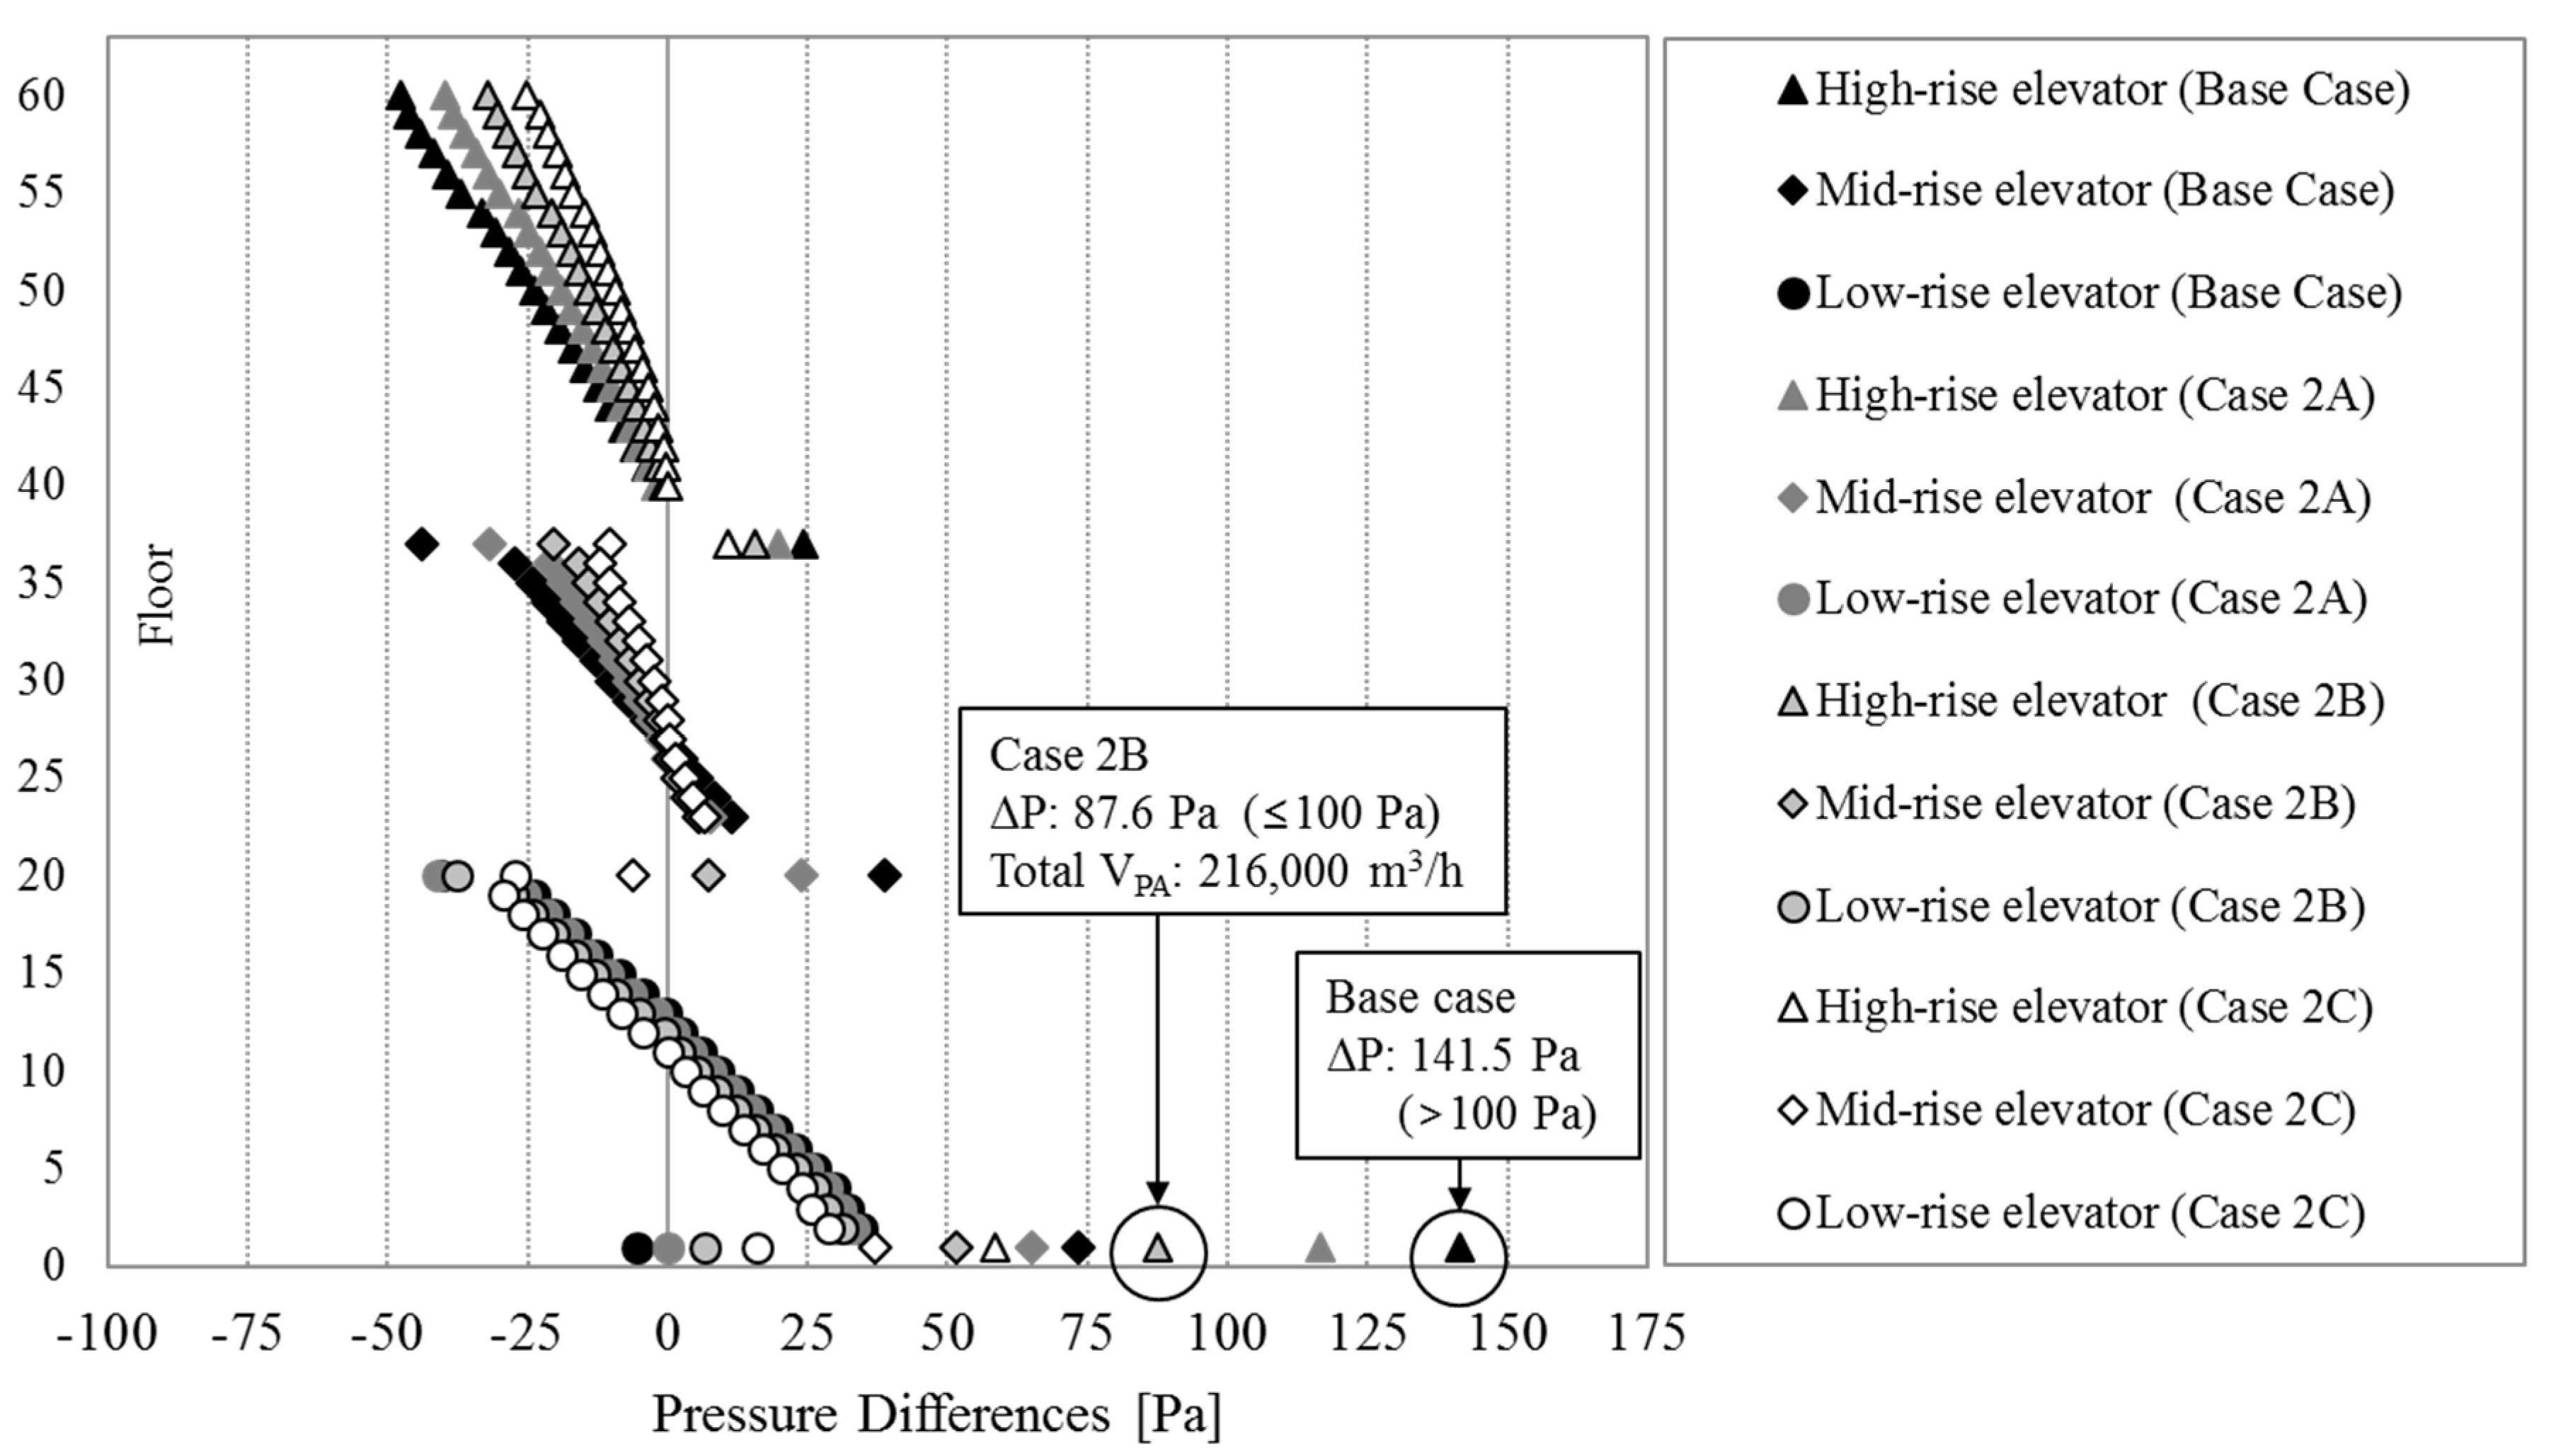
Figure 9.
Comparison of pressure differences across the elevator doors: Case 3 vs. the base case.
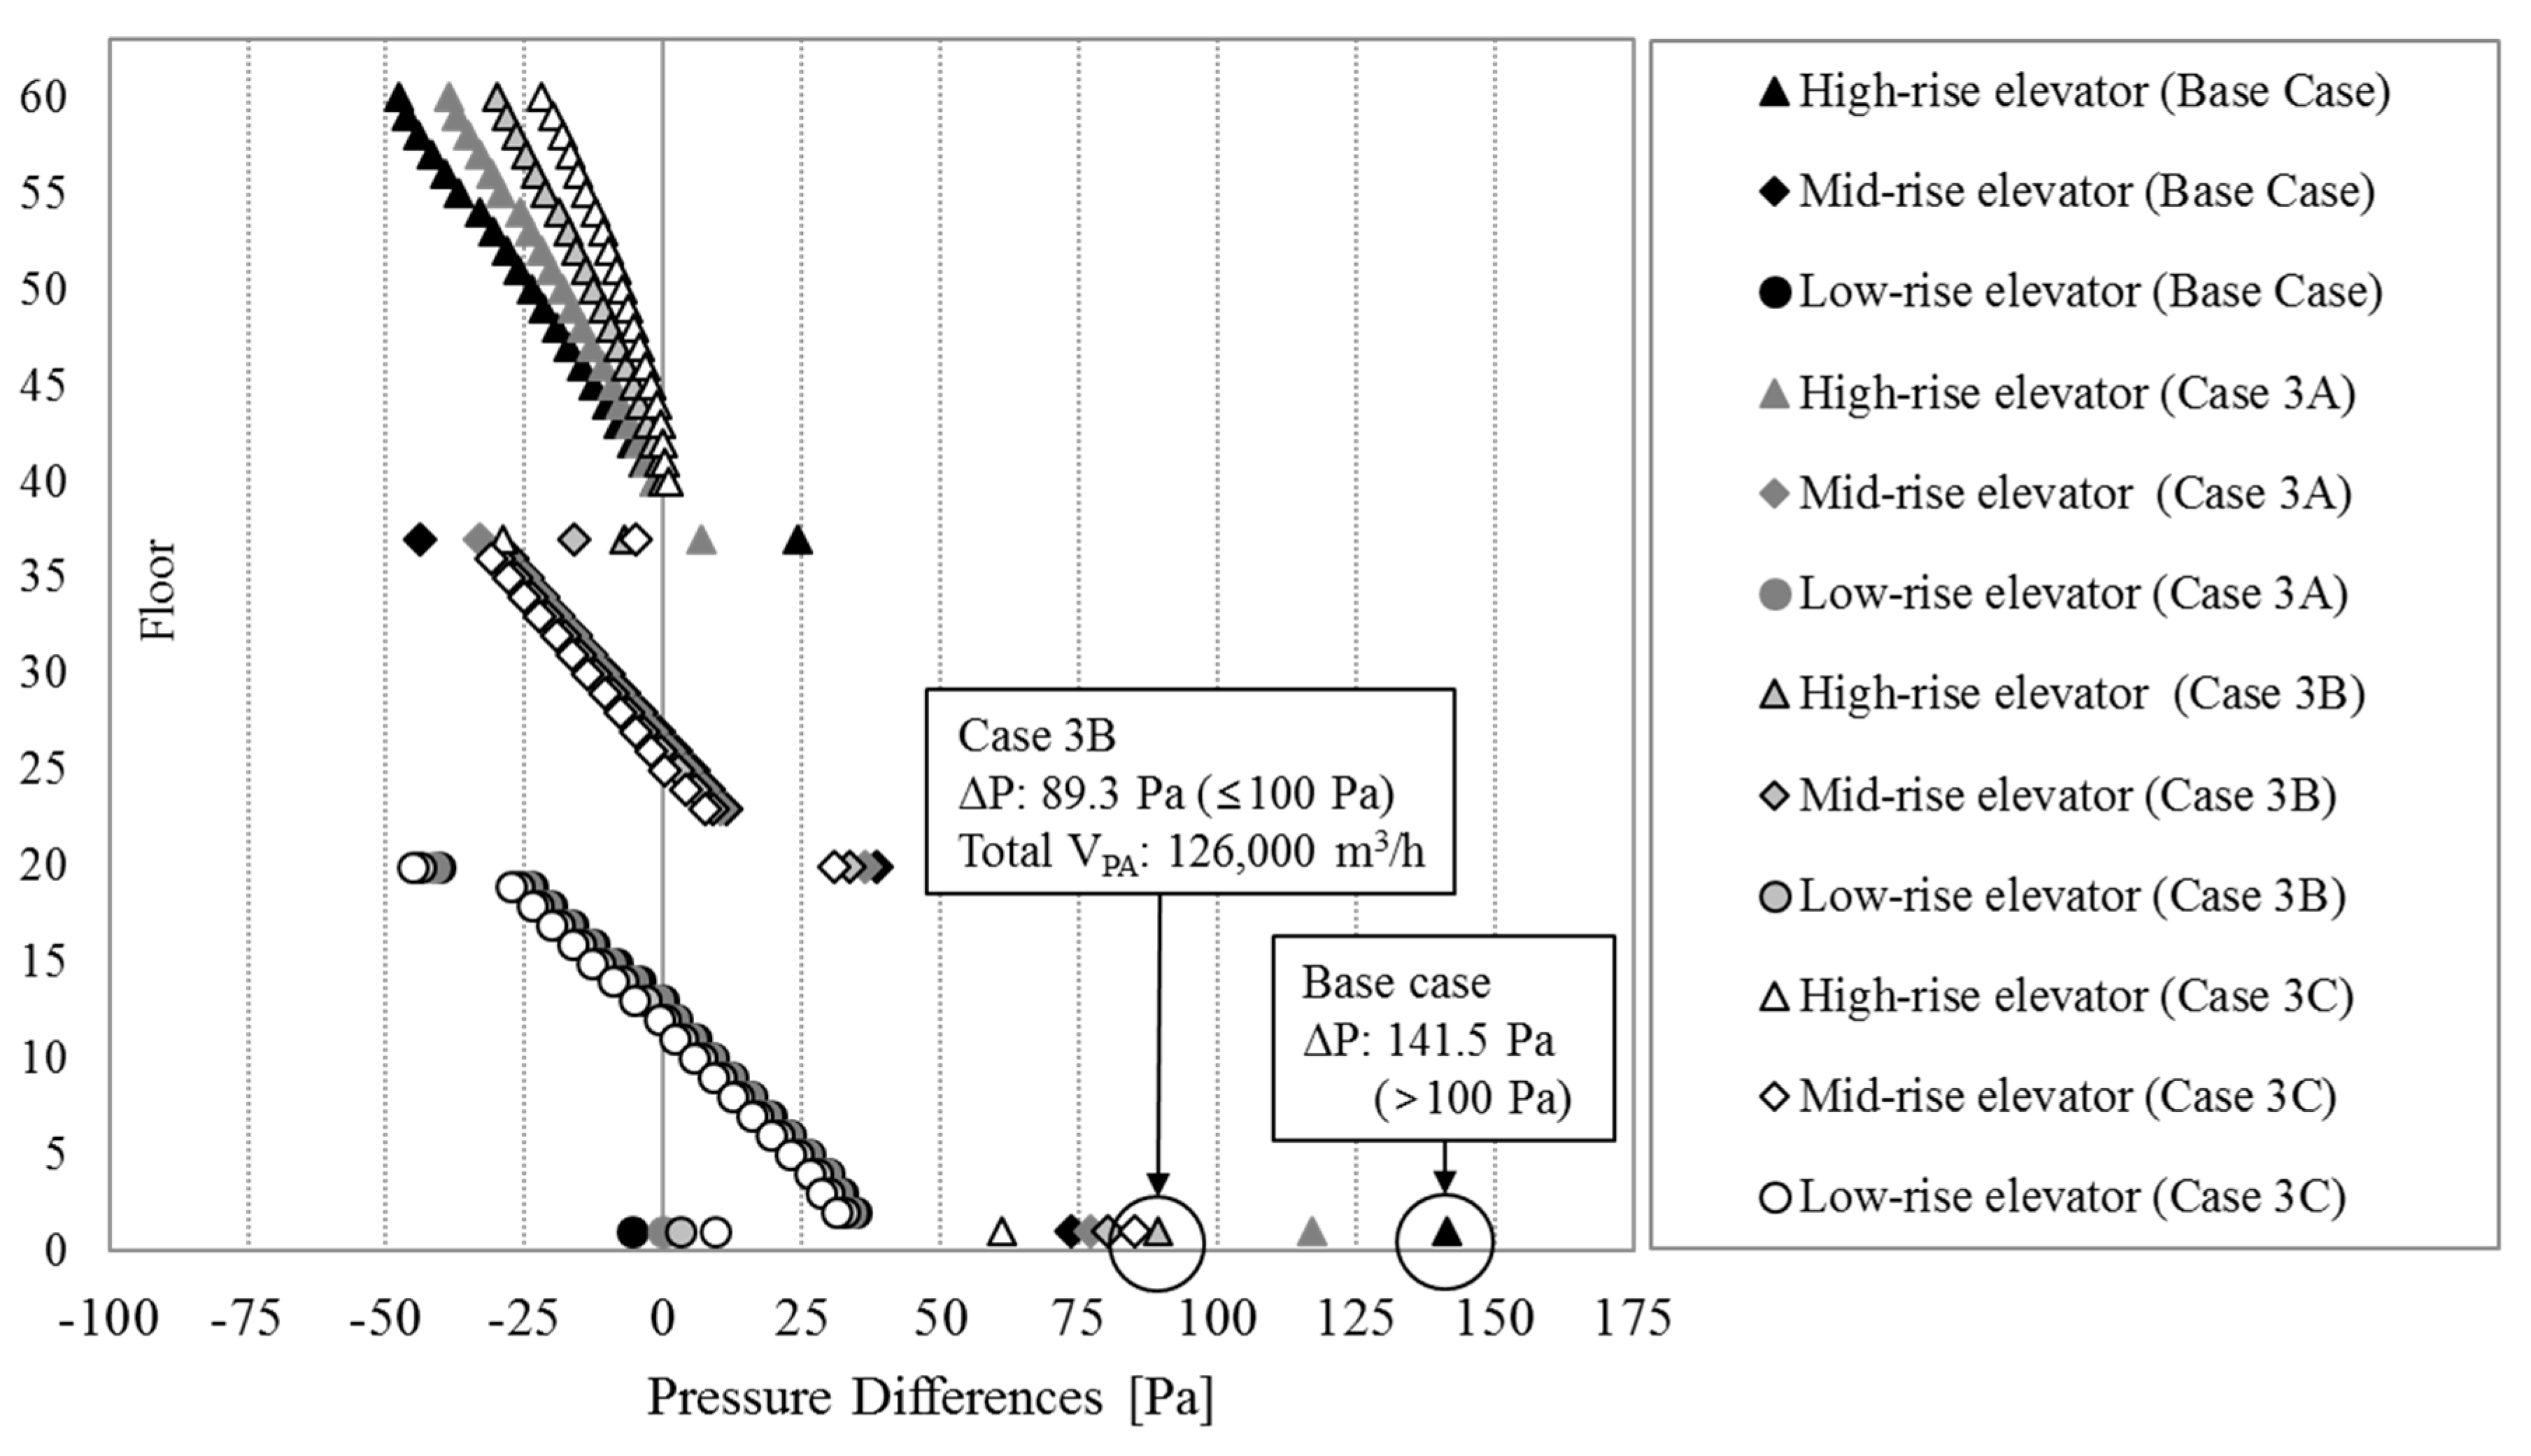
Figure 10.
Pressure differences across elevator doors due to the optimum pressurization scheme.
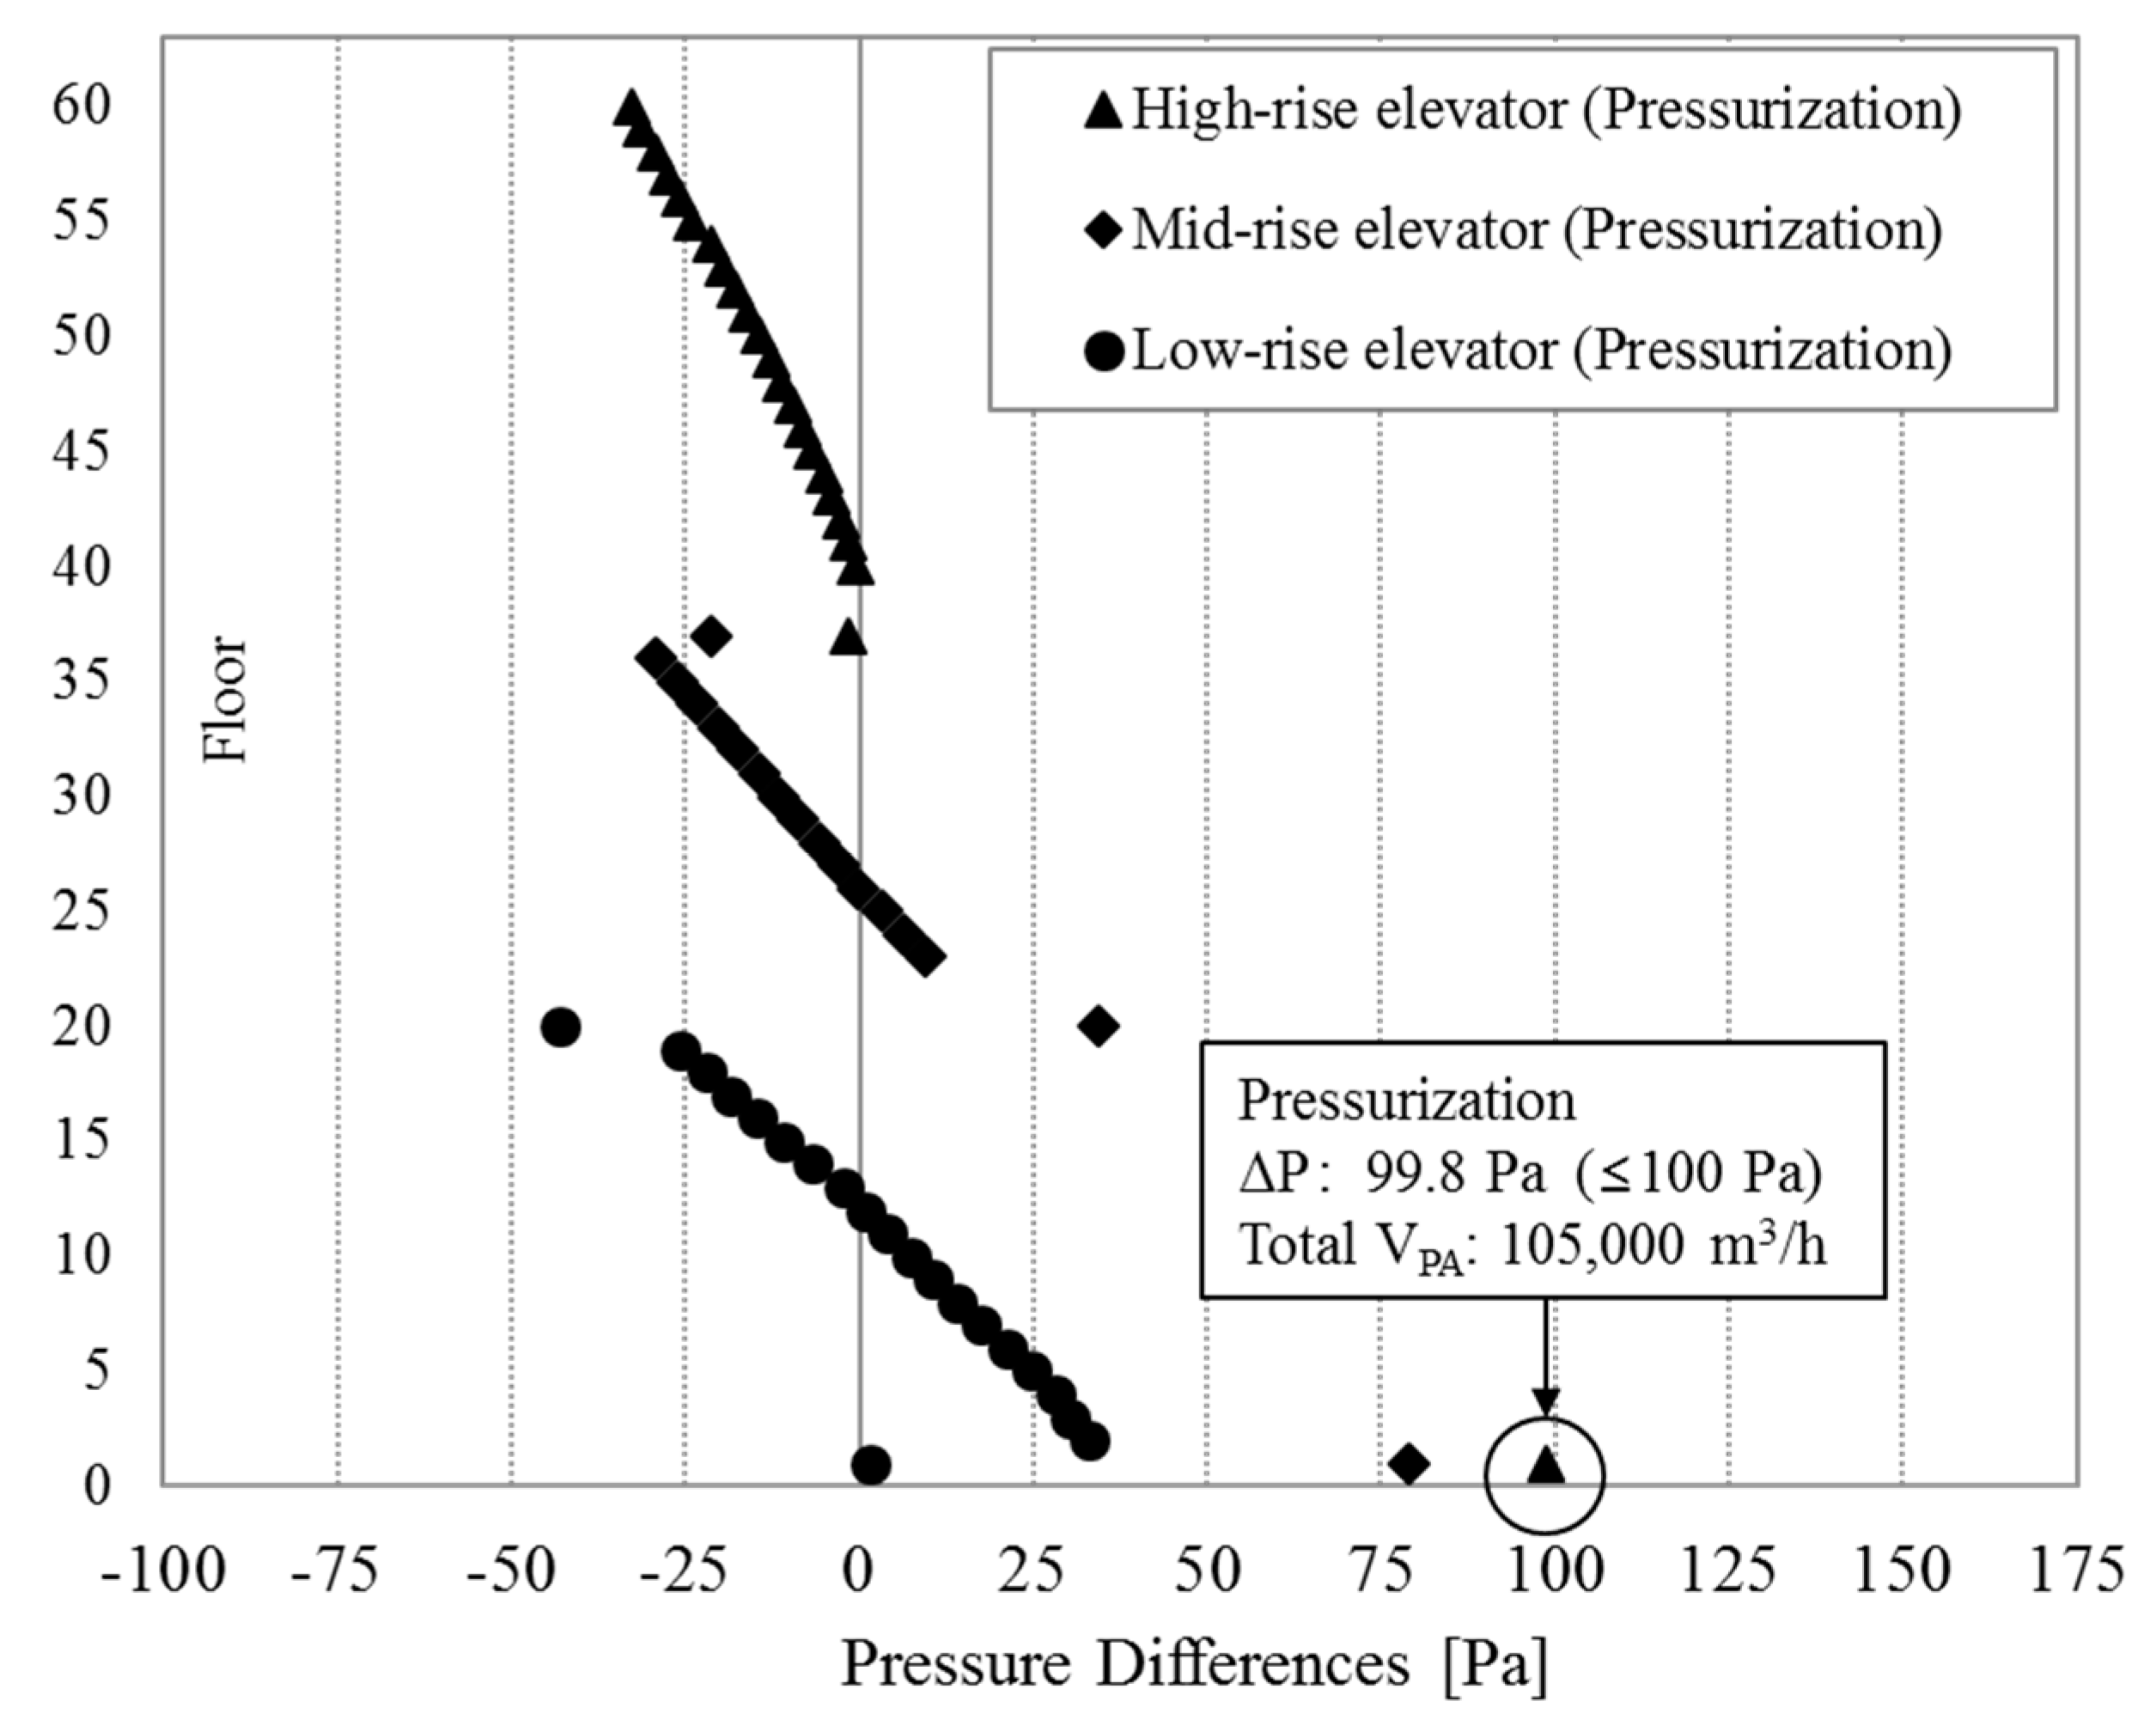
Figure 11.
HVAC operation scheme for the pressurized zone (Floors 40–60).
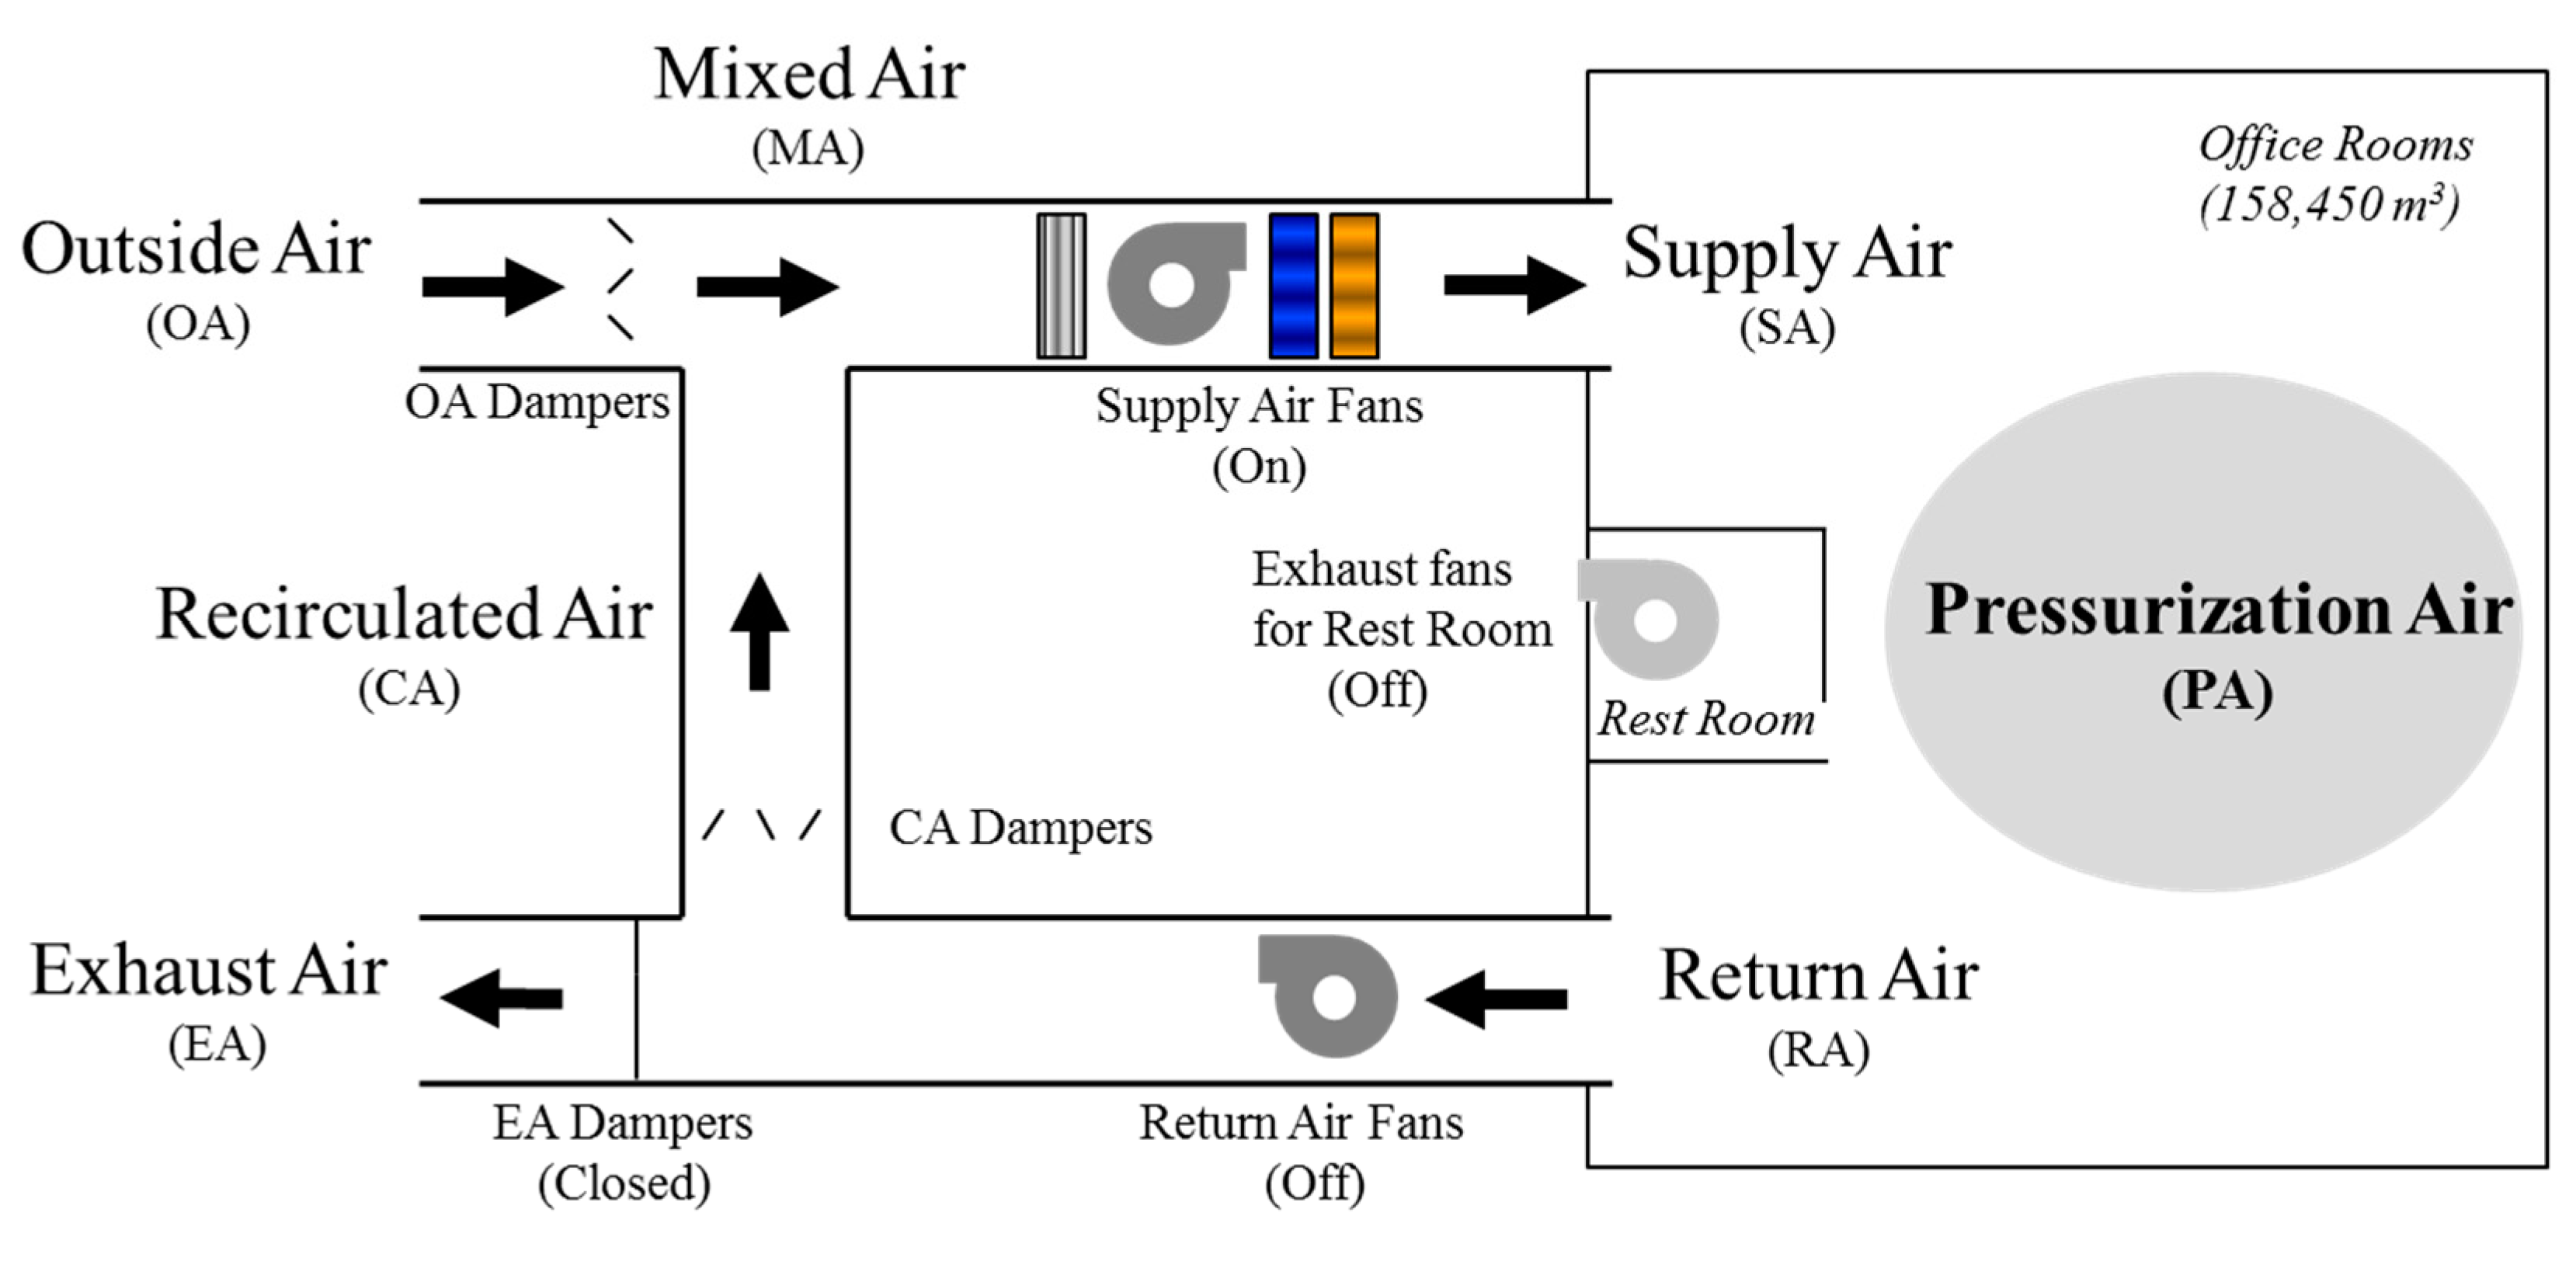
Figure 12.
Pressure differences across elevator doors: before and after pressurization.

Table 1.
Air leakage data used for initial computer simulations.
| Location | Air Leakage Data | Source |
|---|---|---|
| Elevator door | EqLA75 1 240 cm2/item(closed) | Tamura [4] |
| Stairwell door | EqLA75 130 cm2/item(closed) | Tamura [4] |
| Revolving door | EqLA4 2 1020 cm2/item | Measured data |
| Swing door | EqLA4 53 cm2/item(closed) | ASHRAE [26] |
| Sliding door | EqLA4 100 cm2/item(closed) | ASHRAE [26] |
| Door for office room | EqLA4 2.1 m2/item(open) | Measured data |
| Exterior wall of lobby | EqLA75 4.88 cm2/m2 (AL/Awall) | Tamura [4] |
| Exterior wall of typical floors | EqLA75 3.60 cm2/m2 (AL/Awall) | Tamura [4] |
1 EqLA75: Equivalent leakage area at 75 Pa, 2 EqLA4: Equivalent leakage area at 4 Pa.
Table 2.
Pressurization conditions used in the computer simulations.
| Cases | Floors for Pressurization | VPA Per Floor [m3/h] | Total VPA [m3/h] |
|---|---|---|---|
| Base case | None | None | None |
| Case 1A | 1–60 | 3000 | 180,000 |
| Case 1B | 6000 | 360,000 | |
| Case 1C | 9000 | 540,000 | |
| Case 2A | 23–37 and 40–60 | 3000 | 108,000 |
| Case 2B | 6000 | 216,000 | |
| Case 2C | 9000 | 324,000 | |
| Case 3A | 40–60 | 3000 | 63,000 |
| Case 3B | 6000 | 126,000 | |
| Case 3C | 9000 | 189,000 |
Table 3.
Pressure differences across high-rise elevator doors on the first floor and total air volumes for pressurizations.
Table 3.
Pressure differences across high-rise elevator doors on the first floor and total air volumes for pressurizations.
| Cases | ΔP [Pa] | Total VPA [m3/h] |
|---|---|---|
| Base case | 141.5 | None |
| Case 1A | 121.4 | 180,000 |
| Case 1B | 96.9 | 360,000 |
| Case 1C | 70.7 | 540,000 |
| Case 2A | 116.4 | 108,000 |
| Case 2B | 87.6 | 216,000 |
| Case 2C | 58.3 | 324,000 |
| Case 3A | 117.1 | 63,000 |
| Case 3B | 89.3 | 126,000 |
| Case 3C | 61 | 189,000 |
Table 4.
Damper controls for pressurization.
| Controls | OA Damper (%) | CA Damper (%) | EA Damper (%) | VPA (m3/h) | ΔP 1 (Pa) |
|---|---|---|---|---|---|
| Actual HVAC System Operations | 0 | 100 | 0 | 0 | 135 |
| 10 | 90 | 0 | 27,333 | 110 | |
| 20 | 80 | 0 | 54,667 | 107 | |
| 30 | 70 | 0 | 82,000 | 105 | |
| 40 | 60 | 0 | 109,333 | 95 | |
| Computer Simulation | - | - | - | 105,000 | 99.8 |
1 Pressure difference across high-rise elevator doors on the first floor.
© 2017 by the authors. Licensee MDPI, Basel, Switzerland. This article is an open access article distributed under the terms and conditions of the Creative Commons Attribution (CC BY) license (http://creativecommons.org/licenses/by/4.0/).
Share and Cite
MDPI and ACS Style
Yu, J.-y.; Song, K.-d.; Cho, D.-w. Resolving Stack Effect Problems in a High-Rise Office Building by Mechanical Pressurization. Sustainability 2017, 9, 1731. https://doi.org/10.3390/su9101731
AMA Style
Yu J-y, Song K-d, Cho D-w. Resolving Stack Effect Problems in a High-Rise Office Building by Mechanical Pressurization. Sustainability. 2017; 9(10):1731. https://doi.org/10.3390/su9101731
Chicago/Turabian StyleYu, Jung-yeon, Kyoo-dong Song, and Dong-woo Cho. 2017. "Resolving Stack Effect Problems in a High-Rise Office Building by Mechanical Pressurization" Sustainability 9, no. 10: 1731. https://doi.org/10.3390/su9101731
Note that from the first issue of 2016, this journal uses article numbers instead of page numbers. See further details here.