Sustainability-Based Flood Hazard Mapping of the Swannanoa River Watershed


1
Department of Biological Systems Engineering, Virginia Tech, 400 Seitz Hall, 155 Ag Quad Lane, Blacksburg, VA 24061, USA
2
Department of Civil and Environmental Engineering, Tennessee Technological University, Cookeville, TN 38505, USA
3
Department of Civil Engineering, Seoul National University of Science and Technology, Seoul 01811, Korea
*
Author to whom correspondence should be addressed.
Sustainability 2017, 9(10), 1735; https://doi.org/10.3390/su9101735
Submission received: 31 August 2017
/
Revised: 19 September 2017
/
Accepted: 22 September 2017
/
Published: 26 September 2017
Abstract
:An integrated framework is presented for sustainability-based flood hazard mapping of the Swannanoa River watershed in the state of North Carolina, U.S. The framework uses a hydrologic model for rainfall–runoff transformation, a two-dimensional unsteady hydraulic model flood simulation and a GIS-based multi-criteria decision-making technique for flood hazard mapping. Economic, social, and environmental flood hazards are taken into account. The importance of each hazard is quantified through a survey to the experts. Utilizing the proposed framework, sustainability-based flood hazard mapping is performed for the 100-year design event. As a result, the overall flood hazard is provided in each geographic location. The sensitivity of the overall hazard with respect to the weights of the three hazard components were also investigated. While the conventional flood management approach is to assess the environmental impacts of mitigation measures after a set of feasible options are selected, the presented framework incorporates the environmental impacts into the analysis concurrently with the economic and social influences. Thereby, it provides a more sustainable perspective of flood management and can greatly help the decision makers to make better-informed decisions by clearly understanding the impacts of flooding on economy, society and environment.
1. Introduction
Flood management is multifaceted, affected by the interplay of several climatologic, hydrologic, socioeconomic and environmental factors, involving various stakeholders, competing alternatives and different tradeoffs [1,2]. While the focus of conventional flood management was more on economy and society, sustainable flood management (SFM) intends to incorporate the economic, social and environmental risk of flooding in concert. To undertake such a complex task, multi-criteria decision making (MCDM) techniques has been used in flood management by providing decision makers with a systematic framework to deal with such a complex problems. MCDM approaches are capable of structuring these complex problems into a quantifiable transparent format.
The two general applications of MCDM methods in flood management are the prioritization of flood management alternatives and the mapping of flood hazard, vulnerability and risk. The latter is the focus of this study, with emphasis on flood hazard. The MCDM-based flood hazard mapping has been frequently studied [3,4,5,6,7,8]. However, there has been a limited effort in transforming the environmental impacts of flooding into the MCDM-based flood hazard analysis. Understanding flood influences in terms of sustainability is essential for risk reduction [9,10,11,12].
With the recent shift from conventional flood mitigation toward SFM [13,14,15,16], more attention is given to the environmental impacts of flooding. In the past, the focus of flood management lay more on economic and technical aspects, while social and environmental criteria did not receive remarkable attention [15,17,18]. On the other hand, SFM requires all the aforementioned factors to be considered [19,20,21]. SFM can be defined as a framework that efficiently minimizes flood influences together with stakeholders while taking into consideration economy, society and environment both in short-term and long-term perspectives [14,22,23]. Decision-making by using the conventional frameworks may cause conflicts between economic/social and environmental interests or bring unacceptable environmental standards particularly in a long-term perspective [24]. Kundzewicz [22] stated that a set of suitable selection criteria is needed for the sustainability appraisal of flood management systems. Evers et al. [25] stated the need for a transparent and organized framework to undertake SFM. However, such frameworks have been rarely elaborated and development of well-established and coherent frameworks remains a research niche.
Bearing in mind the inherent multidisciplinarity of the SFM and the capabilities of MCDM approach in handling multiple factors, a MCDM-based SFM is essential. Despite the advantages, there have been rare applications of MCDM techniques in the SFM studies. To our knowledge, the only study was conducted by Edjossan-Sossou et al. [24], in which a MCDM-based framework was proposed to undertake SFM. Overlooking the environmental impacts of flooding might lead to incomplete representation of the effectiveness of flood management alternatives and subsequent selection of suboptimal strategies. As a result, millions of dollars might be wasted and the ecosystem might be threatened. Thus, a MCDM-based SFM framework needs to be urgently established.
This study develops a MCDM-based framework for sustainability-based flood hazard mapping. Supported with a hydrologic model for rainfall–runoff transformation and a two-dimensional (2D) hydraulic model for flood simulation, the framework employs a GIS-based weighted summation method (WSM) to perform flood hazard mapping. Three categories of economic, social, and environmental flood hazard are used as the hazard components in order to undertake the SFM framework. Utilizing the proposed framework, the aggregated flood hazard is provided in each geographic location. The analysis is performed to analyze the severity of the flooding and does not consider the vulnerability of the receptors (e.g., buildings and people). The framework is demonstrated for the fluvial overbank flooding in the Swannanoa River watershed in the state of North Carolina, U.S. The proposed approach advances the current practice of flood hazard mapping and enhances the sustainability of the risk-reduction strategies considering the environmental impacts of flooding in concert.
2. Study Area
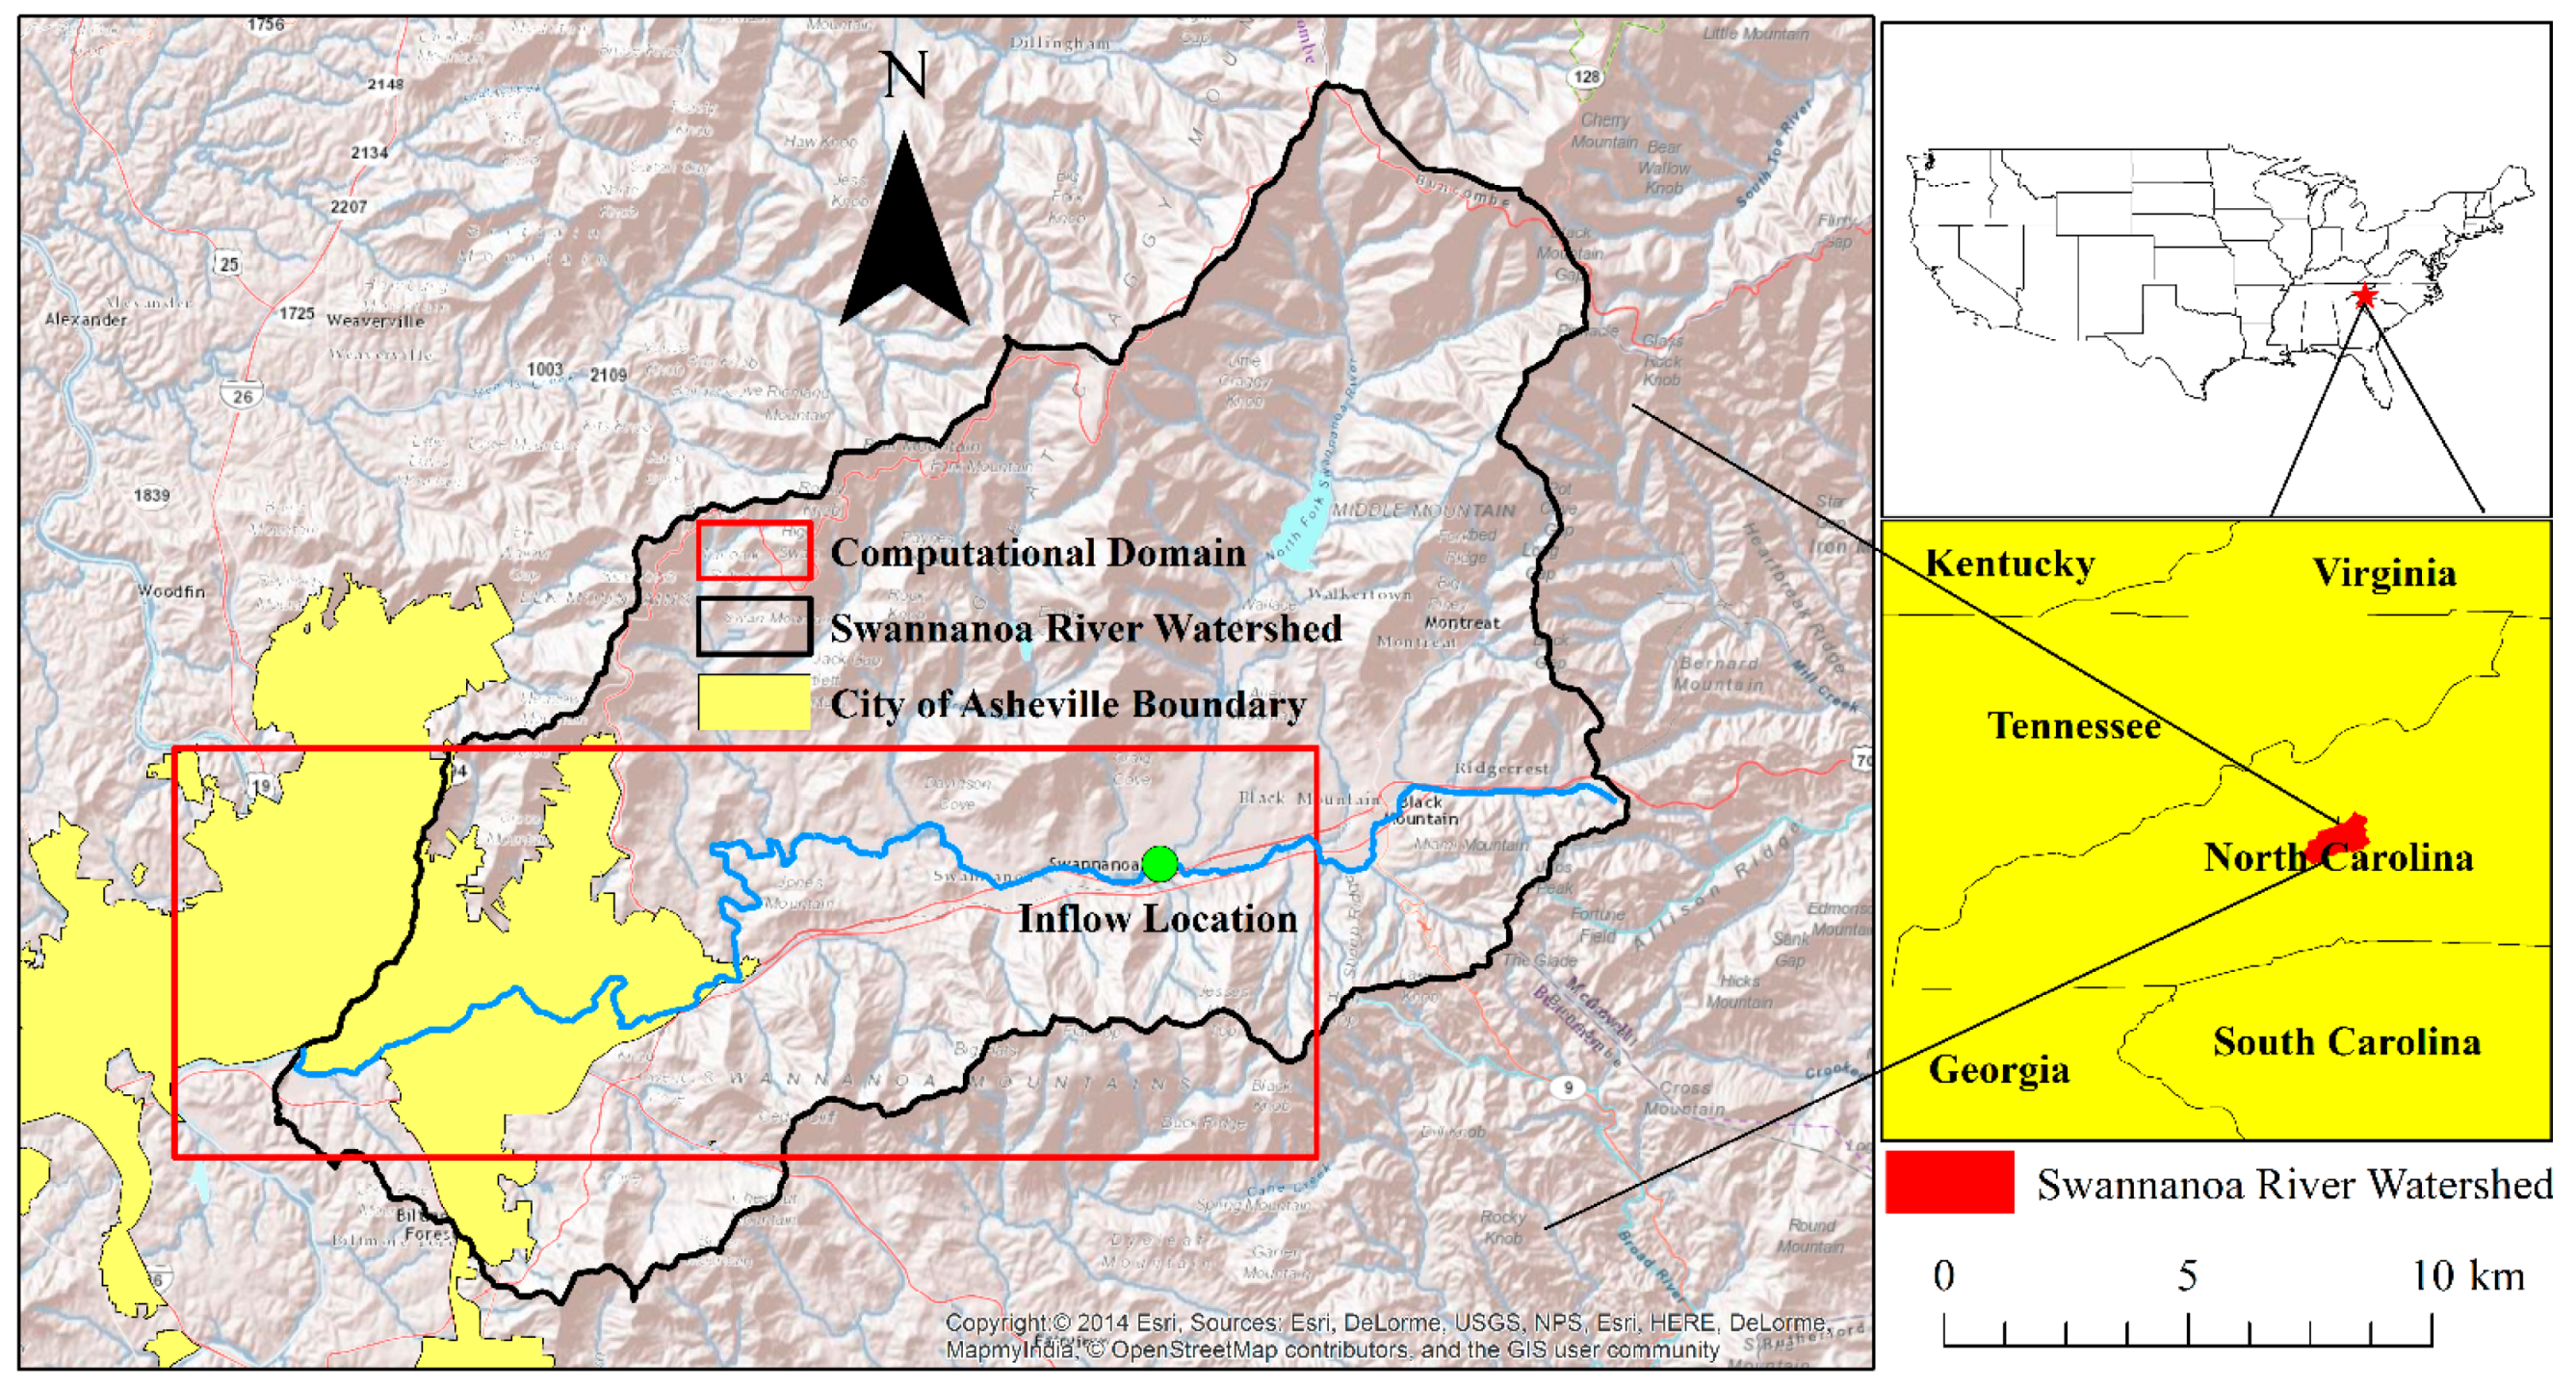
The study area is the Swannanoa River watershed in the state of North Carolina, U.S. The watershed, which is a part of the larger French Broad River basin, is located in the western North Carolina Mountains, from Asheville to Montreat. It is selected due to its proximity to the southeastern coast of the U.S. that exposes it to the potential path of flood-causing hurricanes and tropical storms. With the presence of steep slopes (greater than 45%), the watershed can be considered hilly. Although the watershed is predominantly rural, there are developed areas such as City of Asheville. Fluvial overbank flooding is prevalent in the watershed and there are no tidal effects. Figure 1 shows the study area including the proposed computational domain and cities as well as the U.S. states. The average topographic slope is 20.9% within the selected computational domain, implying a hilly case is analyzed here. The area has experienced several harmful floods in the past, including the events in 1916, 1928, 1940, 1964, 1977 and 2004. The most severe flooding occurred in 2004 during hurricanes Francis and Ivan, and caused $54 million damages to the structures, 11 fatalities as well as disruption to the communities in the watershed [26]. While there are warning systems in the watershed, no certified flood control reservoir or levee is implemented. For this study, the 33.3 km Swannanoa River reach is selected, which is bounded by an area of 173.1 km2, upstream of the confluence of the Swannanoa River and French Broad River, including some parts of Asheville.
3. Methodology
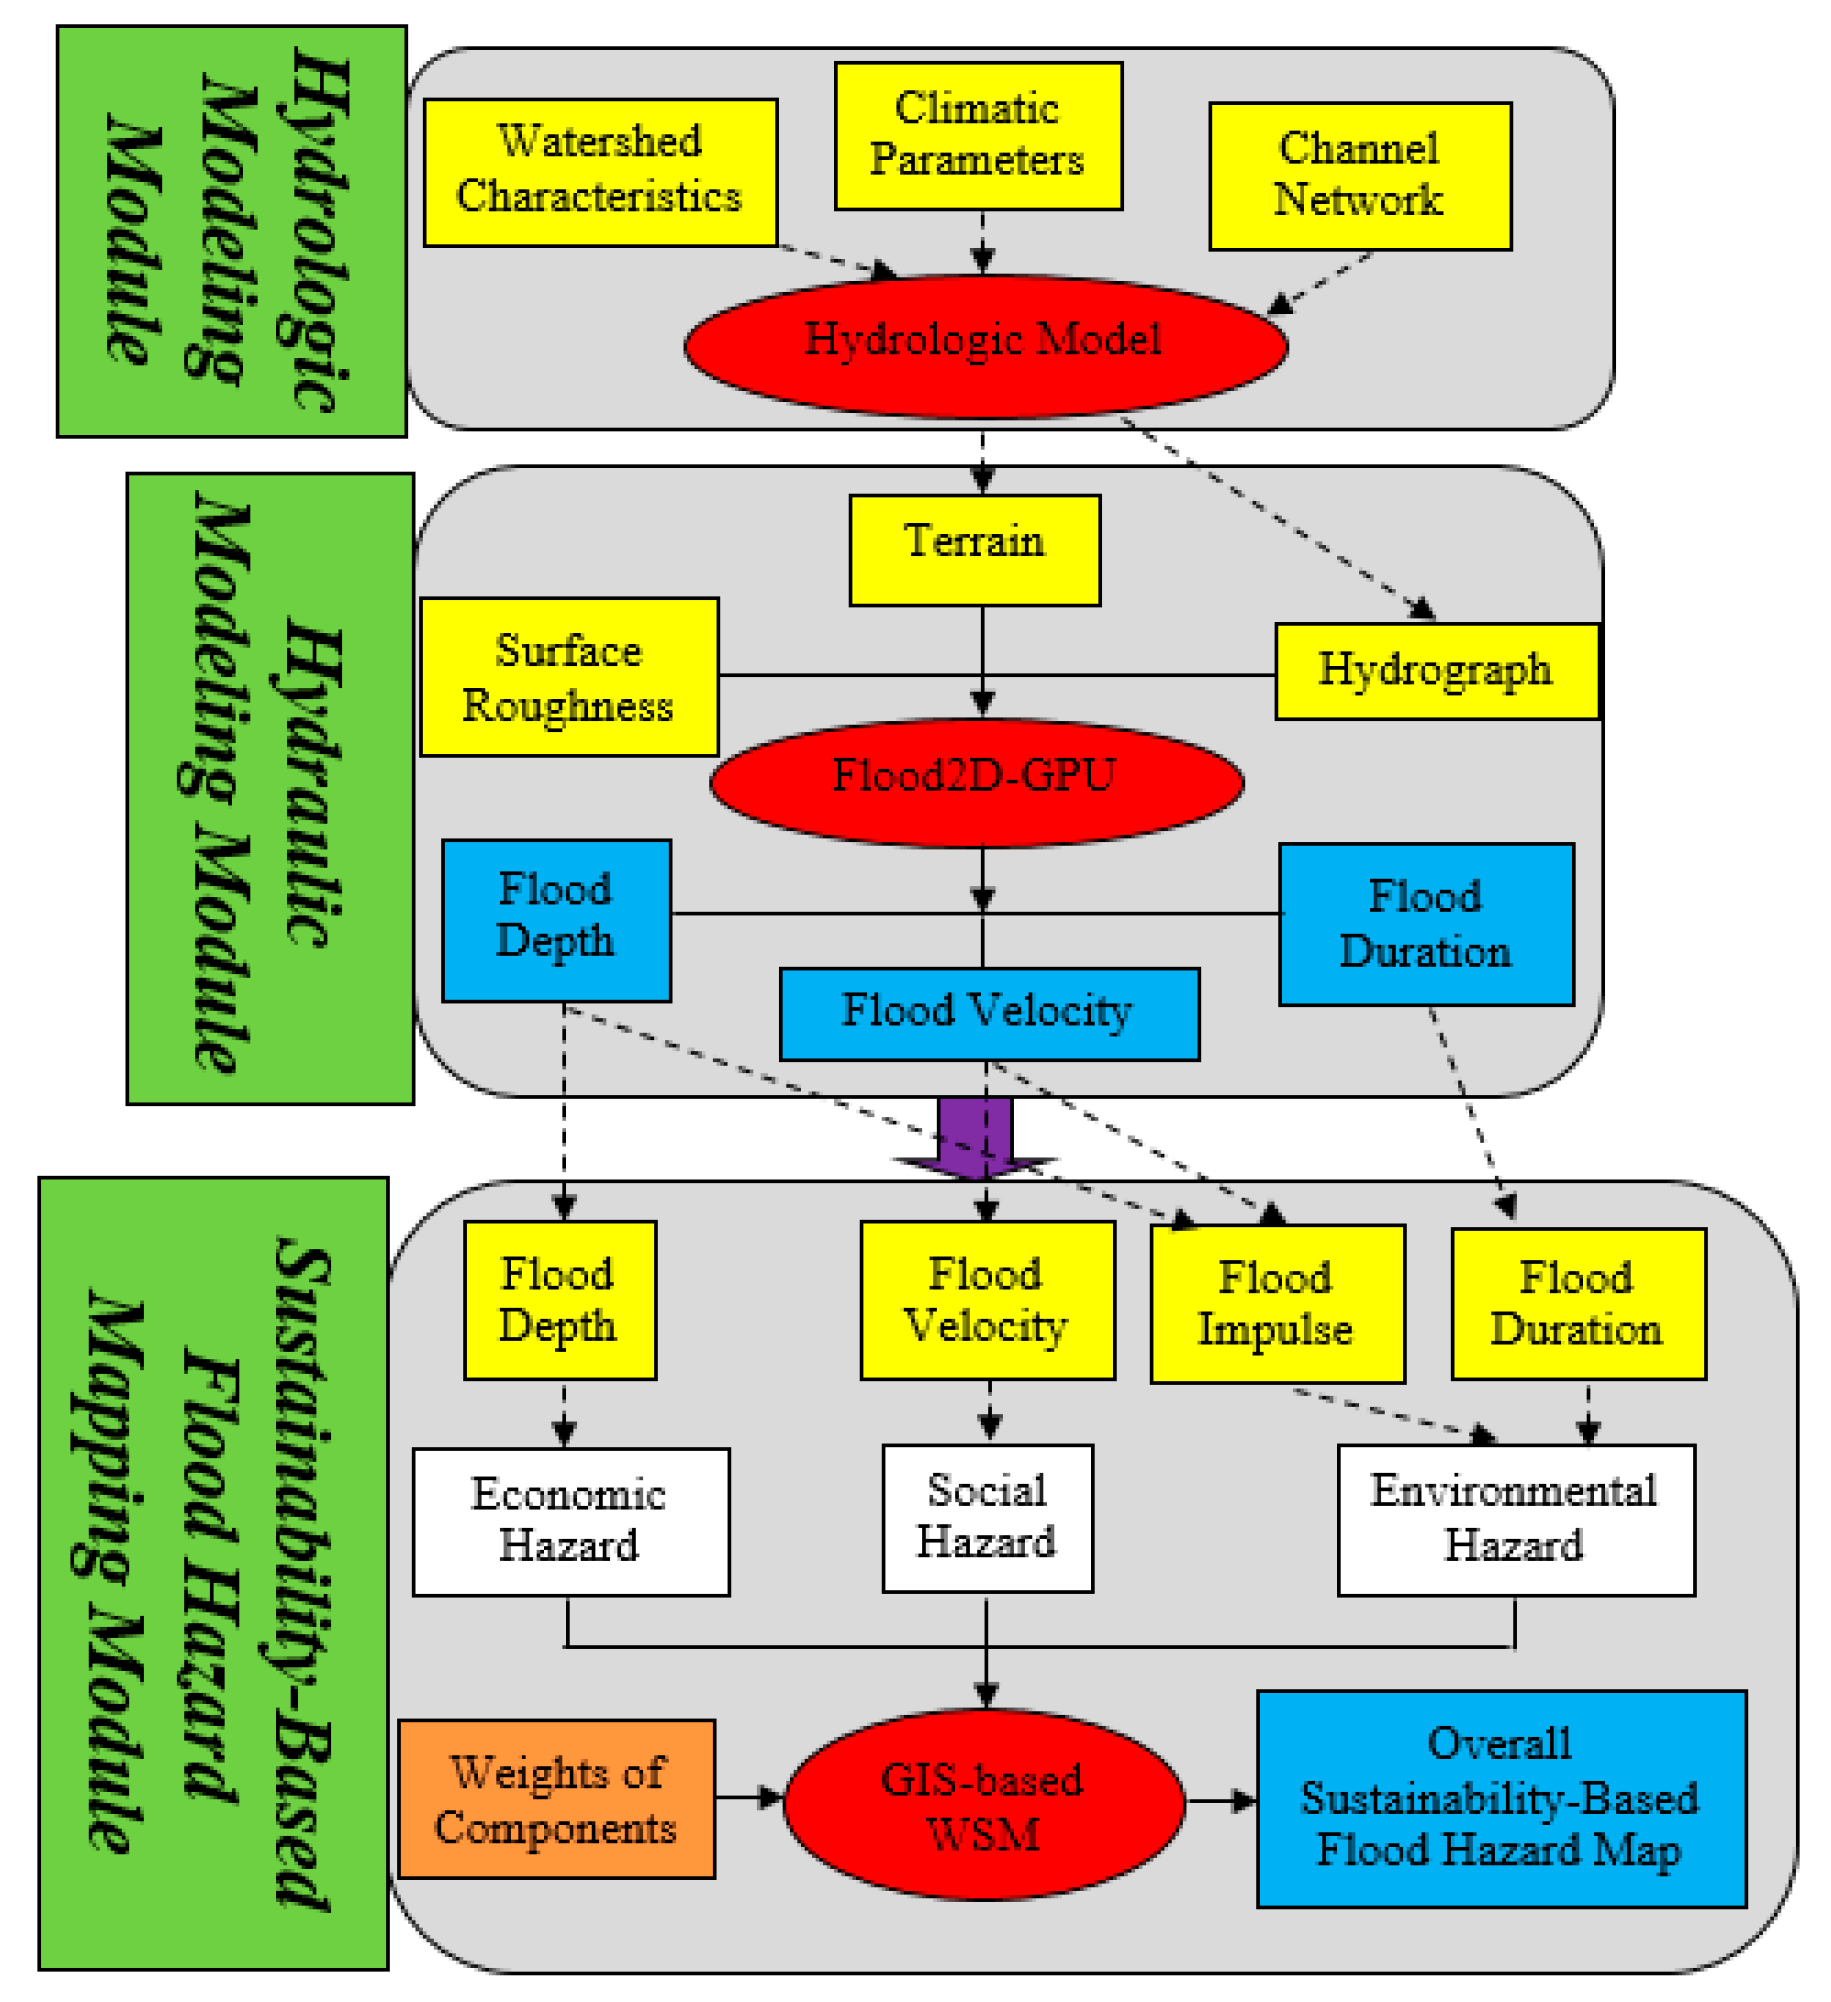
A three-module framework is proposed, which employs a coupled hydrologic and hydraulic (H&H) modeling approach and a GIS-based decision-making technique. In the first module, a hydrologic model is used to simulate rainfall–runoff transformation and to populate a design hydrograph. In the second module, a 2D hydraulic model is applied to predict flood parameters (depth, velocity and duration) and subsequent economic, social and environmental hazard. In the third module, a GIS-based MCDM technique is used to integrate the three hazard components and to produce the overall flood hazard map. The schematic diagram of proposed framework is pictured in Figure 2.
3.1. Hydrologic Modeling
A semi-distributed hydrologic model, which was developed in GoldSim® environment, is applied in this study. GoldSim® is a visually enhanced, dynamic simulation framework used for modeling complex systems in business, engineering, and science. GoldSim® also supports decision and risk analysis for water resources planning projects. The software provides a versatile user-friendly graphical user interface for various types of modeling such as deterministic or probabilistic and event-based or continuous modeling. The model takes rainfall time series in tandem with the characteristics of river cross sections and subwatersheds as input variables and generates the hydrograph at subwatersheds’ outlets and different locations of the river. In addition to reaches and subwatersheds, reservoirs can be also included in the simulations. It is to be mentioned that groundwater and snowmelt processes are not taken into account in the model. The methods of Natural Resources Conservation Service (NRCS) [27] and Muskingum [28] are used as the rainfall–runoff transformation approach and the channel routing technique, respectively. To implement the NRCS method, the Curve Number (CN) should be determined by taking the antecedent moisture condition (AMC) into account. Further details about the model can be found in Ahmadisharaf [29].
3.2. Hydraulic Modeling
The hydraulic modeling module uses a physically-based flood model named Flood2D-GPU. Developed in NVIDIA’s CUDA programming environment; it is a 2D unsteady hydraulic model that solves the Saint Venant equations to generate flood depths and velocities [30]. The datasets required for Flood2D-GPU are: (i) Digital Elevation Model (DEM) for terrain representation; (ii) Manning’s roughness; and (iii) flow hydrograph at a source location. The model provides a significantly reduced computational time (by 80–88 times) compared to the same flood model implemented in a CPU-based environment [30]. It is thus very advantageous for probabilistic analyses where high computational cost is expected. The model has been successfully applied in flood hazard analysis [31,32,33], flood damage estimation [34] and investigation of the impact of land use/land cover (LULC) change on floods [35].
3.3. Sustainability-Based Flood Hazard Mapping
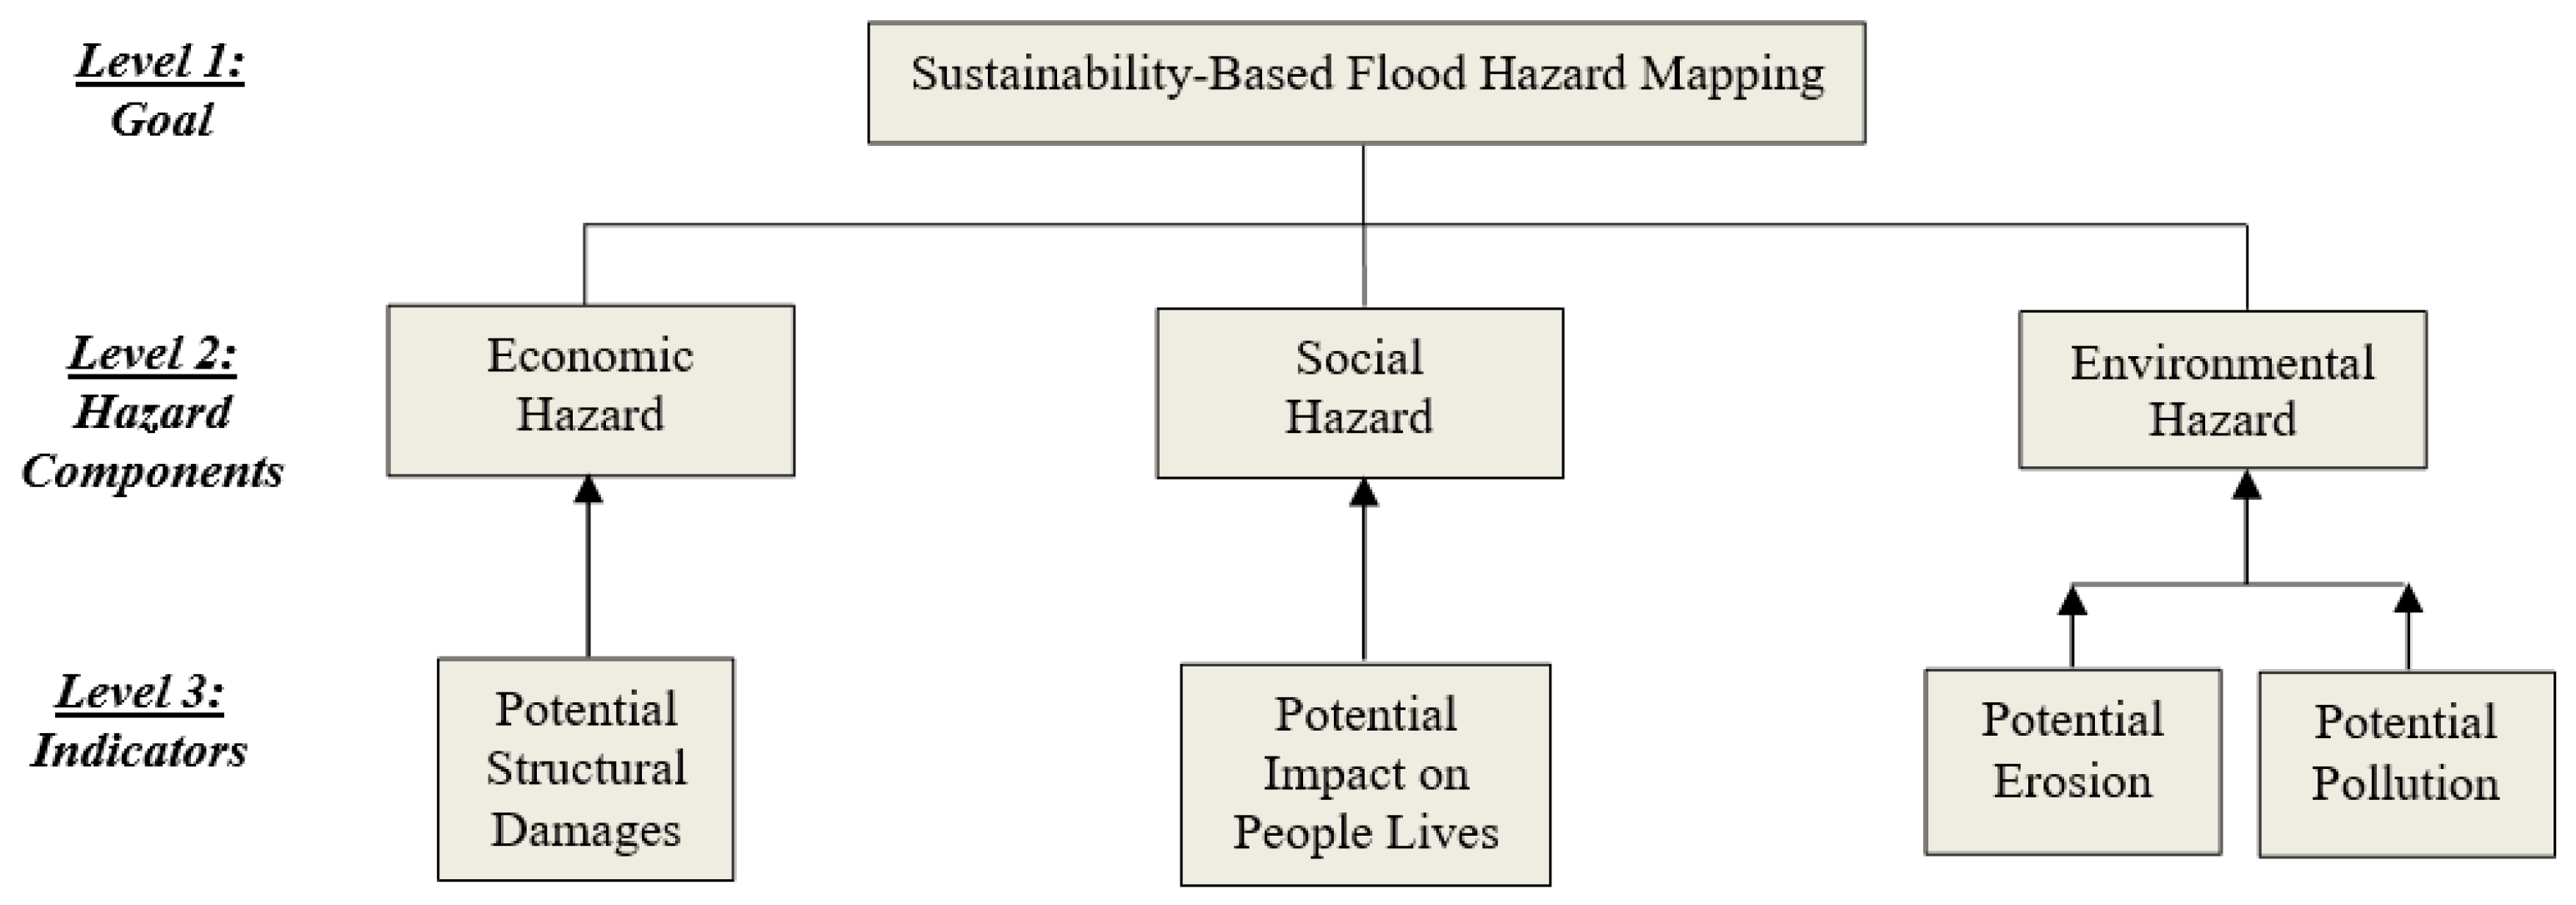
To undertake the idea of sustainability-based flood hazard mapping, three components of economic, social and environmental hazard are used. Figure 3 shows the hierarchical structure of the proposed framework. The first level indicates the ultimate goal, which is sustainability-based flood hazard mapping. The second level refers to the three hazard components. The third level shows the indicator(s) of each component.
Potential structural damages are considered as the indicator of the economic hazard. Flood depth, suggested by Graham [36], Prinos et al. [37] and Federal Emergency Management Agency (FEMA) [38], is selected to represent hazard to structures since it is the primary driver in structural damages [39,40] and is often used to estimate structural damages [34,41].
Potential impact on people lives is considered as the indicator of social flood hazard [15,42,43]. A combination of flood depth and velocity is used to estimate the hazard to people lives according to the taxonomy by Assistant Commissioner—Engineering and Research (ACER) [44].
Although well-established methods for estimation of the indicators of the economic and social hazard of flooding in the U.S. are found, such methods for environmental hazard are not widely available. Therefore, alternate methods suggested in other countries should be used through literature review. Here, potential erosion and pollution are used as the indicators of the environmental hazard aligned with earlier studies [15,42,43,45,46]. Flood impulse (i.e., product of flood depth and velocity) is used to represent the former [45,47] and duration is used to represent the latter [47]. Each parameter is classified into multiple hazard groups and a score is assigned to each. To classify flood impulse and duration, the classification by Dang et al. [47] study is used initially, which used both these two as the indices of flood environmental hazard. The initial taxonomy is later refined for the study watershed through threshold values given for these two parameters (impulse and duration) in other flood hazard or risk analysis studies (which were not necessarily performed to classify environmental hazard of flooding) alongside advice from local experts. This is to consider the study watershed characteristics, which is mostly hilly, most of the floods are flashy and do not last long. Suggested taxonomies by Penning-Roswell et al. [48] and Prinos et al. [37] are used to refine the initial flood impulse classification, and the studies by Thieken et al. [47] and Förster et al. [49] are utilized to do so for flood duration. The ultimate flood hazard classes and the corresponding scores for the study area are presented in Table 1.
To combine the three flood hazard components, a relative importance or weight should be assigned to each component. Due to its importance, stakeholders and experts should be engaged into this step of MCDM problems [50,51]. Specially, in a SFM framework, stakeholder participation is a core element [25,52,53]. Here, a participatory-based approach is used to capture the opinions of the stakeholders and experts and incorporate them into the flood hazard mapping process. A Likert-type questionnaire is designed within the SurveyMonkey website (http://www.surveymonkey.com/) and is sent to potential experts at two different times. The experts were selected from local and regional authorities, government, private sector and academia regardless of their geographic location. To find further potential experts, the survey was also posted on two professional social networks, including LinkedIn (https://www.linkedin.com/) and ResearchGate (http://www.researchgate.net/).
To demonstrate the idea of group decision-making and to build a consensus on the ultimate weight set, the median is taken as the representative value as it agrees with the majority view of the participants [5,54]. Moreover, it is not as sensitive to extreme values as is the mean [55].
The final step is GIS-based application of WSM to generate an aggregated flood hazard map by linearly combining the scores of the hazard components and their corresponding weights (obtained through the survey). The flood hazard components are overlaid using the following Equation:
in which, Si is the overall hazard in grid cell i, wj is the weight of the hazard component j, sij is the hazard severity (i.e., score in Table 1) of grid cell i with respect to component j and n is number of hazard components (three in this study). The output of this stage is a map, in which the grid cells show the flood hazard severity. This map is then reclassified to qualitatively represent the overall hazard level using the classification in Table 2. Such a map is the ultimate product of the sustainability-based flood hazard mapping framework. A sensitivity analysis is performed to assess the robustness of flood hazard map with respect to the weights of the hazard components. This is done through consideration of multiple other weight sets for the three hazard components [15,56].
It is noteworthy that the results are presented within the inundation area and dry cells (those with flood depth of less than 0.1 m) are excluded from the analysis. This underlies the fact that a large portion of the case study is not flooded. Thus, the results of such comparison introduce bias [57,58]. To avoid such biased findings, unflooded area is disregarded. Additionally, the grid cells within the channels are excluded from the analysis because the floodplain is the primary concern of the decision makers (and not the channels).
4. Results
4.1. Hydrologic Modeling
The deterministic hydrologic model was calibrated and validated using four flood events. The events differ in terms of the rainfall depth, AMC and streamflow peak. The calibration/validation was described in detail by Ahmadisharaf [29]. The calibrated/validated model simulates the 100-year design hydrograph by using the 24-h SCS type II design rainfall taken from Bonnin et al. [59]. The AMC type II (i.e., normal) is considered, which is suggested for design events [27]. The hydrologic model generates the 100-year hydrograph across the streams and the one on the upstream of the computational boundary of the hydraulic model feeds into the hydraulic model. This hydrograph has a peak magnitude of 524.5 cms.
4.2. Hydraulic Modeling
The populated 100-year design hydrograph from the hydrologic model is used in the hydraulic model. The Manning’s roughness coefficient is found from the calibration, which was described in detail by Ahmadisharaf et al. [60]. The DEM is taken from the U.S. Geological Survey (USGS) National Elevation Dataset with a spatial resolution of 30 m based on the suggestions by Ahmadisharaf et al. [31] for the study watershed. Utilizing these input datasets, the flood parameters, depth, velocity and duration, are generated. Furthermore, flood impulse and danger level to people are determined by post-processing these outputs.
4.3. Sustainability-Based Flood Hazard Mapping
4.3.1. Survey
A questionnaire, which was described in the Methodology section, was designed and sent to total of 159 experts at two different times. In overall, 56 people responded, which corresponds to a response rate of 35.2%. The weights are post-processed and the median is determined. According to the results, the hazard components are believed to be closely important, with social hazard as the most and environmental hazard least important components. A median value of 0.334, 0.361 and 0.305 is obtained as the weight of the economic, social and environmental flood hazard, respectively.
4.3.2. Sustainability-Based Flood Hazard Mapping
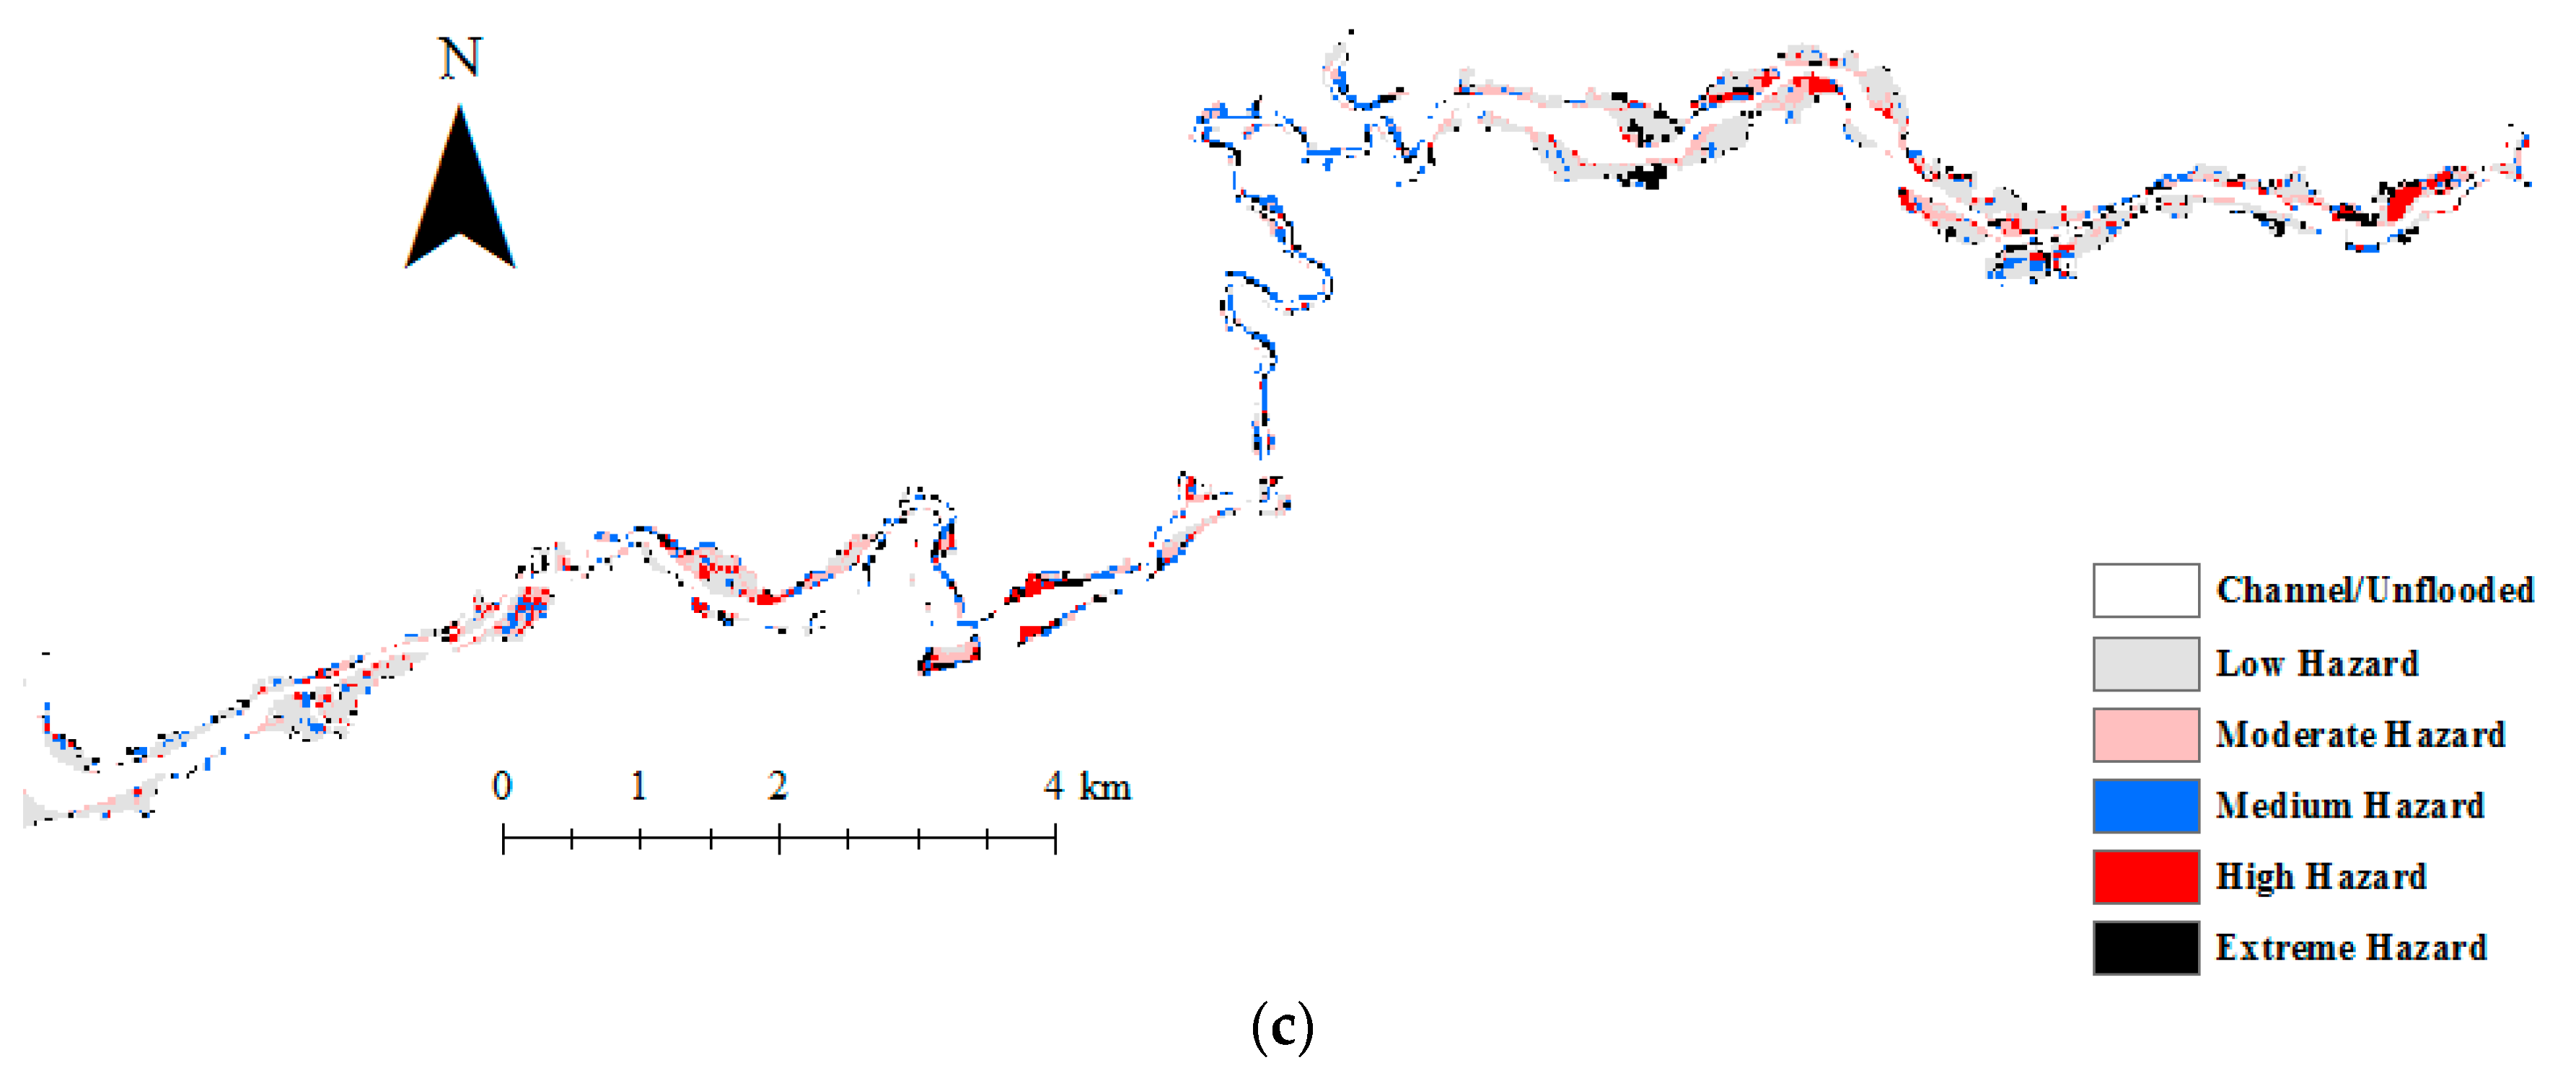
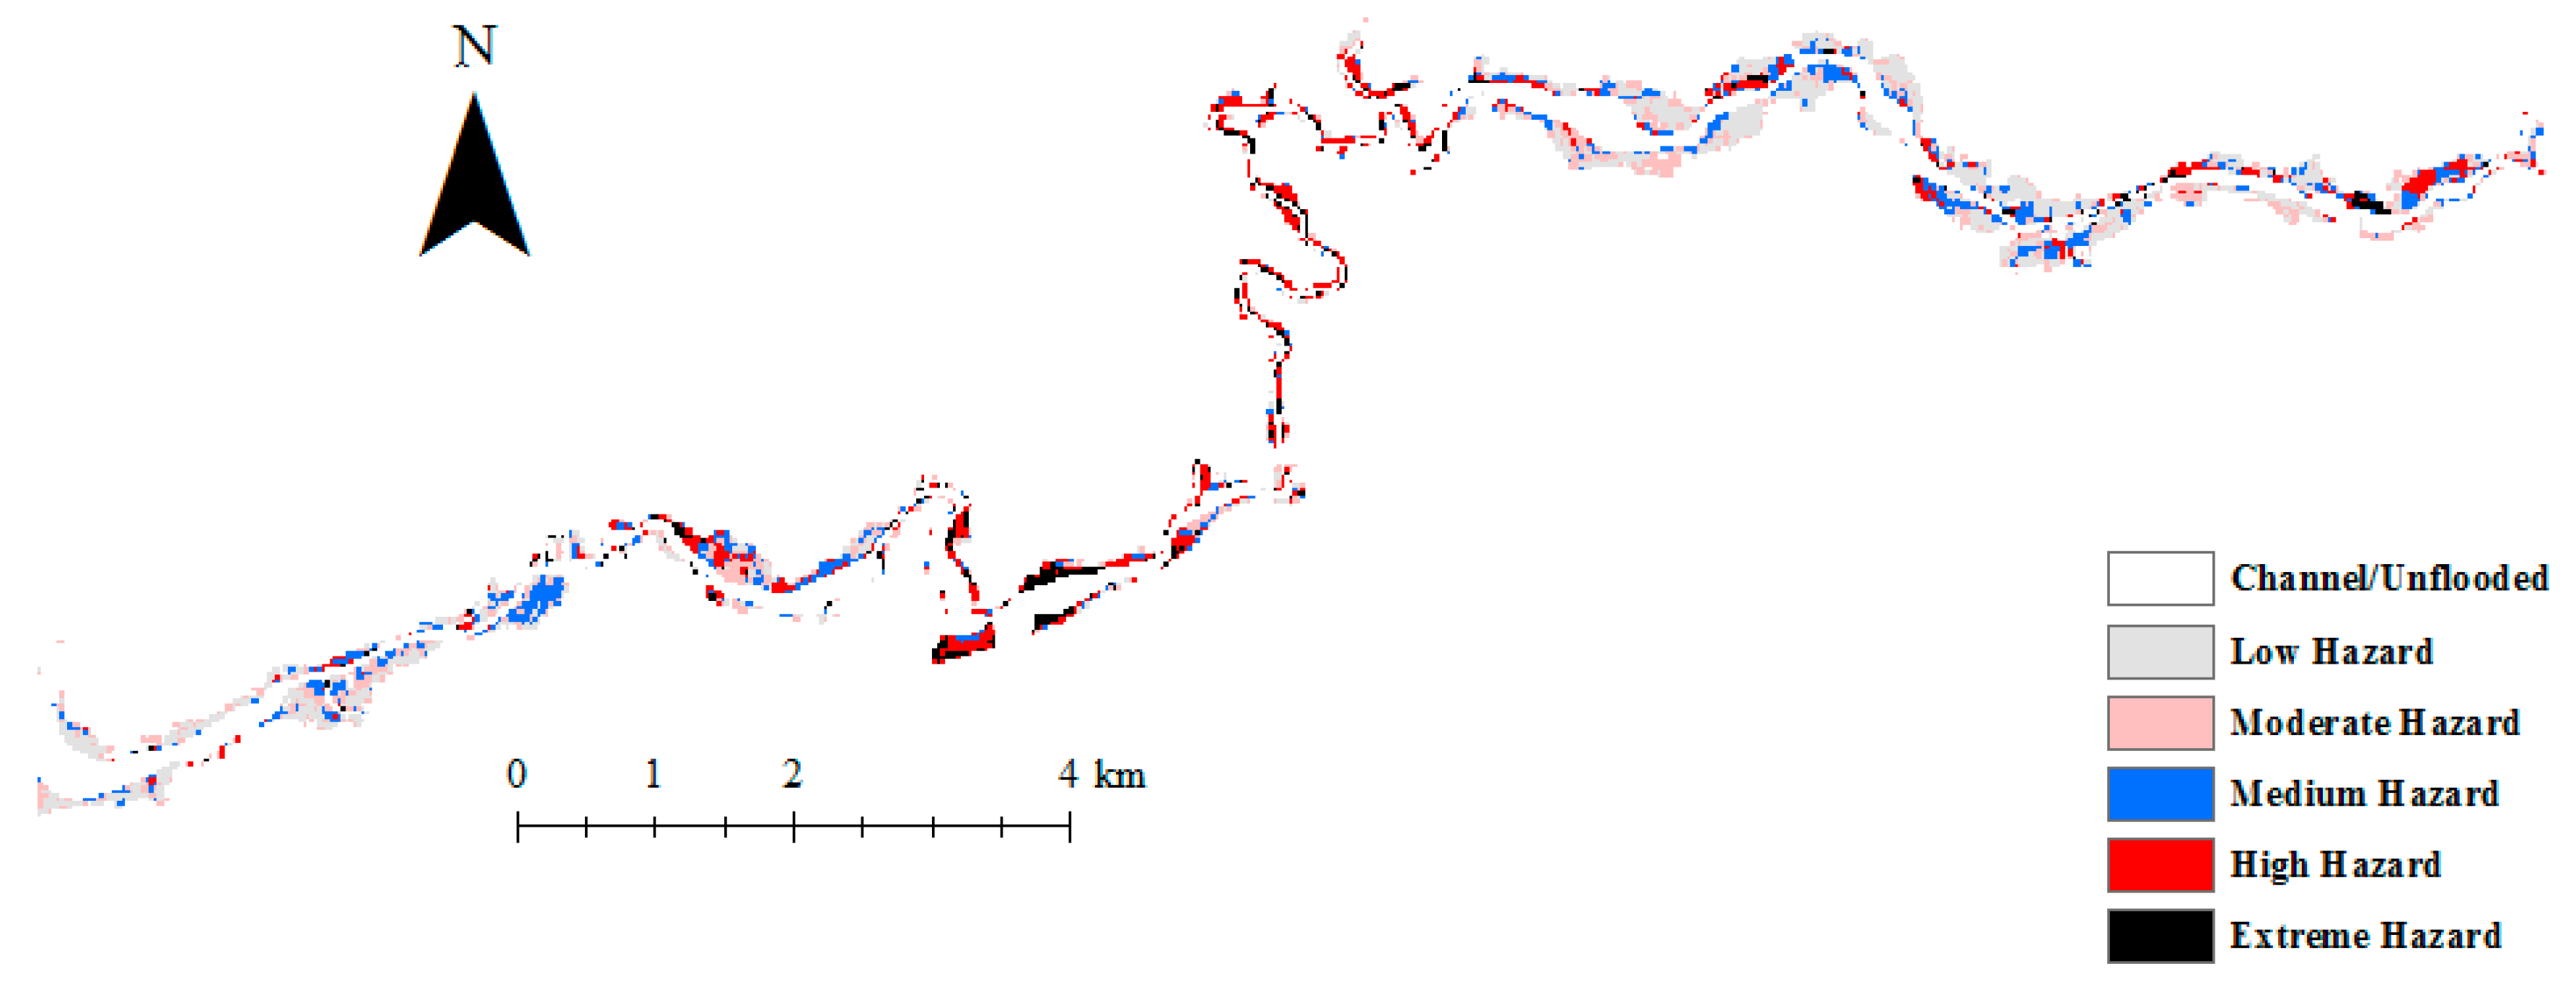
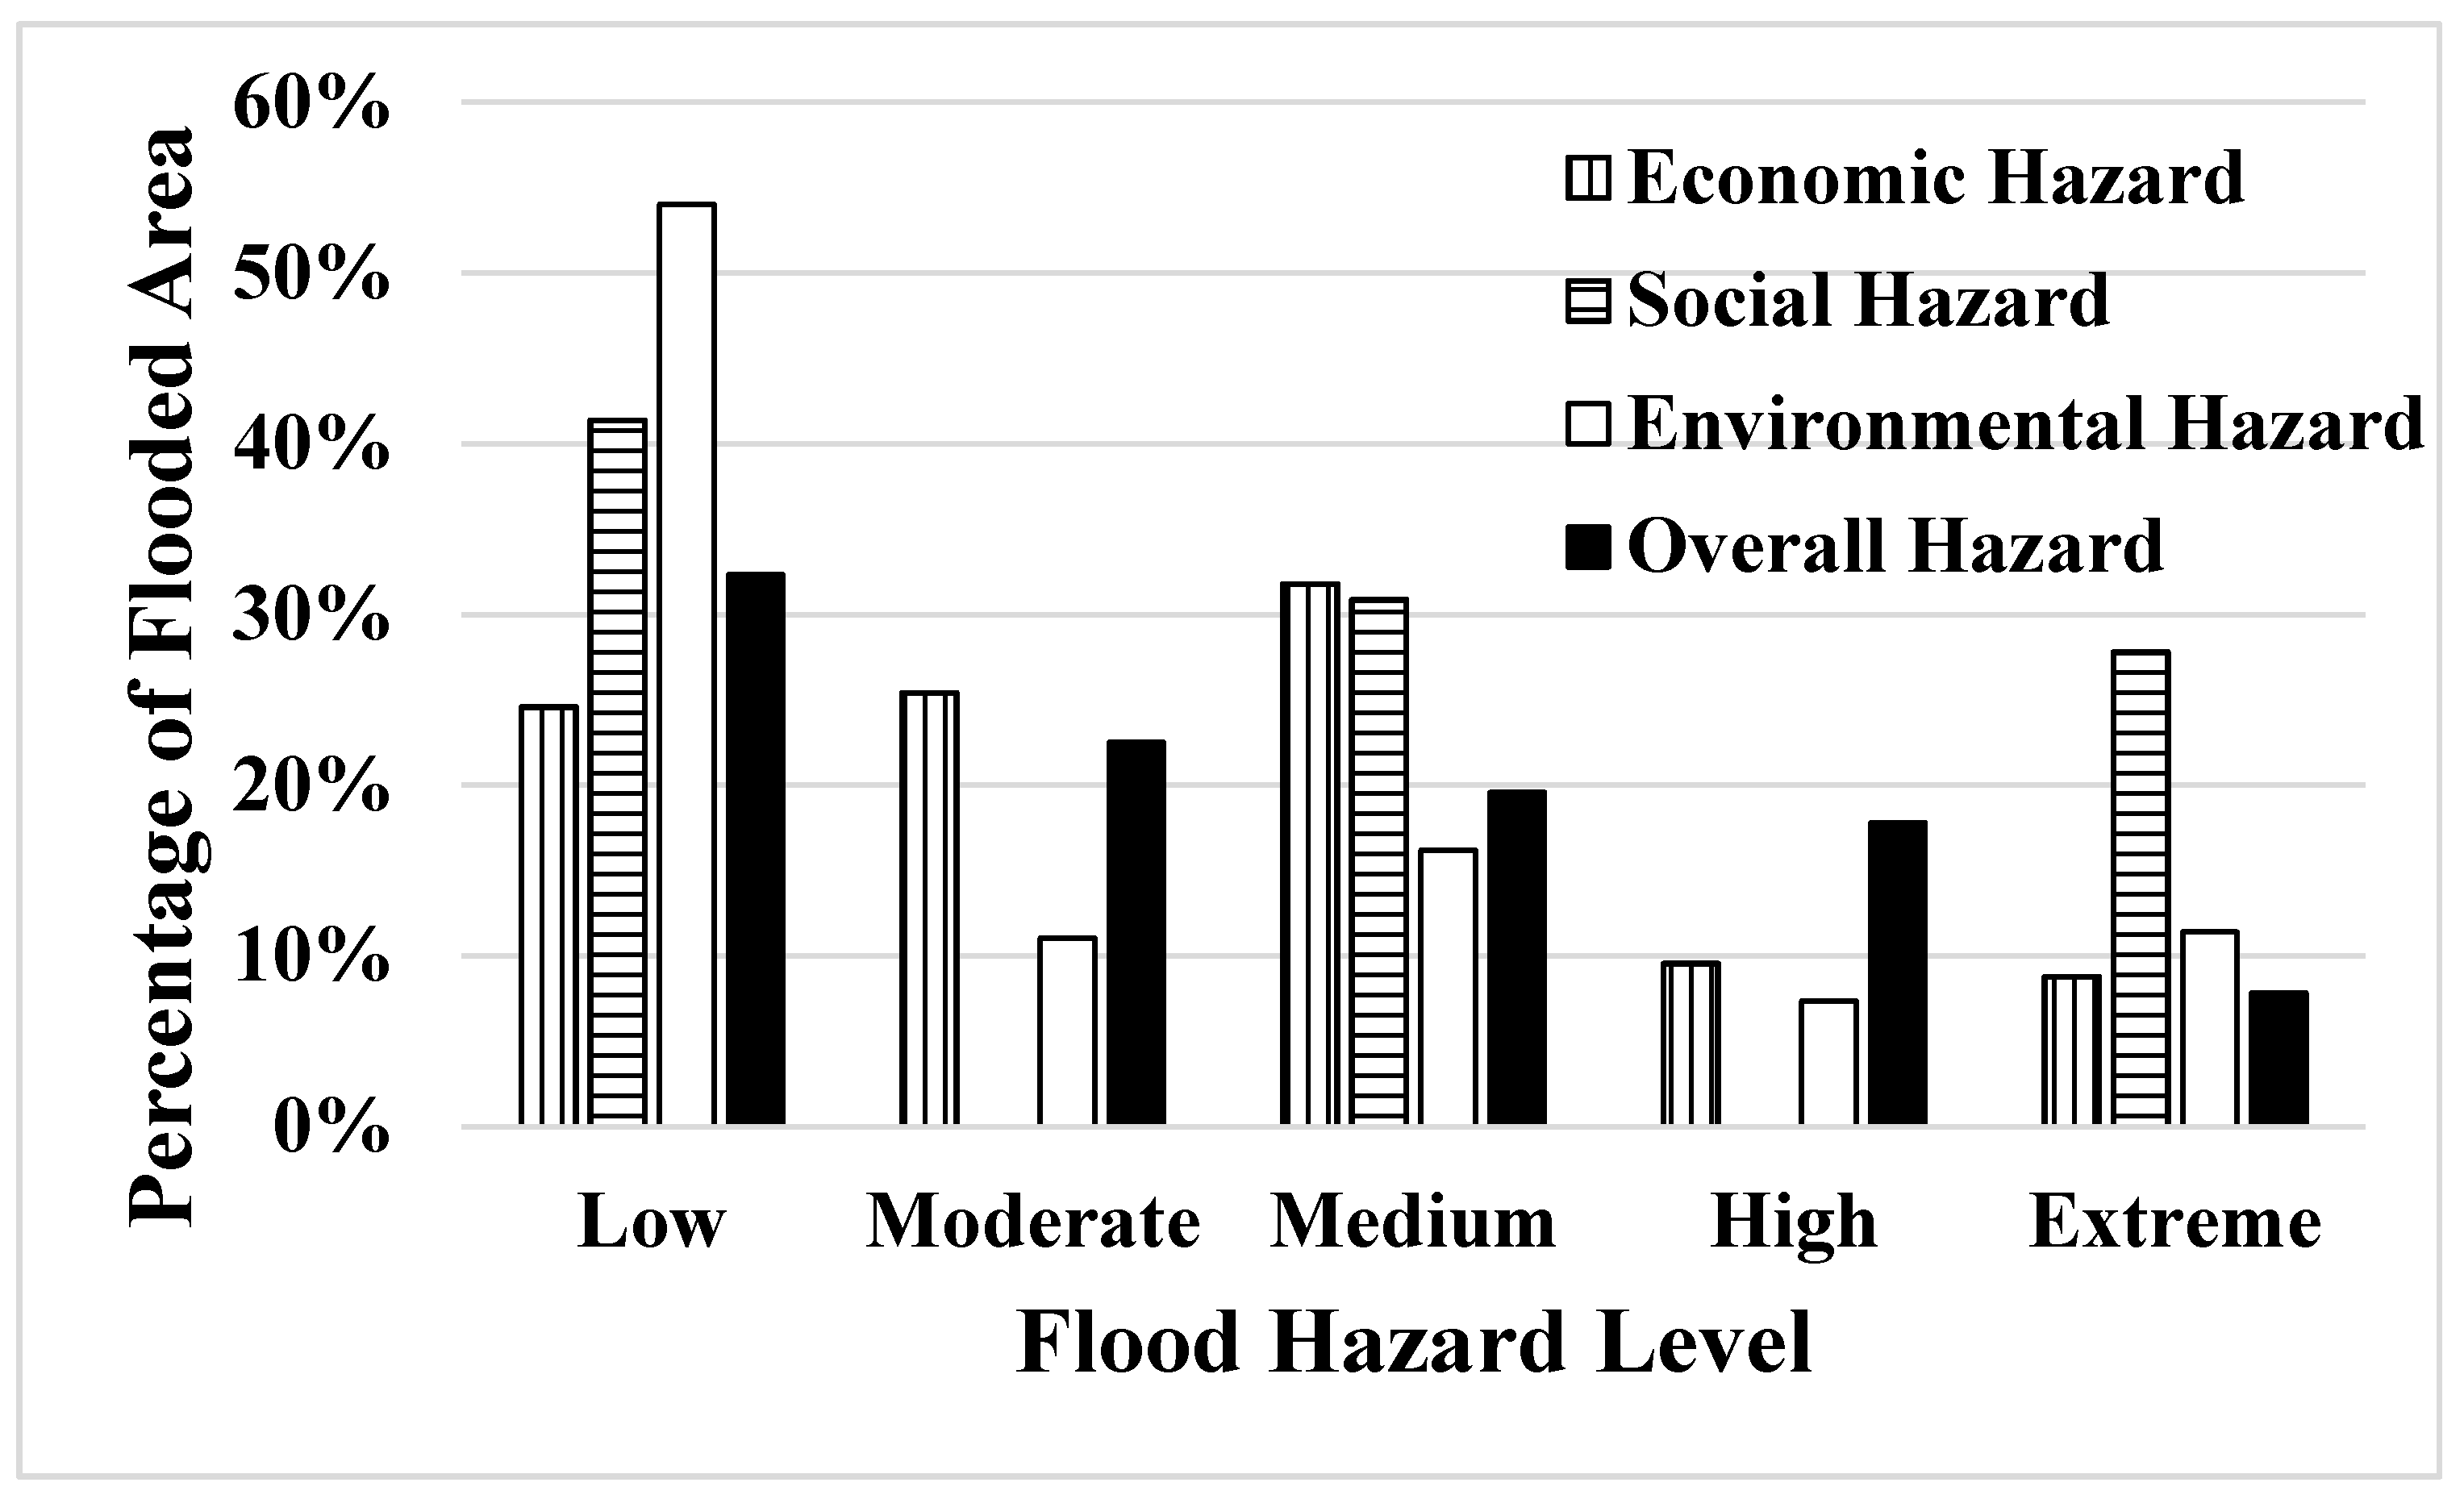
Using the flood parameters, a flood hazard map for each component (economic, social and environmental) is generated following the classification presented in Table 1. Such maps are presented in Figure 4. Combining these three flood hazard maps via the corresponding weights, the overall flood hazard map is populated for the 100-year flood event, which is visualized in Figure 5. The variation for each hazard class is presented in Figure 6. According to the figure, the most severe hazard (extreme class) in the watershed is on the society (27.8%) while the hazard to economy and environment is comparable. More than half of the flooded area (54.0%) is classified as low-hazard with respect to environmental impacts. Scrutinizing the environmental hazard indicators shows that erosion hazard is mostly higher than the pollution. This results from the fact the watershed is mostly hilly (see Section 2), where fast and short-lived flows are expected to occur. As a result, large flood impulse and short duration occurs, which leads to high erosion and low pollution potential. On the other hand, fewer cells are classified as low-hazard in terms of economic and social influences. In terms of overall hazard, 7.8% of the flooded area is classified as extreme-hazard while a major portion (74.4%) of the inundation area is classified under the high-hazard level.
4.3.3. Sensitivity Analysis
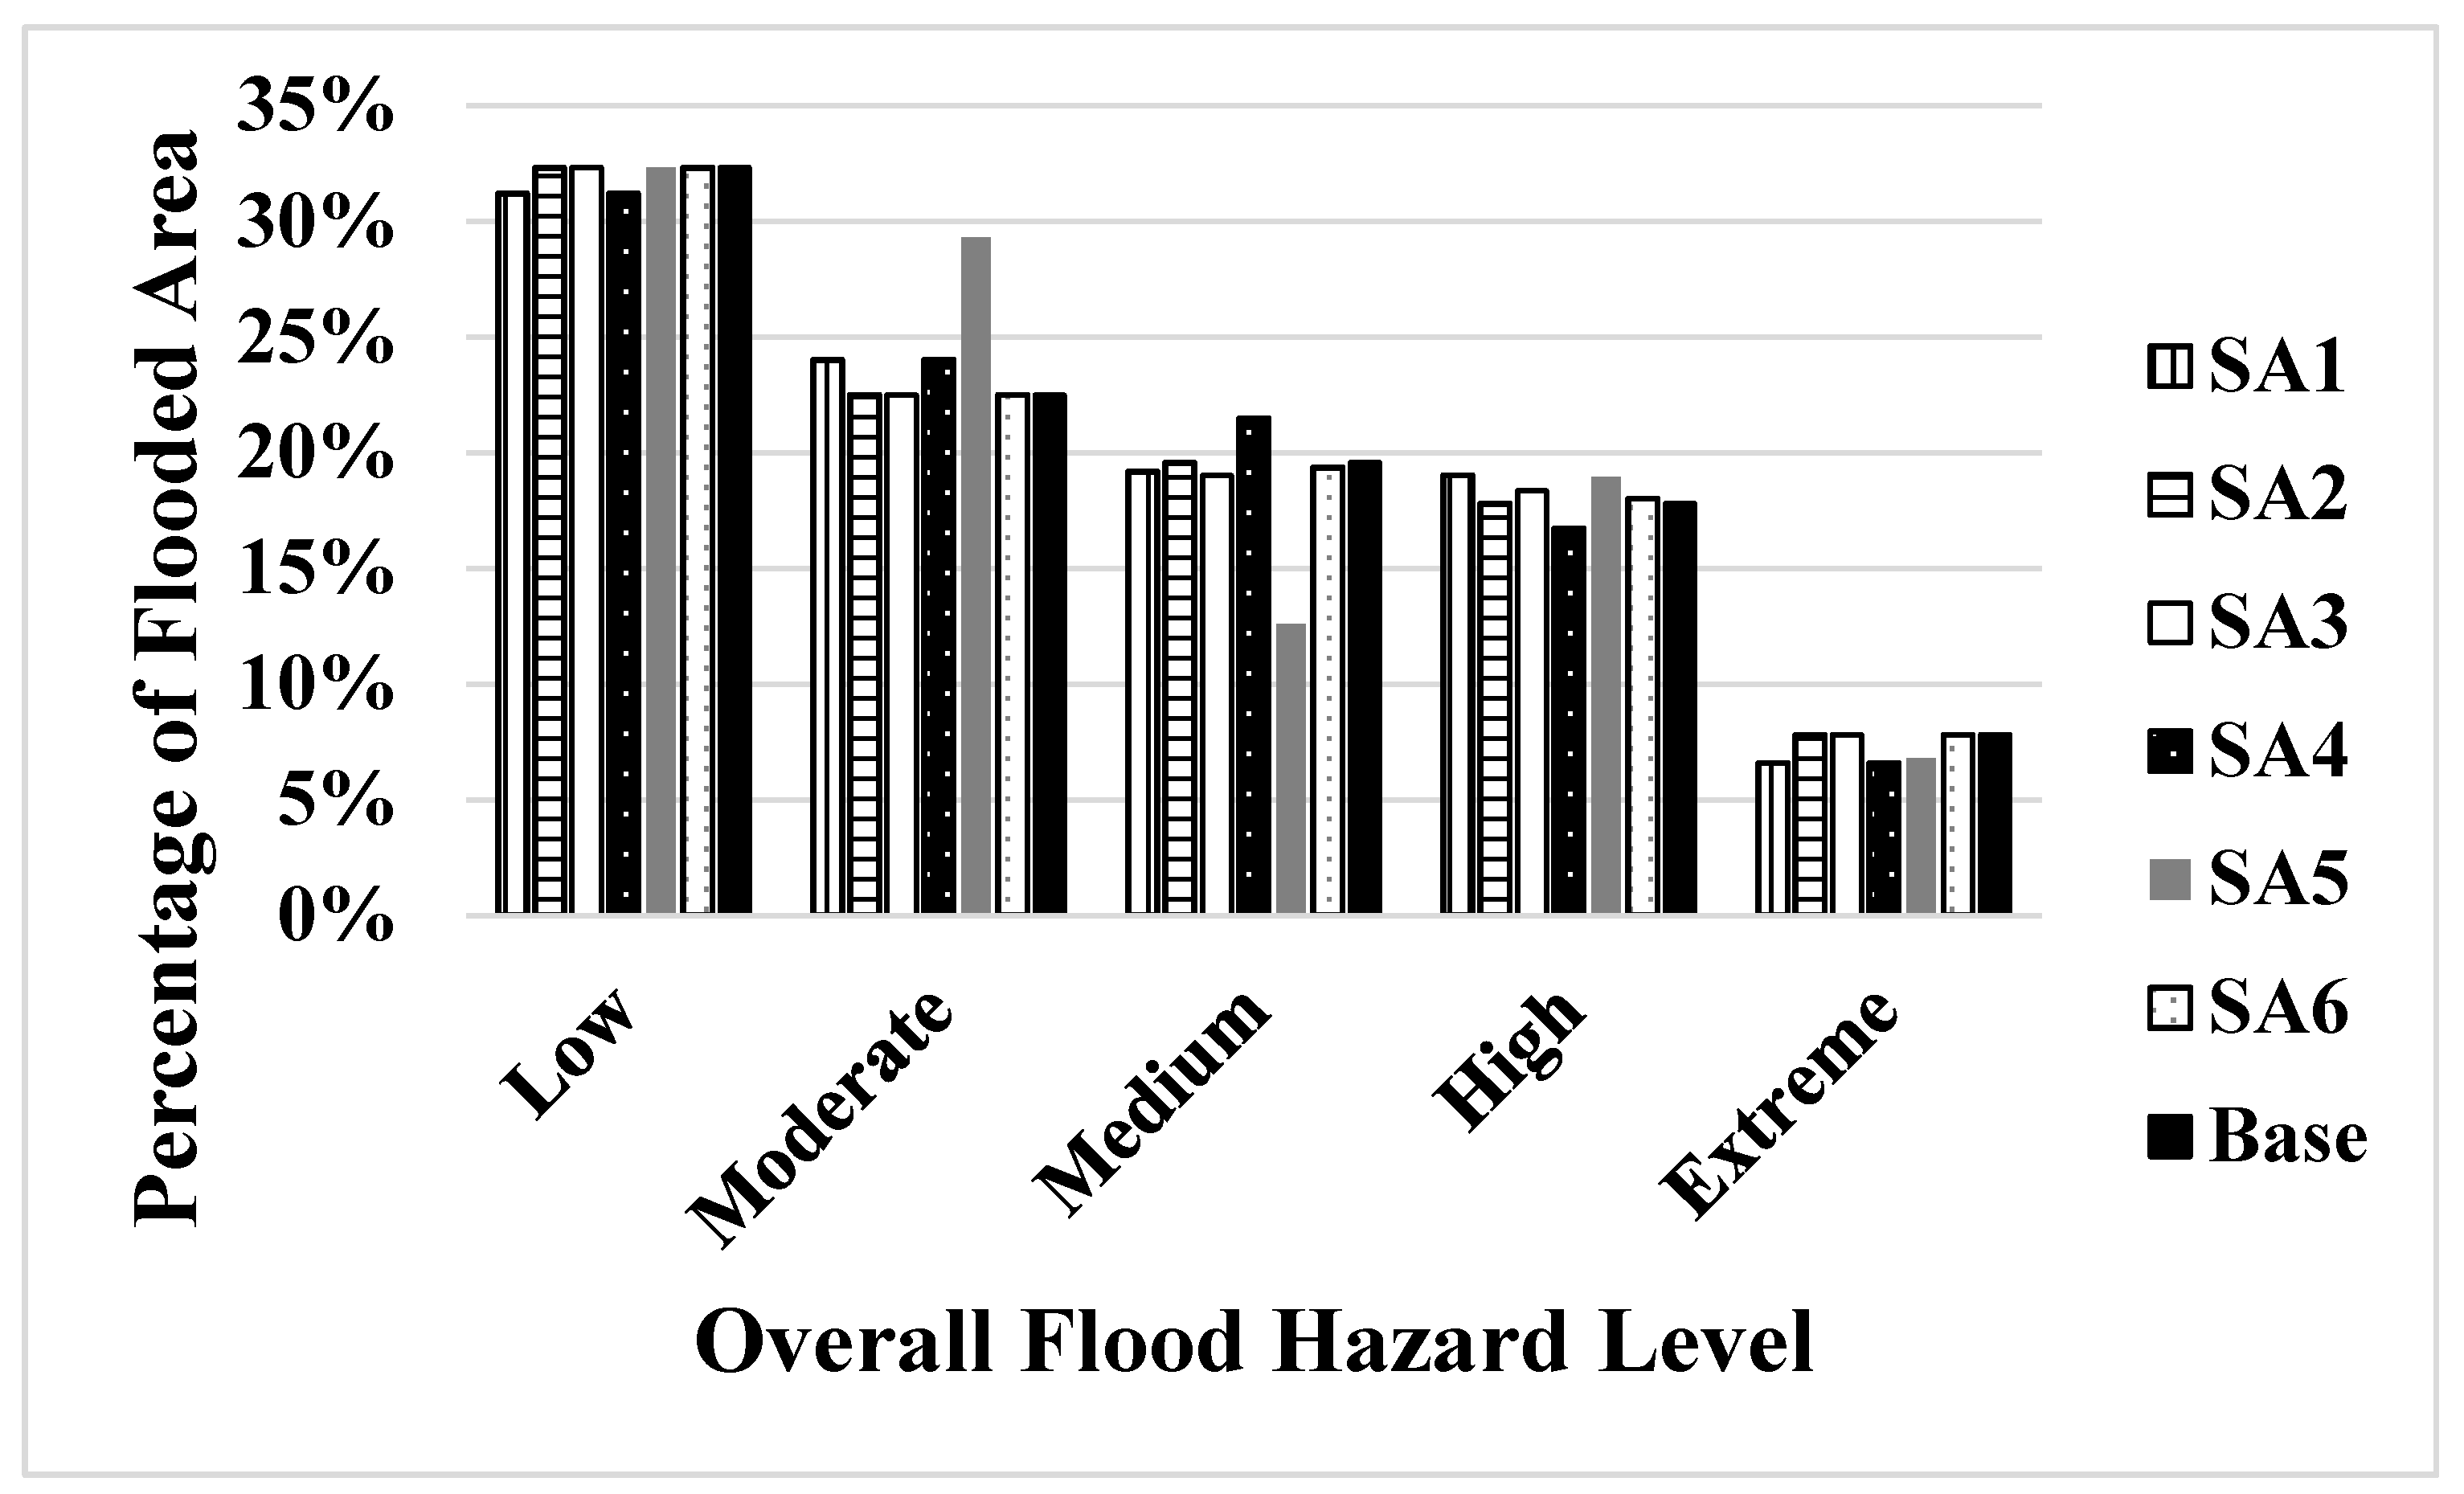
A sensitivity analysis is also performed to assess the robustness of initial hazard with respect to the components weights. In this study, six additional weight sets for three hazard components are defined in tandem with the initial weight set. The weight set scenarios are defined by 10% increase/decrease in the weights of the economic (SA1 and SA2), social (SA3 and SA4), environmental (SA5 and SA6) hazard components. Table 3 presents the weights of the hazard components in different sensitivity analysis scenarios and Figure 7 shows the percentage area of overall flood hazard in these scenarios. Of the five hazard levels, the groups of concern are the high and extreme levels. The sensitivity analysis indicates that there is a slight change of 2.3% and 1.2% in the high and extreme hazard classes, respectively. Such a minor variation confirms the robustness of the results obtained through the sustainability-based hazard mapping framework.
5. Discussion
The findings through the presented framework are subject to the limitations of the H&H models. In the hydrologic model, the nearest gaging approach was used to spatially distribute the rainfall depth to the subwatersheds. This approach impacts the timing of the derived design hydrograph and subsequently the time-variant flood parameters (velocity and duration). Therefore, the estimated social and environmental hazards, which depend on flood velocity and duration, are impacted. The impact is expected to be less on economic hazard (which was determined upon flood depth). The hydraulic model assumes a uniform Manning’s roughness for the entire simulation boundary. Since this parameter represents the resistance to flow, an uncertainty is introduced to the populated flood parameters. Flood2D-GPU is also less accurate in hilly areas due to bed discontinuity. A first-order upwind numerical scheme is likewise employed by the hydraulic model to solve the Saint Venant equations, which is incapable of capturing shocks and may yield flow discontinuities. This is unlikely to have a major impact on a rainfall-driven flooding, which was analyzed here, but can have a significant influence in dam break flooding.
The flood hazard mapping framework presented in this study can greatly help floodplain managers and insurance companies in better understanding the overall flood hazard for sustainability. With flood hazard mapping being a key element of FEMA’s National Flood Insurance Program (NFIP), the presented approach can assist in development of flood insurance rate maps (FIRMs) and planning for proper mitigation actions. A more sustainable hazard mapping approach advances the current practice and enhances the sustainability of the risk-reduction strategies proposed by the federal and local authorities. We illustrated how the integration of economic, social and environmental components promotes sustainability for flood management.
Development of a sustainability-based framework provides a more holistic understanding of the negative influences of flooding. This research focused on a single case, which allows making certain conclusions. Additional case studies using this framework will highlight the impact of watershed characteristics on the findings of this analysis. As mentioned in the Methodology section, the study watershed is mostly hilly and the flooding is often deep, flashy and short-lived. In a flat watershed, the economic and social hazard (depth and velocity were the indicators) are likely to be lower (for a given hydrograph and Manning’s roughness). Such a conclusion cannot be made for environmental hazard since it depends on all the three flood parameters (depth, velocity and duration). Furthermore, as described in Section 2, the Swannanoa watershed is predominantly rural. A more urbanized area with a greater Manning’s value, implying deeper, slower and longer flows (for a given hydrograph and ground slope). As a result, a greater hazard in terms of economy is most likely by applying the presented framework. However, such a conclusion cannot be made for other areas in terms of social and environmental hazards since they depend on a combination of flood depth, velocity and duration (in the presented flood hazard mapping framework). Further general conclusions about the overall flood hazard in other areas, which is directly related to consequence estimation, can be drawn only through additional research and case study applications.
The hazard components in the presented framework were considered upon direct impacts of flooding. To draw more comprehensive conclusions, indirect impacts of flooding such as delays and reduced connectivity in transportation network [61] should be taken into account. This might be done by revisiting the indicators and flood parameters (e.g., arrival time, rate of rise, time of flooding (day/night and summer/winter) and extent) that were used for each hazard component. Even in terms of direct impacts of flooding, all the influences were not taken into account. For instance, the economic hazard focused only on structural damages, while hazard to roads was neglected. Adding such additional indicators (i.e., damage to roads) would require adding other flood parameters into the economic hazard such as velocity [62]. In environmental hazard, other indicators such as the impact on uptake rate of soil can be incorporated alongside potential erosion and pollution.
In addition to the flood hazard components, hazard estimation can be performed using alternate methods for the indicators that were considered. For instance, the commonly-used practice to estimate structural damages in the U.S. is based on the flood depth [39], while European practice uses velocity in concert [37]. Alternatively, other studies proposed other parameters such as duration by Thieken et al. [47] and warning time by Graham [36]. Using other techniques can affect the number of cells in each hazard class and subsequently the aggregated flood hazard. Therefore, the presented results should not be taken as definitive flood hazard in the watershed. Instead, the study suggests an integrated framework, which provides a more sustainable approach to floodplain managers. The framework serves the decision makers with a more informative and holistic perspective of flood hazard.
The presented framework is to determine the severity of the flooding by considering only the flood parameters (and their combinations). The vulnerability of the receptors (e.g., buildings and people) and the exposure was not taken into account. Therefore, the results should not be mistaken as flood risk, which is a combination of hazard and vulnerability [63]. To estimate the flood risk, the information about the receptors must be overlaid with the flood hazard results of this study.
As mentioned earlier, a rainfall-driven flooding was studied in this paper. The presented sustainability-based framework is also proposed for this type of flooding. That said, the applicability of this framework to other flood types such as flash flooding and snowmelt requires additional research and should be cautiously applied to those conditions.
Since the focus of this study was to present a sustainability-based flood hazard mapping framework, a deterministic modeling approach was employed without accounting for the uncertainties. Uncertainty may arise from input variables, observed data, the choice of goodness-of-fit measures in calibration/validation, model structure and parameters [64,65,66], nonstationarity events such as changes in climate and LULC [67,68,69]. None of these were analyzed in this study. Therefore, it is recommended that these types of uncertainties be incorporated into the analysis and later be communicated to the managers and decision makers as they can significantly affect planning and decision-making [70,71,72].
6. Summary
A MCDM-based framework was presented for sustainability-based flood hazard mapping in the Swannanoa River watershed, located in the state of North Carolina, U.S. The framework used a hydrologic model for rainfall–runoff transformation, a 2D unsteady hydraulic model for flood simulation and a GIS-based weighted summation method for flood hazard mapping. Three hazard components, economic, social, and environmental hazards, were used as the components to undertake the sustainability-based flood hazard mapping. Supported with a survey results, these components were combined on a cell-by-cell basis and an aggregated flood hazard map was generated, which showed the overall hazard in each geographic location. A sensitivity analysis was also performed to evaluate the sensitivity of the populated sustainability-based flood hazard map with respect to the three components weights.
While the commonly-used practice of flood risk analysis focuses on economic and social impacts of flooding, this research presented a framework to account for the environmental influences concurrently. A better understanding of the flooding impacts can be used to develop new strategies for protecting flood-prone areas. The presented framework promotes the sustainability of floodplain management decisions and guides future policy and planning decisions. The case study results serve as an example to floodplain managers and decision makers working on complex floodplain systems but our proposed approach can be applied to other regions due to its versatility.
Acknowledgments
The authors are grateful to the financial support of the Center of Management, Utilization, and Protection of Water Resources at Tennessee Technological University and Virginia Tech’s Open Access Subvention Fund (OASF). We truly appreciate Jessica Oswalt and Ferdinand DiFurio for the helpful comments on the survey design, Michael Gee and Jim Fox for valuable comments on hydraulic modeling and flood hazard mapping, and Amy Hill for editing the article. Many thanks are given to all the participators in the survey who provided us with their valuable opinions.
Author Contributions
Ebrahim Ahmadisharaf designed and performed the survey, carried out H&H modeling and flood hazard mapping, interpreted the results, and drafted the initial version of the paper under the supervision of Alfred J. Kalyanapu. Alfred J. Kalyanapu assisted in survey design, interpreting the results and editing the article. Eun-Sung Chung assisted in survey design and provided a critical review of the paper.
Conflicts of Interest
The authors declare no conflict of interest.
References and Notes
- Levy, J.K.; Hartmann, J.; Li, K.W.; An, Y.; Asgary, A. Multi-Criteria Decision Support Systems for flood hazard mitigation and emergency response in urban watersheds. J. Am. Water Resour. Assoc. 2007, 43, 346–358. [Google Scholar] [CrossRef]
- Schröter, K.; Kreibich, H.; Vogel, K.; Riggelsen, C.; Scherbaum, F.; Merz, B. How useful are complex flood damage models? Water Resour. Res. 2014, 50, 3378–3395. [Google Scholar] [CrossRef]
- Fernandez, D.S.; Lutz, M.A. Urban flood hazard zoning in Tucumán Province, Argentina, using GIS and multicriteria decision analysis. Eng. Geol. 2010, 111, 90–98. [Google Scholar] [CrossRef]
- Kourgialas, N.N.; Karatzas, G.P. Flood management and a GIS modelling method to assess flood-hazard areas—A case study. Hydrol. Sci. J. 2011, 56, 212–225. [Google Scholar] [CrossRef]
- Papaioannou, G.; Vasiliades, L.; Loukas, A. Multi-criteria analysis framework for potential flood prone areas mapping. Water Resour. Manag. 2015, 29, 399–418. [Google Scholar] [CrossRef]
- Radmehr, A.; Araghinejad, S. Developing strategies for urban flood management of Tehran city using SMCDM and ANN. J. Comput. Civ. Eng. 2014, 28, 05014006. [Google Scholar] [CrossRef]
- Rahmati, O.; Zeinivand, H.; Besharat, M. Flood hazard zoning in Yasooj region, Iran, using GIS and multi-criteria decision analysis. Geomat. Nat. Hazards Risk 2016, 7, 1000–1017. [Google Scholar] [CrossRef]
- Stefanidis, S.; Stathis, D. Assessment of flood hazard based on natural and anthropogenic factors using analytic hierarchy process (AHP). Nat. Hazards 2013, 68, 569–585. [Google Scholar] [CrossRef]
- Kundzewicz, Z.W. Flood protection—Sustainability issues. Hydrol. Sci. J. 1999, 44, 559–571. [Google Scholar] [CrossRef]
- Kundzewicz, Z.W.; Takeuchi, K. Flood protection and management: Quo vadimus? Hydrol. Sci. J. 1999, 44, 417–432. [Google Scholar] [CrossRef]
- Carter, J.G.; White, I.; Richards, J. Sustainability appraisal and flood risk management. Environ. Impact Assess. Rev. 2009, 29, 7–14. [Google Scholar] [CrossRef]
- Ni, J.; Sun, L.; Li, T.; Huang, Z.; Borthwick, A.G. Assessment of flooding impacts in terms of sustainability in mainland China. J. Environ. Manag. 2010, 91, 1930–1942. [Google Scholar] [CrossRef] [PubMed]
- Hall, J.; Solomatine, D. A framework for uncertainty analysis in flood risk management decisions. Int. J. River Basin Manag. 2008, 6, 85–98. [Google Scholar] [CrossRef]
- Kang, M.G.; Jeong, H.S.; Lee, J.H.; Kang, B.S. Assessing national flood management using a sustainable flood management framework. Water Policy 2013, 15, 418–434. [Google Scholar] [CrossRef]
- Meyer, V.; Scheuer, S.; Haase, D. A multicriteria approach for flood risk mapping exemplified at the Muddle River, Germany. Nat. Hazards 2009, 48, 17–39. [Google Scholar] [CrossRef]
- Treby, E.J.; Clark, M.J.; Priest, S.J. Confronting flood risk: Implications for insurance and risk transfer. J. Environ. Manag. 2006, 81, 351–359. [Google Scholar] [CrossRef] [PubMed]
- Hansson, K.; Danielson, M.; Ekenberg, L.; Buurman, J. Multiple criteria decision making for flood risk management. In Integrated Catastrophe Risk Modeling: Supporting Policy and Processes; Amendola, A., Ermolieva, T., Linnerooth-Bayer, J., Mechler, R., Eds.; Springer: Dordrecht, The Netherlands, 2013; pp. 53–72. [Google Scholar]
- Lee, G.M.; Jun, K.S.; Chung, E.S. Integrated multi-criteria flood vulnerability approach using Fuzzy TOPSIS and Delphi technique. Nat. Hazards Earth Syst. Sci. 2013, 13, 1293–1312. [Google Scholar] [CrossRef]
- Akter, T.; Simonovic, S.P. Aggregation of fuzzy views of a large number of stakeholders for multi-objective flood management decision-making. J. Environ. Manag. 2005, 77, 133–143. [Google Scholar] [CrossRef] [PubMed]
- Akter, T.; Simonovic, S.P.; Salonga, J. Aggregation of inputs from stakeholders for flood management decision-making in the Red River Basin. Can. Water Resour. J. 2004, 29, 251–266. [Google Scholar] [CrossRef]
- Evers, M.; Nyberg, L. Coherence and inconsistency of European instruments for integrated river basin management. Int. J. River Basin Manag. 2013, 11, 139–152. [Google Scholar] [CrossRef]
- Kundzewicz, Z.W. Non-structural flood protection and sustainability. Water Int. 2002, 27, 3–13. [Google Scholar] [CrossRef]
- Werritty, A. Sustainable flood management: Oxymoron or new paradigm? Area 2006, 38, 16–23. [Google Scholar] [CrossRef]
- Edjossan-Sossou, A.M.; Deck, O.; Al Heib, M.; Verdel, T. A decision-support methodology for assessing the sustainability of natural risk management strategies in urban areas. Nat. Hazards Earth Syst. Sci. 2014, 14, 3207–3230. [Google Scholar] [CrossRef] [Green Version]
- Evers, M.; Jonoski, A.; Almoradie, A.; Lange, L. Collaborative decision making in sustainable flood risk management: A socio-technical approach and tools for participatory governance. Environ. Sci. Policy 2016, 55, 335–344. [Google Scholar] [CrossRef]
- U.S. Army Corps of Engineers. Swannanoa River Watershed Flood Risk Reduction Project. 2015. Available online: http://www.lrn.usace.army.mil/Media/FactSheets/FactSheetArticleView/tabid/6992/Article/562061/swannanoa-river-watershed-flood-risk-reduction-project.aspx (accessed on 1 June 2015).
- NRCS. Urban Hydrology for Small Watersheds; Technical Release 55; Conservation Engineering Division, NRCS, U.S. Department of Agriculture: Washington, DC, USA, 1986.
- U.S. Army Corps of Engineers. Method of Flow Routing; Report on Survey for Flood Control, Connecticut River Valley, Volume 1, Section 1, Appendix; Providence, RI, USA, 1936.
- Ahmadisharaf, E. A Coupled Probabilistic Hydrologic/Hydraulic Modeling Framework to Investigate the Impacts of Hydrograph Uncertainty on Flood Consequences. Ph.D. Thesis, Tennessee Technological University, Cookeville, TN, USA, 2016. [Google Scholar]
- Kalyanapu, A.J.; Shankar, S.; Pardyjak, E.R.; Judi, D.R.; Burian, S.J. Assessment of GPU computational enhancement to a 2D flood model. Environ. Model. Softw. 2011, 26, 1009–1016. [Google Scholar] [CrossRef]
- Ahmadisharaf, E.; Bhuyian, M.; Kalyanapu, A.J. Impact of spatial resolution on downstream flood hazard due to dam break events using probabilistic flood modeling. In Proceedings of the Dam Safety Conference, ASDSO, Providence, RI, USA, 8–12 September 2013; pp. 263–276. [Google Scholar]
- Kalyanapu, A.J.; Hossain, A.A.; Kim, J.; Yigzaw, W.; Hossain, F.; Shum, C.K. Toward a methodology to investigate the downstream flood hazards on the American River due to changes in probable maximum flood due to effects of artificial reservoir size and land-use/land-cover patterns. Earth Interact. 2013, 17, 1–24. [Google Scholar] [CrossRef]
- Kalyanapu, A.J.; Judi, D.R.; McPherson, T.N.; Burian, S.J. Monte Carlo-based flood modelling framework for estimating probability weighted flood risk. J. Flood Risk Manag. 2012, 5, 37–48. [Google Scholar] [CrossRef]
- Kalyanapu, A.J.; Judi, D.R.; McPherson, T.N.; Burian, S.J. Annualised risk analysis approach to recommend appropriate level of flood control: Application to Swannanoa river watershed. J. Flood Risk Manag. 2015, 8, 368–385. [Google Scholar] [CrossRef]
- Yigzaw, W.; Hossain, F.; Kalyanapu, A.J. Comparison of PMP-driven probable maximum floods with flood magnitudes due to increasingly urbanized catchment: The case of American River watershed. Earth Interact. 2013, 17, 1–15. [Google Scholar] [CrossRef]
- Graham, W.J. A Procedure for Estimating Loss of Life Caused by Dam Failure; Report No. DSO-99-06; Dam Safety Office, U.S. Bureau of Reclamation: Denver, CO, USA, 1999.
- Prinos, P.; Kortenhaus, A.; Swerpel, B.; Jimenez, J.A.; Samuels, P. Review on Flood Hazard Mapping; FLOODsite Project, Report No. T03-07-01, Revision No. 4_3_P01. 2009. Available online: http://www.floodsite.net/html/partner_area/project_docs/T03_07_01_Review_Hazard_Mapping_V4_3_P01.pdf (accessed on 16 July 2017).
- FEMA. Definitions of FEMA Flood Zone Designations. 2016. Available online: https://snmapmod.snco.us/fmm/document/fema-flood-zone-definitions.pdf (accessed on 18 January 2017).
- U.S. Army Corps of Engineers. Generic Depth-Damage Relationships for Residential Structures without Basements; Economic Guidance Memorandum, No. 1–3; 2000.
- Merz, B.; Kreibich, H.; Schwarze, R.; Thieken, A. Review article “Assessment of economic flood damage”. Nat. Hazards Earth Syst. Sci. 2010, 10, 1697–1724. [Google Scholar] [CrossRef]
- Abrishamchi, A.; Dashti, M.; Alamdari, N.; Salavitabar, A. A GIS-Google earth based approach to estimating the flood damage function in large river basins. In Proceedings of the World Environmental and Water Resources Congress, Palm Springs, CA, USA, 22–26 May 2011; pp. 3811–3821. [Google Scholar]
- Kubal, C.; Haase, D.; Meyer, V.; Scheuer, S. Integrated urban flood risk assessment–adapting a multicriteria approach to a city. Nat. Hazards Earth Syst. Sci. 2009, 9, 1881–1895. [Google Scholar] [CrossRef]
- Yang, M.; Qian, X.; Zhang, Y.; Sheng, J.; Shen, D.; Ge, Y. Spatial multicriteria decision analysis of flood risks in aging-dam management in China: A framework and case study. Int. J. Environ. Res. Public Health 2011, 8, 1368–1387. [Google Scholar] [CrossRef] [PubMed]
- ACER. Downstream Hazard Classification Guidelines; Technical Memorandum No. 11; US Bureau of Reclamation: Denver, CO, USA, 1988.
- Dang, N.M.; Babel, M.S.; Luong, H.T. Evaluation of food risk parameters in the Day River flood diversion area, Red River delta, Vietnam. Nat. Hazards 2011, 56, 169–194. [Google Scholar] [CrossRef]
- Scheuer, S.; Haase, D.; Meyer, V. Exploring multicriteria flood vulnerability by integrating economic, social and ecological dimensions of flood risk and coping capacity: From a starting point view towards an end point view of vulnerability. Nat. Hazards 2011, 58, 731–751. [Google Scholar] [CrossRef]
- Thieken, A.H.; Müller, M.; Kreibich, H.; Merz, B. Flood damage and influencing factors: New insights from the August 2002 flood in Germany. Water Resour. Res. 2005, 41, W12430. [Google Scholar] [CrossRef]
- Penning-Rowsell, E.C.; Green, C.H.; Thompson, P.M.; Coker, A.M.; Tunstall, S.M.; Richards, C.; Parker, D.J. The Economics of Coastal Management: A Manual of Benefit Assessment Techniques, 1st ed.; Belhaven Press: London, UK, 1992. [Google Scholar]
- Förster, S.; Kuhlmann, B.; Lindenschmidt, K.E.; Bronstert, A. Assessing flood risk for a rural detention area. Nat. Hazards Earth Syst. Sci. 2008, 8, 311–322. [Google Scholar] [CrossRef]
- Munda, G. Social multi-criteria evaluation for urban sustainability policies. Land Use Policy 2006, 23, 86–94. [Google Scholar] [CrossRef]
- Chen, H.; Wood, M.D.; Linstead, C.; Maltby, E. Uncertainty analysis in a GIS-based multi-criteria analysis tool for river catchment management. Environ. Model. Softw. 2011, 26, 395–405. [Google Scholar] [CrossRef]
- Evers, M.; Jonoski, A.; Lange, L.; Ochoa Rodriguez, S.; Teklesadik, A.; Cortes Arevalo, J.; Almoradie, A.; Eduardo Simoes, N.; Wang, L.; Makropoulos, C. Collaborative modelling for active involvement of stakeholders in urban flood risk management. Nat. Hazards Earth Syst. Sci. 2012, 12, 2821–2842. [Google Scholar] [CrossRef]
- Challies, E.; Newig, J.; Thaler, T.; Kochskämper, E.; Levin-Keitel, M. Participatory and collaborative governance for sustainable flood risk management: An emerging research agenda. Environ. Sci. Policy 2016, 55, 275–280. [Google Scholar] [CrossRef]
- Kodikara, P.N.; Perera, B.J.C.; Kularathna, M.D.U.P. Stakeholder preference elicitation and modelling in multi-criteria decision analysis–A case study on urban water supply. Eur. J. Oper. Res. 2010, 206, 209–220. [Google Scholar] [CrossRef]
- Keller, G. Statistics for Management and Economics, 9th ed.; South-Western Cengage Learning: Mason, OH, USA, 2012. [Google Scholar]
- Ahmadisharaf, E.; Tajrishy, M.; Alamdari, N. Integrating flood hazard into site selection of detention basins using spatial multi-criteria decision-making. J. Environ. Plan. Manag. 2016, 59, 1397–1417. [Google Scholar] [CrossRef]
- Horritt, M.S. Calibration of a two-dimensional finite element flood flow model using satellite radar imagery. Water Resour. Res. 2000, 36, 3279–3291. [Google Scholar] [CrossRef]
- Horritt, M.S.; Bates, P.D. Predicting floodplain inundation: Raster-based modelling versus the finite-element approach. Hydrol. Process. 2001, 15, 825–842. [Google Scholar] [CrossRef]
- Bonnin, G.M.; Martin, D.; Lin, B.; Parzybok, T.; Yekta, M.; Riley, D. Precipitation frequency Atlas of the United States; NOAA Atlas 14, Volume 2, Version 3.0; National Weather Service, NOAA: Silver Spring, MD, USA, 2006.
- Ahmadisharaf, E.; Kalyanapu, A.J.; Chung, E.S. Evaluating the effects of inundation duration and velocity on selection of flood management alternatives using multi-criteria decision making. Water Resour. Manag. 2015, 29, 2543–2561. [Google Scholar] [CrossRef]
- Asadabadi, A.; Miller-Hooks, E. Assessing strategies for protecting transportation infrastructure from an uncertain climate future. Transp. Res. Part A Policy Pract. 2017, 105, 27–41. [Google Scholar] [CrossRef]
- Kreibich, H.; Piroth, K.; Seifert, I.; Maiwald, H.; Kunert, U.; Schwarz, J.; Merz, B.; Thieken, A.H. Is flow velocity a significant parameter in flood damage modelling? Nat. Hazards Earth Syst. Sci. 2009, 9, 1679–1692. [Google Scholar] [CrossRef]
- Knight, F.H. Risk, Uncertainty, and Profit; Hart, Schaffner and Marx: New York, NY, USA, 1921. [Google Scholar]
- Merwade, V.; Olivera, F.; Arabi, M.; Edleman, S. Uncertainty in flood inundation mapping: Current issues and future directions. J. Hydrol. Eng. 2008, 13, 608–620. [Google Scholar] [CrossRef]
- Pappenberger, F.; Matgen, P.; Beven, K.J.; Henry, J.B.; Pfister, L. Influence of uncertain boundary conditions and model structure on flood inundation predictions. Adv. Water Resour. 2006, 29, 1430–1449. [Google Scholar] [CrossRef]
- Smemoe, C.M.; Nelson, E.J.; Zundel, A.K.; Miller, A.W. Demonstrating floodplain uncertainty using flood probability maps. J. Am. Water Resour. Assoc. 2007, 43, 359–371. [Google Scholar] [CrossRef]
- Gilroy, K.L.; McCuen, R.H. A nonstationary flood frequency analysis method to adjust for future climate change and urbanization. J. Hydrol. 2012, 414–415, 40–48. [Google Scholar] [CrossRef]
- Hirabayashi, Y.; Mahendran, R.; Koirala, S.; Konoshima, L.; Yamazaki, D.; Watanabe, S.; Kim, H.; Kanae, S. Global flood risk under climate change. Nat. Clim. Chang. 2013, 3, 816–821. [Google Scholar] [CrossRef]
- Nazari, B.; Seo, D.J.; Muttiah, R. Assessing the impact of variations in hydrologic, hydraulic and hydrometeorological controls on inundation in urban areas. J. Water Manag. Model. 2016. [Google Scholar] [CrossRef]
- Ahmadisharaf, E.; Kalyanapu, A.J.; Chung, E.S. Spatial probabilistic multi-criteria decision making for assessment of flood management alternatives. J. Hydrol. 2016, 533, 365–378. [Google Scholar] [CrossRef]
- Pappenberger, F.; Stephens, E.; Thielen, J.; Salamon, P.; Demeritt, D.; vanAndel, S.J.; Watterhall, F.; Alfieri, L. Visualizing probabilistic flood forecast information: Expert preferences and perceptions of best practice in uncertainty communication. Hydrol. Process. 2013, 27, 132–146. [Google Scholar] [CrossRef]
- Rosner, A.; Vogel, R.M.; Kirshen, P.H. A risk-based approach to flood management decisions in a nonstationary world. Water Resour. Res. 2014, 50, 1928–1942. [Google Scholar] [CrossRef]
Figure 1.
Location of the Swannanoa River watershed along with the US states (Image source: ArcGISTM).
Figure 1.
Location of the Swannanoa River watershed along with the US states (Image source: ArcGISTM).

Figure 2.
Schematic of the sustainability-based flood hazard mapping framework.

Figure 3.
Hierarchical structure of the sustainability-based flood hazard mapping framework.

Figure 4.
The maps of: (a) economic; (b) social; and (c) environmental flood hazard for the 100-year design event.
Figure 4.
The maps of: (a) economic; (b) social; and (c) environmental flood hazard for the 100-year design event.
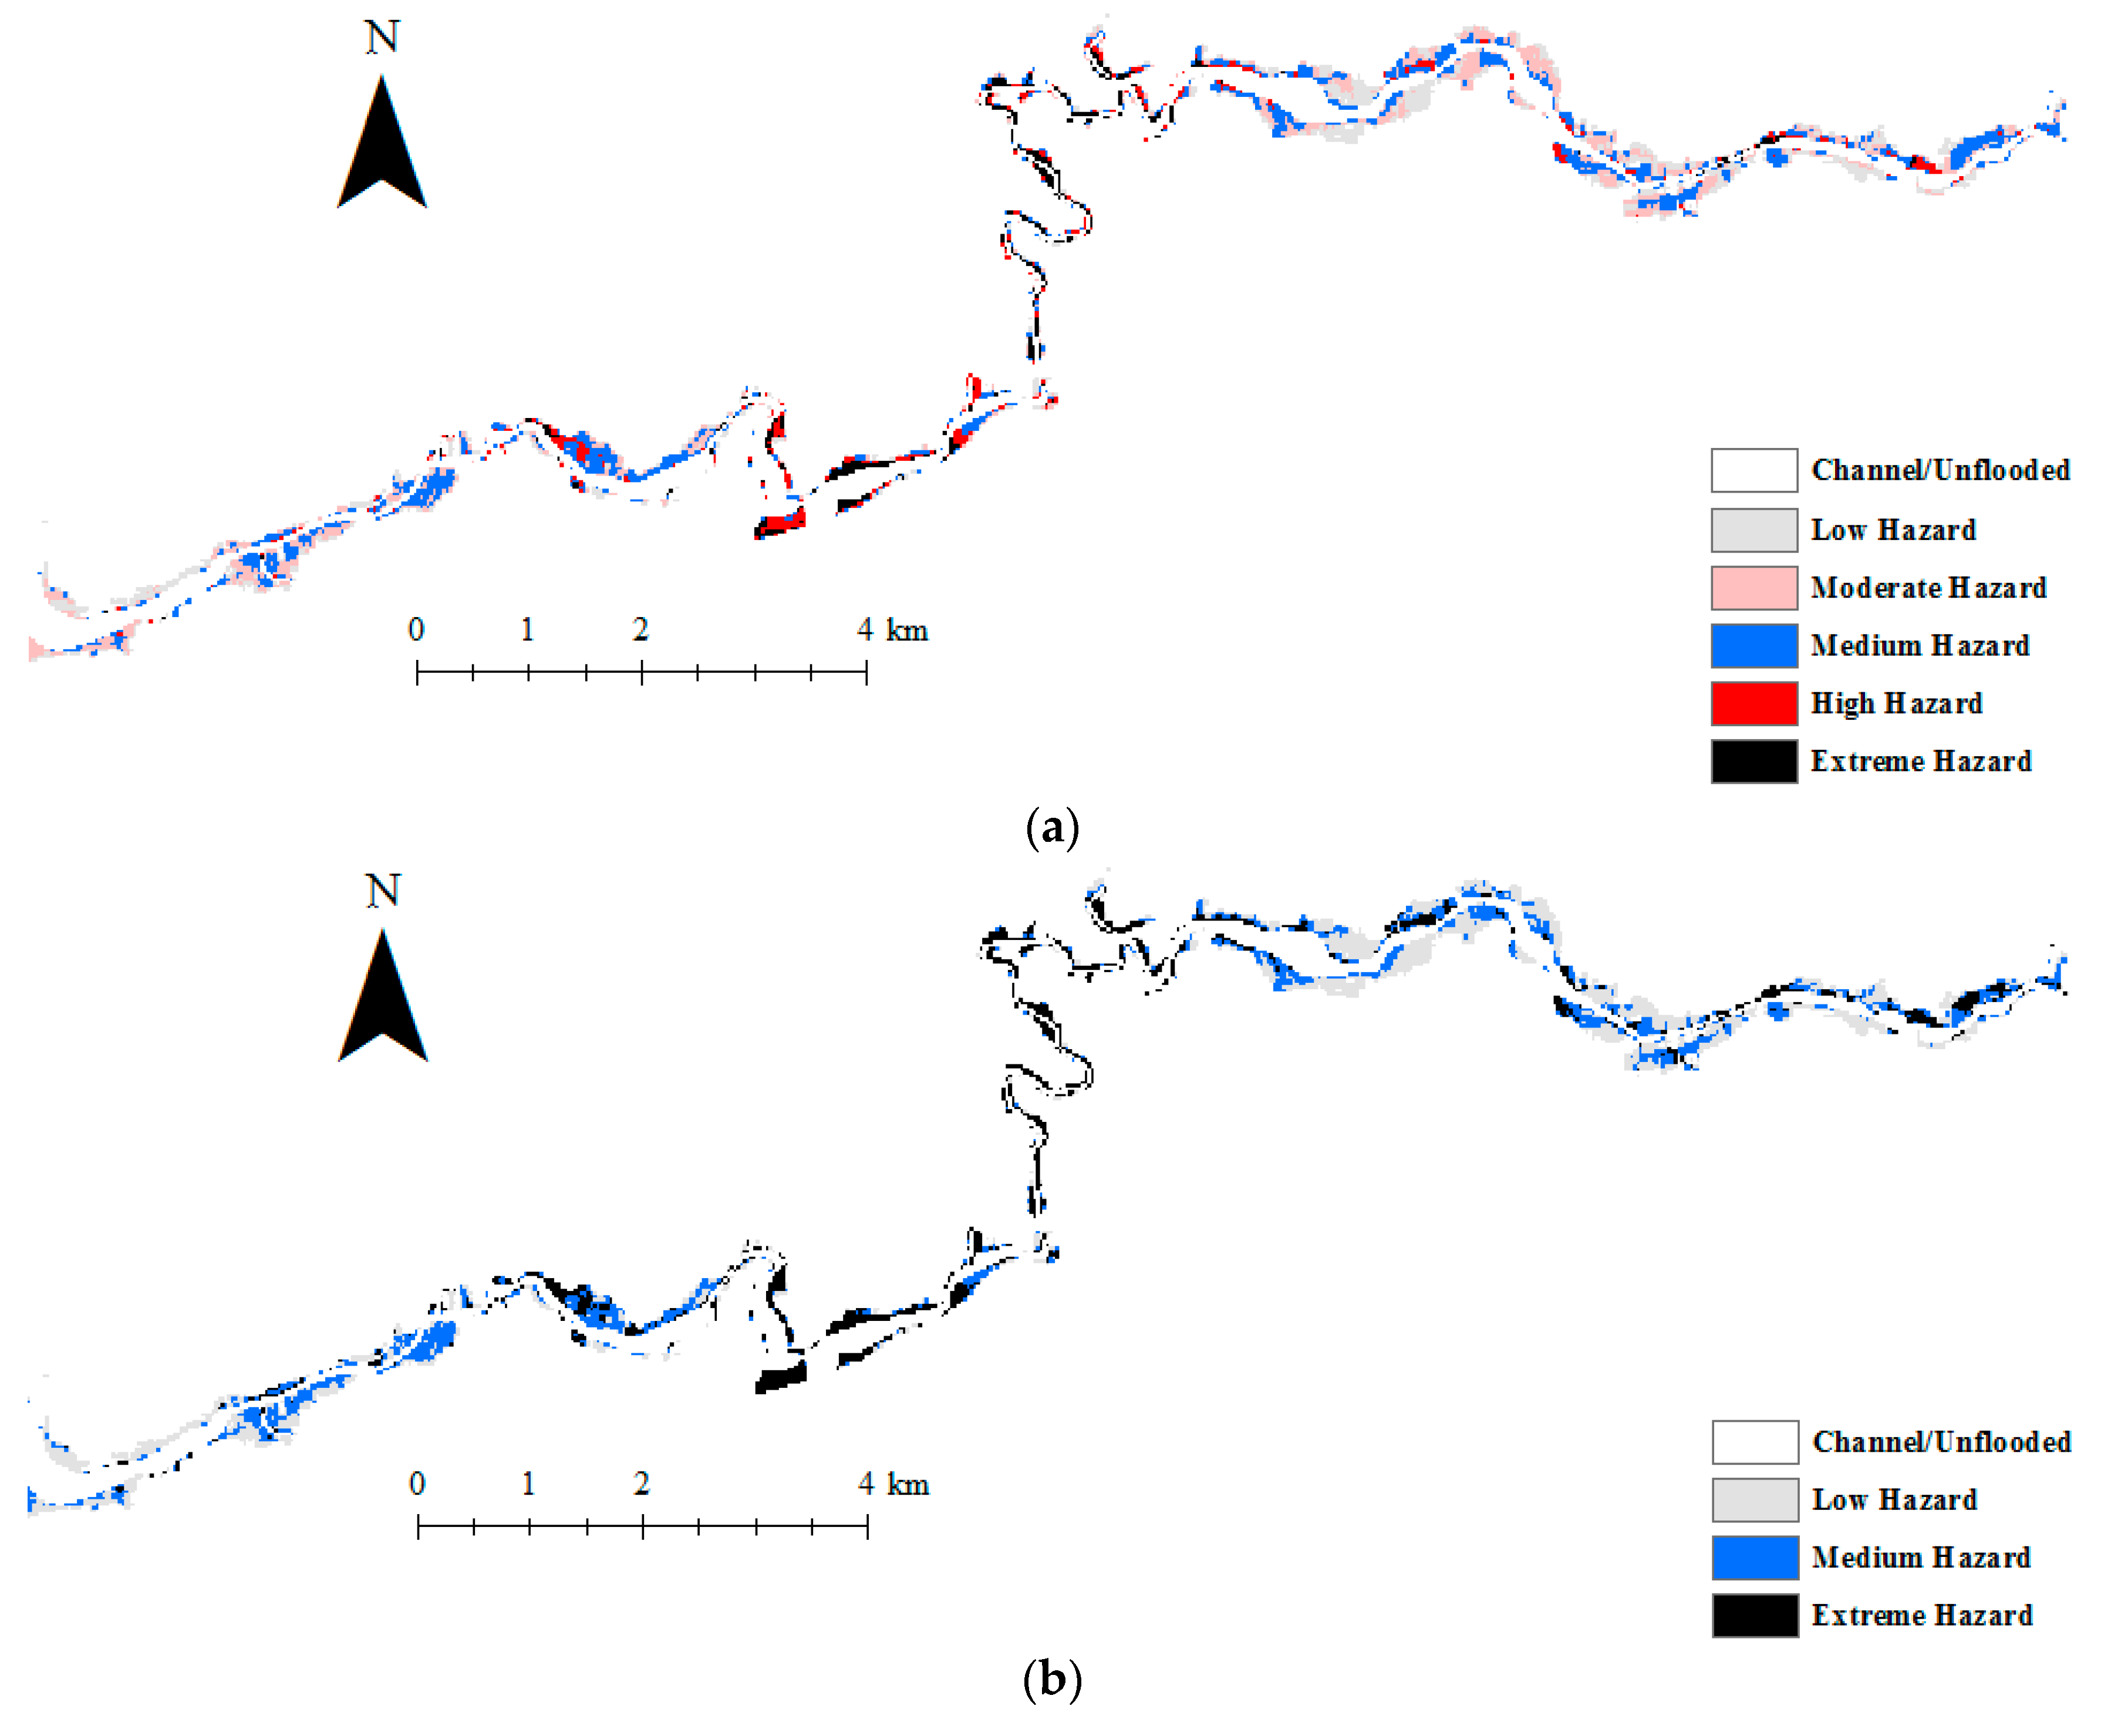

Figure 5.
Overall flood hazard map for the 100-year design event.

Figure 6.
Percentage area of different hazard classes for economic, social, environmental and overall flood hazard.
Figure 6.
Percentage area of different hazard classes for economic, social, environmental and overall flood hazard.

Figure 7.
Percentage area of overall flood hazard in different sensitivity analysis scenarios.


Table 1.
Flood hazard components, indicators and corresponding scores.
| Flood Hazard Component | Indicator | Flood Parameter | Class | Score |
|---|---|---|---|---|
| <0.5 m | 0.1 | |||
| 0.5 m–1 m | 0.3 | |||
| Economic Hazard | Structural Damages | Depth | 1.0 m–2.0 m | 0.5 |
| 2.0 m–3.0 m | 0.7 | |||
| >3.0 m | 0.9 | |||
| Low-Danger | 0.1 | |||
| Social Hazard | People Lives | Depth and Velocity | Judgment Zone * | 0.5 |
| High-Danger | 0.9 | |||
| Environmental Hazard | <1 m2/s | 0.1 | ||
| 1 m2/s–2 m2/s | 0.3 | |||
| Potential Erosion | Impulse | 2 m2/s–3 m2/s | 0.5 | |
| 3 m2/s–7 m2/s | 0.7 | |||
| >7 m2/s | 0.9 | |||
| <1 day | 0.1 | |||
| 1 day–2 days | 0.3 | |||
| Pollution | Duration | 2 days–3 days | 0.5 | |
| 3 days–5 days | 0.7 | |||
| >5 days | 0.9 |
* See ACER [44] for the full description.
Table 2.
Qualitative classification of the aggregated hazard score.
| Overall Hazard | 0.0–0.2 | 0.2–0.4 | 0.4–0.6 | 0.6–0.8 | 0.8–1.0 |
|---|---|---|---|---|---|
| Hazard Level | Low Hazard | Moderate Hazard | Medium Hazard | High Hazard | Extreme Hazard |
Table 3.
Weights of hazard components in different sensitivity analysis scenarios.
| Component | Economic Hazard | Social Hazard | Environmental Hazard | |
|---|---|---|---|---|
| Scenario | ||||
| Initial | 0.333 | 0.360 | 0.304 | |
| SA1 | 0.367 | 0.345 | 0.288 | |
| SA2 | 0.300 | 0.378 | 0.322 | |
| SA3 | 0.317 | 0.396 | 0.287 | |
| SA4 | 0.353 | 0.324 | 0.323 | |
| SA5 | 0.319 | 0.346 | 0.334 | |
| SA6 | 0.350 | 0.377 | 0.273 | |
© 2017 by the authors. Licensee MDPI, Basel, Switzerland. This article is an open access article distributed under the terms and conditions of the Creative Commons Attribution (CC BY) license (http://creativecommons.org/licenses/by/4.0/).
Share and Cite
MDPI and ACS Style
Ahmadisharaf, E.; Kalyanapu, A.J.; Chung, E.-S. Sustainability-Based Flood Hazard Mapping of the Swannanoa River Watershed. Sustainability 2017, 9, 1735. https://doi.org/10.3390/su9101735
AMA Style
Ahmadisharaf E, Kalyanapu AJ, Chung E-S. Sustainability-Based Flood Hazard Mapping of the Swannanoa River Watershed. Sustainability. 2017; 9(10):1735. https://doi.org/10.3390/su9101735
Chicago/Turabian StyleAhmadisharaf, Ebrahim, Alfred J. Kalyanapu, and Eun-Sung Chung. 2017. "Sustainability-Based Flood Hazard Mapping of the Swannanoa River Watershed" Sustainability 9, no. 10: 1735. https://doi.org/10.3390/su9101735
Note that from the first issue of 2016, this journal uses article numbers instead of page numbers. See further details here.