Does Operation Scheduling Make a Difference: Tapping the Potential of Optimized Design for Skipping-Stop Strategy in Reducing Bus Emissions


1
MOE Key Laboratory for Urban Transportation Complex Systems Theory and Technology, School of Traffic and Transportation, Beijing Jiaotong University, Beijing 100044, China
2
College of Science, Engineering and Technology, Texas Southern University, Houston, TX 77004, USA
3
Nanjing Institute of City & Transport Panning Co., Ltd, Nanjing 210008, China
*
Author to whom correspondence should be addressed.
Sustainability 2017, 9(10), 1737; https://doi.org/10.3390/su9101737
Submission received: 4 August 2017
/
Revised: 22 September 2017
/
Accepted: 22 September 2017
/
Published: 26 September 2017
Abstract
:The idea of corporate social responsibility has promoted bus operation agencies to rethink how to provide not only efficient but also environmentally friendly services for residents. A study on the potential of using an optimized design of skip-stop services, one of the essential operational strategies in practice, to reduce emissions is conducted in this paper. The underlying scheduling problem is formulated as a nonlinear programming problem with the primary objective of optimizing the total costs for both passengers and operating agencies, as well as with the secondary objective of minimizing bus emissions. A solution method is developed to solve the problem. A real-world case of Route 16 in Beijing is studied, in which the optimal scheduling strategy that maximizes the cost savings and environmental benefits is determined. The costs and emissions of the proposed scheduling strategy are compared with the optimal scheduling with skip-stop services without considering bus emissions. The results show that the proposed scheduling strategy outperforms the other operating strategy with respect to operational costs and bus emissions. A sensitivity study is then conducted to investigate the impact of the fleet size in operations and passenger demand on the effectiveness of the proposed stop-skipping strategy considering bus emissions.
1. Introduction
In a modern society, bus operation agencies have been paying more attention to corporate social responsibility in their development. The idea is to provide not only efficient but also environmentally friendly services for residents. Furthermore, the bus transit system is now recognized as one of the largest contributors in reducing emissions from the transportation sector. The government decision-makers in major cities of China have a higher expectation on emission reductions from the bus transit system. Bus companies in China are attempting to implement various measures from the public transit sector to help return residents with more days of clean air, while urban air pollution has increasingly deteriorated due to rapid urbanization and mobilization. Alternative fuel, electric buses, dead mileage reduction, and maintenance enhancement are used to reduce emissions from the bus system. However, the planning and operation of a bus transit system involves more than fuels, vehicles, and maintenance. Can we find potentially more effective ways to reduce emissions substantially via adjusting bus operation scheduling? Are there approaches to decrease bus emissions by configuring bus routes and networks? With these questions in mind, this paper strives to conduct a study on the potential of using an optimized design of skip-stop services, one of the essential operational strategies in practice, to reduce emissions. The objective of this study is to provide optimal frequencies that maximize both the cost savings and environmental benefits for operating agencies based on the estimated passenger Origin and Destination (OD) demand matrixes.
In this paper, a new model for optimal scheduling with skip-stop services is developed to minimize the total costs of passengers and operating agencies, as well as bus emissions. The focus of the model is to determine optimal bus frequency during rush hours. Skip-stop services are predetermined based on smart card data and the choice behavior of passengers for skip-stop services is analyzed. The constraints of load factor and fleet size in operation are considered in the model. A framework of the modified hierarchical method employed with an exhaustive search algorithm is developed and applied to search for the optimal solution. Subsequently, the proposed model is applied in a case study of Beijing and the optimal scheduling strategy is determined by maximizing the benefits of passengers, the operating agency, and the environment. To demonstrate the effectiveness of the developed model and the solution algorithm, the costs and emissions under the optimal scheduling strategy with stop-skipping services considering bus emissions is compared to that without considering bus emissions. The sensitivity of the fleet size in operation and passenger demand is analyzed. Finally, the paper presents concluding remarks of the study.
The main contribution of this paper is the development of an approach to provide the optimal operation strategy of stop-skipping services considering the tradeoff among the benefits of passengers, transit agencies, and the environment, while environmental impacts are usually ignored in most of the optimization design of skip-stop operations. Moreover, a VSP (Vehicle Specific Power)-based approach is used in this paper for emission estimation, in which the emission factors are calculated using real world data collected by the Portable Emission Measurement System (PEMS). This method can be readily applied to the minimization of emissions for a generalized transit route when the second-by-second activity data is available.
2. Literature Review
Transit service quality could be improved with skip-stop services due to shortened travel time [1,2]. Among different bus control strategies, stop-skipping is one of the most widely used strategies that can be implemented to decrease the irregularity of the bus service.
In order to enhance the effectiveness of stop-skipping strategies, a considerable amount of studies have been devoted to the optimization model of skip-stop operations in the past three decades. Khoat and Bernard [3], Milla et al. [4], Niu [5], and Chiraphadhanakul et al. [6] developed the optimization model based on the main objective of maximizing passenger welfare. Studies in later years focused on the trade-off between the costs for passengers and transit agencies. For example, Wei et al. [7] proposed a scheduling model to adjust the bus frequency by minimizing passengers’ waiting time and maximizing the corporate profit. Leiva et al. [8], Chen et al. [9], and Zhang et al. [10] presented an optimization approach in designing skip-stop services that minimized the wait time, in-vehicle travel time, and operator cost given an origin–destination trip matrix. Qu et al. [11] proposed a mathematical model to optimize service, consisting of all-stop and stop-skipping services, by minimizing the total cost of wait, transfer, and in-vehicle travel. Ulusoy et al. [12], Ulusoy and Chien [13], and Chien et al. [14] developed the cost-efficient operation model, which optimizes all-stop, short-turn, and express transit service and their frequencies.
There have been a considerable amount of studies on the optimization of skip-stop operations. However, little prior work has considered environmental impacts in the scheduling optimization for bus skip-stop services. Only a few studies have been conducted for the general or specific scheduling problem of bus operations, in which the environmental impacts are considered. Qu et al. [15] developed an approach to evaluate bus emissions with an integrated bus service (i.e., all-stop and stop-skipping). An appropriate operation strategy by adjusting frequencies and vehicle size was offered. Dessouky et al. [16] presented a methodology for the joint optimization of the cost, service, and environment performance in demand-responsive (paratransit or dial-a-ride) transit scheduling. Li and Head [17] studied a bus scheduling problem to minimize operating costs and vehicle emissions under the constraints of a limited budget to purchase new buses and a timetable of bus trips. Gouge et al. [18] used a nonlinear programming model to generate optimal bus assignments, which minimized the health and climate impacts of the emissions from public transportation bus fleets as well as operating costs. Sun [19] developed a framework that optimized bus assignments to routes with the objective of minimizing both operating costs and the environmental impacts of emissions.
The review of the literature reveals that skip-stop scheduling is an important issue, which has been studied extensively using different assumptions and methodologies. The headway or frequency was generally taken as the decision variable. In most cases, the origin–destination distribution along a route was pre-defined in the optimization process. It should be noted that there has been an increasing interest in the consideration of environmental impacts in bus scheduling models in recent years. However, most of the studies about optimal scheduling with skip-stop services only focused on minimizing passenger costs and operational costs. The work described in this paper expands upon the previous research on skip-stop scheduling by incorporating a detailed analysis of passengers’ choice behavior and the objective of minimizing the total costs for both passengers and operators, as well as reducing bus emissions, which provides new insights for designing a sustainable skip-stop control strategy.
3. Methodology
A high-quality bus operations control strategy should provide sufficient transport supply to meet the OD demand. OD demands are essential inputs for a transit scheduling model. This section presents an OD demand estimation with the provided skip-stop service. Further, the scheduling model optimizing the conflicting objectives of users, operators, and environmental agencies is formulated in this section.
3.1. OD Demand Estimation
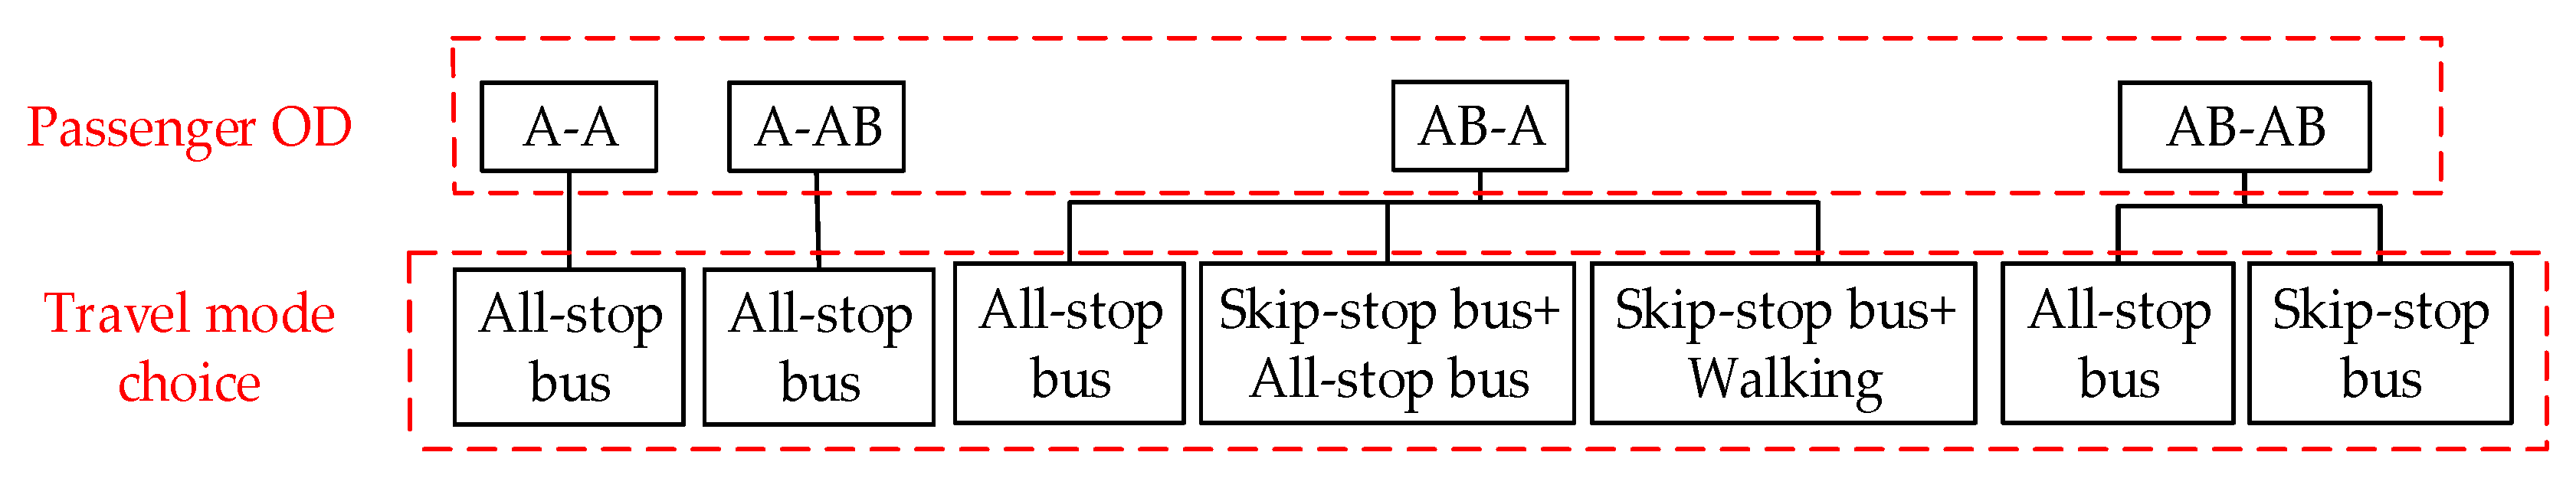
For the stop-skipping control strategy, two types of bus stops are defined in this study. Type A stops only provide all-stop services and AB stops are available for both all-stop services and skip-stop services on the bus route. The passenger demand without skip-stop operations, which can be obtained by smart card data, is used to decide which stops can be skipped in stop-skipping services and estimate the OD demand with skip-stop operations. The choice behavior of passengers along the route with skip-stop services is presented in Figure 1.
As shown in Figure 1, passengers that choose stop-skipping services are from AB-AB and AB-A passenger flows. Accordingly, the travel choice probability of the AB-AB and AB-A passenger flows can be determined to estimate the OD matrix for skip-stop services and all-stop services. The logit model has been found to fit the analysis of the travel choice probability quite well because it has high accuracy and applicability [20,21,22]. The binary logit model is often used to analyze travel choice behavior between two travel options, while the multinomial logit model is applicable to multiple travel options. Therefore, the two models are applied to define the travel choice probability of AB-AB and AB-A passenger flows.
In the binary logit model, the travel choice probability of the AB-AB passenger flow can be expressed as Equations (1)–(4).
where, , , , and represent the possibility, the fixed term of utility function, the waiting time (min), and the in-vehicle time (min) of passengers for all-stop services, respectively; , , , and are the possibility, the fixed term of utility function, the waiting time (min), and the in-vehicle time (min) of passengers for skip-stop services, respectively; and and are parameters for the waiting time and in-vehicle time.
In the multinomial logit model, the travel choice probability of the AB-A passenger flow can be formulated by Equations (5)–(10).
where, , , , , and are the possibility, the fixed term of utility function, the waiting time (min), the in-vehicle time (min), and the travel cost of passengers that choose all-stop services (Yuan), respectively; , , , , and represent the possibility, the fixed term of utility function, the waiting time (min), the in-vehicle time (min), and the travel cost of passengers that choose skip-stop services combined with walking (Yuan), respectively; , , , , and are the possibility, the fixed term of utility function, the waiting time (min), the in-vehicle time (min), and the travel cost of passengers that choose skip-stop services with a transfer to all-stop services (Yuan), respectively; and , , and are parameters for the waiting time, in-vehicle time, and the travel cost.
These two models can be calibrated using the SPSS software based on stated preference survey results [23], which are shown in Equations (11) and (12).
Thus, the number of passengers that use the skip-stop services in the AB-AB passenger flow and the AB-A passenger flow (persons), represented by and , respectively, can be derived as the following Equations (13) and (14).
where and describe the probabilities that the stop-skipping bus or the all-stop bus arrives at stop first, respectively; and are 0–1 decision variables, in which or if stop or is the A stop for all-stop services, whereas or if stop or is the AB stop which can provide skip-stop services; and is the number of passengers boarding at the stop and alighting at stop in the study period (persons).
3.2. Optimal Scheduling Model with Skip-Stop Services Considering Bus Emissions
The optimization of skip-stop scheduling has long been considered as a trade-off between users and operators. In this research, an additional goal of reducing emissions is considered for the optimal scheduling model with skip-stop services. Since the major function for transit agencies is to provide the conveyance of passengers, the minimization of passengers’ costs and operational costs is regarded as the primary objective, while the minimization of bus emissions is the secondary objective.
If the two objectives are not separated in this research, weight coefficients of the two objectives should be used. Considering that the weight coefficients of the two objectives are difficult to identify, and the results are easily influenced by weight coefficients that are maybe determined subjectively, the primary and secondary objectives of the model are formulated separately and assigned different priorities. The Pareto solution that achieves the tradeoff between cost reduction and emissions control can be effectively obtained using the proposed solution method in two steps, which may to a certain extent avoid the subjectivity. Moreover, the optimal stop-skipping strategy that minimizes total cost for passengers and transit agencies is directly determined in the first step of solving the proposed model, and no extra calculations are required.
As regards to the cost function, the waiting time costs are the product of hourly demand, unit time value, and average wait time that is calculated as half of the headway in some studies. The waiting time of passengers boarding the next stopping vehicle under oversaturated passenger demand is considered in this paper. In previous studies, in-vehicle time usually includes the running time between stops and the stop delays (such as dwelling time and acceleration or deceleration delays), in which the door closing time is ignored in some previous studies. Moreover, the transfer costs of passengers when they wait for the bus at the transferring AB stop are calculated into the waiting time costs.
3.2.1. Notation and Assumptions
The optimization model in this paper is formulated to optimize the total costs and emissions of all-stop services and skip-stop services. For simplification, it is assumed that (1) all-stop services and skip-stop services use the same vehicle type; (2) the all-stop bus and the skip-stop bus are dispatched alternately with a uniform headway; and (3) passengers arrive at the stop randomly with a uniform distribution within a given time period.
The notations for parameters and variables used in the proposed model are summarized in Table 1.
3.2.2. Optimization Model
As before mentioned, two objectives are addressed in this paper, including (a) the primary objective to minimize the weighted sum of passengers’ costs and operational costs ; (b) the secondary objective to minimize the amount of bus emissions . The two objective functions can be derived as shown in Equations (15) and (16). Considering realistic limitations in bus operations, the constraints on load factor for the all-stop and stop-skipping services, capacity, and fleet size are considered and formulated in Equations (17)–(19).
In the Equation (15), the costs for all passengers are defined as those from passengers’ waiting and in-vehicle time for all-stop services and skip-services. Walking time is not included here, because it is mainly a function of the stop location and cannot be impacted by the operational scheduling [9]. In addition, passengers transferring from a skip-stop service to an all-stop service need to wait for the bus to transfer at the same AB stop without extra transfer walking time. The transfer time is calculated into the waiting time. Consequently, the costs of the primary objective function are divided into waiting-time costs, in-vehicle time costs, and operational costs. A detailed description of each term in the final expression of the primary objective function is as follows.
The first term computes the costs from passengers’ waiting time for all-stop services and stop-skipping services. Waiting time costs can be calculated using the unit time value for waiting time at a bus stop. It is assumed that passengers arrive at the bus stop randomly with a uniform distribution. The average waiting time within a given time period is equal to half of the headway when passengers’ demand is unsaturated, and one more headway is added under oversaturated passenger demand. The waiting time costs will rise as the passenger demand increases, especially when the demand is oversaturated.
The second term calculates the costs of the in-vehicle time for all-stop services and skip-services. The in-vehicle time includes two components. The first component, the bus running time between adjacent stops, is the sum of (1) the running time at the segment and (2) the deceleration time arriving at the bus stop and the acceleration time departing from the bus stop. The second component, the bus dwelling time, can be obtained from the maximum value of passengers’ boarding time and alighting time plus the door closing time. It should be noted that the number of passengers boarding at a stop that offers skip-stop services is the sum of the number of passengers at the bus stop that use the skip-stop services in the four categories of passenger flows (i.e., A-A, A-AB, AB-A, and AB-AB passenger flow). The in-vehicle time costs are the product of the value and the unit time value of in-vehicle time.
For the third term, the operational costs for all-stop services and skip-services consist of the crew wage, vehicle depreciation expense based on the composite life method, and bus fuel cost. For working hours, it is assumed that crew members work 22 days per month and 8 hours a day according to the current practice of bus operations in Beijing. It can be seen from Equation (15) that the more work hours, the lower operating costs. The assumed vehicle service life is that the bus operates 15 hours per day and will be scrapped after 13 years’ use with an anticipated net residual value of 0 Yuan based on the standard for compulsory scrapping of motor vehicles in China [24]. The operation costs will reduce if the service life is extended.
In the secondary objective function as shown in Equation (16), the emissions of the main pollutants including nitrogen oxides (NOx), hydrocarbons (HC), carbonic oxide (CO), and particulate matter (PM) from all buses along a bus route during the studied period are calculated. A VSP-based approach is used in this paper for emission estimation. VSP is a proxy variable for engine load that has been shown to be highly correlated with emissions [25]. The VSP-based approach can provide accurate emission estimations by analyzing a vehicle’s second-by-second activity data during an entire bus trip. The effects of bus operation characteristics on the emission have been included in this paper. The procedure to estimate emission factors is summarized below.
- Step 1:
- VSP calculation. VSP is defined as the instantaneous tractive power per unit of vehicle mass, which can be calculated by using Equation (20).where is the vehicle speed (m/s); and is the vehicle acceleration (m/s2). The activity data are collected using Global Position Systems (GPS), which are reported on a second-by-second basis. In this analysis, the VSPs are binned in an increment of 1 kW/ton, as shown in Equation (21).where n is the VSP bin number.
- Step 2:
- Emission rates calculation. The emission rates are used to calculate the emission of each pollutant under different VSP Bins. The emission rate for each VSP Bin can be expressed as Equation (22).where denotes the amount of emissions for pollutant i in the VSP Bin of k (g/s). The real-world vehicle emissions of NOx, HC, CO, and PM from the tailpipe exhaust are collected using the PEMS. denotes the total time in the VSP Bin of k (s), which can be obtained from the second-by-second activity data.
- Step 3:
- Emission factors calculation. The emission factors for pollutant i, (g/km), are calculated with Equation (23).where is the frequency distribution in the VSP Bin of k (%); and is the average travel speed (m/s).
3.3. Solution Method
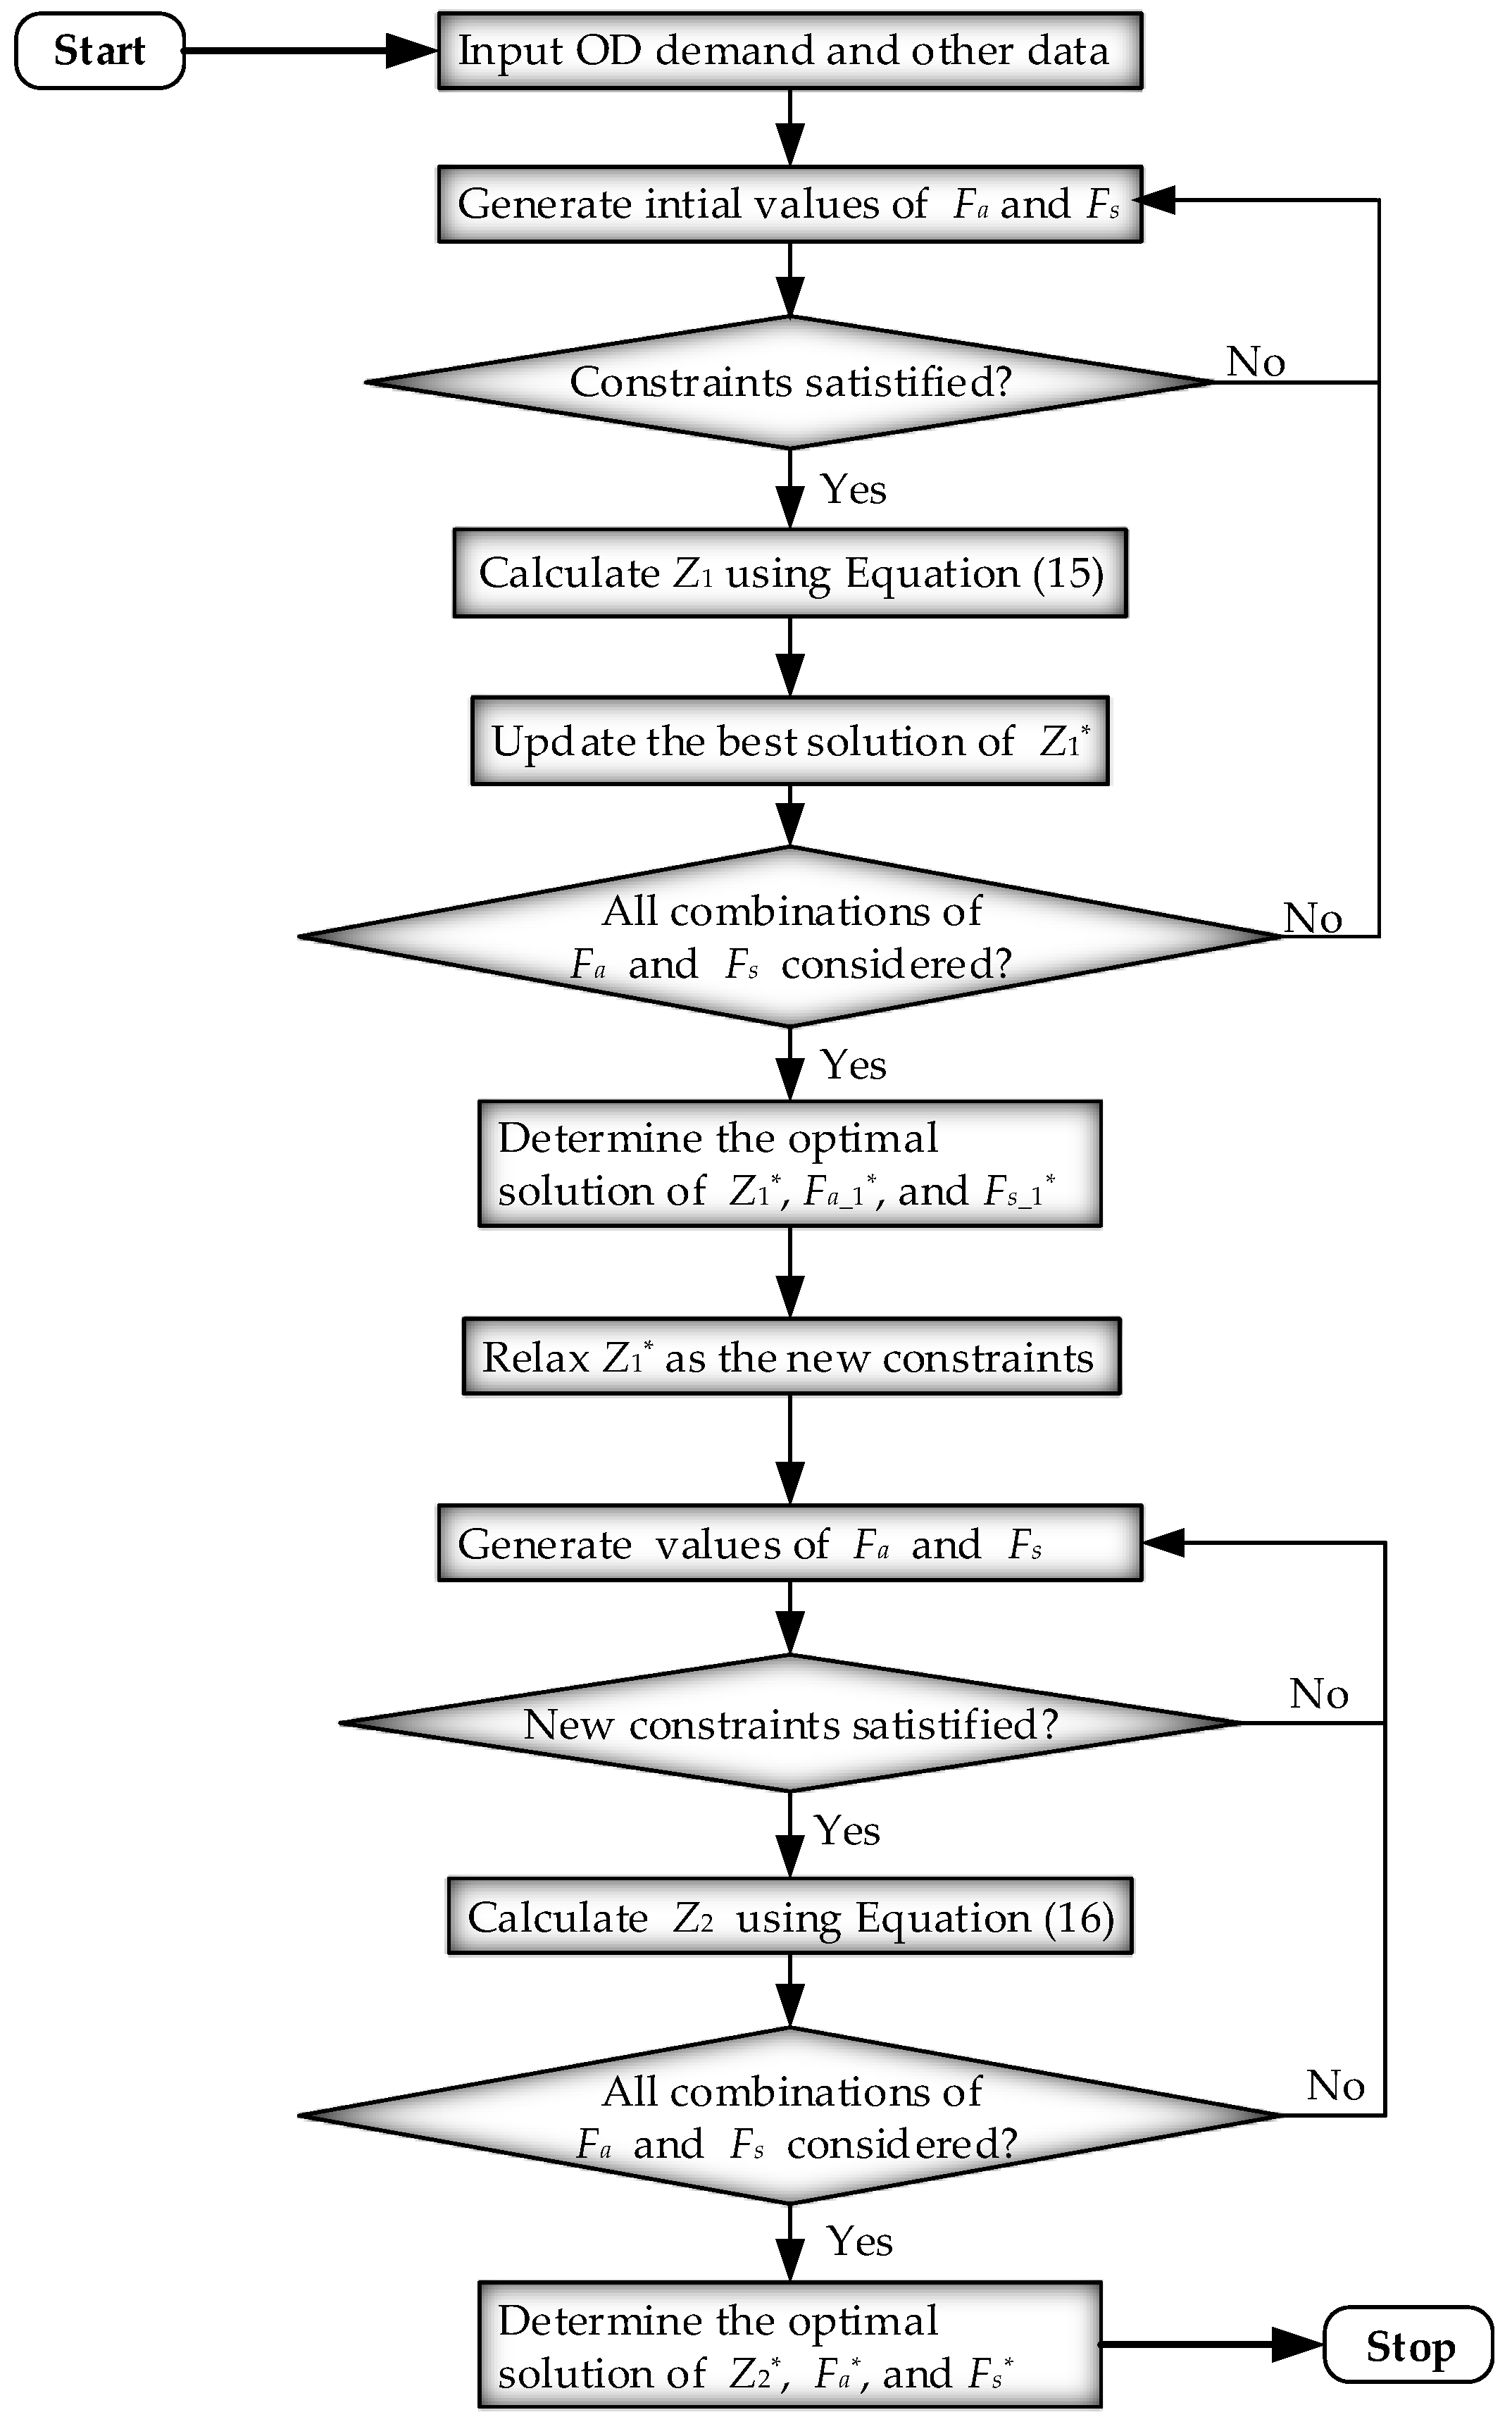
The proposed model is a nonlinear programming problem, in which the optimal frequencies of skip-stop services and all-stop services are determined for one bus route and the result is required to be an integer. The exhaustive search method is especially suitable for generating solutions in round numbers when optimizing nonlinear problems in the case when the problem scale is relatively small. Hence, an exhaustive search method is used to solve the problem optimally. However, it should be noted that there are two objectives with different priorities in the proposed model, and the dimension of both the primary and secondary objectives is difficult to unify. Moreover, the proposed model of this paper needs to be solved using an application-oriented method that is efficient in searching a compromised optimum. A modified hierarchical method meets the need to quickly convert the multi-objective optimization problem into multiple single-objective optimization problems. By introducing a tolerance coefficient for the secondary objective, a compromised optimum can be obtained in the range that is close to the optimal costs from the primary objective. This compromised optimum has relatively optimal costs with the minimum emissions. Thus, a solution framework is developed with the modified hierarchical method, in which the exhaustive search algorithm is employed to search for the optimal vehicle frequencies for both the all-stop bus and the skip-stop bus. The process of solving the problem can be divided into two steps.
- Step 1:
- Optimization of the primary objective. In Equation (24), all possible sets of vehicle frequencies of an all-stop bus and a skip-stop bus are examined under the constraints (i.e., load factor, capacity, and fleet size) using the exhaustive search method. The optimization process is programmed using the Visual Studio software. Then, the best frequencies ( and ) that minimize the primary objective and the corresponding minimum cost of passengers and operation agencies can be obtained.
- Step 2:
- Optimization of the secondary objective. As can be seen in Equation (25), the value of obtained from the first step is relaxed by the tolerance coefficient . The relaxed value is added into the constraints of the secondary objective function. Then, the exhaustive search method is repeatedly used to search all possible restricted sets of values ( and ) under the constraints listed in Equation (25). Therefore, the optimal vehicle frequencies of an all-stop bus and a skip-stop bus, in which the emissions are minimum, can be derived. In this step, the optimal solution of the secondary objective is a compromised optimum for the primary objective.
Figure 2 illustrates the solution algorithm to search for the Pareto solution that achieves the tradeoff between the primary objective and the secondary objective. The method is to obtain the set of optimal solutions for the most important objective, and then to obtain the set of optimal solutions for the second objective on the basis of the previous set. In this process, the optimal solution with the secondary objective is selected as the deterministic solution of the problem.
4. Case Study and Results
4.1. A Case Study of Route 16 in Beijing
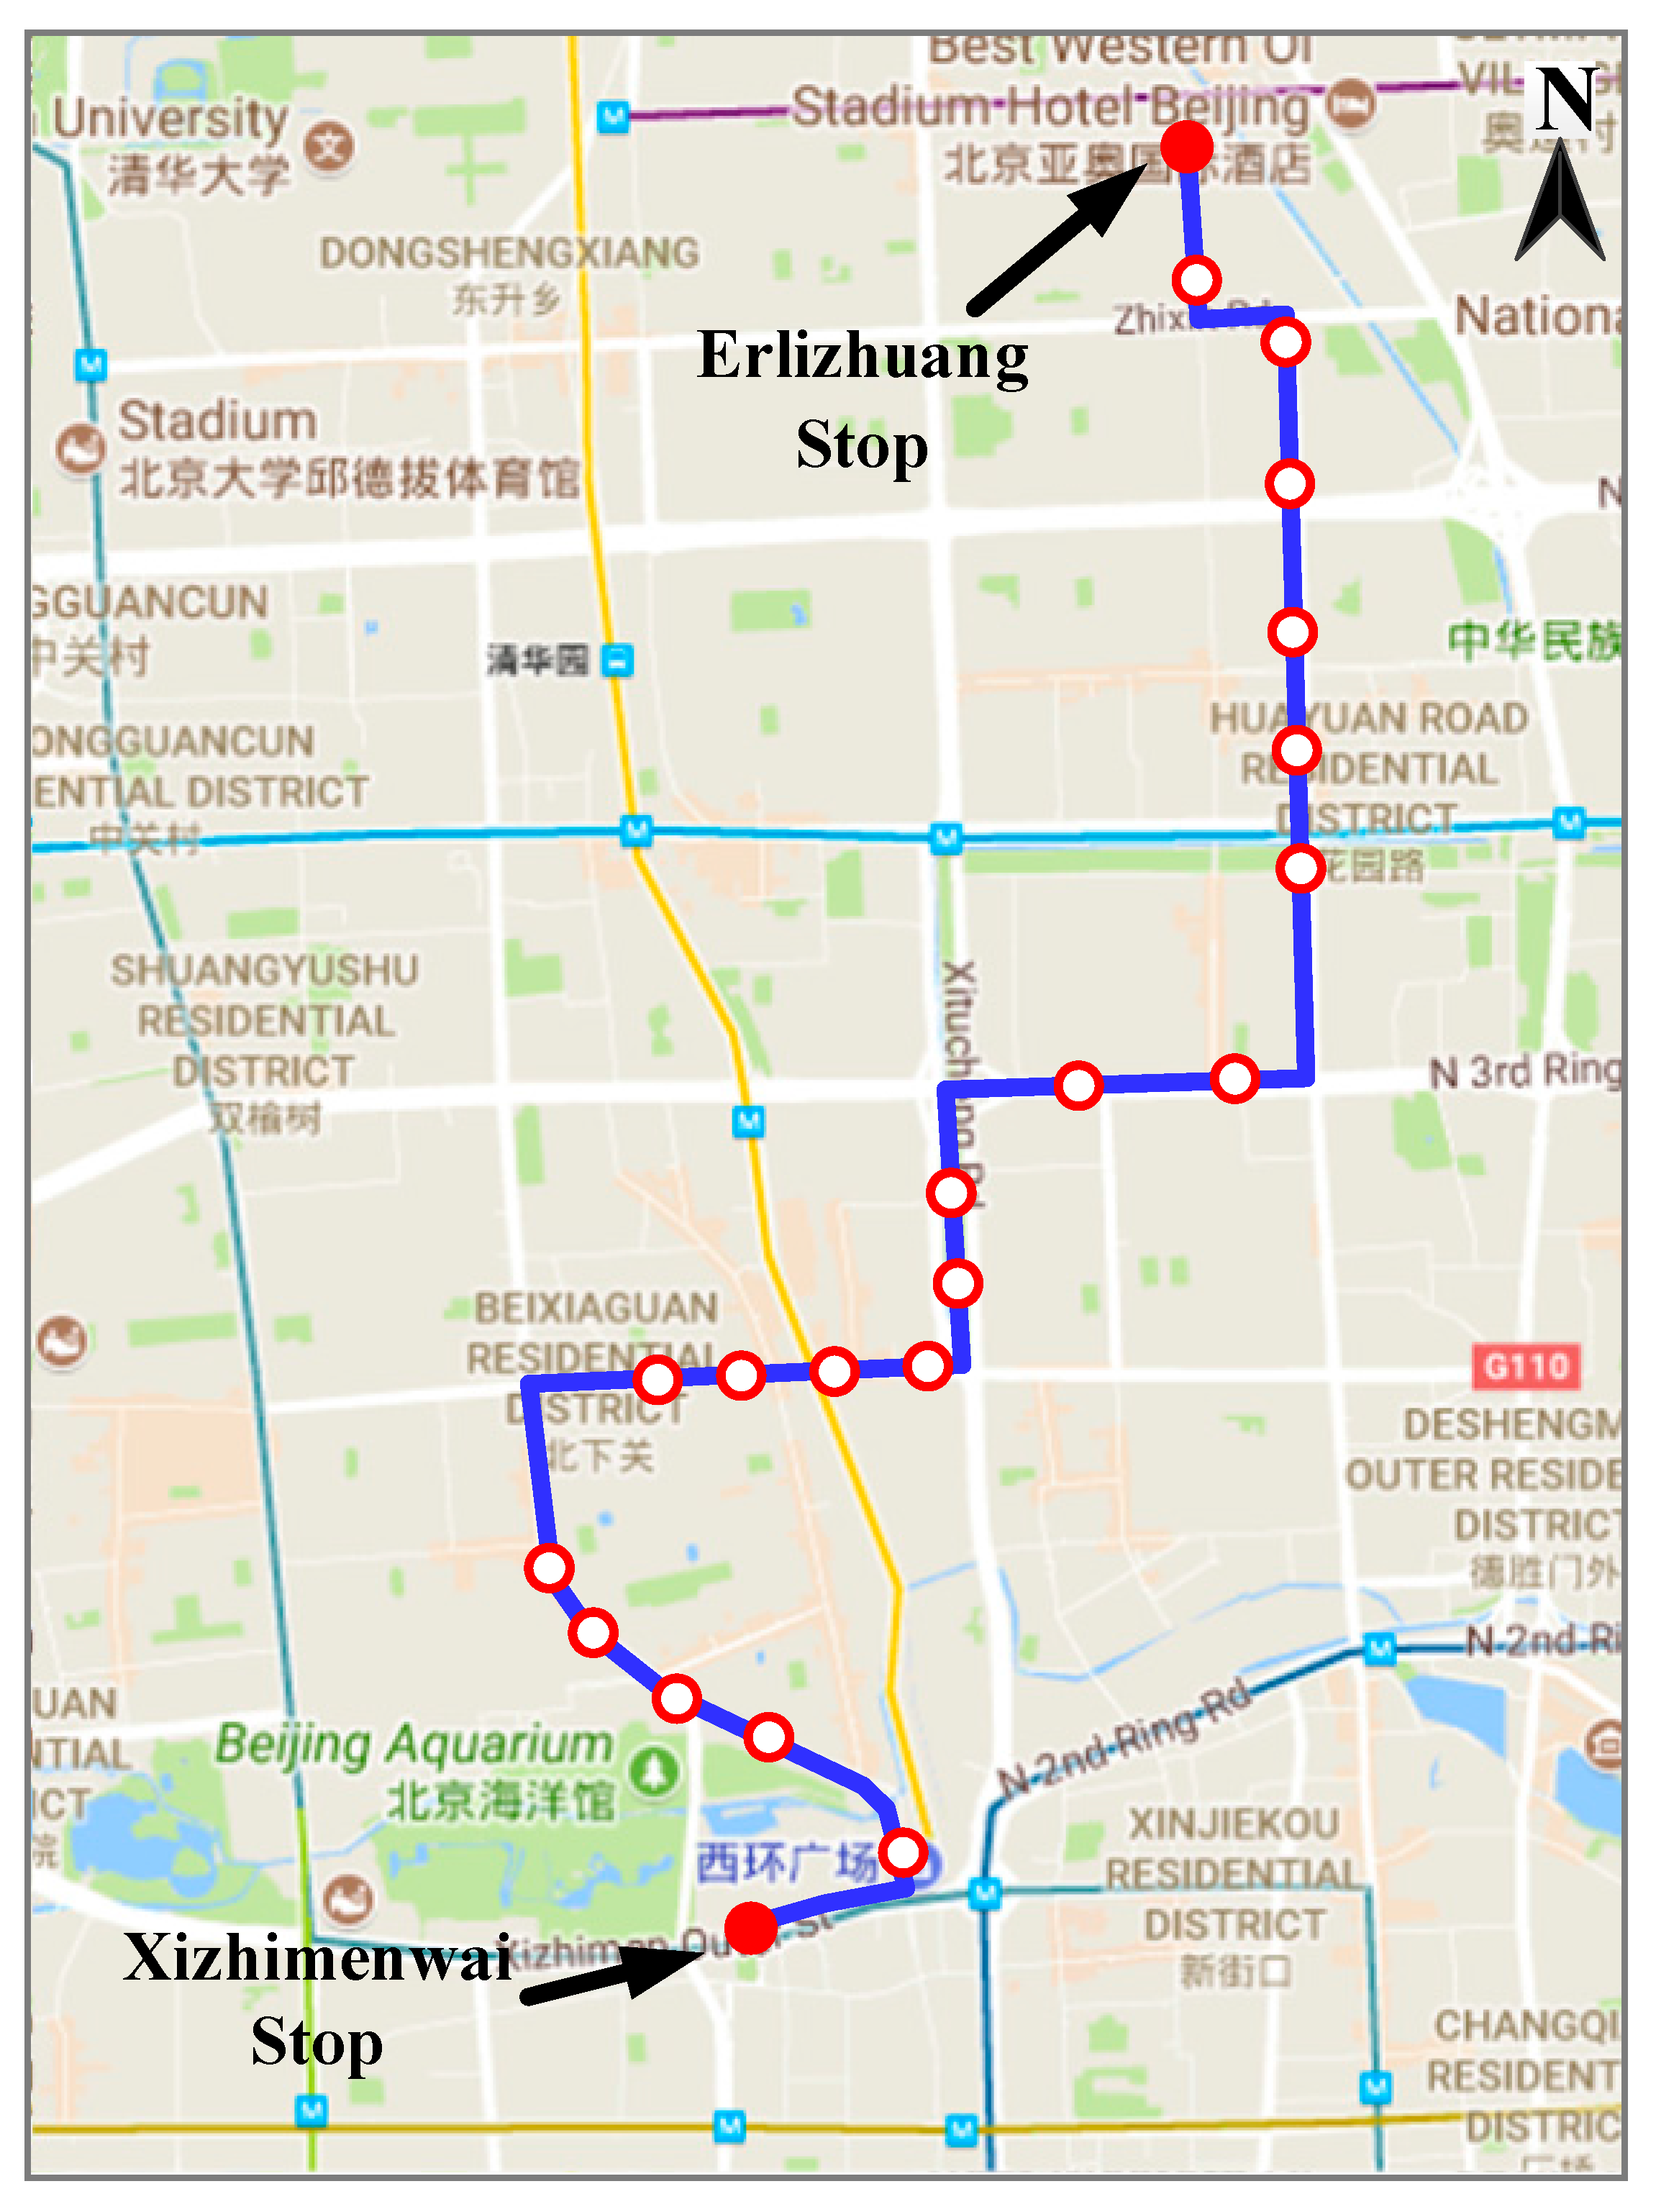
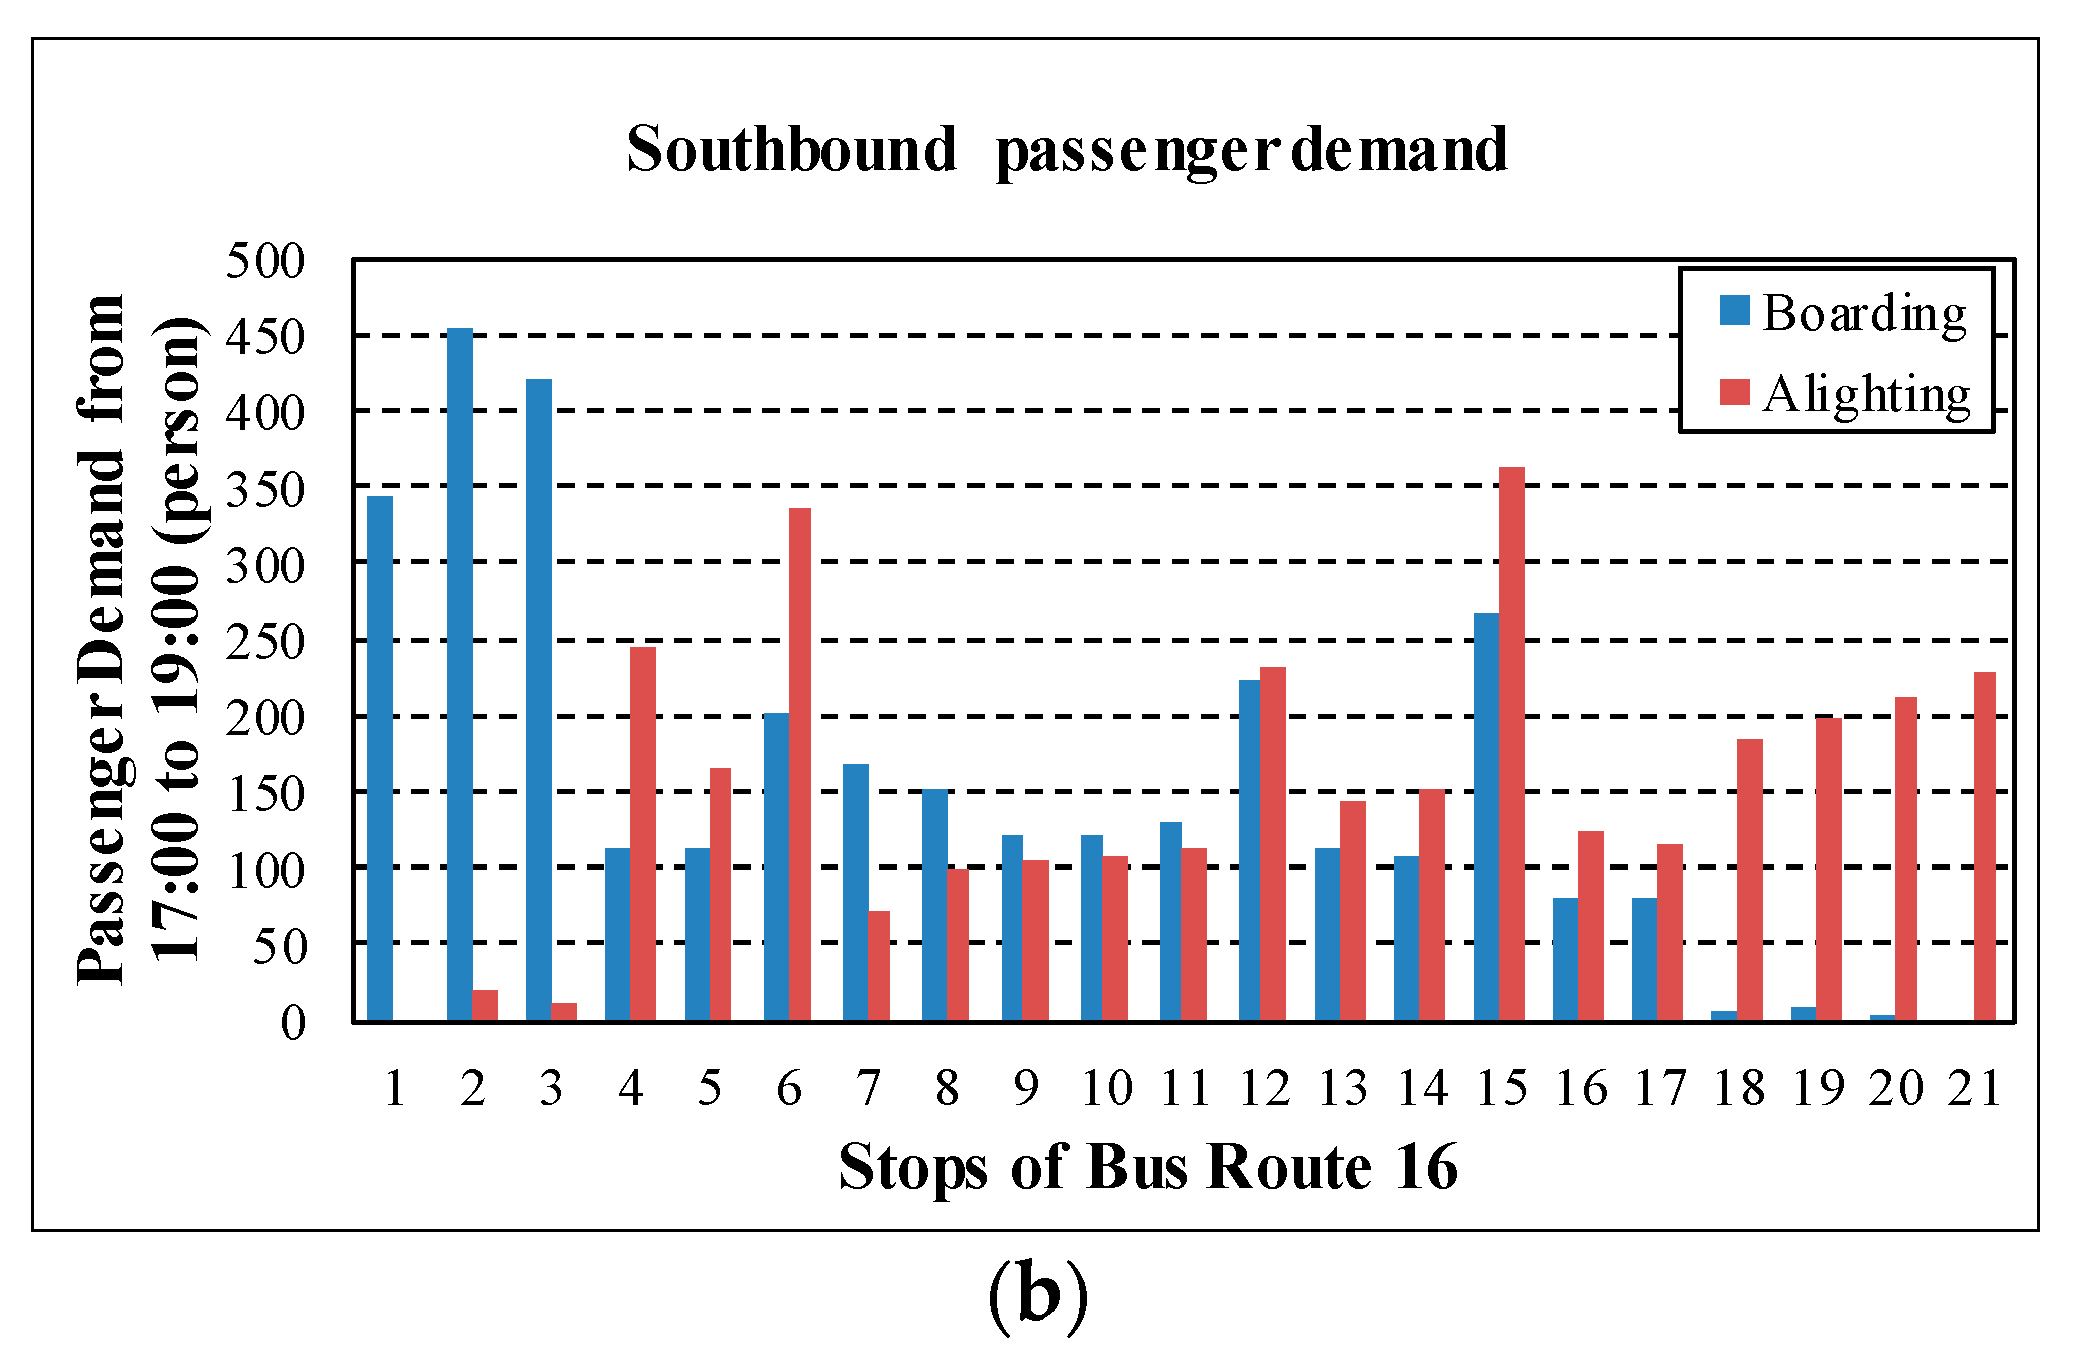
To determine the effectiveness of the developed model and the solution algorithm, the real-world Route 16 in Beijing has been selected for the case study, as shown in Figure 3. The route is 12.3 km long with a total of 21 stops and equipped with 34 compressed natural gas buses. The stops are numbered sequentially from south to north. The passenger OD is extracted from the smart card data of Route 16 during the evening peak period (from 17:00 to 19:00) in January 2015 and the passenger boardings and alightings at each stop are presented in Figure 4.
As shown in Figure 4, the bus passenger demand along Route 16 varies significantly. A regular service might reduce operation efficiency, since the stops with low demand can be skipped. The stop-skipping strategy should be provided for the bus operation. As a key determinant for which stops should be served by skip-stop buses, the ratio between the passenger demand and the average passenger demand at each stop is analyzed, and 1.2 is chosen as the threshold according to the practice of the bus operator in Beijing [9]. The ratio of stops 1, 2, 6, 12, and 15 is higher than a threshold of 1.2. These stops are suitable for skip-stop services. The bus stop location should also be considered. For example, stop 2 and stop 15 are close to two subway stations. Stop 6 is connected to a dense residential area. There are high demands for skip-stop services at these bus stops during peak hour. The terminal bus stop is not allowed to be skipped, so stop 21 needs to be served by skip-stop buses and all-stop buses.
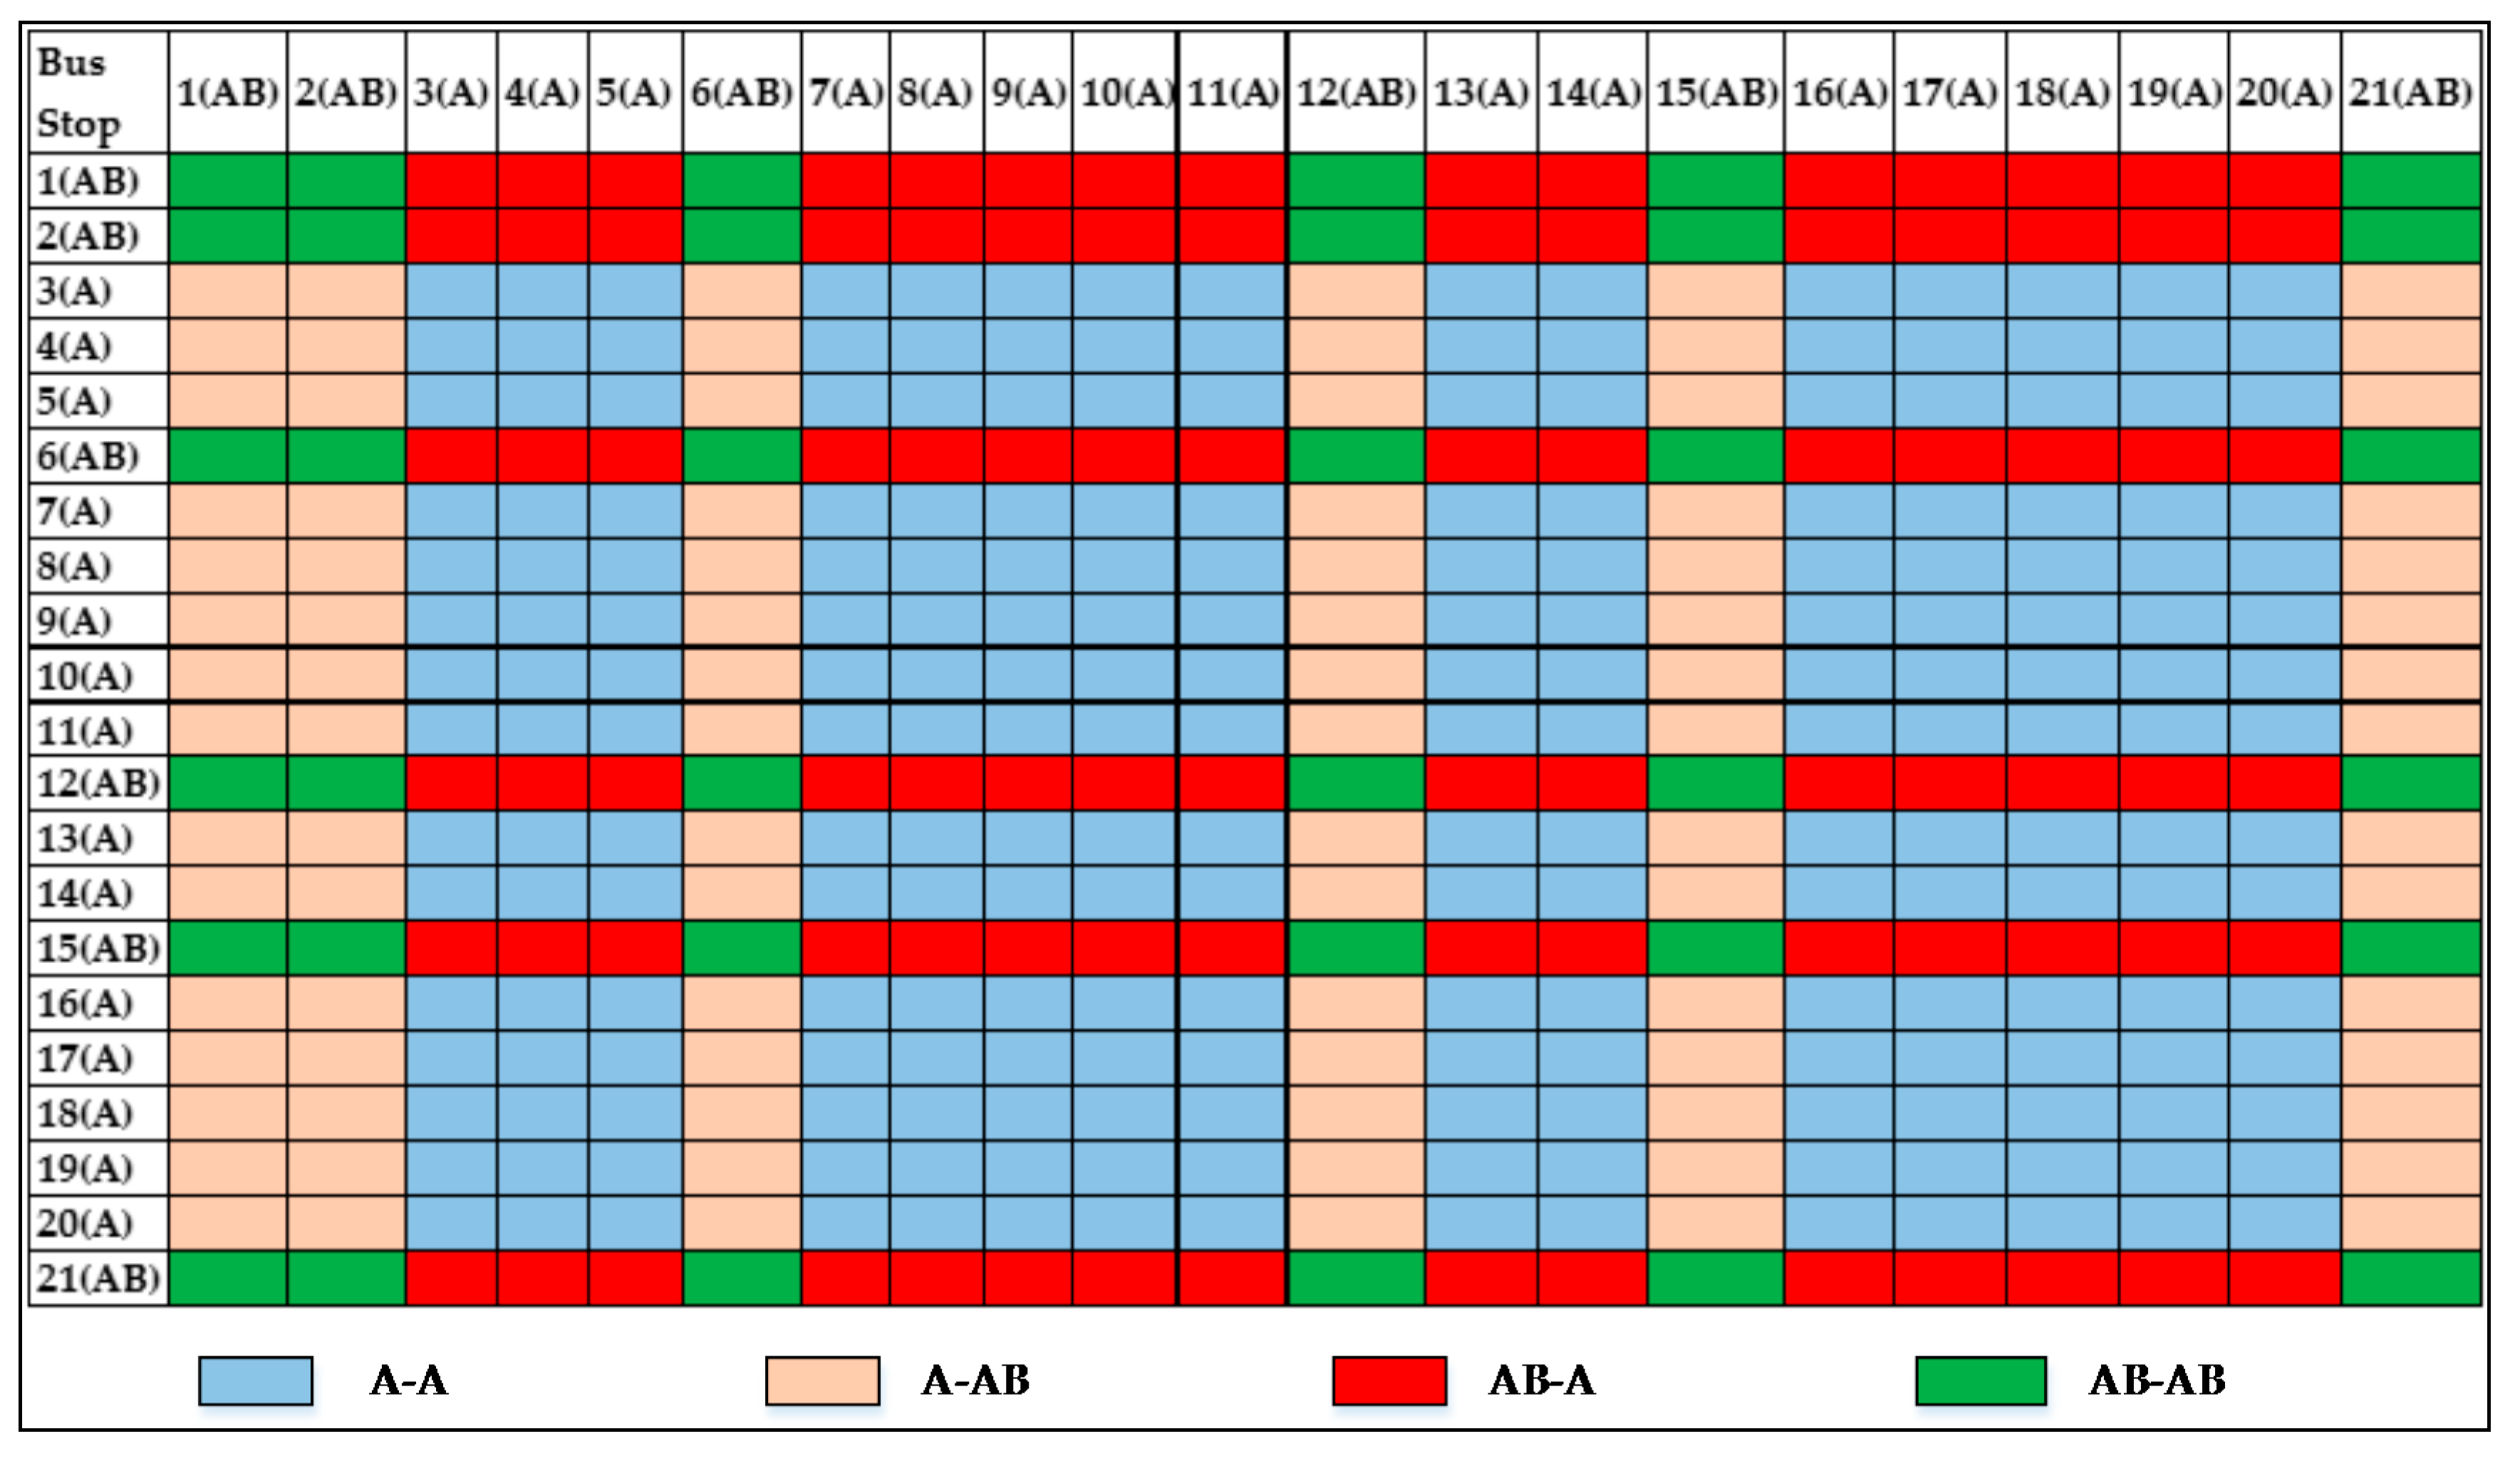
Consequently, the skip-stop bus should serve at stops 1, 2, 6, 12, 15, and 21. The OD is classified into four types as shown in Figure 5. Then, passengers’ OD estimations for the all-stop bus and the skip-stop bus are obtained using the method described in the previous section of OD demand estimation.
The load factors are analyzed based on the estimated passenger demand for both all-stop services and skip-stop services to evaluate whether the passenger demand is oversaturated when subjected to a limited number of vehicles. The results show that all load factors are less than the maximum load factor that can be accepted, which is the threshold of being unsaturated or oversaturated. Hence, the waiting time is half of the headway in this case study.
The real-world vehicle emissions of NOx, HC, CO, and PM from the tailpipe exhaust and the simultaneous activity data are collected using the PEMS and the Global Position Systems (GPS), which are reported on a second-by-second basis. Thus, emission factors of the all-stop bus and the skip-stop bus for pollutants NOx, HC, CO, and PM can be obtained based on VSP. The results are presented in Table 2. With reference to the relevant statistics and the experiences of the public transit operation agency in Beijing [9,26,27,28], the other input data of the model are collected as shown in Table 3.
4.2. Results and Analysis
The optimal frequency results and costs for scheduling with stop-skipping services considering bus emissions are obtained using the proposed model and solution method, as shown in Table 4. In Table 4, these results are compared with the optimal scheduling with stop-skipping services without considering bus emissions in order to evaluate the effect of controlling emissions. As can be seen, in contrast with the optimization results with stop-skipping services without considering bus emissions, the optimal results considering bus emissions have achieved savings of 6.2% and 6.0% of operational costs and bus emissions, respectively, at the expense of an increase (2.5%) in passenger costs and an increase (1.5%) in total costs.
The fleet size in operation, demand levels, and congestion conditions are three important parameters which have impacts on the performance of the scheduling strategy. To determine how the proposed scheduling would perform as a function of the fleet size in operation, the level of passenger demand, and congestion conditions, a sensitivity analysis with respect to these important parameters is performed and the results are analyzed.
(1) Sensitivity of fleet size in operations
For the proposed scheduling strategy considering bus emissions, the optimal frequencies, costs, and cost changes under different fleet sizes in operation are analyzed, as shown in Table 5. It can be observed that the passengers’ costs and total costs are gradually decreasing when more buses are allocated to the bus route. Emissions and operational costs are reduced overall with a decrease in the fleet size except for the fleet size of 33, while the existing fleet size represents a modest improvement (0.9% and 0.5%) in terms of emissions and operational costs, respectively, compared with the result when the value of the fleet size in operation is 33.
(2) Sensitivity of passenger demand
In this section, the variation of passenger demand is analyzed for five cases: (a) the passenger demand for both all-stop services and skip-stop services decreases by 20%, (b) the passenger demand for both all-stop services and skip-stop services increases by 20%, (c) the passenger demand for both all-stop services and skip-stop services increases by 40%, (d) the passenger demand for all-stop services increases by 40%, and (e) the passenger demand for skip-stop services increases by 40%.
Table 6 shows optimal frequencies, costs, and cost changes with respect to passenger demand. The base scenario is designed as the proposed scheduling strategy with the passenger demand. The results have demonstrated that passengers’ costs, operational costs, and total costs and emissions increase as total passenger demand for both all-stop services and skip-stop services grow. In the case that the passenger demand for all-stop services or skip-stop services is changed, it can be observed that, when the passenger demand for skip-stop services is increased by 40%, the increase of passengers’ costs is 26.7% compared with the base scenario, while passengers’ costs increase 16.7% for the case that the passenger demand for all-stop services increases by 40%. This indicates that the growth of the passenger demand for stop-skipping services caused a greater increase in passengers’ costs compared with the growth of the passenger demand for all-stop services. For the total costs, the similar result can be seen from Table 6. Moreover, operational costs and emissions are reduced when the passenger demand for skip-stop services is increased by 40%.
(3) Sensitivity of congestion condition
To determine how the proposed strategy performs when different congestion conditions appear during the peak period, a sensitivity of impacts from congestions analysis was performed. In the proposed model, there are average speeds of the all-stop bus and the skip-stop bus, and , which can be used to reflect the congestion level. Cases with four congestion levels, including 0.95× base speed, 0.9× base speed, 0.85× base speed, and 0.8× base speed, are analyzed compared with the case with base speed.
The results are presented in Table 7. As expected, passengers’ costs, operational costs, total costs, and emissions are increased as the congestion becomes worse. Comparing the optimal frequencies under different congestion levels, it can be seen that the optimal frequencies remain unchanged when the congestion level is a value between 0.85× base speed and 0.95× base speed, whereas skip-stop services become more essential due to a higher optimal frequency with a congestion level of 0.8× base speed.
5. Conclusions
Scheduling plays an important role in the management and operation of bus transit systems. The skip-stop operation represents an effective way of providing both good area coverage and satisfactory operating speed. In this paper, the potential of using the stop-skipping strategy to reduce emissions in with scheduling optimization is analyzed. An optimal scheduling model with skip-stop services is proposed to minimize passenger costs, operational costs, and bus emissions. A solution framework with the modified hierarchical method is developed to solve the model, in which the exhaustive search algorithm is employed. Particularly, a real-world case study of Route 16 in Beijing is presented, and the optimal scheduling strategy, which maximizes the cost savings and environmental benefits, is determined. The results show that, compared with the scheduling strategy with skip-stop services without considering bus emissions, the proposed scheduling strategy taking into account bus emissions has a significant advantage in the reduction of operational costs and bus emissions without much increase in passengers’ costs. Furthermore, a sensitivity study is conducted to investigate the impact of the fleet size in operation and the passenger demand on the effectiveness of the proposed stop-skipping strategy considering bus emissions. The sensitivity results indicate that: (1) when taking bus emissions into account, the total costs and passenger costs are reduced with an increase of the fleet size in operation except for the fleet size of 33; (2) passengers’ costs, operational costs, total costs, and emissions of the proposed scheduling strategy with skip-stop services increase as the total passenger demand grows; (3) compared with the growth of the passenger demand for all-stop services, the growth of the passenger demand for stop-skipping services causes a greater increase in passengers’ costs and the total costs, while the operational costs and emissions are reduced; and (4) passengers’ costs, operational costs, total costs, and emissions are increased as the congestion becomes worse, implying that skip-stop buses are especially essential for congested conditions.
This paper provides a new perspective to develop an ecological scheduling strategy that aims to improve service quality, lower operating costs, and reduce emissions for public transportation agencies. It should be noted that the skipped stops are predetermined in this study. The proposed model can be further refined to search candidate skipped stops when optimizing the frequencies. The peak hour with large bus frequencies is selected as the study period in the case study due to great needs and potentials for emission control. In the future, optimal scheduling strategies with stop-skipping services at other time periods can be further studied with more collected data. Other different scheduling strategies, such as deadheading and short turning, can be further studied in the future to maximize the potential in emissions reduction of bus operations. Furthermore, to enhance the reliability of the proposed optimization model, stochastic vehicle travel time can be considered in a future study after a large amount of travel-time data from the real world is collected.
Acknowledgments
The authors acknowledge that this paper was prepared based on the National Natural Science Foundation of China (NSFC) under grant #71373018. Thanks are also given to the anonymous reviewers for their helpful comments on this paper.
Author Contributions
Xumei Chen, Xiaomi Han, and Changhai Wei participated in the acquisition and processing of data; Xumei Chen, Xiaomi Han, and Lei Yu developed the proposed model in this paper; Xumei Chen, Xiaomi Han, Changhai Wei, and Lei Yu performed all analyses; Xumei Chen, Xiaomi Han, and Lei Yu wrote the primary manuscript; all authors read, participated in discussions of appropriate groups for the analysis and interpretation of the results, and they all approved the final manuscript.
Conflicts of Interest
The authors declare no conflict of interest.
References
- Sun, F.; Zhu, W.T.; Ye, Y.; Wang, D.H. Optimal Skip-stop Schedule under Mixed Traffic Conditions for Minimizing Travel Time of Passengers. Discret. Dyn. Nat. Soc. 2013, 2013, 1–8. [Google Scholar] [CrossRef]
- Vuchic, V.R. Urban Transit: Operations, Planning and Economics; John Wiley and Sons, Inc.: Hoboken, NJ, USA, 2005. [Google Scholar]
- Khoat, N.D.; Bernard, D.G. The Real-time Stop-skipping in the Urban Transportation Networks. In Proceedings of the 4th International Federation of Automatic Control Conference on Management and Control of Production and Logistics, Sibui, Romania, 27–30 September 2007; pp. 637–642. [Google Scholar] [CrossRef]
- Milla, F.; Sáez, D.; Cortés, C.E.; Cipriano, A. Bus-stop Control Strategies based on Fuzzy Rules for the Operation of a Public Transport System. IEEE Trans. Intell. Transp. Syst. 2012, 13, 1394–1403. [Google Scholar] [CrossRef]
- Niu, H. Determination of the Skip-stop Scheduling for A Congested Transit Line by Bilevel Genetic Algorithm. Int. J. Comput. Intell. Syst. 2011, 4, 1158–1167. [Google Scholar] [CrossRef]
- Chiraphadhanakul, V.; Barnhart, C. Incremental Bus Service Design: Combining Limited-stop and Local Bus Services. Public Transp. 2013, 5, 53–78. [Google Scholar] [CrossRef]
- Wei, M.; Chen, X.W.; Sun, B. Multi-objective Single Line Transit Mixed Scheduling Model Considering Express Bus Service. J. Transp. Syst. Eng. Inf. Technol. 2015, 15, 169–174. [Google Scholar]
- Leiva, C.; Muñoz, J.C.; Giesen, R.; Larrain, H. Design of Limited-stop Services for an Urban Bus Corridor with Capacity Constraints. Transp. Res. Part B Methodol. 2010, 44, 1186–1201. [Google Scholar] [CrossRef]
- Chen, X.M.; Hellinga, B.; Chang, C.Z.; Fu, L.P. Optimization of Headways with Stop-skipping Control: A Case Study of Bus Rapid Transit System. J. Adv. Transp. 2015, 49, 385–401. [Google Scholar] [CrossRef]
- Zhang, H.; Zhao, S.Z.; Liu, H.S.; Liu, S.D. Design of Integrated Limited-Stop and Short-Turn Services for a Bus Route. Math. Probl. Eng. 2016, 2016. [Google Scholar] [CrossRef]
- Qu, H.Z.; Chien, S.I.-J.; Liu, X.B.; Zhang, P.T.; Bladikas, A. Optimizing bus services with variable directional and temporal demand using genetic algorithm. J. Cent. South Univ. 2016, 23, 1786–1798. [Google Scholar] [CrossRef]
- Ulusoy, Y.; Chien, S.I.-J.; Wei, C.H. Optimal all-stop, short-turn, and express transit services under heterogeneous demand. Transp. Res. Rec. J. Transp. Res. Board 2010, 2197, 8–18. [Google Scholar] [CrossRef]
- Ulusoy, Y.Y.; Chien, S.I.-J. Optimal bus service patterns and frequencies considering transfer demand elasticity with genetic algorithm. Transp. Plan. Technol. 2015, 38, 409–424. [Google Scholar] [CrossRef]
- Chien, S.I.-J.; Ulusoy, Y.Y.; Wei, C.H. Integrated transit services for minimum cost operation considering heterogeneous demand. Transp. Plan. Technol. 2010, 33, 605–624. [Google Scholar] [CrossRef]
- Qu, H.Z.; Chien, S.I.-J.; Liu, X.B. Improving Vehicle Emissions of Bus Transit with Integrated Service and Different Vehicle Sizes. In Proceedings of the 95th Annual Meeting of the Transportation Research Board, Washington, DC, USA, 7–11 January 2016. [Google Scholar]
- Dessouky, M.; Rahimi, M.; Weidner, M. Jointly Optimizing Cost, Service, and Environmental Performance in Demand-responsive Transit Scheduling. Transp. Res. Part D Transp. Environ. 2003, 8, 433–465. [Google Scholar] [CrossRef]
- Li, J.Q.; Head, K.L. Sustainability Provisions in the Bus-scheduling Problem. Transp. Res. Part D Transp. Environ. 2009, 14, 50–60. [Google Scholar] [CrossRef]
- Gouge, B.; Dowlatabadi, H.; Ries, F.J. Minimizing the Health and Climate Impacts of Emissions from Heavy-duty Public Transportation Bus Fleets through Operational Optimization. Environ. Sci. Technol. 2013, 47, 3734–3742. [Google Scholar] [CrossRef] [PubMed]
- Sun, B. Optimal Bus Scheduling Considering Operating Costs and Emissions: A Multiple Objective, Mixed Integer Programming Framework. Master’s Thesis, University of Minnesota, Minneapolis, MN, USA, December 2015. [Google Scholar]
- Jiménez, P. Understanding and Quantifying Motor Vehicle Emissions with Vehicle Specific Power and TILDAS Remote Sensing. Ph.D. Thesis, Massachusetts Institute of Technology, Cambridge, MA, USA, 1999. [Google Scholar]
- Frey, H.C.; Unal, A.; Chen, J.; Li, S.; Xuan, C. Methodology for Developing Modal Emission Rates for EPA’s Multi-scale Motor Vehicle and Equipment Emission System; Publication EPA 420-R-02-027; U.S. Environmental Protection Agency (EPA): Washington, DC, USA, 2002.
- Niu, X.Q.; Wang, W. Study on the Model of Transit Network Multi-path Assignment based on Shortest Path Search. J. Southeast Univ. Nat. Sci. Ed. 2002, 32, 917–919. [Google Scholar]
- Wang, Y.A. Passenger Flow Assignment of Urban All-Stop Bus and Skip-Stop Bus Based on Logit Model. Master’s Thesis, Beijing Jiaotong University, Beijing, China, 2015. [Google Scholar]
- Chang, C.Z. Study on Optimization and Simulation Evaluation of Combinational Scheduling for Bus Rapid Transit System. Master’s Thesis, Beijing Jiaotong University, Beijing, China, 2010. [Google Scholar]
- Zhai, H.; Frey, H.C.; Rouphai, N.M. A Vehicle-Specific Power Approach to Speed- and Facility-Specific Emissions Estimates for Diesel Transit Buses. Environ. Sci. Technol. 2008, 42, 7985–7991. [Google Scholar] [CrossRef] [PubMed]
- Wang, W.; Xu, J.; Yang, T. Urban Transportation Planning Theory and Its Application; Southeast University Press: Nanjing, China, 1998. [Google Scholar]
- Chinese City Public Transportation Association Office; Beijing Institute of Public Transport; Science and Technology Committee of the Ministry of Construction. Passenger Transport Services Specifications for Urban Bus/Trolley Bus; Publication GB/T 22484-2008; Standardization Administration of China: Beijing, China, 2008.
- Zhang, W.K. Research on Estimation of Urban Public Transport Travel Time Value. Master’s Thesis, Shijiazhuang Tiedao University, Shijiazhuang, China, 2016. [Google Scholar]
Figure 1.
Choice behavior of passengers along the route with skip-stop services. OD: Origin and Destination.
Figure 1.
Choice behavior of passengers along the route with skip-stop services. OD: Origin and Destination.

Figure 2.
Flow chart of the solution method.

Figure 3.
Bus route 16 in Beijing.

Figure 4.
Passenger boardings and alightings at each stop: (a) Northbound and (b) Southbound.
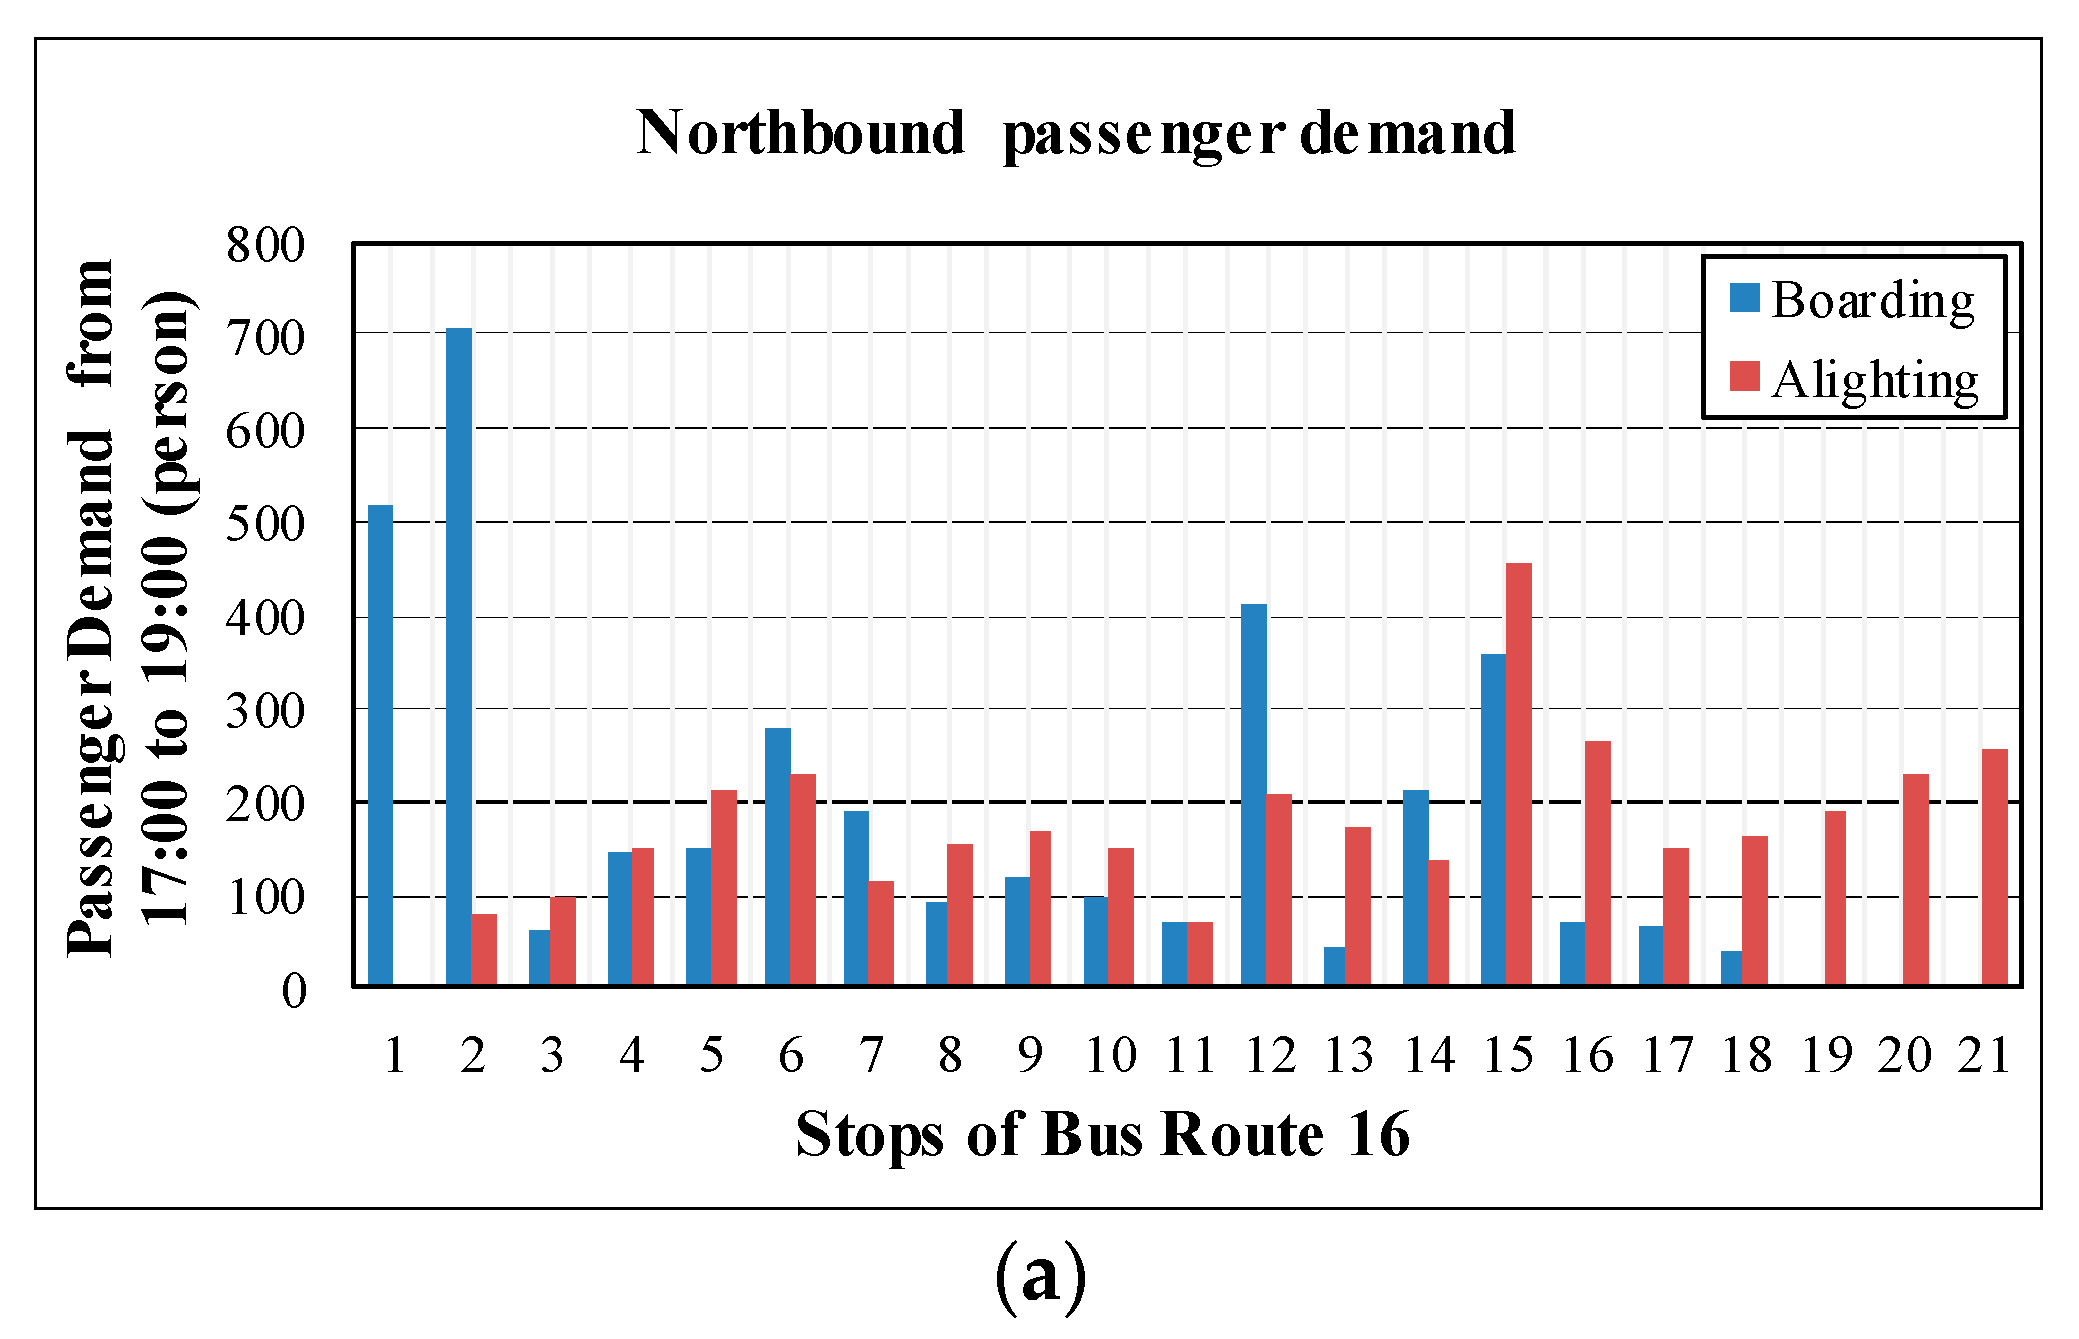

Figure 5.
Classification of OD distribution after skip-stop services are provided.


Table 1.
List of Notation.
| Notation | Description |
|---|---|
| Weighted sum of passengers’ costs and operational costs (Yuan) | |
| Weight coefficient of passengers’ costs and operational costs | |
| , | Passengers’ costs and operational costs (Yuan) |
| , | Waiting time costs of passengers for all-stop services and skip-stop services (Yuan) |
| , | In-vehicle time costs of passengers for all-stop services and skip-stop services (Yuan) |
| , | Operational costs for all-stop services and skip-stop services (Yuan) |
| Unit time value for waiting time at a bus stop (Yuan/s) | |
| , | Bus stop of bus line, i, j = 1, 2, … , N |
| , | The set of stops for all-stop services and skip-stop services |
| , | Number of passengers that get on at the stop and get off at stop for all-stop services and skip-stop services (persons) |
| , | Vehicle frequencies of the all-stop bus and the skip-stop bus (veh/hr) |
| , | Number of left OD trips from Stop i to Stop j for all-stop services and skip-stop services |
| Unit time value for in-vehicle time (Yuan/s) | |
| Distance between stop and stop (m) | |
| Running speed at the segment between adjacent stops (m/s) | |
| Acceleration departing from the bus stop or deceleration arriving at the bus stop (m/s2) | |
| , | Number of passengers boarding and alighting stop p that does not offer skip-stop services (persons) |
| , | Average passenger boarding and alighting time (s) |
| Studied period (h) | |
| Average door closing time (s) | |
| , | Number of passengers boarding and alighting stop p that offers skip-stop services (persons) |
| Average monthly salary of crew members (Yuan/month) | |
| Purchase cost per vehicle (Yuan/vehicle) | |
| Total route length (km) | |
| , | Average speeds of the all-stop bus and the skip-stop bus respectively (m/s) |
| Fuel consumption rate (m3/km or L/km) | |
| Fuel price per unit liter or cubic meter, (Yuan/m3 or Yuan/L) | |
| Amount of bus emissions (g) | |
| Weight coefficient for pollutant from the bus | |
| , | Emission factors for pollutant of the all-stop bus and the skip-stop bus, respectively (g/km) |
| , | Total number of stops for all-stop services and skip-stop services |
| Rated passenger capacity for buses (persons) | |
| Maximum load factor that can be accepted | |
| Lower limit of headway considering the operational cost and safety (s) | |
| Upper limit of headway considering level of services (s) | |
| Fleet size in operation (vehicles) |
Table 2.
Emission Factors of the All-stop and Skip-stop Buses.
| Bus | NOx (g/km) | HC (g/km) | CO (g/km) | PM (g/km) |
|---|---|---|---|---|
| All-stop bus | 8.2560 | 2.4125 | 5.5284 | 0.1162 |
| Skip-stop bus | 7.4028 | 2.0996 | 5.3981 | 0.1054 |
Table 3.
Other Input Data to the Proposed Model.
| Data | Denotation | Value |
|---|---|---|
| Studied period (h) | 2 | |
| Unit time value for waiting time at a bus stop (Yuan/s) | 0.00278 | |
| Unit time value for In-vehicle time (Yuan/s) | 0.00222 | |
| Average passenger boarding time (s) | 1 | |
| Average passenger alighting time (s) | 1 | |
| Weight coefficient of passenger’ waiting and in-vehicle time costs | 0.7 | |
| Rated passenger capacity for buses (persons) | 90 | |
| Acceleration departing from the bus stop or deceleration arriving at the bus stop (m/s2) | 1 | |
| Average door closing time (s) | 2 | |
| Running time at the segment between adjacent stops (m/s) | 8.3333 | |
| Average monthly salary of crew members (Yuan/month) | 6463 | |
| Purchase cost per vehicle (Yuan/vehicle) | 2,000,000 | |
| Fuel consumption rate (m3/km or L/km) | 0.28 | |
| Fuel price per unit liter or cubic meter, (Yuan/m3 or Yuan/L) | 3.17 | |
| Maximum load factor that can be accepted | 120% | |
| Lower limit of headway considering the operational cost and safety (s) | 120 | |
| Upper limit of headway considering level of services (s) | 300 | |
| Weight coefficient for NOx from the bus | 0.3 | |
| Weight coefficient for HC from the bus | 0.1 | |
| Weight coefficient for CO from the bus | 0.3 | |
| Weight coefficient for PM from the bus | 0.3 | |
| Tolerance coefficient | 2% | |
| Average speed of the all-stop bus (m/s) | 5.6 | |
| Average speed of the skip-stop bus (m/s) | 6.9 |
Table 4.
Optimal Frequencies and Costs Results.
| Scheduling Strategies | Scheduling with Stop-Skipping Services Considering Bus Emissions | Scheduling with Stop-Skipping Services without Considering Bus Emissions |
|---|---|---|
| Vehicle Frequencies (veh/h) | ||
| (Yuan) | 2108.7 | 1977.0 |
| (Yuan) | 3799.2 | 3788.4 |
| (Yuan) | 5907.9 | 5765.4 |
| (Yuan) | 1518.2 | 1618.3 |
| (Yuan) | 4594.4 | 4524.6 |
| (g) | 1687.8 | 1796.3 |
| (%) | 6.7% | NA |
| (%) | 0.3% | NA |
| (%) | 2.5% | NA |
| (%) | −6.2% | NA |
| (%) | 1.5% | NA |
| (%) | −6.0% | NA |
Note: , , , , , and represent the cost or emission percentage increase/decrease compared with scheduling with stop-skipping services considering bus emissions.
Table 5.
Optimal Frequencies, Costs, and Cost Changes with Respect to Fleet Size in Operations.
| (Vehicles) | Optimal Frequencies | (Yuan) | (Yuan) | (Yuan) | (g) | (%) | (%) | (%) | (%) |
|---|---|---|---|---|---|---|---|---|---|
| 31 | 6089.8 | 1418.1 | 4691.7 | 1579.2 | 3.1% | −6.6% | 2.1% | −6.4% | |
| 32 | 6054.5 | 1432.0 | 4671.2 | 1587.3 | 2.5% | −5.7% | 1.7% | −5.9% | |
| 33 | 5914.3 | 1532.1 | 4603.0 | 1695.9 | 0.1% | 0.9% | 0.2% | 0.5% | |
| 34 | 5907.9 | 1518.2 | 4594.4 | 1687.8 | NA | NA | NA | NA | |
| 35 | 5816.2 | 1604.4 | 4556.1 | 1788.2 | −1.6% | 5.7% | −0.8% | 5.9% |
Note: , , , and represent the cost or emission percentage increase/decrease compared with the proposed scheduling strategy with the existing fleet size of 34.
Table 6.
Optimal frequencies, costs, and cost changes with respect to passenger demand.
| Variation of Passenger Demand | Optimal Frequencies | (Yuan) | (Yuan) | (Yuan) | (g) | (%) | (%) | (%) | (%) |
|---|---|---|---|---|---|---|---|---|---|
| Passenger demand decreased by 20% | 4920.4 | 1518.2 | 3902.6 | 1687.8 | −16.7% | −0.0004% | −15.1% | −0.002% | |
| Passenger demand increased by 20% | 7213.5 | 1604.4 | 5535.0 | 1788.2 | 22.1% | 5.7% | 20.5% | 5.9% | |
| Passenger demand increased by 40% | 8389.2 | 1604.4 | 6358.8 | 1788.2 | 42.0% | 5.7% | 38.4% | 5.9% | |
| Passenger demand for all-stop services increased by 40% | 6893.3 | 1532.1 | 5289.0 | 1695.9 | 16.7% | 0.9% | 15.1% | 0.5% | |
| Passenger demand for skip-stop services increased by 40% | 7483.1 | 1518.2 | 5723.4 | 1687.8 | 26.7% | −0.0004% | 24.6% | −0.002% |
Note: , , , and represent the cost or emission percentage increase/decrease compared with the proposed scheduling strategy with the existing passenger demand.
Table 7.
Optimal frequencies, costs, and cost changes with respect to congestion level.
| Variation of Congestion Level | Optimal Frequencies | (Yuan) | (Yuan) | (Yuan) | (g) | (%) | (%) | (%) | (%) |
|---|---|---|---|---|---|---|---|---|---|
| 0.95× base speed | 6069.1 | 1579.7 | 4657.4 | 1776.6 | 2.7% | 4.1% | 1.4% | 5.3% | |
| 0.9× base speed | 6248.2 | 1648.1 | 4804.9 | 1875.3 | 5.8% | 8.6% | 4.6% | 11.1% | |
| 0.85× base speed | 6448.4 | 1724.5 | 5035.1 | 1985.6 | 9.1% | 13.6% | 9.6% | 17.6% | |
| 0.8× base speed | 6582.9 | 1912.7 | 5186.0 | 2235.2 | 11.4% | 26.0% | 12.9% | 32.4% |
© 2017 by the authors. Licensee MDPI, Basel, Switzerland. This article is an open access article distributed under the terms and conditions of the Creative Commons Attribution (CC BY) license (http://creativecommons.org/licenses/by/4.0/).
Share and Cite
MDPI and ACS Style
Chen, X.; Han, X.; Yu, L.; Wei, C. Does Operation Scheduling Make a Difference: Tapping the Potential of Optimized Design for Skipping-Stop Strategy in Reducing Bus Emissions. Sustainability 2017, 9, 1737. https://doi.org/10.3390/su9101737
AMA Style
Chen X, Han X, Yu L, Wei C. Does Operation Scheduling Make a Difference: Tapping the Potential of Optimized Design for Skipping-Stop Strategy in Reducing Bus Emissions. Sustainability. 2017; 9(10):1737. https://doi.org/10.3390/su9101737
Chicago/Turabian StyleChen, Xumei, Xiaomi Han, Lei Yu, and Changhai Wei. 2017. "Does Operation Scheduling Make a Difference: Tapping the Potential of Optimized Design for Skipping-Stop Strategy in Reducing Bus Emissions" Sustainability 9, no. 10: 1737. https://doi.org/10.3390/su9101737
Note that from the first issue of 2016, this journal uses article numbers instead of page numbers. See further details here.