In-Migration and Housing Choice in Ho Chi Minh City: Toward Sustainable Housing Development in Vietnam


1
Department of Civil and Environmental Engineering, Seoul National University, Seoul 08826, Korea
2
University of California at Berkeley, Berkeley, CA 94704, USA
*
Authors to whom correspondence should be addressed.
Sustainability 2017, 9(10), 1738; https://doi.org/10.3390/su9101738
Submission received: 28 July 2017
/
Revised: 18 September 2017
/
Accepted: 22 September 2017
/
Published: 27 September 2017
(This article belongs to the Special Issue Sustainable Urbanization Strategies in Developing Countries)
Abstract
:Since the initiation of Vietnam’s Doi Moi policy in 1986, the rate of urbanization has rapidly increased with a great influx of immigrants from rural areas. With such migration becoming a large acceleration factor for urban growth, the shortage of housing has become a critical problem in the cities. The Vietnamese government encouraged self-built housing and public–private partnerships to produce different types of housing stock. There are few available academic studies about housing choice in Vietnam to help understand movement dynamics and to foster sustainable housing development. The purpose of this study is to analyze housing choice and moving determinants in Ho Chi Minh City, and thereby establish recommendations for sustainable housing development in Vietnam. For an empirical study, a citizen questionnaire survey was conducted in HCMC and an in-depth analysis was carried out. The results indicate that the row house type for single-family housing is strongly preferred, but a preference for apartments is also observed for future planning. The factors influencing housing choice and movement are family income, housing ownership, housing typology, and commuting environment. These phenomena suggest that the government should prudently consider affordable housing development in many districts. The results of this study will help to establish policies for sustainable housing development in Ho Chi Minh City, Vietnam.
1. Introduction
Vietnam’s rate of urbanization has rapidly increased with a great influx of immigrants from rural areas since the initiation of the Doi Moi (Đổi Mới: open door) economic reforms in 1986. The policy goal was to create a socialist-oriented market economy and to accelerate economic transition to industrial manufacturing, leading to employment and economic output [1]. It resulted in a remarkable increase in foreign direct investment (FDI) into Vietnam and became a significant factor for economic growth in industrial manufacturing development. The phenomenon was especially observed in Ho Chi Minh City (HCMC), Hanoi, and their peri-urban areas with enormous inflows from rural areas [2]. Nationally, the urban proportion of the population increased from 20.5% in 1990 to 34.7% in 2017 [3].
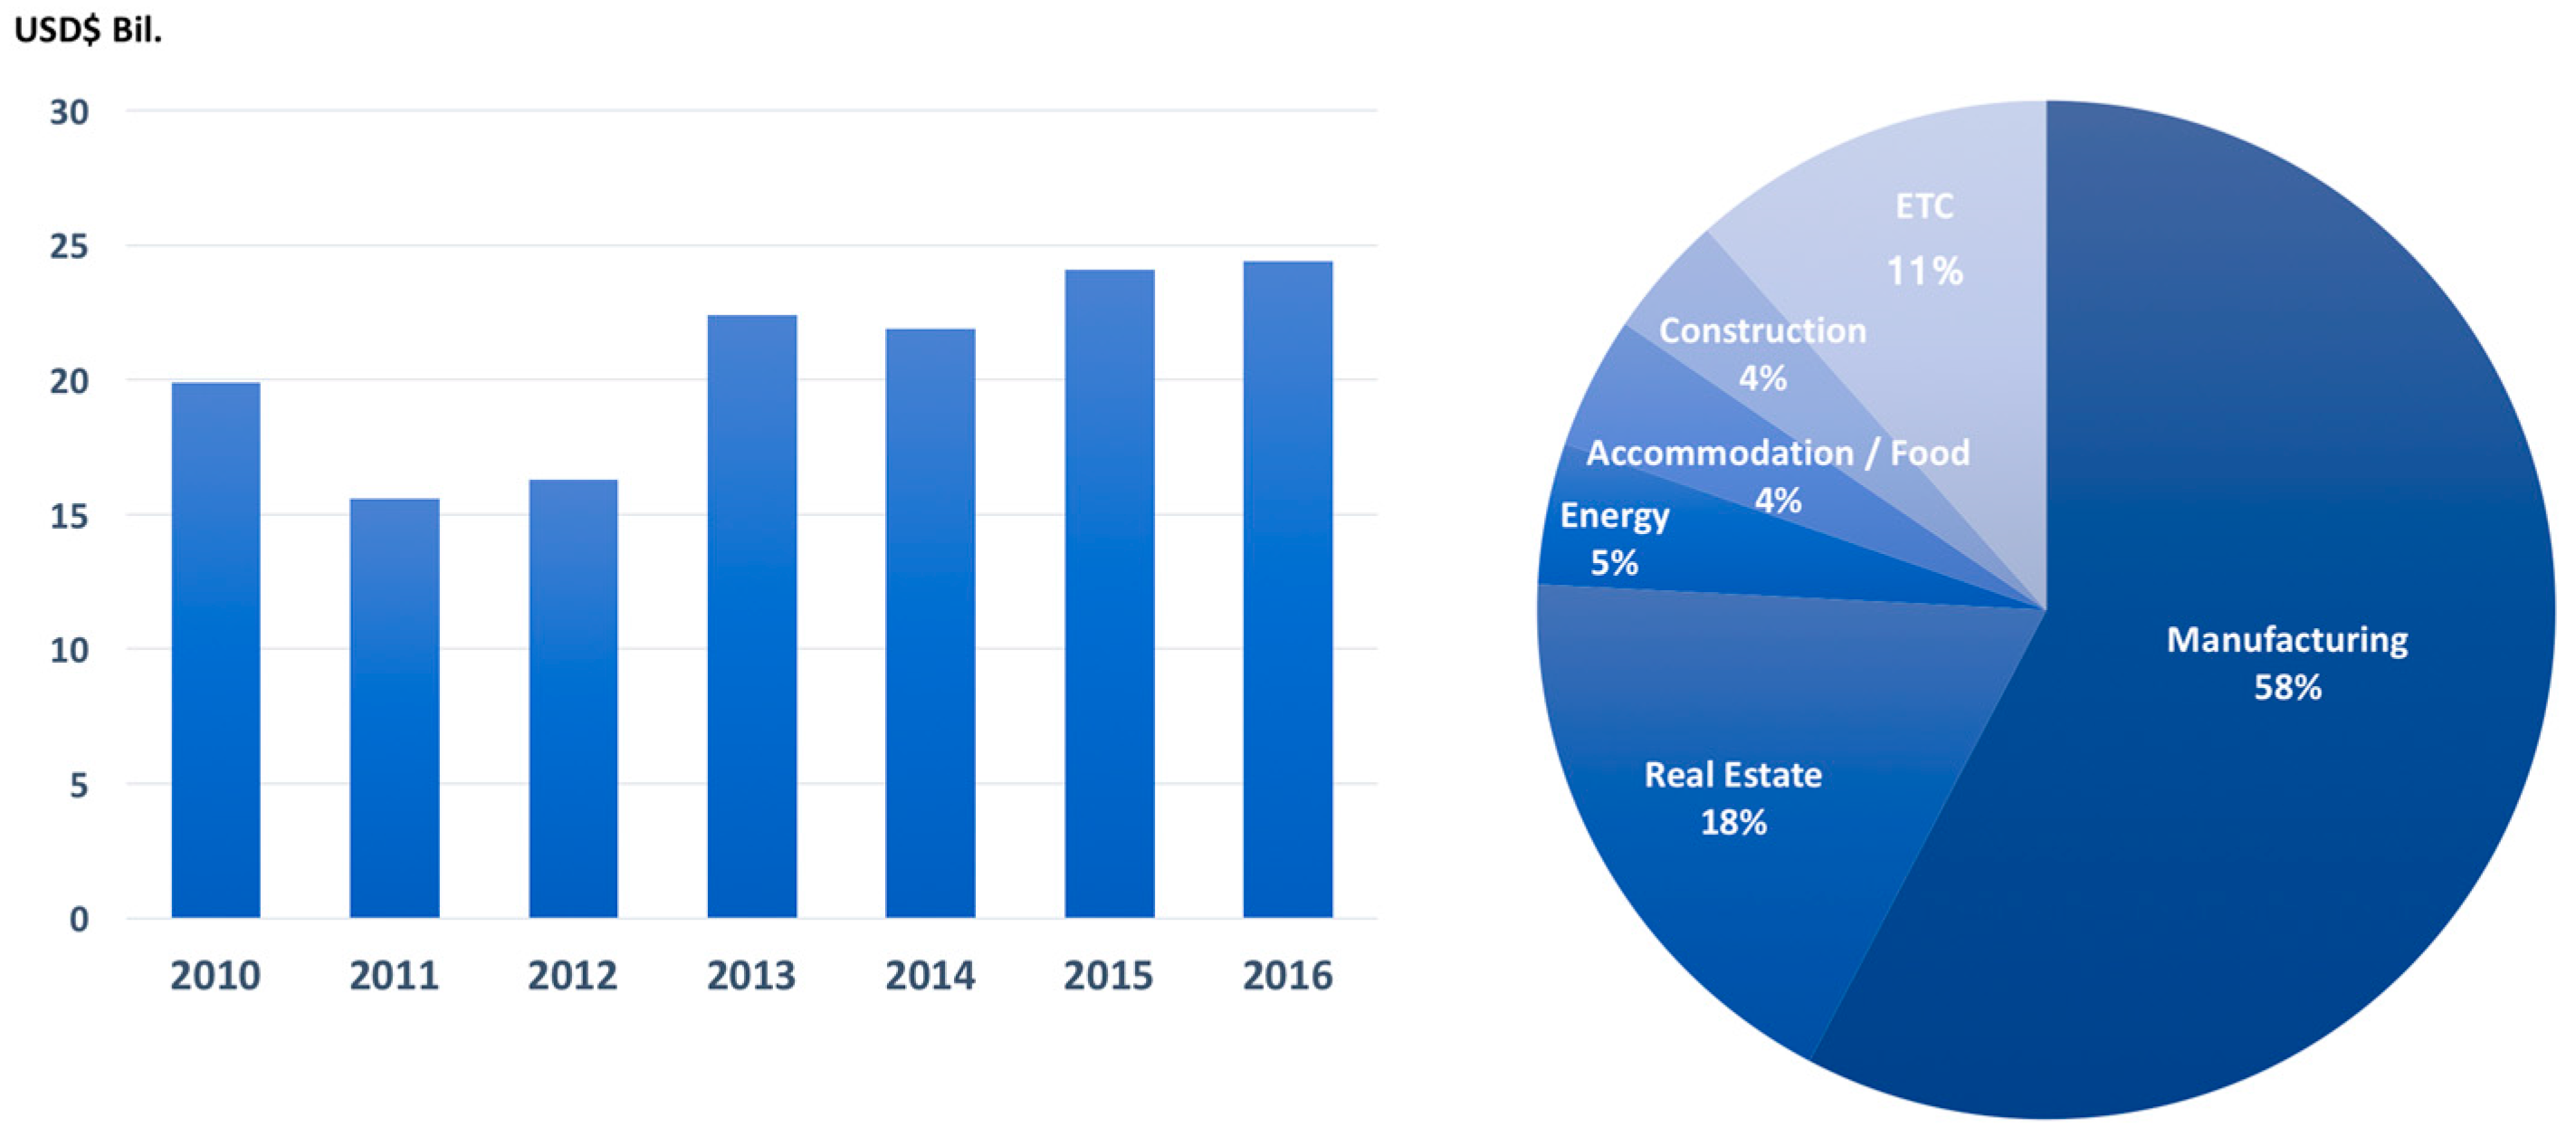
Real estate has been a significant sector of FDI in the last decades, ranking second (18%) behind manufacturing and processing industries (58%) in Vietnam (Figure 1). The foreign investment has focused on luxury housing developments in particular, and has increased remarkably since the revision of the housing laws in 2015 to allow foreigners to own property. Real estate experts believe that the housing market will continue to be a focus of FDI and the dynamics of movement and housing choice in Vietnam will increase [4].
The concept of housing choice, which is widely used in housing research, is different from housing preference. While the latter refers to the relative attractiveness of housing, the former refers to actual behavior. Even if preference strongly influences housing choice, the buyers consider more than just their preferences. Priemus [6] highlights the fact that various factors restrain housing choices for potential customers, such as official regulations, market and price, household finance, geographic location, and so forth. More factors can be added that affect the customers’ behavior, such as perception, family, neighborhood, schedule, and lifestyle [7]. Hooimeijer underlines two motivating powers for the choices. The first is the local real estate market and housing supply, and the second is individual lifestyle change with the progressing life-cycle [8].
The dynamic of housing preference and choice has been reviewed in several theoretical publications and has led to several models: the Life-cycle, Planned Behavior, and Decision-Making models [9]. All of them are closely related to social, economic, and cultural aspects of Vietnamese sustainable housing development. From the perspective of the life-cycle model, housing choice and movement rely on family events such as formation (by marriage), expansion (by the birth of children), contraction (by moving out), and dissolution (by divorce or death of a spouse) [10]. Each phase motivates households to choose a form of housing of suitable size and number of rooms. The phases are also intertwined with education levels, available employment, housing careers, local markets, etc. [11,12,13,14].
The planned behavior model has been developed from the expectancy-value theory [12], which is based on behavior being the result of the entirety of the expected values of the characteristics. De Jong and Fawcett [15] introduced this model for migration decision-making in housing research. The expectancy level is rated via importance evaluation of a set of values, followed by the generation of an attraction score for a specific place and form of housing as a determinant of moving [16]. In addition, they note that personal and structural backgrounds directly impact migration. The most important intention factors in deciding whether to move or stay are marital status and financial capability [17].
Another approach to housing choice is viewing the process of decision-making as a series of dynamic problem-solving techniques [10,18,19,20]. In other words, looking for a new residence is the process of resolving a complicated and ill-structured situation into a relatively satisfying situation. In this context, goal-oriented behavior is highlighted in housing choice rather than just preferences. Customers can derive their goals from economic, social, and environmental issues that repeat and backtrack in their lives. Thus, the housing choice is an optimal behavior to pursue a certain desired quality of life such as happiness, freedom, safety, and security, or, in other words, minimizing the experience of negative emotions [21].
The goal of this study is to investigate moving and housing choice patterns in HCMC and to try to find implications for future sustainable urbanization and housing development. Housing choice and migration in HCMC seem to be a mixture of the Life-cycle, Planned Behavior, and Decision-Making models, with the last having a particularly strong impact on housing choice in the context of Vietnamese urbanization. The following objectives were set for the research: (1) to investigate housing type choices for the migration; (2) to examine factors influencing movement determination; (3) to understand housing preferences and expected movement patterns; and (4) to find implications for public policies to foster sustainable housing development in Vietnam.
2. Housing Development with Urbanization in Vietnam
Vietnam can be called a country of self-built housing. As commercial housing development was not legally permitted, both households and informal micro-developers have produced most of the housing. This was the most common way to supply housing in the country. Since 1975, the government produced only 5% of total formal housing stocks until 1994 and the other 95% was self-built housing. Then, the state stepped away from housing development when land use rights and commercial land markets emerged after the initiation of the Doi Moi economic reform. However, self-built housing has always dominated the housing sector and even today the majority of houses are still self-built [22] (Table 1).
2.1. Economic Reforms, In-Migration, and Housing Shortages
Vietnam has registered a dynamic movement of households, preceded by economic growth during the last several decades. The population was about 68 million in 1990 and reached 95 million in 2017. The urban population as a percentage of the national population also increased from 20.5% to 34.7% as a result of an influx of migrants [3]. The big momentum for the growth was the Doi Moi economic reform in 1986. This led to a transition from a centrally planned economy on a socialist model to a market-oriented economy on a liberal model. The shift saw a significant impact as a result of the emergence of liberal market mechanisms with the opening up to foreign direct investment (FDI) [23]. With the inception of Doi Moi, increasing international trade and a large FDI inflow was possible due to Vietnam’s geographic advantages as an export platform to EU and USA markets, a stable economic and political environment, an abundance of well-educated young workers, richness of natural resources, a growing domestic market, and government commitment to economic reform [24]. Despite its short FDI history, Vietnam was ranked as having the third-largest FDI inflow in the Association of Southeast Asian Nations (ASEAN). Registered capital and licensed projects have rapidly increased and peaked in 1996. FDI contributed 25% of total investment and 20.1% of GDP in 2015.
FDI has been a central driver of export-oriented industrialization, particularly for manufacturing and processing industries in Vietnam, with 58.4% of FDI capital invested in fields requiring significant numbers of manufacturing workers. Thus, the labor market has dramatically surged around the emerging industrial zones in HCMC and Hanoi, which served as large magnets that induced people to migrate from rural areas. HCMC’s population increased from 3.92 million in 1898 to 6.25 million in 2005 and approximately 1.9 million of these were migrants to the city. District 12, Thu Duc, and Binh Tan in HCMC, in particular, registered the highest rates of population growth (respectively, +77%, +64%, and +58%) from 1999 to 2005 [25,26]. Over 70% of the migrants were between the ages of 15 and 30. Their housing ownership rate was only 8.7% in 2010 and more than 90% of migrants stayed in rented housing and temporary shelters along the canal or on agricultural land with relatives [22]. The urban settlement area has expanded horizontally to the suburban districts on the periphery, more than doubling in the last 20 years. Most of the development was uncontrolled urban sprawl and the districts were filled with temporary housing for temporary residents and workers.
Temporary or dilapidated housing constituted two-thirds of Vietnam’s urban housing in the 1990s [27]. Figure 2 indicates that the rate of permanent housing, which has durable foundations and permanent construction materials, was only about 25% in both 2002 and 2012 in HCMC, the rest being temporary and semi-permanent housing characterized by impermanent structures and temporary finishing materials on walls and roofs. The average housing area per person was only 5 m2 and more than 300,000 citizens lived in 2–3 m2/person during the period. The problems in the housing sectors were exacerbated in both qualitative and quantitative terms. Infrastructure was also inadequate and run down and thus threatened public health, especially in the squatter settlements which were pervasive in the city [3].
2.2. Predominantly Self-Built Housing Production and Urban Challenges
Since the Doi Moi reforms, housing sectors have experienced tremendous growth, particularly in the high-end sectors, in terms of both supply and demand. Eighteen percent of FDI has been invested in real estate development, with the majority flowing to luxury housing developments [26]. As private sectors have led the market-based housing supply system, there were hardly any housing solutions accessible to the low- and middle-income classes. An affordable housing supply was especially critical given the rapid population influx and housing shortages in HCMC and Hanoi. In this period, the government tried to minimize public investment and reduced subsidized housing programs. Not only was the increasing demand for affordable housing far higher than the authorities’ housing supply capacity, but the authorities had also shifted their development priority from public housing to industrial development. Instead, they initiated policies to support self-built housing production. The revision of land laws and housing policies served to privatize residential land and encourage its use for self-built row housing [29]. Decree No. 64/2012/ND-CP, indicating exemptions for small-scale building construction permits, shows the government’s willingness to support the self-building sectors. As this aspect of the market had rapidly grown, to the extent that entire cities seemed to have been created by micro builders and small-scale developers, it was regarded as the most affordable and accessible housing for low- and middle-income segments.
HCMC has experienced particularly rapid horizontal urbanization in the peripheral areas by the conversion of farmland into residential land [29]. However, a lack of property rights management capacity in the local authorities led to chaotic situations. Of the self-built housing units constructed in the peripheral area, 75.4% were built without any complete sets of legal documentation [27]. To facilitate the provision of residential land and thereby housing by the provision of legal titles, a new land law was enacted in 1993, creating a legal platform as a foundation for a real estate market where assets could be transacted, rented, transferred, inherited, and mortgaged. Local authorities required those who had been involved in various illegal transactions to submit to a notarization process and issued LURCs (Land Use Rights Certificates) to certify land and BOLURCs (Building Ownership and Land Use Rights Certificates) to certify both the building and land [30]. Thus, the process of creating legal titles resulted in a more transparent land and housing market with huge potential. From the time the land law was enacted, new residential developments gradually tended to appear in the form of projects, particularly in HCMC.
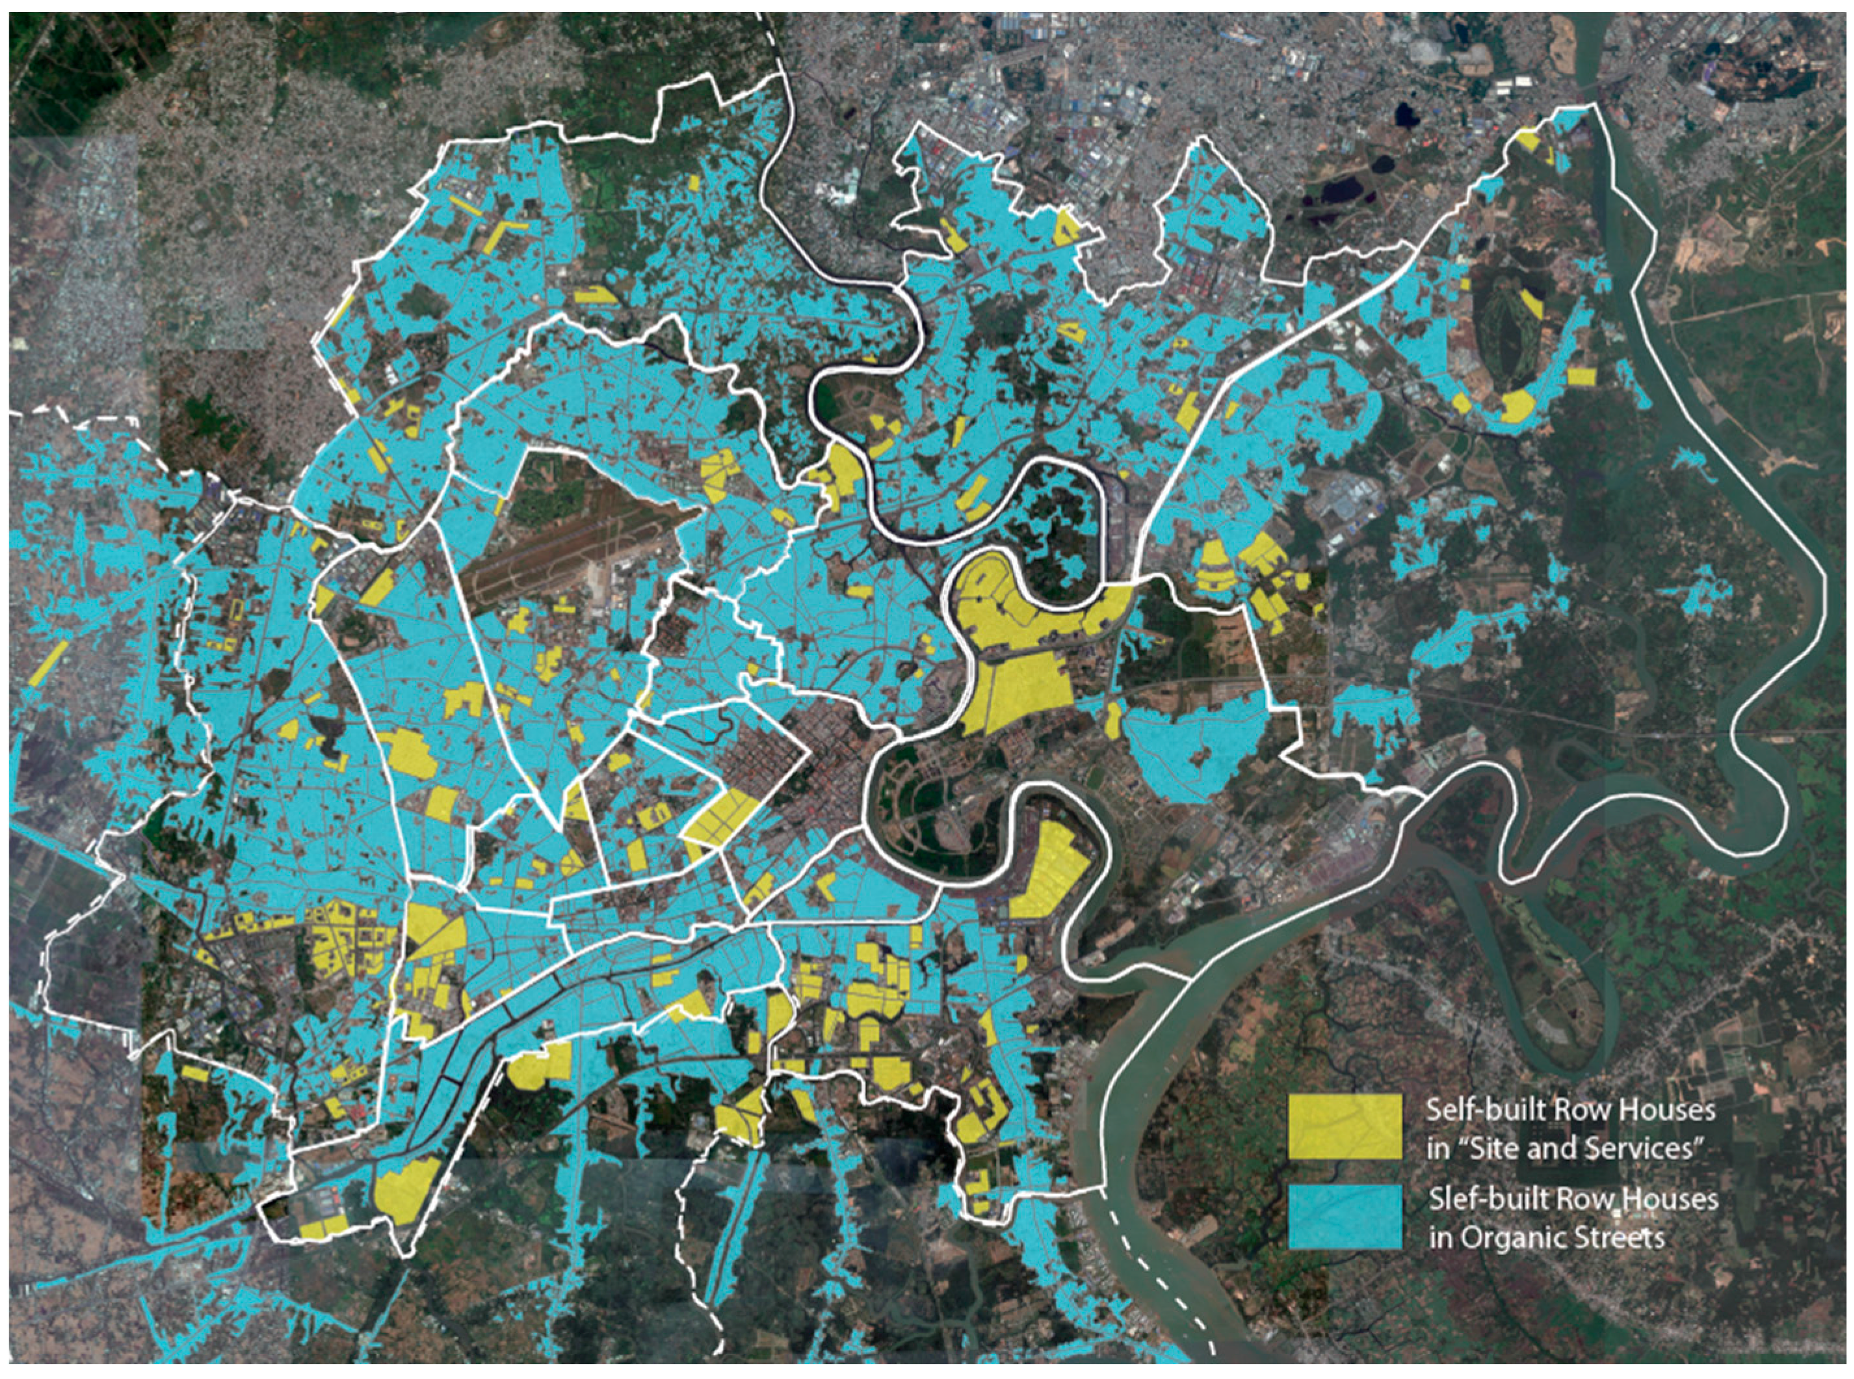
The most common housing projects were “site and services” and land sub-division types. These provided only sub-divided plots of land with basic infrastructure for sale and thus the landowners began to create self-built row housing through their own investment based on the government’s legal support [31]. There were, for instance, 488 residential projects providing 183,410 units and covering an area of 1282.6 ha of the land sub-division type from 1996 to 2000 in HCMC [27]. The row houses were largely built from 1999 to 2009 and were estimated to account for about 60% of the total urban housing stock production in that period. High-rise apartment projects by private real estate developers accounted for another 33% [3]. This trend continued in the 2000s and the informal “popular row housing” still dominated urban settlement in HCMC (Figure 3). Further laws were enacted, such as the 2005 Investment Law, the 2005 Enterprise Law, the 2006 Real Estate Law, and the 2009 Urban Planning Law. These laws supplied a legal platform to improve the housing market mechanisms. In 2011, the government approved social housing policies to increase the rate of home ownership for the low-income class [3]. A recently revised 2015 Housing Law and Real Estate Business Law allowed foreign investors access to the housing market [32]. As a result of all these measures, the Vietnamese housing market has been growing and housing stocks have dramatically increased. According to the Vietnam General Statistics Office, the Census of Population and Housing 2009 indicates that the number of housing units in 1999 was 4.03 million and had increased to 6.76 million in 2009. While rural housing units increased by only 22%, urban units increased by 68%.
The self-building trend had a positive side in the sense of providing affordable and accessible housing for low- and middle-income segments but it resulted in uncontrolled urban sprawl which has been pervasive in the suburban districts of peripheral areas (Figure 4). More than 90% of these self-constructed housing units were built in the 1990s without obeying building guidelines and regulations [2]. Large amounts of self-built housing were organically created to maximize their own private spaces and the fast pace of development resulted in serious urban densification and pressure on infrastructure and transportation planning in HCMC. The urban road capacity is not sufficient and inner community roads are too narrow to allow residents to access their housing. Since many districts have grown with the influx of immigrants and informal self-built housing production since the late 1980s, the middle- and low-income communities have struggled as a result of the relatively small area devoted to roads and the disorganized road networks. According to the UN Habitat’s report, approximately 16% of the developable land in the cities was planned for road infrastructure in Vietnam. This is a much smaller fraction compared to the international average of 20–25%. In the case of HCMC, only 6.2% of the developable land was for roads and in its peripheral area, surprisingly, only 0.4%. Access roads to residential areas are usually 3–5 m wide, internal roads or pathways less than 3 m, and informal roads in self-built housing districts less than 1.5 m [3]. This makes it impossible for private cars and public transportation, indeed anything other than two-wheeled vehicles, to access homes.
3. Research Methods
According to Vietnam’s regional and urban administration hierarchy system, Vietnam’s cities are categorized into 6 classes based on the level of economic development, physical development, population and its density, and infrastructure provision. HCMC was classified as one of the two national “special” cities, a top ranking, due to its significant economic and political contributions to the country [33]. HCMC has 9.2% of Vietnam’s total population and is responsible for 20.8% of its GDP (2016). In this context, HCMC has experienced the highest levels of urbanization and industrialization, population growth, and housing development. This trend is also found in other cities. As most cities want to climb the city class ladder to receive better recognition and financial support from the central government, they are pursuing growth patterns similar to those of HCMC. As a result, the city is considered a significant reference as a development model in Vietnam.
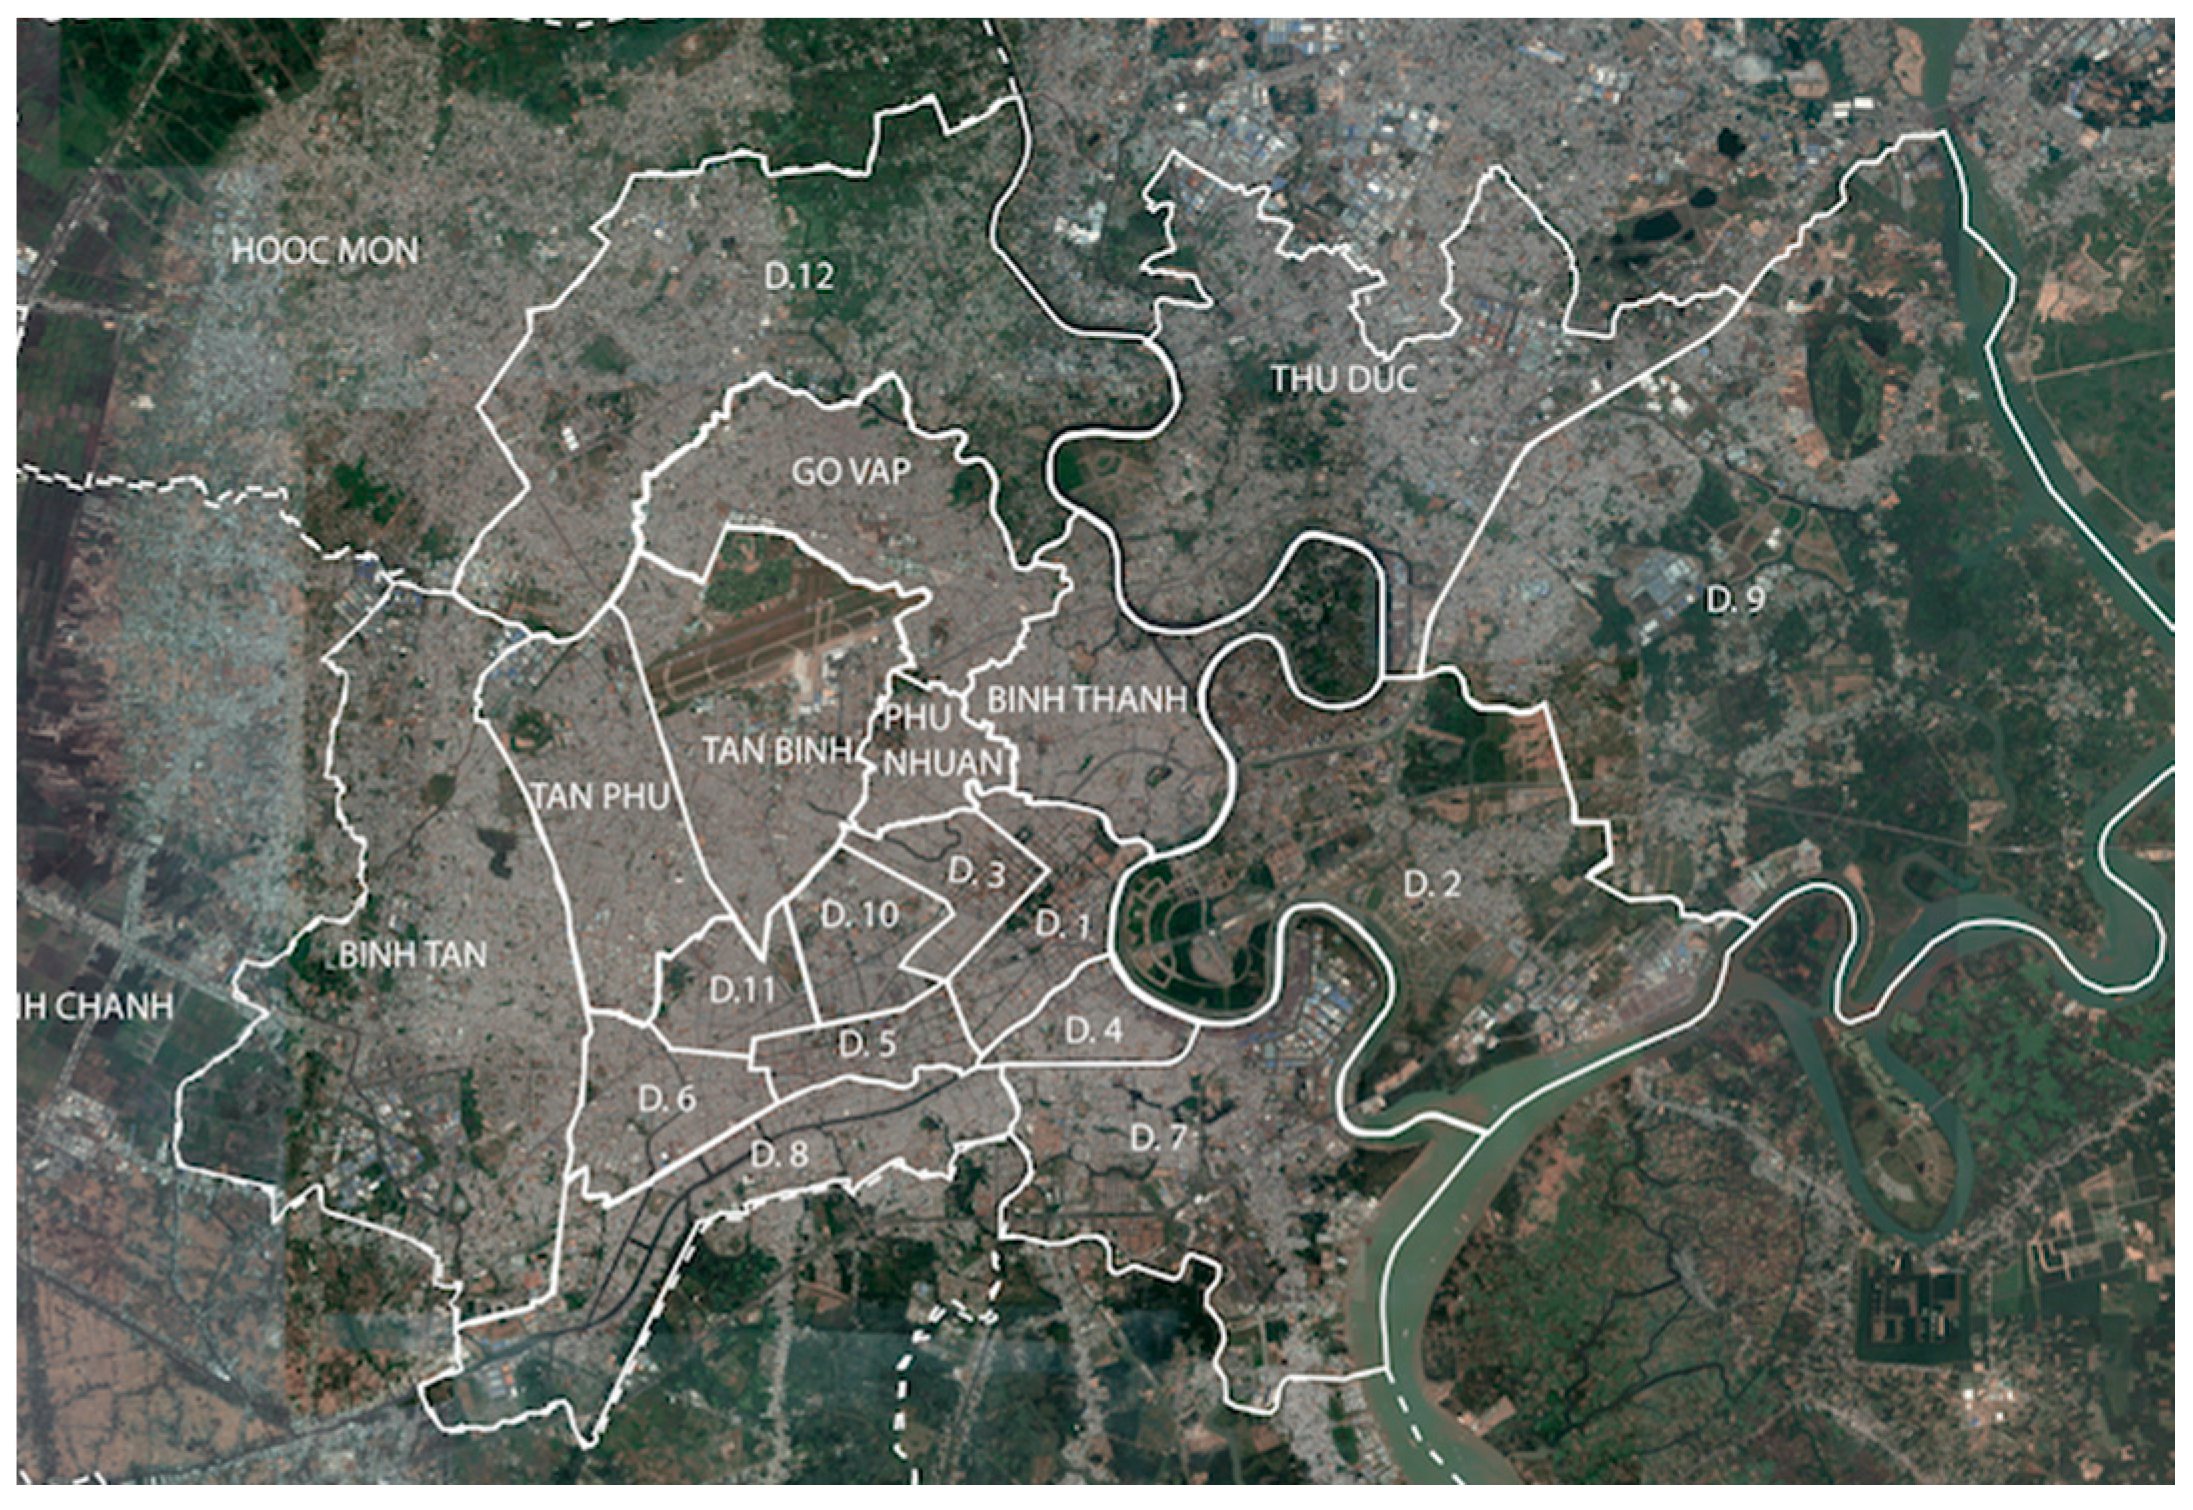
Therefore, this research decided to empirically investigate and analyze housing choice and movement patterns in HCMC using a citizen questionnaire survey (Supplementary Materials). The city officially consists of 24 districts divided into three groups: 13 urban districts, 6 semi-urban districts, and 5 rural districts [3]. As the rural districts with low population density were relatively unaffected by HCMC’s urbanization, they were excluded from this survey. The other districts, however, experienced remarkable changes in their residential environment [33]. The questionnaire survey therefore targeted the 13 urban districts (1, 3, 4, 5, 6, 8, 10, 11, Phu Nhuan, Binh Thanh, Go Vap, Tan Binh, and Tanh Phu) and six semi-urban districts (2, 7, 9, 12, Binh Tan, and Thu Duc) (Figure 5).
To increase accuracy and reflect local realities, a preliminary survey was carried during 11–20 June 2016. We selected two urban districts (District 1 and Phu Nhuan) and two semi-urban districts (District 7 and Go Vap) in terms of diversity of density, income, housing typology, and history. District 1 is a downtown and business district mainly crowded with high-end apartments. Phu Nhuan is a low-rise residential area for the upper-middle-income class while Go Vap is a self-built district for the lower-middle-income class. District 7 includes both old and new towns (Phu My Hung) with a good mixture of various housing types. We interviewed about 20 households (row houses and apartments) from the four districts to get a specific understanding of local citizens’ housing issues and preferences. Various reasons for moving as well as issues relating to the residential environment were identified by the questionnaire. For instance, Mrs. Nugyen (55 years old), a row-house household, noted that “My family lived in the countryside of the Mekong Delta region and moved to Ho Chi Minh to set up a small business twenty years ago. I lived in temporary housing when we settled down in District 12, a suburban district, and moved to a row house to work and live. My family operated a rice noodle shop on the ground floor and lived on the second floor. The row house was optimal for combining business with living for our family. I will choose a row house again for my business even if I move again.” Mr. Hien (45 years old), a government official, had a different story. “I have been working as a civic official for 15 years. I had lived in social housing in a middle-rise apartment. Then I moved to my present high-rise apartment five years ago. Commuting to work was a very important factor when choosing this apartment. I commuted by bicycle for a decade but now do so by motorcycle. The motorcycle trip of over an hour is extremely tiring due to serious air pollution and noise on the road. There is very little public transportation and the number of cars and motorcycles has increased too much every year. I am satisfied with the current apartment because of proximity to my office, a spacious parking lot with a security guard, and public facilities like a community park and swimming pool.” The questionnaire was updated based on this feedback from the preliminary survey.
The questionnaire mainly consists of four parts. The first is about the interviewee’s background and general understanding of urban issues in HCMC. The second indicates housing and neighborhood conditions in their former housing. The third is about current housing and neighborhood. In the last part, respondents were asked about housing type preferences in the future if they could afford any housing type (Table 2). By investigating past, present, and future housing in the survey, we expected to find movement patterns and the reasons for them.
Housing types in this survey were categorized into squatter, row house, villa, and apartment. The official Census of Vietnam categorizes the typology into permanent, semi-permanent, and temporary housing based on housing quality and materials [26]. However, this imposes limitations in understanding diverse urban housing stocks. The UN Habitat categorizes Vietnamese urban housing as shop house, apartment, villa, alley house, and precarious squatter housing in accordance with a functional classification [3]. However, the shop house and alley house are structurally similar in terms of narrow and long plot size, nearly 100% plot coverage, and an average of three or four floors. Both properties also typically belong to the single-family ownership category. The only main difference is whether the ground floor is used for commercial or residential purposes. World Bank research gives five categories of housing typology: temporary shelters, old townhouse, new townhouse, apartment, and villa [33]. The old and new townhouses can be recognized as being the same as the shop house and alley house of the UN Habitat’s categories in terms of architectural form. Thus, this study combined those types into the row house (also commonly called “nhà ống” in Vietnamese or “tube house” in English) category. Therefore, in this survey, residential housing was classified into four types: squatter, row house, villa, and apartment.
The questionnaire survey was performed from 1 September to 30 November 2016 in HCMC. The interviewees were selected in popular public places such as streets, squares, parks, and commercial locations in the target 19 districts (13 urban and 6 semi-urban districts). Then personal interviews were conducted. A total of 200 responses were collected evenly across the districts but, following a review of data quality and missing response elements, 194 samples were finally selected. Table 3 shows the detailed information about the survey data collection.
4. Results
4.1. General Results
The majority (82%) of interviewees were 20–49 years old and a large percentage (71.5%) had jobs in the private sector, such as owning their own business, the service industry, and technical fields. The largest single income group (37.8%) earned 10–20 million Dong per month (USD 475–952) and a large percentage (60.8%) of respondents had lived in their current housing for less than 10 years, 12.9% for 10–20 years, and 7.7% for 20–30 years. The survey clearly indicates that residents moved to current housing that is well equipped with utilities and infrastructure. It also shows that overall housing satisfaction improved from 38% to 73% after moving to their current dwellings and neighborhood satisfaction levels also improved from 42% to 58%. The average number of rooms per unit changed from 2.31 in the past to 2.94 in the present and 3.64 for future homes. Respondents considered HCMC’s most serious urban problems to be transportation and road problems (31%), air pollution (26%), water pollution (22%), infrastructure shortages (12%), and housing shortages (8%). They also selected the best solutions for the transportation problems as improvement of public transportation (47%), improvement of road conditions (32%), strengthening regulations to control increases in the numbers of registered vehicles (6%), and decentralizing through building satellite cities (14%).
In the housing choice section, the predominant housing type is a row house, showing as 68% and 69% of the past and present residential types, respectively. This shows an association with housing development history in Vietnam. In the case of villas, these are a very strong preference for the future, though the percentages formerly and currently occupying villas are very low. Single family housing, such as row houses and villas, would account for 79% in the future based on respondents’ expressed ideal preferences. In the case of apartments, while the low-rise apartment share has declined (with 26%, 13%, and 1% of the past, the present, and future preferences, respectively), that of high-rise apartments has increased (5%, 13%, and 19%, respectively) (Table 4).
4.2. Independent Tests and Results
As the questionnaire survey mostly includes nominal and categorical variables, the chi-square test of independence was mainly performed to find significant associations between current housing type and other factors pertaining to residents. The expected frequency count for each cell in the table should be at least five, and a maximum of 20% should be below this on the cross tables for the test to be valid. As the current categorization of housing into four types (squatter/row house/villa/apartment) was not able to meet the condition, the housing types were simply grouped using two different methods for statistical validity. The first divided them into single-family housing (SFH: squatter/row house/villa) and multi-family housing (MFH: apartment) in that an individual residence environment is highly preferred in Vietnam. The second divided them into only row houses and other types since the former has dominated housing development history and this tendency is still observed today in Vietnam.
Table 5 shows several factors indicating statistically significant associations with current housing types of the two groups (SFH-MFH and Row House-Others): monthly income, ownership, former housing types, preferred future housing types, inconveniences associated with current housing, and reasons for moving. The results show that the higher income group is more likely to choose the SFH than the lower income group, X2 (2, N = 192) = 10.228, p < 0.01. Housing owners are closely associated with single-family housing ownership while the tenant group are associated with apartments, X2 (1, N = 193) = 20.363, p < 0.01. Other factors show the interrelationship between housing choice and movement. Those formerly living in SFHs are more likely to move to the same housing type as opposed to the MFH residents, X2 (1, N = 193) = 6.264, p < 0.05, and this pattern also shows in future preferences X2 (1, N = 190) = 6.107, p < 0.05. In the case of the row house type, the pattern also appears more significantly in preferred migration from present to future, X2 (1, N = 191) = 5.348, p < 0.05, rather than past to present, X2 (1, N = 193) = 3.552, p < 0.10. This demonstrates that the SFH offering multi-story floors and single-family occupancy is still dominantly preferred in housing choice rather than the MFH of apartments (Table 5).
The questionnaire and interviews revealed a relationship between reasons for moving and current housing choice. According to the Fisher’s Exact Test of Table 6, a close association between current housing types and reasons for moving to the current houses was observed, X2 (9, N = 179) = 20.972, p < 0.01. The movement from former SFHs to current MFHs is closely associated with the commuting conditions, meaning organized road networks and transportation accessibility to workplaces. Interestingly, Table 5 also supports that, indicating the association between current housing type and inconveniences associated with the housing, X2 (6, N = 189) = 14.491, p < 0.05. The main difficulties for row housing residents are associated with transportation issues, such as overly narrow roads, an inadequate road environment, and poor accessibility to main roads. The housing structure, meaning typological attributes, is a main reason for the movement from former SFHs to current SFHs. This housing type can normally offer multi-story spaces with mixed use and independent property ownership with land-use right in Vietnam. The safety and security issues are associated with the movement within MFHs. In general, apartments can provide better security systems and safer inner road environments with parking spaces than SFHs. The affordability is mainly observed in the movement from former SFHs to current SFHs. The main affordable housing is the self-built row houses which predominate in HCMC’s housing stock [22].
Table 7 shows an association between future housing choice and movement patterns. High-income groups prefer moving from SFHs to SFHs, middle-income groups from SFHs to MFHs, and low-income groups from MFHs to SFHs.
5. Findings
5.1. The Advantages and Disadvantages of Row Houses
The survey results clearly indicate that Vietnam has a high demand for single-family housing, particularly row houses, which predominate in HCMC’s housing stock [34]. The typology of row house has traditionally been dominant in the urban fabric in Vietnam. While it has evolved with urban growth in terms of plot size, façade, spatial structure, and building materials, it was highlighted for its spatial, environmental, and social advantages. The spatial composition enabled eco-sufficient features with natural lighting and ventilation serving as energy-saving factors. It also supported expandable spatial features for the residents’ needs. The spatial flexibility enabled not only residential space expansion for family size change, but also a mixed use for living and working. In addition, the human-scaled façade and its close integration with streets created active community connection and social interaction [34].
The trend toward row house choice was also clearly observed in the structural features of the housing that emerged in this survey. The archetypal modern row house is extremely efficient for a mixture of residential and commercial services. In spite of very limited street frontage, with a typical plot of 4 m by 20 m, the building fully covers the plot in many cases, and the ground floor is a flexible frontage for homeowners’ micro-businesses, such as a shop, small restaurant, café, or retail unit. Some owners even use or lease the second floor for mixed use and earn extra income [34,35,36]. In addition, the typology features spatial flexibility and environmental adaptability in that most rooms can be adjusted or expanded for various purposes and the buffer space between indoors and outdoors can function as protection from direct sunlight and high precipitation [36]. For these reasons, the ground-bound housing type is commonly found in entire cities, from downtown to low-income areas, and along narrow and minor streets. This residential structure is the most attractive for Vietnamese people and has the highest demand in movement and housing choices [27,35].
On the other hand, different responses for the row houses were observed in the survey. Road and commuting environments were critical drawbacks of the row house residences. The survey respondents largely highlighted uncomfortable transportation and road conditions and the commuting environment as the main reasons that current apartment residents who had previously lived in a row house had moved. As a number of neighborhoods in HCMC have organically developed with self-built housing, inner roads within these communities were spontaneously generated with an average width of 1.5 m. In the period from 2001 to 2005, for example, the amount of self-built row housing units accounted for 84.8% of total housing constructed in HCMC, while industrialized housing production accounted for only 15.2% [37]. Only two-wheeled vehicles can reach the inner houses of these districts since the builders tried to maximize land utilization by illegally expanding the floor area [38,39]. This requires pedestrians and two-wheeled vehicles to share the roads, leaving adults and especially children vulnerable to traffic accidents [3]. That condition shows that the current Vietnamese urbanization and housing environment would not be sustainable.
5.2. Increasing Popularity of Apartments
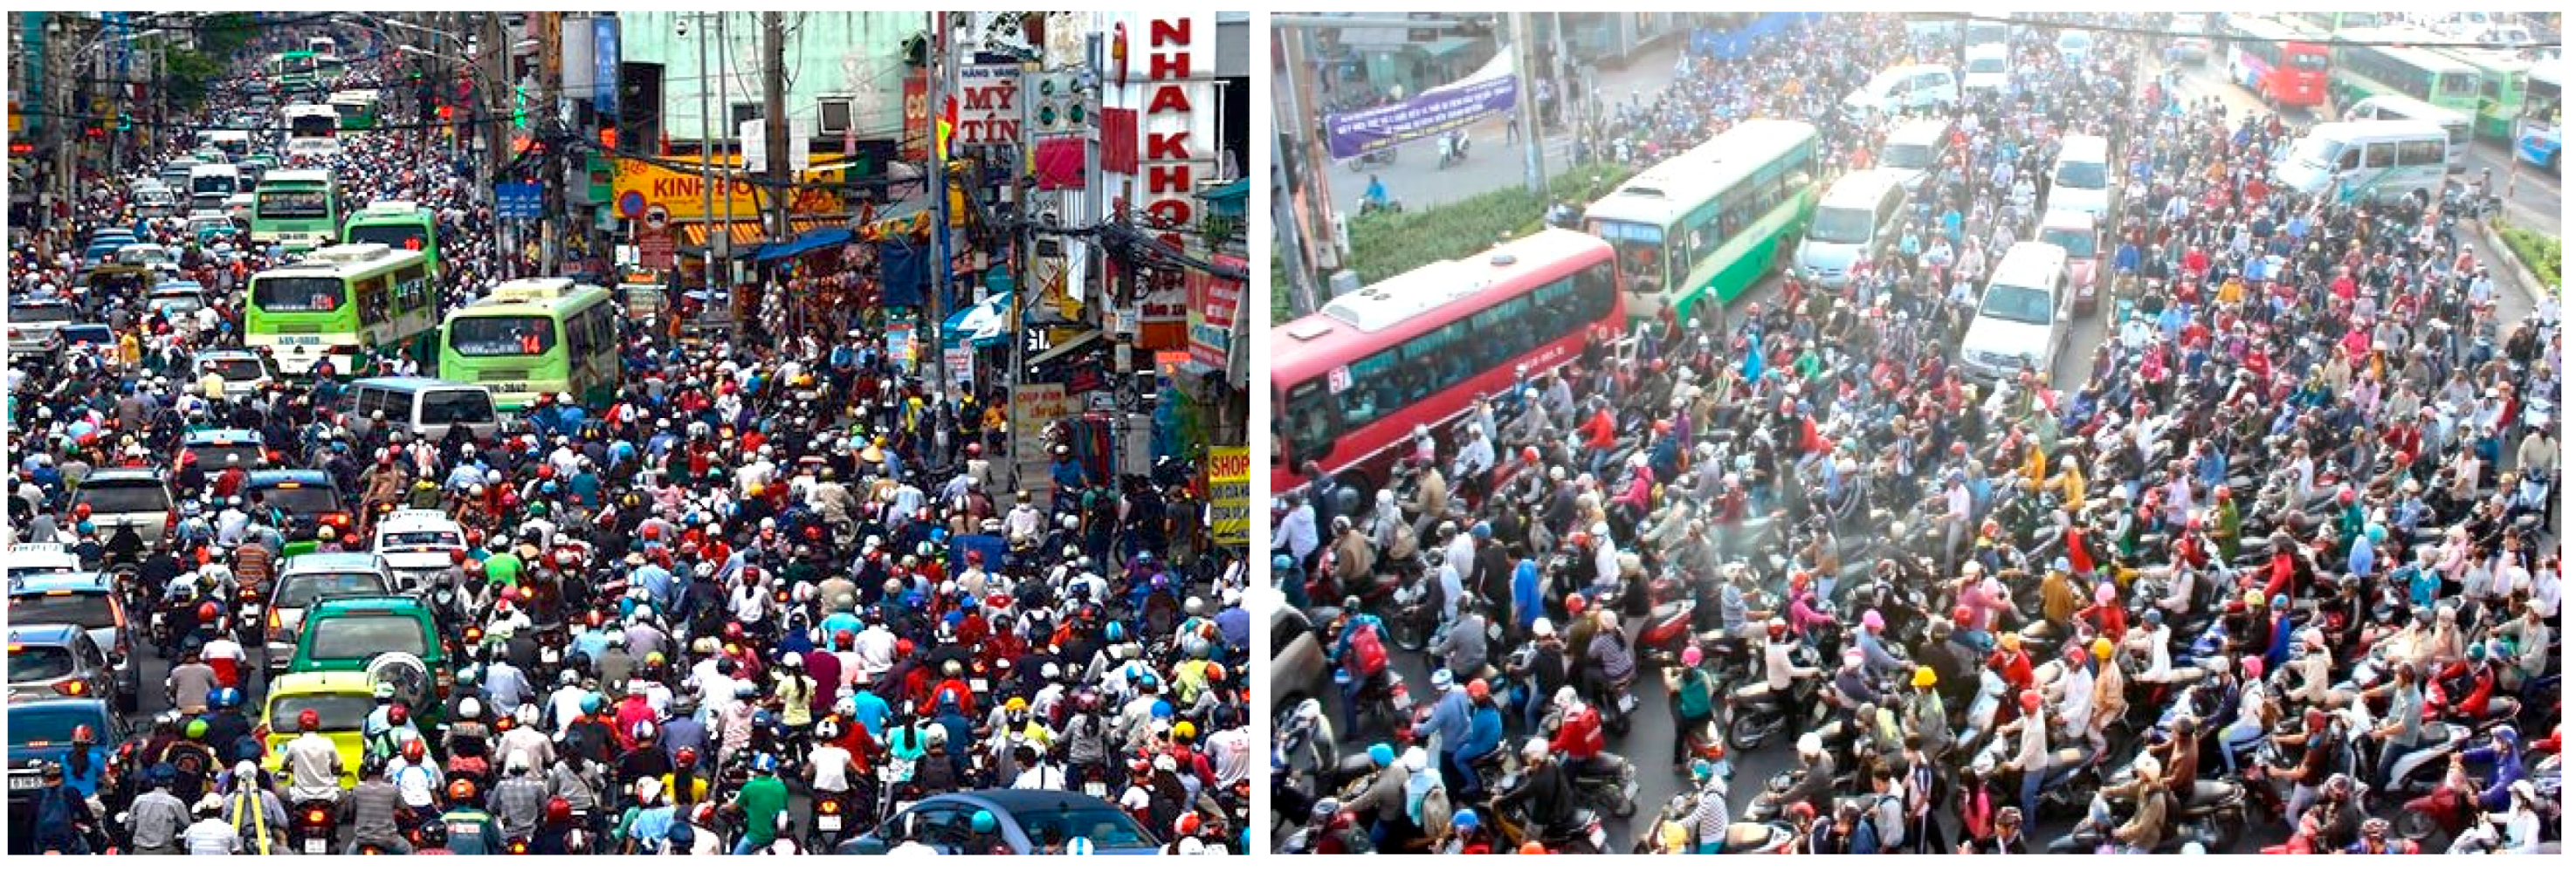
With rising family incomes and socioeconomic mobility, the increasing number of vehicles is worsening the commuting environment every year [40]. The total count of motorbikes at 8.5 million thus exceeds the official population of Ho Chi Minh City of 8.2 million [41] and motorbikes account for approximately 90% of trips in the city [42] and commuters using motorbikes battle daily against heavy traffic jams and declining air quality (Figure 6). In addition, car ownership has increased by 320% between 2005 and 2014 at an annual growth rate of 10% [43]. This creates a higher risk of heavy traffic congestion and overburdening the city’s road capacity.
In this context, apartments are highly regarded as an adaptation to such changes while predominantly self-built districts of row houses have suffered from severe urban densification and poor accessibility for four-wheeled vehicles. A number of high-rise apartments built with foreign investment offer not only more spacious housing units and open spaces, but also managed parking lots for two-wheeled and four-wheeled vehicles and excellent accessibility to main roads [44]. For instance, the Phu My Hung new town construction in District 7 has led a boom in apartment development in HCMC since 1998. With the construction of the 10-lane Nguyen Van Linh Parkway, the town has produced a series of apartment complexes. They are highly valued real estate today and still attracting the attention of customers as a more comfortable living environment. The key elements for apartment selection are the low-density living environment, better accessibility to downtown, and mixed public facilities, including spacious parking, which are not found in the self-built districts of row houses [44,45,46]. The results of this survey also clearly show a significant association between commuting conditions and housing choices of current apartments, particularly among those previously resident in row houses. Overall survey data also indicate the popularity of high-rise apartments as can be seen in the increase of this type of housing from 5% of past residences to 13% of present and the expressed preference of 19% of interviewees for the future (Table 4).
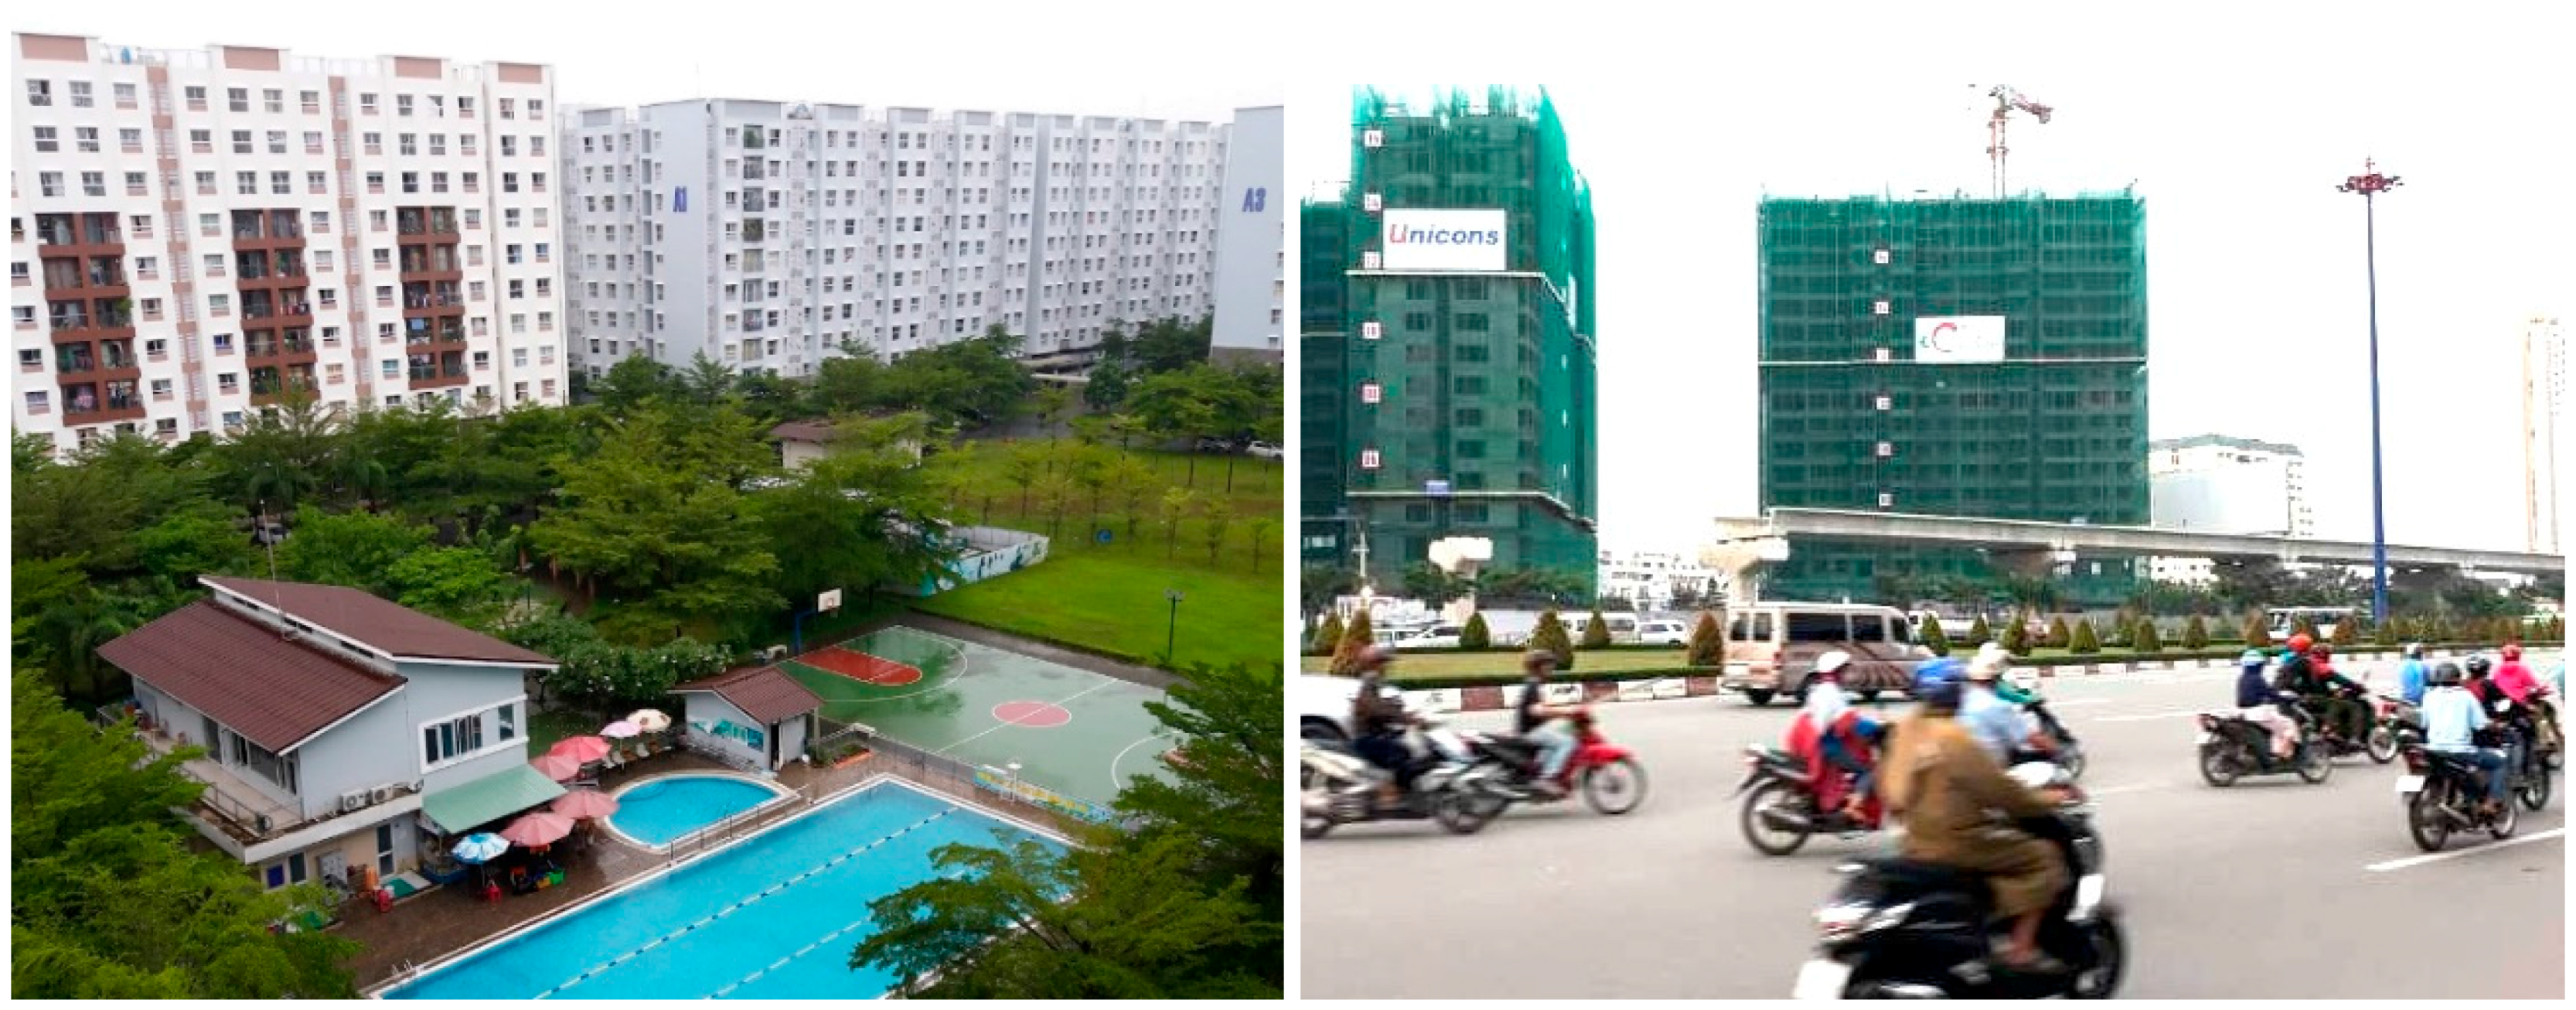
The other interesting point is the movement pattern of the current middle-income class. Those of this group currently living in row houses show a strong preference to move to apartments in the future in this survey (Table 7). Vietnam is one of the countries experiencing a rapid increase in its middle class, with the fastest growth rate in Asia. One report indicates that almost two million people join the middle class every year [48]. The trends and popularity of affordable apartment segments for the middle class can be found in various market analysis reports. They note that demand for affordable apartments is forecasted to increase by a factor of 5.5, from 23,838 units per annum in 2013 to 130,962 units per annum in 2020. [49]. It underlines the fact that more apartment projects can deliver sustainable urban development with housing solutions to meet the skyrocketing demand for decent affordable housing in Vietnam’s cities in terms of quality and quantity (Figure 7).
6. Discussion and Conclusions
Housing choice and movement issues in HCMC have become intertwined with HCMC’s rapid urbanization and housing market growth. Since the economic reforms, social and economic changes have led to huge in-migration levels and exacerbated housing shortages, leading to the system for the supply of housing being taken over by the private sector. The government has revised the land use laws, not only for the purpose of privatizing residential land but also to encourage self-built housing through investment by individual households. This development pattern has predominated for the last few decades in HCMC. The self-built row houses have largely covered the city, with organic district expansion and urban densification. This empirical study shows the popularity of the row houses due to the environmental adaptability and spatial flexibility of the mixed-use building, which shows its cultural and social sustainability in Vietnam’s innate housing context. However, road conditions and commuting environments in the predominantly self-built districts of HCMC were major drawbacks due to narrow inner roads and limited accessibility by cars and public transportation. On the other hand, FDI inflows have produced numerous launches of new apartment projects with a surge in the upper middle-income class. This housing type attracts residents because of great accessibility to main roads, spacious parking spaces, and decent housing quality. It is also considered for economically sustainable housing supply policies aimed at delivering numerous affordable housing units accessible to the lower middle-income class in the dense and compact environment of HCMC.
This housing study has implications for public policies aiming at sustainable housing development in Vietnam. As the new 2015 Housing Law provides the framework to support affordable housing segments (with a focus on the housing shortage and the necessity of creating affordable decent housing for the lower-middle class), support for self-built housing, and encouragement of private sector involvement. The government can consolidate their efforts in the affordable housing sector in the following ways.
First, the government should establish national affordable housing initiatives to effectively manage and control incremental informal self-built housing development. Although the row house is regarded as a sustainable housing model for Vietnam from an environmental and socio-economic point of view [34,35,36,50], the predominant informal self-building trend has had a negative impact on the urban environment with unsustainable densification patterns. Therefore, this development should be well managed and regulated, given that this type of house is a popular choice and in high demand by many Vietnamese. The initiatives can strengthen regulation of row house development and precisely target areas and groups of lower-income households for special assistance who are unable to undertake self-provided solutions. The initiatives can also develop viable strategies for basic infrastructure provision to secure public health and transportation accessibility. In addition, they should enhance accessibility to microfinance and technical assistance for poor households from a formal construction start to incremental self-built housing improvement for their homes. Then, the self-built housing environment can become sustainable in well-serviced and connected neighborhoods.
Second, the government should strategically expand “site and services” projects to meet the increasing demand for row houses by the use of public–private partnerships (PPPs). These develop new serviced lands in suitable locations in cities and provide them in sub-divided plots at lower market rates for affordable housing. Based on the delivery of infrastructure and roads, the landowners can create self-built housing through their own investment with the government’s legal support. This means that the uncontrolled informal formation of self-built districts and its negative externalities such as public health and traffic issues due to lack of infrastructure and inner roads can be avoided. In addition, it can create a framework of public participation since the “site and services” approach can also be used for various purposes such as neighborhood redevelopment with resettlement, land sharing, and in-situ expansion. In this case, the government and stakeholders can support inclusive planning enabling open discussion and participatory neighborhood design with the people who will finally settle in the area. Furthermore, “site and services” projects can be combined with affordable apartment development within PPPs, thereby making the national housing supply more economically and socially sustainable. The apartment is the housing type on which private developers have mostly focused for the upper-middle class for the last several decades in Vietnam, in response to increasing popularity and it being an efficient investment model where land is limited. The government should strengthen the PPPs for affordable apartment development as well. More incentives will be required, such as development right incentives, Land Use Right Fee (LURF) exemptions, and preferential mortgage programs [22], to motivate the private developers in the affordable apartment sector, while diminishing vulnerability to investment and the variability of the real estate market.
Last, Vietnamese housing development should be integrated with urban development strategies, particularly land use planning, and accompanied by major infrastructure and public transportation development. As this study shows a meaningful association between housing choice and commuting environments, the government should ensure that appropriate land for formal and affordable housing developments is allocated to secure connectivity to basic infrastructure and accessibility to public transportation and urban roads. In the case of in-situ resettlement housing development, which avoids evicting low-income residents to the outskirts, the development should also be prioritized to combine with road-widening plans and transport development. This will minimize negative externalities, such as traffic congestion, pollution, and social segregation. Furthermore, the networked-compact city along with the multi-nuclear model would be necessary to prevent urban sprawl in the sustainable housing development process. It will provide better directions for the style and location of new housing developments as well as site upgrading. These kinds of housing development approaches will help make urban growth in Vietnam more socially, economically, and environmentally sustainable. Therefore, understanding and approaching housing development as part of an inclusive framework is vital for sustainable growth in Vietnam.
Supplementary Materials
The following are available online at www.mdpi.com/2071-1050/9/10/1738/s1.
Acknowledgments
This research was supported by the Basic Science Research Program through the National Research Foundation of Korea (NRF) funded by the Ministry of Education (2016R1D1A1A02937316). It was also supported by the Creative-Pioneering Researchers Program through Seoul National University (SNU), the SNU Big Data Institute through the Data Science Research Project 2017, and the Institute of Construction and Environmental Engineering at SNU. This research was previously presented at the Sustainable Asia Conference on 23–25 June 2017, Nanjing, China. The authors wish to express gratitude for their support.
Author Contributions
Ducksu Seo conceived, designed, analyzed, and wrote this paper. Youngsang Kwon advised on this research from concept to writing. Both authors have read and approved the final manuscript.
Conflicts of Interest
The authors declare there are no conflicts of interest.
References
- Beresford, M. Doi moi in review: The challenges of building market socialism in Vietnam. J. Contemp. Asia 2008, 38, 221–243. [Google Scholar] [CrossRef]
- McGee, T.G. Interrogating the production of urban space in China and Vietnam under market socialism. Asia Pac. Viewp. 2009, 50, 228–246. [Google Scholar] [CrossRef]
- UN-Habitat. Vietnam Housing Sector Profile; UN-Habitat: Nairobi, Kenya, 2014; p. 158. [Google Scholar]
- Vietnam_Property. Vietnam Real Estate Attracts a Large Amount of Foreign Direct Investment. Available online: https://www.vietpropertynews.com/2017/07/03/vietnam-real-estate-investment/ (accessed on 23 June 2017).
- General Statistics Office of Vietnam. Investment (Foreign Direct Investment). Available online: http://www.gso.gov.vn/default_en.aspx?tabid=776 (accessed on 20 June 2017).
- Priemus, H. Nederlandse Woontheorieën; Volkshuisvesting in Theorie en Praktijk; Delftse Universitaire Pers: Delft, Germany, 1984. [Google Scholar]
- Gibler, K.; Nelson, S. Consumer behavior applications to real estate education. J. Real Estate Pract. Educ. 2003, 6, 63–83. [Google Scholar]
- Hooimeijer, P. Hoe meet je woonwensen? Methodologische haken en ogen. In Bewonerspreferenties: Richtsnoer Voor Investeringen in Nieuwbouw en de Woningvoorraad; Delftse Universitaire Pers: Delft, Germany, 1994; pp. 3–12. [Google Scholar]
- Jansen, S.J.; Coolen, H.C.; Goetgeluk, R.W. The Measurement and Analysis of Housing Preference and Choice; Springer: Berlin, Germany, 2011. [Google Scholar]
- Rossi, P.H. Why Families Move: A Study in the Social Psychology of Urban Residential Mobility; Free Press: Glencoe, IL, USA, 1955. [Google Scholar]
- Clark, W.A.; Deurloo, M.C.; Dieleman, F.M. Housing careers in the United States, 1968–93: Modelling the sequencing of housing states. Urban Stud. 2003, 40, 143–160. [Google Scholar] [CrossRef]
- Mulder, C.H. Migration Dynamics: A Life Course Approach; PDOD: Amsterdam, The Netherlands, 1993. [Google Scholar]
- Goetgeluk, R.W.; Hooimeijer, P.; Dieleman, F.M. The Effectiveness of Housing Search: The Role of Motives for Moving and Housing Market Adjustment. In Proceedings of the Conference European Cities: Growth or Decline, The Hague, The Netherlands, 13–16 April 1992; pp. 13–16. [Google Scholar]
- Mulder, C.H.; Hooimeijer, P. Moving into owner-occupation: Compositional and contextual effects on the propensity to become a homeowner. J. Hous. Built Environ. 1995, 10, 5–25. [Google Scholar] [CrossRef]
- De Jong, G.F.; Fawcett, J.T. Motivations for Migration: An Assessment and A Value-Expectancy Research Model; Pergamon: New York, USA, 1981. [Google Scholar]
- De Jong, G.F.; Abad, R.G.; Arnold, F.; Carino, B.V.; Fawcett, J.T.; Gardner, R.W. International and internal migration decision making: A value-expectancy based analytical framework of intentions to move from a rural Philippine province. Int. Migr. Rev. 1983, 17, 470–484. [Google Scholar] [CrossRef] [PubMed]
- De Jong, G.F.; Root, B.D.; Gardner, R.W.; Fawcett, J.T.; Abad, R.G. Migration intentions and behavior: Decision making in a rural Philippine province. Popul. Environ. 1985, 8, 41–62. [Google Scholar] [CrossRef]
- Newell, A.; Simon, H.A. Human Problem Solving; Prentice-Hall: Englewood Cliffs, NJ, USA, 1972; Volume 104. [Google Scholar]
- Simon, H.A.; Dantzig, G.B.; Hogarth, R.; Plott, C.R.; Raiffa, H.; Schelling, T.C.; Shepsle, K.A.; Thaler, R.; Tversky, A.; Winter, S. Decision making and problem solving. Interfaces 1987, 17, 11–31. [Google Scholar] [CrossRef]
- Holland, J.H. Induction: Processes of Inference, Learning, and Discovery; MIT Press: Cambridge, MA, USA, 1989. [Google Scholar]
- Bettman, J.R.; Luce, M.F.; Payne, J.W. Constructive consumer choice processes. J. Consum. Res. 1998, 25, 187–217. [Google Scholar] [CrossRef]
- World Bank Group. Vietnam Affordable Housing: A Way Forward; World Bank Group: Washington, DC, USA, 2015; p. 117. [Google Scholar]
- Nguyen, T.B.; Samsura, D.A.A.; van der Krabben, E.; Le, A.-D. Saigon-Ho Chi Minh City. Cities 2016, 50, 16–27. [Google Scholar] [CrossRef]
- Nguyen, A.N.; Nguyen, T. Foreign Direct Investment in Vietnam: An Overview and Analysis the Determinants of Spatial Distribution Across Provinces; Social Science Electronic Publishing: Rochester, NY, USA, 2007. [Google Scholar]
- Waibel, M.; Eckert, R.; Bose, M.; Volker, M. Housing for low income groups in Ho Chi Minh City, between re-integration and fragmentation. Asien 2007, 103, 59. [Google Scholar]
- General Statistics Office of Vietnam. The 2009 Vietnam Population and Housing Census: Major Findings; General Statistics Office of Vietnam: Hanoi, Vietnam, 2010.
- Vinh, N.Q.; Leaf, M. City life in the village of ghosts: A case study of popular housing in Ho Chi Minh City, Vietnam. Habitat Int. 1996, 20, 175–190. [Google Scholar] [CrossRef]
- General Statistics Office of Vietnam. The Viet Nam Household Living Standards Survey 2012. Available online: http://www.gso.gov.vn/default_en.aspx?tabid=483&idmid=4&ItemID=13888 (accessed on 28 June 2017).
- Ha, H.; Wong, T.-C. Economic reforms and the new master plan of Ho Chi Minh City, Vietnam: Implementation issues and policy recommendations. GeoJournal 1999, 49, 301–309. [Google Scholar] [CrossRef]
- Kim, A.M. A market without the ‘right’property rights. Econ. Transit. 2004, 12, 275–305. [Google Scholar] [CrossRef]
- Phe, H.H. Investment in residential property: Taxonomy of home improvers in central Hanoi. Habitat Int. 2002, 26, 471–486. [Google Scholar] [CrossRef]
- Savills. The Amended Housing Law. 2015. Available online: http://pdf.savills.asia/asia-pacific-research/vietnam-research/hcmc/housing-law-2015-en.pdf (accessed on 25 August 2017).
- Cira, D. Vietnam Urbanization Review Technical Assistance Report; World Bank: Washington, DC, USA, 2011; pp. 17–177. [Google Scholar]
- Kien, T. “tube house” and “neo tube house” in Hanoi: A comparative study on identity and typology. J. Asian Archit. Build. Eng. 2008, 7, 255–262. [Google Scholar] [CrossRef]
- Won, S.; Cho, S.E.; Kim, S. The neighborhood effects of new road infrastructure: Transformation of urban settlements and resident’s socioeconomic characteristics in Danang, Vietnam. Habitat Int. 2015, 50, 169–179. [Google Scholar] [CrossRef]
- Park, J.-H.; Cho, M. Lessons from Vietnamese urban street houses for contemporary high-rise housing. Open House Int. 2013, 38, 31–46. [Google Scholar]
- Zhu, J. Development of sustainable urban forms for high-density low-income Asian countries: The case of Vietnam: The institutional hindrance of the commons and anticommons. Cities 2012, 29, 77–87. [Google Scholar] [CrossRef]
- Yip, N.-M.; Tran, H.-A. Urban housing reform and state capacity in Vietnam. Pac. Rev. 2008, 21, 189–210. [Google Scholar] [CrossRef]
- Hansen, A. Driving development? The problems and promises of the car in Vietnam. J. Contemp. Asia 2016, 46, 551–569. [Google Scholar] [CrossRef]
- Truitt, A. On the back of a motorbike: Middle-class mobility in Ho Chi Minh City, Vietnam. Am. Ethnol. 2008, 35, 3–19. [Google Scholar] [CrossRef]
- Thanh-Nien-News. Ho Chi Minh City Now Has 7.4 Million Motorbikes, and Counting. Available online: http://www.thanhniennews.com/society/ho-chi-minh-city-now-has-74-million-motorbikes-and-counting-57787.html (accessed on 22 July 2017).
- Van, T.H.; Schmoecker, J.-D.; Fujii, S. Upgrading from Motorbikes to Cars: Simulation of Current and Future Traffic Conditions in Ho Chi Minh City. In Proceedings of the 8th International Conference of Eastern Asia Society for Transportation Studies, Surabaya, Indonesia, 16–19 November 2009; Volume 8, p. 335. [Google Scholar]
- OICA. Oica 2005–2014 Sales Statistics. World Motor Vehicle Sales. Available online: http://www.oica.net/wp-content/uploads//total-sales-2014.pdf (accessed on 1 August 2017).
- Chung, Y.S.; Kim, J.H.; Cho, J.H. Analysis of price determinants of apartments in Ho Chi Minh. J. Korean Hous. Assoc. 2014, 12, 13–21. [Google Scholar]
- Jung, S.; Huynh, D.; Rowe, P.G. The pattern of foreign property investment in Vietnam: The apartment market in Ho Chi Minh City. Habitat Int. 2013, 39, 105–113. [Google Scholar] [CrossRef] [Green Version]
- Huynh, D. Phu my hung new urban development in Ho Chi Minh City: Only a partial success of a broader landscape. Int. J. Sustain. Built Environ. 2015, 4, 125–135. [Google Scholar] [CrossRef]
- Thanh-Nien-News. Shocking Photos Reveal How Saigon Traffic Has Gone from Bad to Worse. Available online: http://www.thanhniennews.com/society/shocking-photos-reveal-how-saigon-traffic-has-gone-from-bad-to-worse-51386.html (accessed on 26 May 2017).
- Bang, L. Middle-Class Vietnamese: Who Are They? Available online: http://english.vietnamnet.vn/fms/business/160959/middle-class-vietnamese--who-are-they-.html (accessed on 12 August 2017).
- CBRE. Vietnam Real Estate Market Insights 2016. Available online: http://www.cbrevietnam.com/ (accessed on 28 August 2017).
- Kim, J. A Study on Formation and Transformation of Tubehouse in Hanoi, Vietnam; Seoul National University: Seoul, Korea, 2007. [Google Scholar]
Figure 1.
FDI Inflows into Vietnam (left); and Accumulated FDI Inflows by Sector (right) (Source: General Statistics Office of Vietnam [5]).
Figure 1.
FDI Inflows into Vietnam (left); and Accumulated FDI Inflows by Sector (right) (Source: General Statistics Office of Vietnam [5]).

Figure 2.
Housing Stock by Building Quality in Vietnam and HCMC (Source: General Statistics Office of Vietnam: Vietnam Living Standard Survey 2012 [28]).
Figure 2.
Housing Stock by Building Quality in Vietnam and HCMC (Source: General Statistics Office of Vietnam: Vietnam Living Standard Survey 2012 [28]).
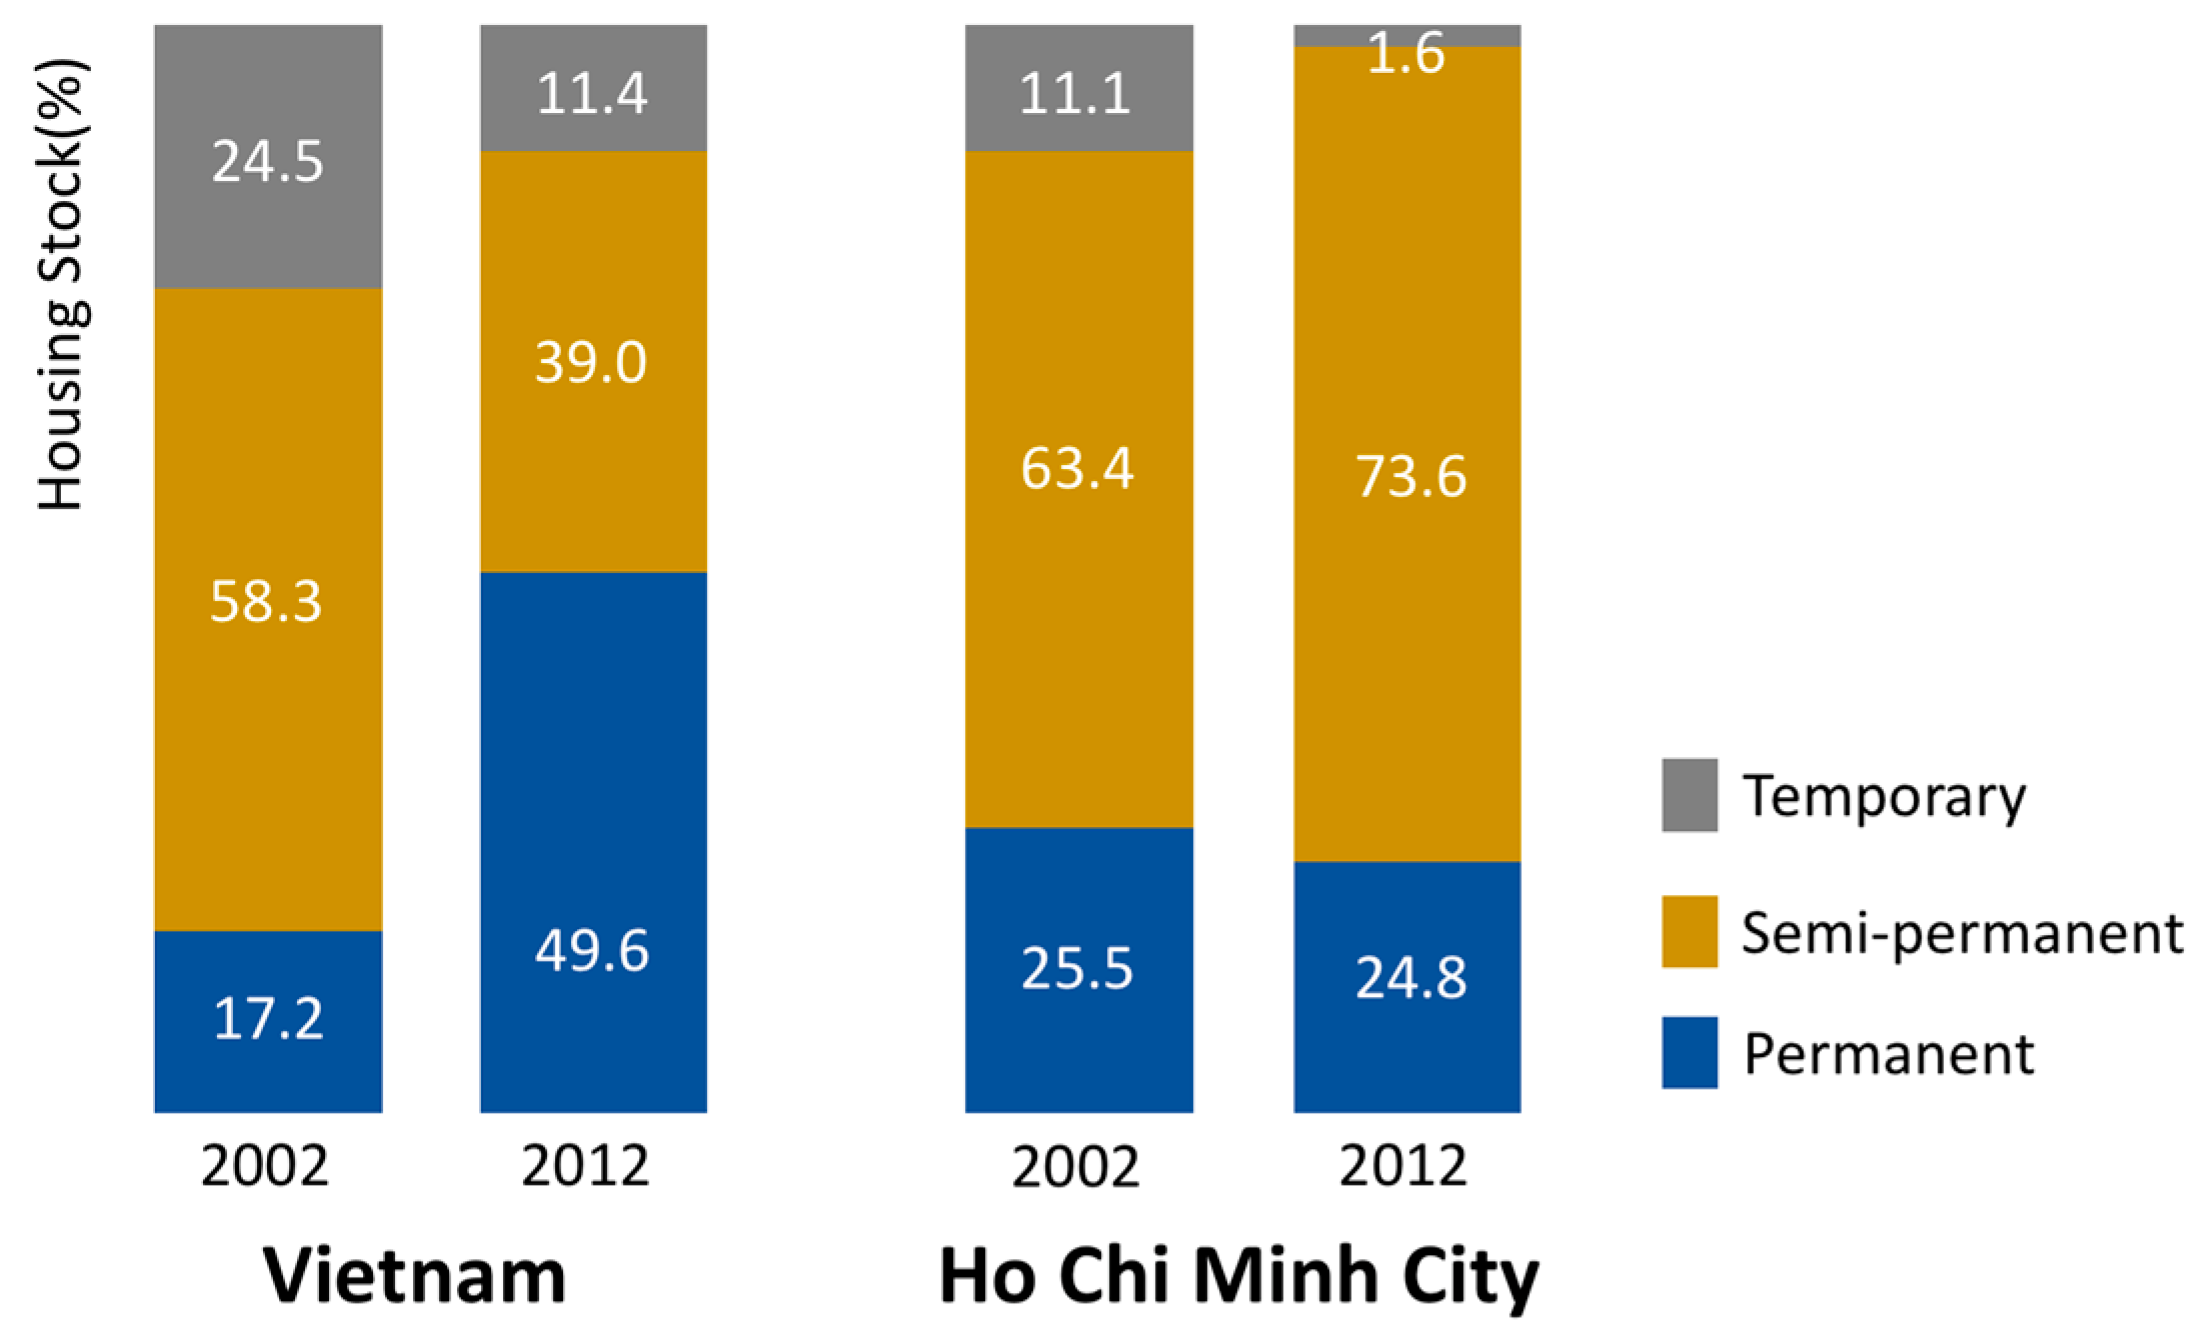
Figure 3.
Self-built Housing Distribution in HCMC (Source: mapping by the author based on satellite photo analysis and site observation).
Figure 3.
Self-built Housing Distribution in HCMC (Source: mapping by the author based on satellite photo analysis and site observation).

Figure 4.
Pervasive Self-built Housing (Row Houses) Areas in HCMC (Source: Google Maps).
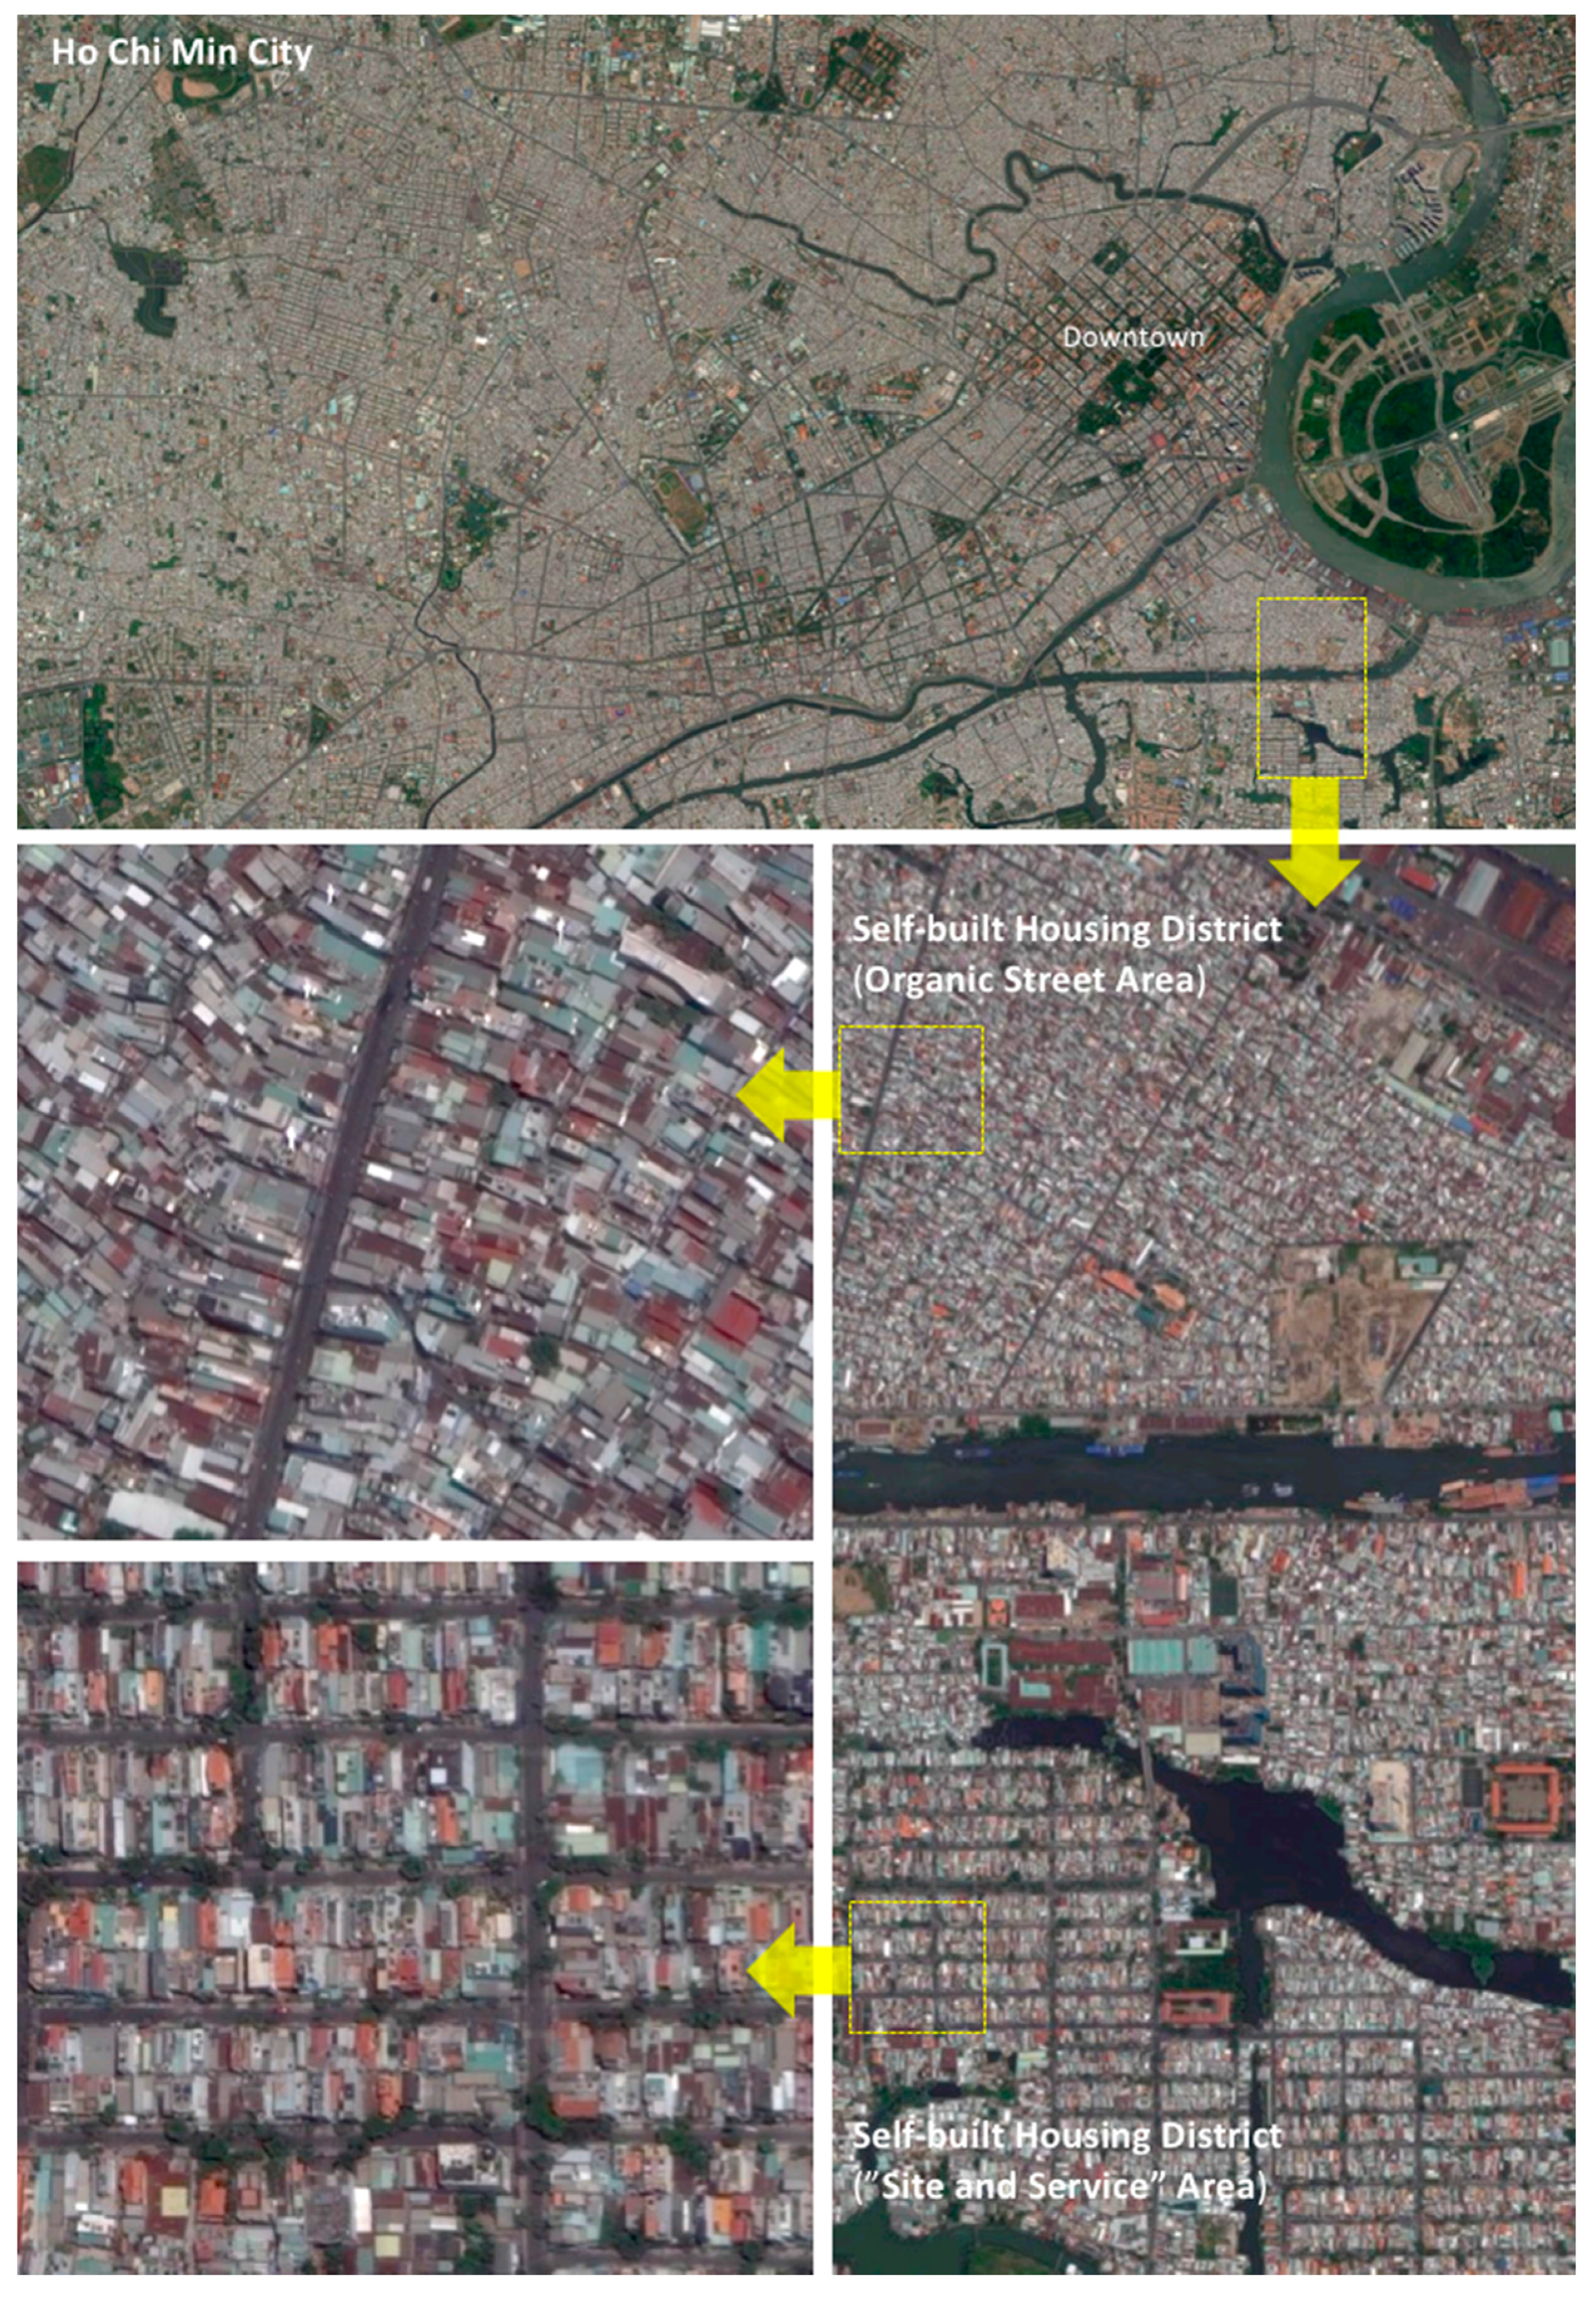
Figure 5.
Survey Districts in HCMC: Urban and Semi-Urban Districts Indicated by Solid-Lined Boundaries (Source: Authors’ Illustration Based on Google Maps).
Figure 5.
Survey Districts in HCMC: Urban and Semi-Urban Districts Indicated by Solid-Lined Boundaries (Source: Authors’ Illustration Based on Google Maps).

Figure 6.
Peak Hour Commuting in HCMC (Source: Thanh Nien News [47] and Copyright: Quang Dinh and Tuoi Tre).
Figure 6.
Peak Hour Commuting in HCMC (Source: Thanh Nien News [47] and Copyright: Quang Dinh and Tuoi Tre).

Figure 7.
Affordable Apartments in HCMC (left); and construction of apartments and elevated metro railway in HCMC (right) (Source: the author).
Figure 7.
Affordable Apartments in HCMC (left); and construction of apartments and elevated metro railway in HCMC (right) (Source: the author).


Table 1.
Housing Production over Time in Vietnam (Source: World Bank Group, 2015 [22]).
Table 1.
Housing Production over Time in Vietnam (Source: World Bank Group, 2015 [22]).
| State-Driven | Commercial | Self-Built | |
|---|---|---|---|
| 1994 | 5.00% | - | 95.00% |
| 1998 | - | 10.19% | 89.81% |
| 2008 | - | 19.57% | 80.43% |
| 2014 | 9.79% | 15.15% | 75.07% |
Table 2.
Questionnaire Contents.
| Category | Details | |
|---|---|---|
| Background | Age/Gender/Occupation/Income | |
| Urban Issues | Major Urban Problems/Environmental Issues/Transportation | |
| Former Residence | Housing | Location/Ownership/Housing Price |
| Housing Type/Number of Bedrooms/Toilet/Kitchen/Water Supply/Sewerage/Housing Satisfaction and Reasons | ||
| Neighborhood | Neighborhood Satisfaction and Reasons | |
| Current Residence | Housing | Location/Ownership/Housing Price |
| Housing Type/Duration of Residence/Number of Bedrooms/Toilet/Kitchen/Water Supply/Sewerage/Housing Satisfaction and Reasons/Reason for Moving to Current House | ||
| Neighborhood | Neighborhood Satisfaction and Reasons | |
| Future Housing | Preference for Housing Type/Number of Bedrooms | |
Table 3.
Data Collection Information.
| Survey Target Districts in HCMC | Data Collection Places | Samples | |
|---|---|---|---|
| Urban Districts | District 1 | Nguyen Hue Street and Plaza | 11 |
| District 3 | Le Van Tam Park | 11 | |
| District 4 | Nguyen Tat Thanh Street | 10 | |
| District 5 | CGV Parkson Mall | 10 | |
| District 6 | Chợ Bình Tây (Traditional Market) | 10 | |
| District 8 | Pham The Hien Street | 10 | |
| District 10 | Ba Thang Hai Street | 10 | |
| District 11 | Dam Sen Park | 10 | |
| Phu Nhuan | Centre Point Building (Mixed-use) | 11 | |
| Binh Thanh | Co.opmart Shopping Market | 10 | |
| Go Vap | Lotte Mart | 10 | |
| Tan Binh | Tan Binh Market | 10 | |
| Tanh Phu | Aeon Shopping Mall | 10 | |
| Semi-Urban Districts | District 2 | Vincom Mega Mall | 11 |
| District 7 | Vivo City Plaza | 10 | |
| District 9 | Do Xuan Hop Street | 10 | |
| District 12 | Ha Huy Giap Street | 10 | |
| Binh Tan | Aeon Shopping Mall | 10 | |
| Thu Duc | Co.opmart Shopping Market | 10 | |
Notes: Six local assistants supported this survey. They are students from the Ho Chi Minh City University of Architecture.
Table 4.
Housing Choice Change among Survey Respondents.
| Housing Typology | Past Residence | Present Residence | Future Preference | |
|---|---|---|---|---|
| Single-Family Housing (SFH) | Squatter | 2% | 0% | 0% |
| Row House | 68% | 69% | 44% | |
| Villa | 1% | 5% | 35% | |
| Multi-Family Housing (MFH) | Low-rise Apartment | 26% | 13% | 1% |
| High-rise Apartment | 5% | 13% | 19% | |
Notes: The apartment category was divided into low-rise (seven floors or fewer) and high-rise (more than seven floors) blocks for a more detailed understanding. A number of low-rise apartments had been built from the 1960s to the 1980s for social housing. A number of the high-rise apartments have been developed as a result of the FDI inflow into the real estate market [3].
Table 5.
Selected Significant Factors Relating to Current Housing Types (Chi-square Test).
| Current Residence | X2/p-Value | Current Residence | X2/p-Value | ||||
|---|---|---|---|---|---|---|---|
| SFH (N = 142) | MFH (N = 52) | Row House (N = 133) | Others (N = 61) | ||||
| Monthly Income | Low | 38/27% | 26/51% | 10.228/0.006 *** | 35/26.5% | 30/49.2% | 9.852/0.007 *** |
| Middle | 57/40.4% | 16/31.4% | 54/40.9% | 19/31.1% | |||
| High | 46/32.6% | 9/17.6% | 43/32.6% | 12/19.7% | |||
| Total | 141/100% | 51/100% | 132/100% | 61/100% | |||
| Ownership | Owned | 112/78.8% | 23/45.1% | 20.363/0.000 *** | 109/82% | 26/42.6% | 30.569/0.000 *** |
| Rent | 30/21.1% | 28/54.9% | 24/18% | 35/57.4% | |||
| Total | 142/100% | 51/100% | 133/100% | 61/100% | |||
| Former Housing Type | SFH | 114/80.3% | 32/62.7% | 6.264/0.021 ** | 106/79.7% | 41/67.2% | 3.552/0.072 * |
| MFH | 28/19.7% | 19/37.3% | 27/20.3% | 20/32.8% | |||
| Total | 142/100% | 51/100% | 133/100% | 61/100% | |||
| Future Preferred Housing Type | SFH | 118/84.3% | 34/68% | 6.107/0.022 ** | 111/84.1% | 41/69.5% | 5.348/0.032 ** |
| MFH | 22/15.7% | 16/32% | 21/15.9% | 18/30.5% | |||
| Total | 140/100% | 50/100% | 132/100% | 59/100% | |||
| Inconveniences Associated with Current Housing | Transportation | 67/47.2% | 18/35.3% | 6.760/0.080 * | 65/48.9% | 21/34.4% | 9.456/0.024 ** |
| Infrastructure | 21/14.8% | 10/19.6% | 18/13.5% | 13/21.3% | |||
| Safety/Security | 39/27.5% | 11/21.6% | 37/27.8% | 13/21.3% | |||
| Affordability | 15/10.6% | 12/23.5% | 13/9.8% | 14/23% | |||
| Total | 142/100% | 51/100% | 133/100% | 61/100% | |||
| Reason for Moving | Housing Structure | 49/37.1% | 8/17% | 12.217/0.007 ** | 48/39% | 9/15.8% | 13.041/0.005 *** |
| Commuting | 52/39.4% | 25/53.2% | 47/38.2% | 30/52.6% | |||
| Safety/Security | 7/5.3% | 8/17% | 7/5.7% | 9/15.8% | |||
| Affordability | 24/18.2% | 6/12.8% | 21/17.1% | 9/15.8% | |||
| Total | 132/100% | 46/100% | 123/100% | 57/100% | |||
Notes: The cells of each factor with a frequency count below five are fewer than 20%. Statistically significant at level is *** p < 0.01, ** p < 0.05, and * p < 0.10. Low-income class salaries are under 10 million (VND), middle income from 10 to 30 million (VND), and high income over 30 million (VND). SFH stands for Single-Family Housing and MFH for Multi-Family Housing. On the Reason for Moving section on the above table, the reason factors were regrouped into four to increase the statistical validity of the chi-square test. Housing Structure includes housing typological attributes. Commuting means locational features mainly consisting of public transportation availability, main road accessibility, and workplace proximity. Safety and Security means neighborhood environment mainly indicating crime and accident vulnerability of districts, which is a critical social issue in HCMC. Affordability means economic and financial issues for housing choice.
Table 6.
Housing Choice Reasons and Movement Patterns (Fisher’s Exact Test).
| Reasons for Moving to Current Housing | Former Housing to Current Housing | X2/p-Value | |||
|---|---|---|---|---|---|
| SFH to SFH | SFH to MFH | MFH to SFH | MFH to MFH | ||
| Housing Structure | 42 (40.4%) | 5 (17.9%) | 7 (25%) | 3 (15.8%) | 20.972/0.008 *** |
| Commuting | 39 (37.5%) | 17 (60.7%) | 13 (46.4%) | 8 (42.1%) | |
| Safety/Security | 3 (2.9%) | 3 (10.7%) | 4 (14.3%) | 5 (26.3%) | |
| Affordability | 20 (19.2%) | 3 (10.7%) | 4 (14.3%) | 3 (16.8%) | |
| Total | 104 (100%) | 28 (100%) | 28 (100%) | 19 (100%) | 179 |
Notes: Fisher’s Exact Test was performed since six cells (37.5%) have expected count less than 5. Statistical significance at the level is *** p < 0.01. SFH stands for Single Family Housing and MFH stands for Multi-Family Housing.
Table 7.
Monthly Income and Future Housing Choice (Chi-square Test).
| Monthly Income | Current Housing to Future Housing Preference | X2/p-Value | |||
|---|---|---|---|---|---|
| SFH to SFH | SFH to MFH | MFH to SFH | MFH to MFH | ||
| Low | 29 (24.6%) | 8 (38.1%) | 18 (52.9%) | 7 (43.8%) | 14.491/0.025 ** |
| Middle | 46 (39%) | 10 (47.6%) | 10 (29.4%) | 6 (37.5%) | |
| High | 43 (36.4%) | 3 (14.3%) | 6 (17.6%) | 3 (18.8%) | |
| Total | 118 (100%) | 21 (100%) | 34 (100%) | 16 (100%) | 189 |
Notes: One cell (8.3%) had an expected count less than 5. Statistically significant at level is ** p < 0.05. Low-income class salary is under 10 million (VND) per month, middle income from 10 million (VND) to 30 million (VND), and high income over 30 million (VND). SFH stands for Single-Family Housing, MFH for Multi-Family Housing.
© 2017 by the authors. Licensee MDPI, Basel, Switzerland. This article is an open access article distributed under the terms and conditions of the Creative Commons Attribution (CC BY) license (http://creativecommons.org/licenses/by/4.0/).
Share and Cite
MDPI and ACS Style
Seo, D.; Kwon, Y. In-Migration and Housing Choice in Ho Chi Minh City: Toward Sustainable Housing Development in Vietnam. Sustainability 2017, 9, 1738. https://doi.org/10.3390/su9101738
AMA Style
Seo D, Kwon Y. In-Migration and Housing Choice in Ho Chi Minh City: Toward Sustainable Housing Development in Vietnam. Sustainability. 2017; 9(10):1738. https://doi.org/10.3390/su9101738
Chicago/Turabian StyleSeo, Ducksu, and Youngsang Kwon. 2017. "In-Migration and Housing Choice in Ho Chi Minh City: Toward Sustainable Housing Development in Vietnam" Sustainability 9, no. 10: 1738. https://doi.org/10.3390/su9101738
Note that from the first issue of 2016, this journal uses article numbers instead of page numbers. See further details here.