Corporate Environmental Responsibility and Environmental Non-Governmental Organizations in China


1
School of Economics and Management, Xidian University, Xi’an 710126, China
2
College of Business and Entrepreneurship, University of Texas Rio Grande Valley, Edinburg, TX 78539, USA
3
School of Management, Northwestern Polytechnical University, Xi’an 710072, China
*
Author to whom correspondence should be addressed.
Sustainability 2017, 9(10), 1756; https://doi.org/10.3390/su9101756
Submission received: 25 August 2017
/
Revised: 20 September 2017
/
Accepted: 26 September 2017
/
Published: 28 September 2017
(This article belongs to the Section Economic and Business Aspects of Sustainability)
Abstract
:In China, environmental non-governmental organizations (ENGOs) play an important supervisory role to address ecological issues together with government regulation and enterprise implementation. This study examines the effect of ENGO presence on corporate environmental responsibility (CER) performance, along with internal factors as covariate variables. With a sample of 677 enterprises, it operationalizes the independent variable in terms of the number of ENGOs within certain distances from each enterprise, and the dependent variable based on the corporate social responsibility report using the specific criteria in the Global Reporting Initiative (GRI) sustainability reporting guidelines. The results of Tobit regression analyses indicate that ENGO presence is conducive to CER performance, and asset size, power concentration, and industry type also make differences. The findings suggest that ENGOs are helpful in solving environment issues by bridging the gap between private and public sectors. Theoretical and practical implications are discussed.
1. Introduction
In recent years, the large-scale smog in China has drawn the attention of the public to environmental issues [1]. The economy used to depend on the inefficient industry-driven model of “high input, high consumption, high pollution, low output”. As the main undertaker of economic development, enterprises have to answer for the whole society. They are responsible for not only market demands, but also resource conservation and environment protection. To address environmental issues, enterprises need to enhance ecological awareness and initiate protective activities. In this regard, corporate environmental responsibility (CER) manifests an enterprise’s understanding and undertaking of environmental problems [2]. How to strengthen the environmental responsibility of enterprises is the key to sustainable development.
Under the pressure from the government, public, market, and media, enterprises gradually strengthen the management and control of energy consumption and waste emission for sustainable development. Over the past few decades, the Chinese government provides and enforces regulatory guidelines and requirements, as highlighted by the continuous revision of environmental protection law [3]. However, the limited resources prevent it from monitoring all environmental issues at the enterprise level. Susceptible to the negative impacts of environmental problems, the public has an inherent interest in emission and pollution control, and demands closer supervision.
Environmental non-governmental organizations (ENGOs) fill the niche of supervising corporate behavior and raising public awareness [4]. Their emergence promotes the participation of the general public on environmental impact assessments [5]. They represent the public in dealing with the enterprises as the spokespersons and whistleblowers. Thus, the presence of ENGOs is likely to promote enterprises’ CER performance. However, there is a lack of theoretical discussion and empirical evidence on the relationship between the two.
This study examines the phenomenon from the perspective of how third-party supervision affects enterprise behavior in sustainable development. It collects data from different sources and conducts statistical analyses on the relationship between the presence of ENGOs and the CER performance of enterprises. The findings provide insights on whether the public can rely on the services provided by the ENGOs. They are helpful for policy-making in terms of how to enhance the compliance of enterprises to be environmentally responsible. The relationship between ENGOs and CER also points out the direction of future research on the interaction among ENGOs, enterprises, government, and the public on environment protection.
2. Research Background
Corporate social responsibility (CSR) is now regarded as a fundamental basis for enterprise competitiveness [6]. In recent years, corporate environmental responsibility (CER) emerged as an important aspect of CSR [7]. Actually, CER became the main public focus of CSR due to the rapid deterioration of the environment and climate [2]. The existing studies of CER can be divided into two categories. One is about its impacts on enterprises and stakeholders. It is found that the improvement of CER attracts investors and enhances the economic performance of firms which, in turn, enables enterprises to strengthen the implementation of CER to maintain competitive advantages [8]. Similarly, CER helps an enterprise build an “environmentally responsible image” to enhance the firm’s strategic position [9]. It is in the best interest of enterprises to achieve and deliver CER through the entire product life cycle, from upstream of the supply chain all the way to consumers, to meet their environmental needs [10]. Furthermore, there is a positive correlation between environmental information disclosure and organizational performance [11].
Most of the other studies focus on the determinants of CER. It is found that adminstrative and regulatory systems are the main driving forces of CER, and corporate leaders support government intervention to achieve the enterprises’ environmental protection activities [12]. Especially in China, the state-owned enterprises (SOEs) under the direct influence of government principles have relatively thorough environmental information disclosure [13]. Other stakeholders’ environmental responsibility requirements are also influential, which vary, however, due to their conditions, especially economic conditions [14].
China’s economy experienced a rapid growth at the cost of the environment, and its environmental information disclosure system is still under development [15]. The privately-owned enterprises are in the process of catching up with SOEs and multinational organizations in terms of environmental information disclosure [16]. To help them overcome the obstacle of cost concern, the Chinese government actively promotes CER [17]. However, there is a lack of administrative resources due to vast regions, diverse markets, and budget constraints [18]. This makes it difficult for the Chinese government to enforce environmental policies under the inherent contradiction between economic development and environment protection [19]. Meanwhile, fair competitions have a positive impact on CER and environmental performance [20]. This demands more supervision from the public [12,21], which involves ENGOs to represent its interest in CER [22].
Non-governmental organizations are conducive to corporate social responsibility with both cooperation and confrontation [23]. In this sense, ENGOs can be regarded as the eyes and hands for the public to supervise how well enterprises comply with government regulation on environmental protection. In the context of the Kyoto Protocol, ENGOs have a significant impact on environmentally-friendly business practices [24]. ENGOs largely make up the Chinese government’s deficiencies in environmental protection enforcement through monitoring pollution and disseminating information [25]. There are different ways that ENGOs promote CER, and even religions can play a role (e.g., domestic ancestral temples requiring environmental information disclosure) [26]. In the educational arena, ENGOs often help develop relevant courses to enhance students’ sense of environmental justice and prepare a better future [27]. However, there is still a lack of empirical research on the relationship between ENGOs and CER.
3. Theory Development
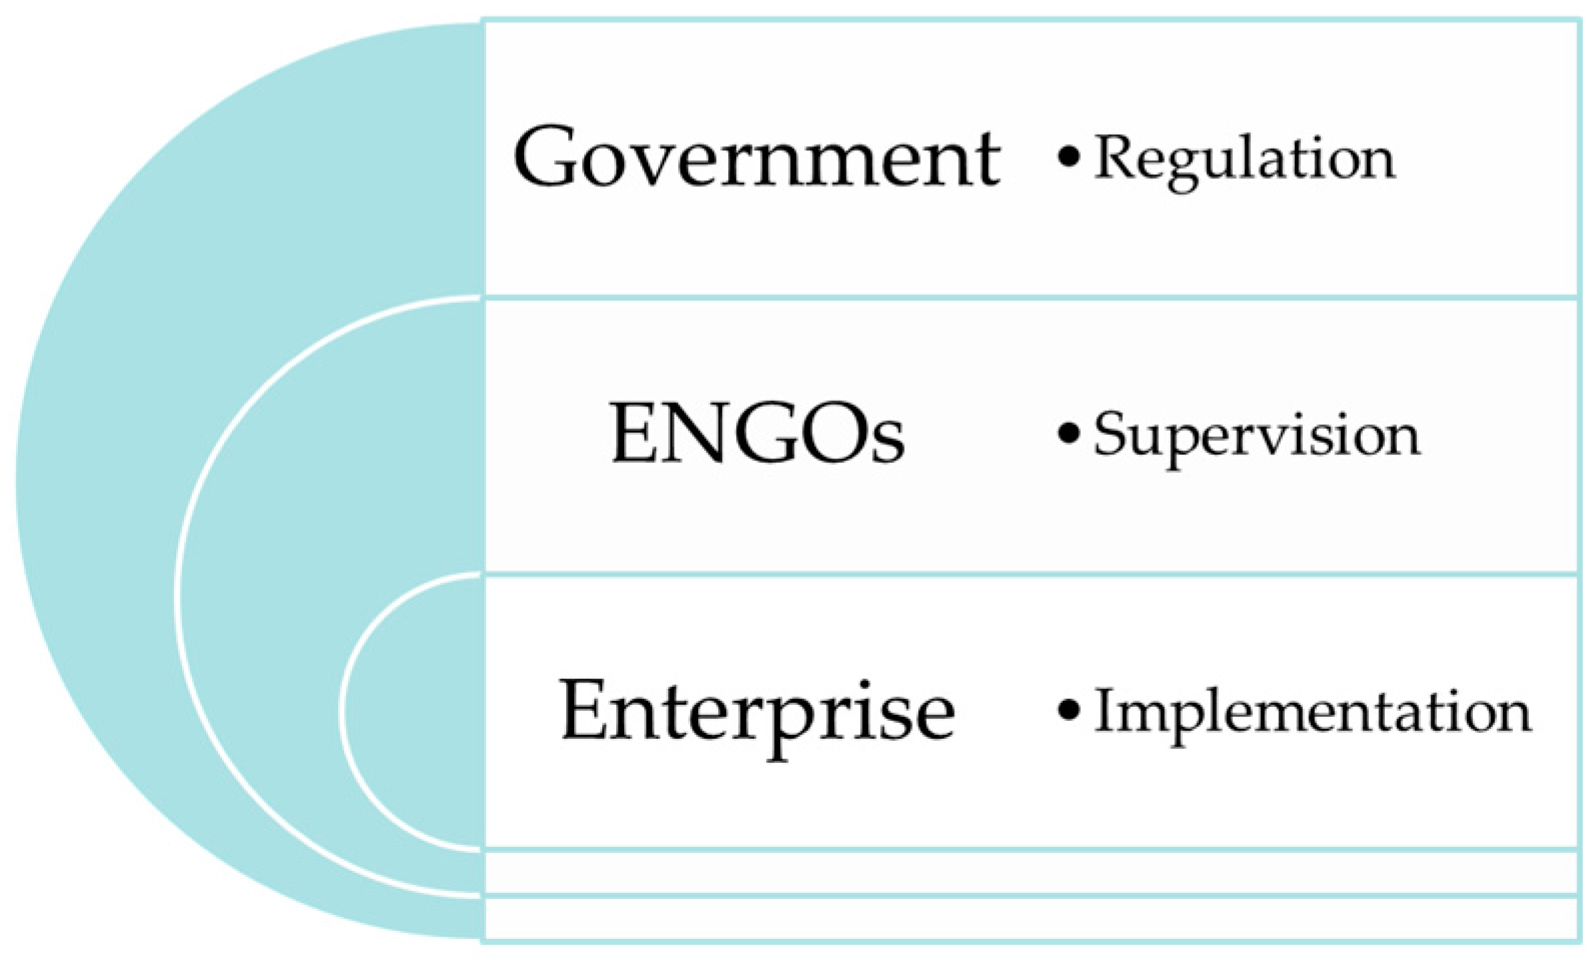
Enterprises, as the main body of the economy, play a major role in environmental protection. CER concerns not only ecological improvement, but also corporate competitiveness in the long run [28]. Under external and internal pressure, enterprises are motivated to improve CER performance. The ultimate motivation is regulation compliance from the government which, however, cannot attend to all the details of violation detection and legal enforcement [29]. There is a niche for ENGOs to safeguard the interests of public stakeholders [25,30]. They not only provide environmental supervision on enterprises but also improve the environmental awareness of the whole society that facilitates the self-evaluation of the business activities [31]. Figure 1 illustrates the supervisory role that ENGOs play between government regulation and enterprise implantation.
The understanding of the role that ENGOs play provides the basis for the examination of the relationship between their presence and enterprises’ CER. When there are more ENGOs in the vicinity of an enterprise, they are likely to provide more close-up supervision and relevant public services (e.g., media exposure, events). The enhanced pollution monitoring and environmental awareness are conducive to the CER performance of enterprises. Thus, the main research hypothesis of this study is as follows:
Hypothesis 1 (H1).
ENGO presence positively affects CER performance.
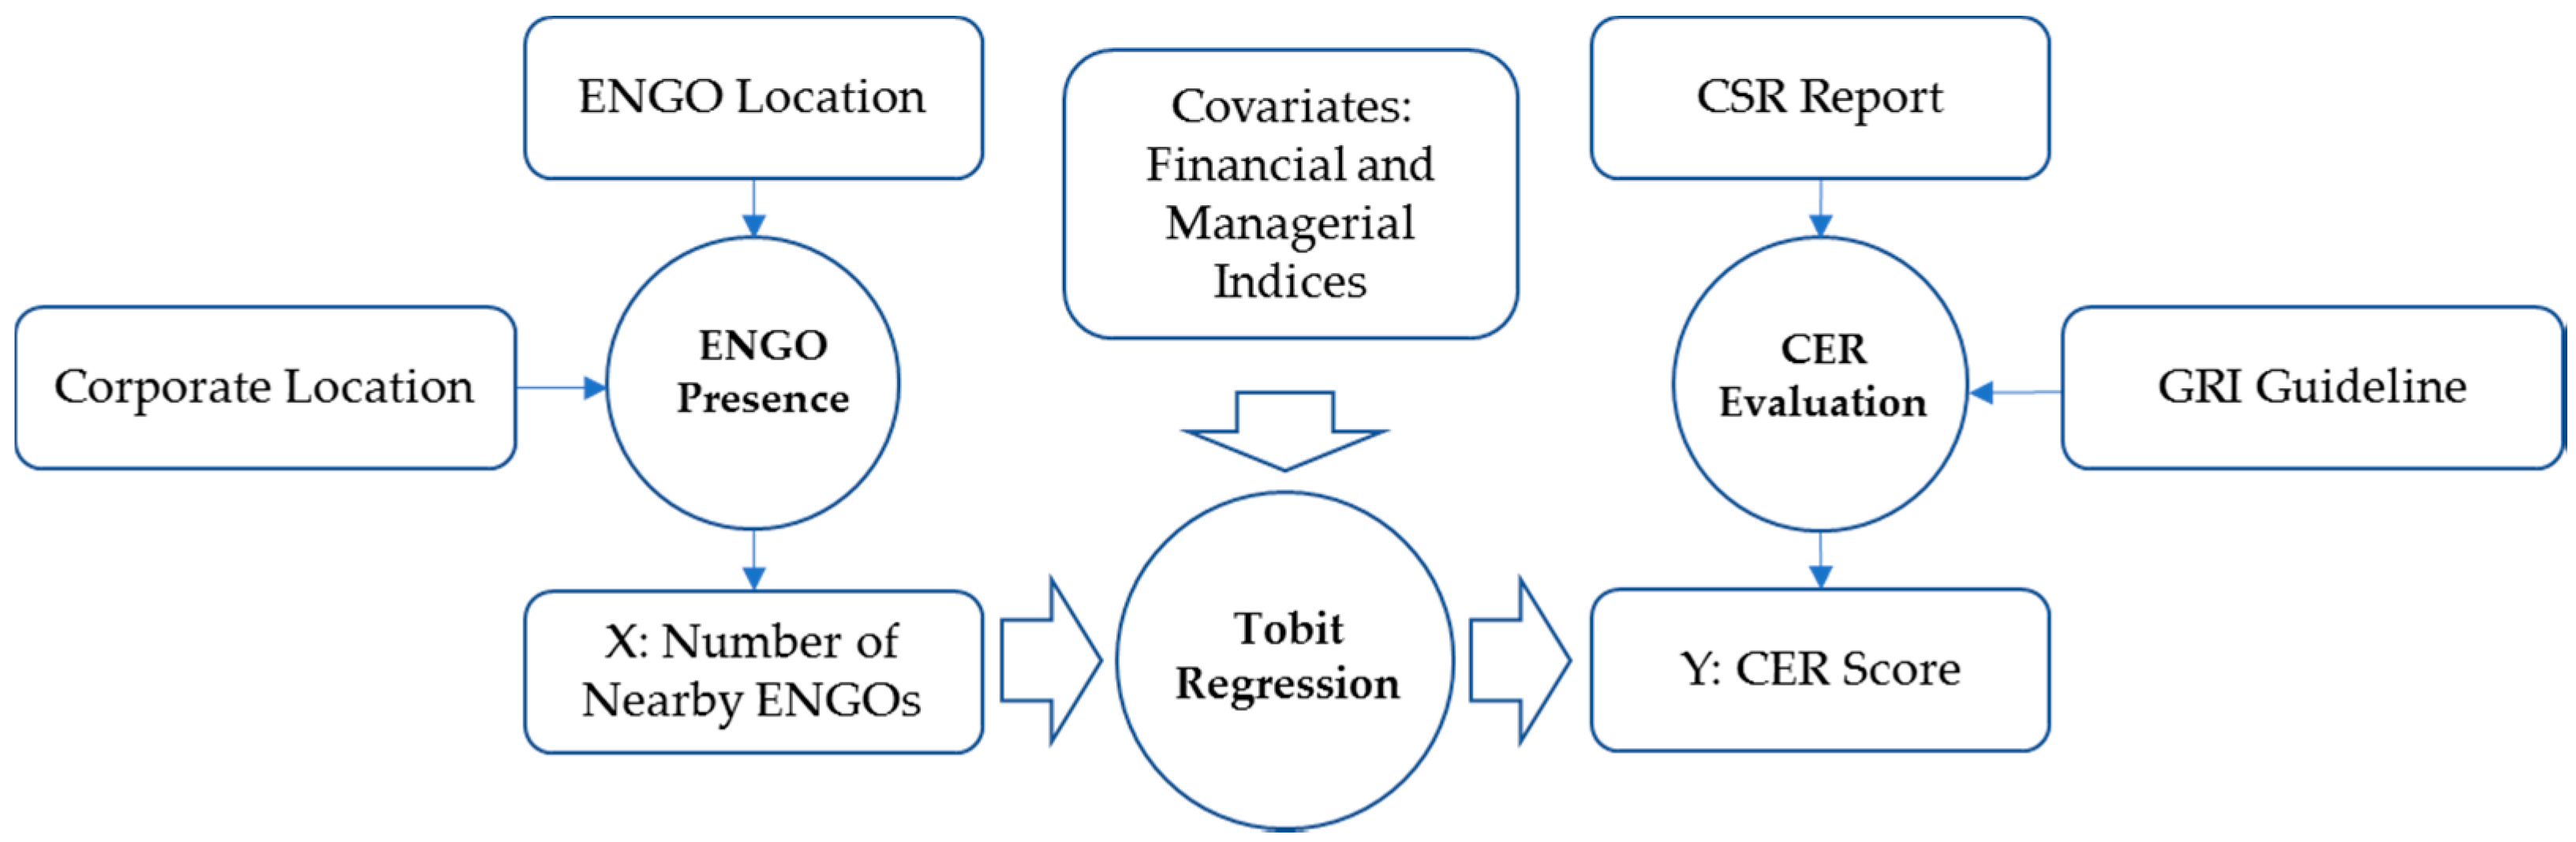
In addition to ENGO presence, there are many organizational factors that may affect corporate green endeavors. For the disclosure of environmental responsibility, financial and managerial indicators have been found relevant [32,33]. This study will include them as the covariate variables to predict CER performance as shown in Figure 2. The research framework lays the foundation for the design of an empirical study to test the main research hypothesis.
The resource-based view suggests that how well enterprises fulfill their corporate social responsibility depends on the available resources under various constraints [34]. Indicating the size of an organization, total asset reflects the financial resource available. Compared with small firms, large enterprises are likely to be more socially responsible and better at environmental disclosure [35]. Hence, the following hypothesis:
Hypothesis 2 (H2).
Total asset positively affects CER performance.
Financial leverage in terms of debt-to-asset ratio reflects the influence of creditors on corporate social responsibility and environmental disclosure [36,37]. In China, enterprises also take lenders into account when they undertake socially-responsible endeavors [38]. In the same token, the proportion of debt to the total asset is likely to have a positive impact on CER performance.
Hypothesis 3 (H3).
Debt-to-asset ratio positively affects CER performance.
The top management of an enterprise is in charge of CER decision-making [39]. In particular, the incentives of chief executive officers (CEOs) are related to corporate social performance [40]. If a CEO is also the chairman of the board, the person is likely to have the power to give direction on CER.
Hypothesis 4 (H4).
Top management power positively affects CER performance.
Similarly, the size and composition of the board of directors have an impact on corporate social responsibility [41]. When the board is comprised of managers from different backgrounds, they are more likely to discuss environmental issues and corporate identities. Such organizational context and managerial interpretations are relevant to the corporate choice of environmental strategy [42].
Hypothesis 5 (H5).
Board size positively affects CER performance.
Ownership concentration, in terms of the percentage of common shares owned by the controlling shareholder, is another indicator of decision power related to corporate governance [33]. Therefore, it is expected that the higher ownership concentration is conducive to CER disclosure.
Hypothesis 6 (H6).
Ownership concentration positively affects CER performance.
Chinese stock markets were established in the 1980s and they continuously include more and more firms. Compared with newly-listed enterprises, more established ones care more about their public image, and are likely to differentiate their corporate strategy on CER.
Hypothesis 7 (H7).
The age of the listed company positively affects CER performance.
Unlike other stock markets, Chinese stock markets feature many primarily state-owned enterprises. Compared with privately owned enterprises, larger state-owned enterprises bear more corporate social responsibility as they follow government directives. Thus, most state-owned enterprises are committed to environmental information disclosure [43].
Hypothesis 8 (H8).
State ownership positively affects CER performance.
Finally, some industries are more pollutive than others, by nature. For instance, the public is likely to have a higher expectation of disclosure on heavy industry than the service industry. Therefore, industry types are among the factors that drive listed companies in China to voluntarily disclose environmental information [13].
Hypothesis 9 (H9).
Industry type make a difference in CER performance.
4. Methodology
4.1. Data Collection
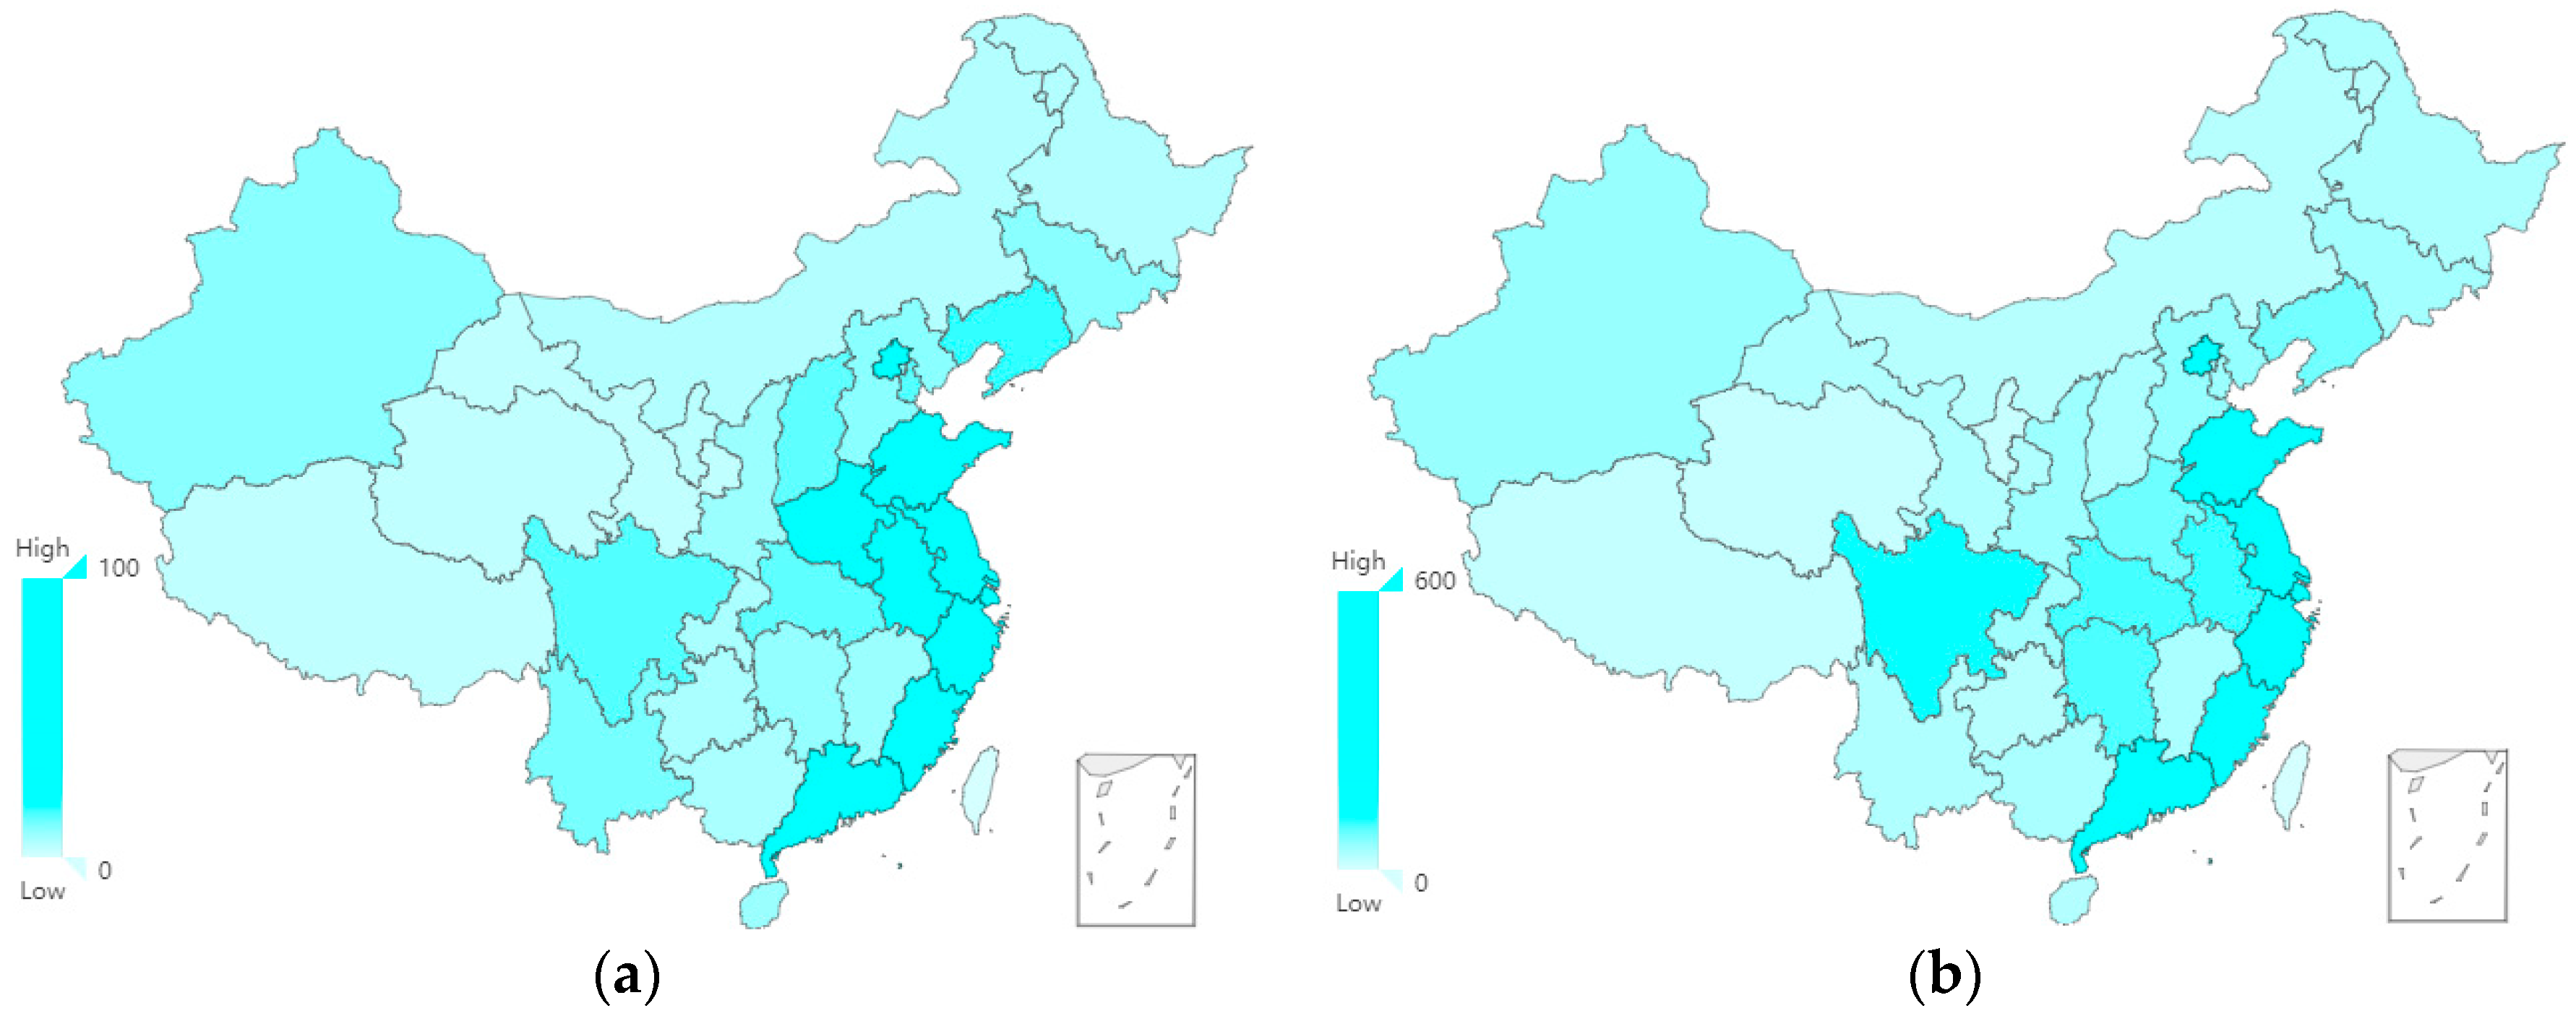
To test the hypothesized relationship between ENGO presence and CER performance, data were collected from multiple sources. The dependent variable, CER performance, was derived from the corporate social responsibility reports disclosed by the listed companies in China. Though it is not mandatory, such a disclosure to shareholders and the general public is encouraged to enhance the corporate reputation. Out of the total 2827 listed companies in 2015, 677 made the disclosure on their websites. Figure 3 compares their geographic distributions, which shows no large deviations.
Based on the reports, surrounding ENGOs, and corporate indicators, this study derived the CER score, ENGO presence, and covariate variables. Thus, the sample size of this study is 677, which accounts for one fourth of all listed companies in China. Listed companies are the major players in the economy as they contributed 74% of gross domestic products (GDP) in 2015 [44].
4.2. CER Evaluation
The research on the evaluation system of CER in China started in the 1990s, and it is still at the initial stage lacking a standardized quantitative assessment format [45]. There are two major types of evaluation systems. One divides environmental information into six categories, and evaluates the disclosure of each with points (generalized disclosures: one point, specialized assignments: two points, monetization or quantitative information: three points) [46]. The other is based on the “Sustainability Reporting Guidelines” published by Global Reporting Initiative (GRI) [47]. This evaluation system is divided into two parts, A1–A4 for the hard disclosure, which involves the degree of environmental disclosure of quantitative information, and A5–A7, mostly for corporate statements or declarations for expected performance. The seven primary indices have 45 secondary indices, leading to a total of 95 points.
The GRI evaluation system is preferred for its comprehensiveness, and empirical evidence suggests that there is a highly positive correlation between CER score and actual CER performance [48]. Thus this study obtained CER score as the proxy of CER performance, and used it as the dependent variable (i.e., Y) in statistical analyses. Based on the corporate social responsibility reports, this study calculated CER scores based on the GRI evaluation system [48].
4.3. ENGO Presence
Many studies on corporate performance measure the distances between external entities and each enterprise to indicate the presence of their influence [49,50]. Thus, this study calculated the distances between ENGOs and enterprises to reflect the strength of external influence on CER disclosure. It obtained the geographic coordinates of all ENGOs from China’s environmental organization map [51], and measured the distance of each from the registered address of an enterprise. It then counted the number of ENGOs within a certain distance from each enterprise to indicate ENGO presence. The sample comprised 1890 ENGOs in China, including social groups, campus groups, international groups, and foundation groups. Their services cover most of the environmental issues that China faces, such as forest protection, new energy, and climate change. The large number of diversified ENGOs indicates very large public interest, but for a country with a population of over 1.3 billion, there is still a great deal of development space.
To enhance the robustness of statistical analyses, this study counted the numbers of ENGOs within 60 km, 80 km, and 100 km from each enterprise and took their natural logarithms named ENGOs60, ENGOs80, and ENGOs100. Each ENGOsX variable was entered into a regression analysis as the independent variable (i.e., X) to predict CER performance. If the results are largely consistent, the findings can be considered reliable and generalizable.
4.4. Covariate Variables
The covariate variables corresponding to Hypothesis 2 to Hypothesis 9 (H2–H9) are operationalized as common managerial and financial indicators, as listed in Table 1. Industries sorted corporates into seven dummy categories according to the global industry classification standards: (1) energy and utilities industry; (2) material industry; (3) heavy industry; (4) light industry; (5) healthcare industry; (6) information technology industry; and (7) other service industries (e.g., finance, telecommunication, retail). All the covariate variables were obtained from the Wind database and CMSAR database, both frequently used in the studies of Chinese enterprises.
4.5. Model Specification
Equation (1) indicates the regression model to test the hypothesized effect of ENGO presence on the CER score with other covariate variables. In the model, CER_std represents the dependent variable of CER performance, and ENGOsX represents the independent variable of ENGO presence with a certain distance range. If the coefficient β1 remains positive and significant for every ENGOsX variable controlled for the other covariate variables, there is supporting evidence of the main research hypothesis.
CER_std = β0 + β1ENGOsX + β2ASSET + β3DEBT + β4TOP + β5BOARD + β6OWNER + β7LISTAGE + β8STATE + β9INDUSTRIES + ε
The model estimation employed Tobit regression, one of the most robust statistical methods used for data analyses in the fields like economics [52,53]. The technique is often used in studies on environmental disclosure as the observations are censored at zero as some companies do not disclose any CER information in their corporate social responsibility reports [48]. Before the analysis, this study standardized CER scores to normalize the distribution of the dependent variable, of which the range is between 0 and 1. Compared with logistic regression and ordinary least square (OLS) regression, Tobit regression is more appropriate as the standardized variable is continuously distributed, but still censored at 0. Eviews 6.0 (IHS Global Inc., Irvine, CA, USA) was the statistical software used for Tobit regression. In addition, this study used the SPSS 22.0 (IBM Corporation, Armonk, NY, USA) to conduct descriptive and correlation analyses.
5. Results
Table 2 reports the descriptive statistics of the sample. Variables including ASSET, BOARD, and ENGOsX were transformed and their averages and dispersions could not be interpreted directly. On average, the debt-to-asset ratio (i.e., DEBT) was around 50% (i.e., 0.514), and about 60% (i.e., 0.592) of the common share was owned by the controlling stakeholder (i.e., OWNER). About half of the enterprises were in business for 15 years or more. The other variables are of 0–1 coding, and the averages indicate the proportion of enterprises meeting the criteria to be 1. Among all the enterprises in the sample, 18% (0.180) had the chairmen of the boards as CEOs (i.e., TOP), and over half (0.569) were state-owned enterprises (i.e., STATE).
Table 3 reports the correlation matrix of all the variables. The results indicate that when distance equals 100 km, 80 km, and 60 km, there was a positive correlation between the explanatory variables and explained variables. Moreover, the correlation was significant at the 0.05 level for the distance of 60 km. The matrix can also be used to assess multicollinearity. It is generally believed that if the correlation coefficients among explanatory variables (i.e., the independent and covariate variables) exceed 0.8, multicollinearity is likely to be an issue in regression analysis. In this study, all relevant correlation coefficients were below 0.8, suggesting that multicollinearity was not a significant concern.
Table 4 reports the results of regression analyses. Controlled for other covariate variables, the effect of ENGO presence on CER performance remained significantly positive at the distances of 60 km, 80 km, and 100 km, supporting the research hypothesis. The radius of 100 km yielded the highest significance, indicating the large geographic scope of ENGO influence. In addition, three covariate variables were found significant. First, as enterprises grew in assets, their CER performance became better. This suggests that large companies are more willing to undertake environmental responsibility. Furthermore, ownership concentration had a positive effect on CER performance. As expected, ecological decision-making requires the support of primary shareholders.
Moreover, all industry dummies were significant. The baseline industry was Other Services (e.g., Finance, Retail, etc.). As shown in Table 5, it had the lowest average CER score. This explained why the dummy variables corresponding to the other industries had significantly positive effects on CER performance. Compared with the rest of the industries, the energy and utilities industry, material industry, and healthcare industry were more CER-obliged. The variation in CER scores across different industries is probably due to the fact that they have different resource demands and environmental impacts.
6. Conclusions and Implications
Based on a literature review, this study conceptualizes the relationship between ENGO presence and CER performance. The research design considers the influences of both external motivation and internal factors on enterprises. The independent and dependent variables are ENGO presence and CER performance derived from an environmental organization map and GRI evaluation system, respectively, in addition to management and financial indicators as covariate variables. The Tobit regression results confirm the positive effect of ENGO presence on CER performance, and suggest that organizational asset size, ownership concentration, and industry type also make differences.
The findings support the conceptualization that ENGOs play an important mediating role between government regulation and enterprise implementation by providing environmental supervision and relevant public services. Their efforts help make up for government oversight, enhance public awareness, and actuate responsible corporate behavior on environmental protection. There have been discussions on the role that non-governmental organizations play in the ecological movement and sustainable development. This study further establishes the theoretical link between ENGO presence and CER performance, and provides empirical evidence. The findings also reveal the likely interactions between external environmental supervision and internal factors that affect organizational decision-making.
In addition to theoretical contributions, the findings yield useful practical implications. The Chinese government has greatly strengthened environmental regulation in recent years, but there is a lack of resources for comprehensive legal enforcement. ENGOs fit into the niche to monitor companies’ energy conservation and emission reduction by involving the public. The findings suggest that it is better off for the government and public to promote and strengthen the collaboration with ENGOs for environmental protection and sustainable development. The government, public, and ENGOs can work together closely toward the same ecological goal through various channels, such as media coverage and environmental education.
Additionally, the significant covariate variables suggest that asset size and ownership concentration matter for CER, especially for pollution-related industries. It is important that the Chinese government continues increasing the effort on the re-adjustment and optimization of the economic structure. Whereas large enterprises are relatively responsible, small and medium enterprises need to pay more attention to their operations that concern the environment. As the decision-making on green innovation requires a stronger managerial commitment, ENGOs may strengthen the guidance and monitoring of small and medium enterprises to further alleviate the contradiction with resource consumption and environmental protection.
In addition, the benign interaction among government, ENGOs and enterprises require active public participation. The public has the legitimate right on environmental issues, and can directly contribute to CER supervision in a timely manner. With the advances of information and communication technology (ICT), everyone can observe and report pollution incidents anytime and anywhere by using smart phones and social media. The Chinese government should encourage local ENGOs to carry out public events (e.g., community campaigns and volunteer activities) and expand media coverage to attract public attention, enhance environmental awareness and facilitate people’s participation.
The findings of this paper provide a theoretical basis on policy-making to encourage ENGOs’ participation in environmental protection. Regulations can be made to increase environmental information transparency to ENGOs, as well as the public, through media, press conferences, and so on [54]. In addition, communication channels can be established among enterprises, ENGOs, and the public so that they can share information, decision-making, and feedback [4,5].
In China, ENGOs only account for a small proportion of all NGOs and there is still a large space in which to grow. To improve the service quality, the existing ENGOs need to utilize all kinds of public resources to tap their full potential and optimize positive impacts on environmental protection [55]. At the same time, ENGOs in the same geographical area may cooperate with each other, such as hosting charity activities [56].
For mutual understanding and environmental transparency, it is important for enterprises to enter constructive relationships with local communities and ENGOs. In addition to designing environmentally-friendly products and making production/operation greener, enterprises may keep in contact with local ENGOs to understand the needs and views of the public. The collaboration is likely to improve corporate environmental responsibility and a firm’s green image.
Though the sample of this study only includes listed companies due to data availability, the findings yield the implications for environmental supervision of all enterprises. Compared with the listed companies, there is a more urgent need for ENGOs to supervise the vast majority of privately-owned companies and other non-listed companies. For better collaboration with the public, ENGOs may utilize new social media and networks to engage people in providing timely clues of environmental issues [57].
Of course, this study has limitations. For instance, it does not differentiate the ENGOs in the sample, but treats each as the same, partly due to the lack of a clear classification scheme of ENGOs. Not only is the number important to indicate their presence, but different types of ENGOs may play various specific roles as well. Additionally, the sample only comprises listed companies in China that disclosed CER reports, which limits the generalizability of findings. Such limitations point to the direction of future studies to examine the impact of different types of ENGOs on the CER performance in multiple countries.
Acknowledgments
This study was funded by grants from the National Social Science Foundation of China (No. 15BGL040). The technical support from Yang Hu on location data collection is greatly appreciated. The authors would like to express sincere gratitude to the editor and the anonymous reviewers for their insightful and constructive comments.
Author Contributions
Zhaojun Yang and Jun Sun developed the idea, motivation, and question of the paper and performed research at all stages. Weihao Liu and Yali Zhang outlined the manuscript and made substantial contributions to data collection and analysis.
Conflicts of Interest
The authors declare no conflict of interest.
References
- Liu, J.; Goodnight, G.T. China’s Green Public Culture: Network Pragmatics and the Environment. Int. J. Commun. 2016, 10, 5535–5557. [Google Scholar]
- Gunningham, N. Shaping corporate environmental performance: A review. Environ. Policy Gov. 2009, 19, 215–231. [Google Scholar] [CrossRef]
- Yang, H. China must continue the momentum of green law. Nature 2014, 509, 535. [Google Scholar] [CrossRef] [PubMed]
- Tang, S.-Y.; Zhan, X. Civic environmental NGOs, civil society, and democratisation in China. J. Dev. Stud. 2008, 44, 425–448. [Google Scholar] [CrossRef]
- Wu, J.; Chang, I.-S.; Yilihamu, Q.; Zhou, Y. Study on the practice of public participation in environmental impact assessment by environmental non-governmental organizations in China. Renew. Sustain. Energy Rev. 2017, 74, 186–200. [Google Scholar] [CrossRef]
- Porter, M.E.; Kramer, M.R. Strategy and society: The link between competitive advantage and corporate social responsibility. Harv. Bus. Rev. 2006, 84, 78–92. [Google Scholar] [PubMed]
- Mazurkiewicz, P. Corporate Environmental Responsibility: Is a Common CSR Framework Possible? Working Paper; World Bank: Washington, DC, USA, 2004. [Google Scholar]
- Wahba, H. Does the market value corporate environmental responsibility? An empirical examination. Corp. Soc. Responsib. Environ. Manag. 2008, 15, 89–99. [Google Scholar] [CrossRef]
- Heikkurinen, P. Image differentiation with corporate environmental responsibility. Corp. Soc. Responsib. Environ. Manag. 2012, 17, 142–152. [Google Scholar] [CrossRef]
- Kovács, G. Corporate environmental responsibility in the supply chain. J. Clean. Prod. 2008, 16, 1571–1578. [Google Scholar] [CrossRef]
- Yu, Z.; Jian, J.; He, P. The Study on the Correlation between Environmental Information Disclosure and Economic Performance-With empirical data from the manufacturing industries at Shanghai Stock Exchange in China. Energy Procedia 2011, 5, 1218–1224. [Google Scholar]
- Dummett, K. Drivers for Corporate Environmental Responsibility (CER). Environ. Dev. Sustain. 2006, 8, 375–389. [Google Scholar] [CrossRef]
- Zeng, S.X.; Yin, H.T.; Tam, C.M. Factors that Drive Chinese Listed Companies in Voluntary Disclosure of Environmental Information. J. Bus. Ethics 2012, 109, 309–321. [Google Scholar] [CrossRef]
- Smaliukiene, R. Stakeholders’ impact on the environmental responsibility: Model design and testing. J. Bus. Econ. Manag. 2007, 8, 213–223. [Google Scholar]
- Zhang, L.; Mol, A.P.J.; He, G.; Lu, Y. An implementation assessment of China’s Environmental Information Disclosure Decree. J. Environ. Sci. 2010, 22, 1649–1656. [Google Scholar] [CrossRef]
- Zeng, S.X.; Xu, X.D.; Dong, Z.Y.; Tam, V.W.Y. Towards corporate environmental information disclosure: An empirical study in China. J. Clean. Prod. 2010, 18, 1142–1148. [Google Scholar] [CrossRef]
- He, M.; Chen, J. Sustainable Development and Corporate Environmental Responsibility: Evidence from Chinese Corporations. J. Agric. Environ. Ethics 2009, 22, 323–339. [Google Scholar] [CrossRef]
- Howes, M.; Wortley, L.; Potts, R.; Dedekorkut-Howes, A.; Serrao-Neumann, S.; Davidson, J.; Smith, T.; Nunn, P. Environmental Sustainability: A Case of Policy Implementation Failure? Sustainability 2017, 9, 165. [Google Scholar] [CrossRef]
- Xia, Q.; Li, M.; Wu, H.; Lu, Z. Does the Central Government’s Environmental Policy Work? Evidence from the Provincial-Level Environment Efficiency in China. Sustainability 2016, 8, 1241. [Google Scholar] [CrossRef]
- Meng, X.H.; Zeng, S.X.; Xie, X.M.; Qi, G.Y. The impact of product market competition on corporate environmental responsibility. Asia Pac. J. Manag. 2016, 33, 267–291. [Google Scholar] [CrossRef]
- Cormier, D.; Magnan, M.; Velthoven, B.V. Environmental disclosure quality in large German companies: Economic incentives, public pressures or institutional conditions? Eur. Account. Rev. 2005, 14, 3–39. [Google Scholar] [CrossRef]
- Hawrysz, L.; Foltys, J. Environmental Aspects of Social Responsibility of Public Sector Organizations. Sustainability 2016, 8, 19. [Google Scholar] [CrossRef]
- Lyon, T.P.; Maxwell, J.W. Corporate Social Responsibility and the Environment: A Theoretical Perspective. Rev. Environ. Econ. Policy 2008, 2, 240–260. [Google Scholar] [CrossRef]
- Becker, E. The Influence of Environmental NGOs in the Global Society. Butler J. Undergrad. Res. 2016, 2, 17. [Google Scholar]
- Ran, W. The roles of government and NGOs in environmental protection through producing, sharing, and disseminating information. In Proceedings of the International Conference on Theory and Practice of Electronic Governance, Beijing, China, 25–28 October 2010; pp. 223–231. [Google Scholar]
- Du, X.; Jian, W.; Zeng, Q.; Du, Y. Corporate Environmental Responsibility in Polluting Industries: Does Religion Matter? J. Bus. Ethics 2014, 124, 485–507. [Google Scholar] [CrossRef]
- He, P.P.; Zhuang, Y.J.; Lin, Y.; Zheng, C.H. Environmental Law Clinics in Collaboration with Environmental NGOs in China. Sustainability 2017, 9, 337. [Google Scholar] [CrossRef]
- Xie, F.; Li, H. Environmental Responsibility and Environmental Performance Evaluation of Enterprise. Mod. Financ. Econ. 2005, 25, 40–42. [Google Scholar]
- Cai, S.Q. On Flaw and Perfection Government Environmental Responsibility and Legal Liability. Hebei Law Sci. 2008, 26, 17–25. [Google Scholar]
- Schwartz, J. Environmental NGOs in China: Roles and Limits. Pac. Aff. 2004, 77, 28–49. [Google Scholar]
- Jahiel, A.R. The Organization of Environmental Protection in China. China Q. 2011, 3, 757–787. [Google Scholar] [CrossRef]
- Bear, S.; Rahman, N.; Post, C. The Impact of Board Diversity and Gender Composition on Corporate Social Responsibility and Firm Reputation. J. Bus. Ethics 2010, 97, 207–221. [Google Scholar] [CrossRef]
- Claessens, S.; Djankov, S.; Fan, J.P.H.; Lang, L.H.P. Disentangling the Incentive and Entrenchment Effects of Large Shareholdings. J. Financ. 2002, 57, 2741–2771. [Google Scholar] [CrossRef]
- Russo, M.V.; Fouts, P.A. A resource-based perspective on corporate environmental performance and profitability. Acad. Manag. J. 1997, 40, 534–559. [Google Scholar] [CrossRef]
- Brammer, S.; Pavelin, S. Factors influencing the quality of corporate environmental disclosure. Bus. Strategy Environ. 2008, 17, 120–136. [Google Scholar] [CrossRef]
- Huang, C.-L.; Kung, F.-H. Drivers of environmental disclosure and stakeholder expectation: Evidence from Taiwan. J. Bus. Ethics 2010, 96, 435–451. [Google Scholar] [CrossRef]
- Roberts, R.W. Determinants of corporate social responsibility disclosure: An application of stakeholder theory. Account. Organ. Soc. 1992, 17, 595–612. [Google Scholar] [CrossRef]
- Ye, K.; Zhang, R. Do lenders value corporate social responsibility? Evidence from China. J. Bus. Ethics 2011, 104, 197–206. [Google Scholar] [CrossRef]
- Meng, X.; Zeng, S.; Tam, C.M.; Xu, X. Whether top executives’ turnover influences environmental responsibility: From the perspective of environmental information disclosure. J. Bus. Ethics 2013, 114, 341–353. [Google Scholar] [CrossRef]
- McGuire, J.; Dow, S.; Argheyd, K. CEO incentives and corporate social performance. J. Bus. Ethics 2003, 45, 341–359. [Google Scholar] [CrossRef]
- Zhang, J.Q.; Zhu, H.; Ding, H.-B. Board composition and corporate social responsibility: An empirical investigation in the post Sarbanes-Oxley era. J. Bus. Ethics 2013, 114, 381–392. [Google Scholar] [CrossRef]
- Sharma, S. Managerial interpretations and organizational context as predictors of corporate choice of environmental strategy. Acad. Manag. J. 2000, 43, 681–697. [Google Scholar] [CrossRef]
- Kuo, L.; Yeh, C.C.; Yu, H.C. Disclosure of corporate social responsibility and environmental management: Evidence from China. Corp. Soc. Responsib. Environ. Manag. 2012, 19, 273–287. [Google Scholar] [CrossRef]
- World-Bank. World Development Indicators; The World Bank: Washington, DC, USA, 2016. [Google Scholar]
- Yang, G. Analysis on evaluation system for corporate environmental responsibility and application of the results. Chin. J. Environ. Manag. 2012, 1, 1–6. [Google Scholar]
- Wiseman, J. An evaluation of environmental disclosures made in corporate annual reports. Account. Organ. Soc. 1982, 7, 53–63. [Google Scholar] [CrossRef]
- Global Reporting Initiative (GRI). G4 Sustainability Reporting Guidelines; GRI: Amsterdam, The Netherlands, 2015; Available online: https://www.globalreporting.org/information/g4/Pages/default.aspx (accessed on 31 October 2015).
- Clarkson, P.M.; Li, Y.; Richardson, G.D.; Vasvari, F.P. Revisiting the relation between environmental performance and environmental disclosure: An empirical analysis. Account. Organ. Soc. 2008, 33, 303–327. [Google Scholar] [CrossRef]
- Du, X.; Jian, W.; Du, Y.; Feng, W.; Zeng, Q. Religion, the Nature of Ultimate Owner, and Corporate Philanthropic Giving: Evidence from China. J. Bus. Ethics 2014, 123, 235–256. [Google Scholar] [CrossRef]
- John, K. Does geography matter? Firm location and corporate payout policy. J. Financ. Econ. 2011, 101, 533–551. [Google Scholar] [CrossRef]
- China Environmental Organization Map. Available online: http://www.hyi.org.cn/go/ (accessed on 27 September 2017).
- Ai, C.; Norton, E.C. Interaction terms in logit and probit models. Econ. Lett. 2003, 80, 123–129. [Google Scholar] [CrossRef]
- Wooldridge, J.M. Econometric Analysis of Cross Section and Panel Data; MIT Press: Cambridge, MA, USA, 2002; pp. 206–209. [Google Scholar]
- Johnson, T. Environmental information disclosure in China: Policy developments and NGO responses. Policy Politics 2011, 39, 399–416. [Google Scholar] [CrossRef]
- Lu, Y. Environmental civil society and governance in China. Int. J. Environ. Stud. 2007, 64, 59–69. [Google Scholar] [CrossRef]
- Xie, L. China’s Environmental Activism in the Age of Globalization. Asian Politics Policy 2011, 3, 207–224. [Google Scholar] [CrossRef]
- Yang, A. New media, environmental NGOs, and online-based collective actions in China. In Ecomedia: Key Issues; Routledge: London, UK, 2016; pp. 213–227. [Google Scholar]
Figure 1.
ENGOs and corporate environment responsibility.

Figure 2.
Research framework.

Figure 3.
Geographic distributions of sample and population. (a) Listed companies in the sample; (b) All listed companies in China.
Figure 3.
Geographic distributions of sample and population. (a) Listed companies in the sample; (b) All listed companies in China.

Table 1.
Covariate variables.
| Name | Explanation |
|---|---|
| ASSET (H2) | The natural logarithm of the total asset at the end of the year |
| DEBT (H3) | Debt to-asset ratio |
| TOP (H4) | 1 if the CEO and the chairman of the board are the same person, and 0 otherwise |
| BOARD (H5) | The natural logarithm of the number of the board of directors |
| OWNER (H6) | The percentage of common share owned by controlling shareholder |
| LISTAGE (H7) | The number of years since a firm’s IPO |
| STATE (H8) | 1 if the ultimate controlling shareholder is state-owned, and 0 otherwise |
| INDUSTRIES (H9) | Dummy variables indicating the industry categories of enterprises |
Table 2.
Descriptive statistics.
| Variables | N | Mean | SD | MIN | Q1 | Median | Q3 | MAX |
|---|---|---|---|---|---|---|---|---|
| ASSET | 677 | 13.982 | 1.734 | 9.729 | 12.793 | 13.693 | 14.952 | 21.446 |
| DEBT | 677 | 0.514 | 0.211 | 0.020 | 0.354 | 0.510 | 0.679 | 0.975 |
| TOP | 677 | 0.180 | 0.385 | 0 | 0 | 0 | 0 | 1 |
| BOARD | 677 | 2.193 | 0.234 | 1.609 | 2.079 | 2.197 | 2.303 | 2.890 |
| OWNER | 677 | 0.592 | 0.162 | 0.133 | 0.479 | 0.594 | 0.703 | 0.980 |
| STATE | 677 | 0.569 | 0.496 | 0 | 0 | 1 | 1 | 1 |
| LISTAGE | 677 | 13.392 | 6.354 | 1 | 8 | 14 | 19 | 26 |
| ENGOs60 | 677 | 2.800 | 1.513 | 0.000 | 1.792 | 2.639 | 4.301 | 5.011 |
| ENGOs80 | 677 | 2.991 | 1.434 | 0.000 | 1.792 | 2.890 | 4.344 | 5.193 |
| ENGOs100 | 677 | 3.138 | 1.396 | 0.000 | 1.946 | 3.219 | 4.431 | 5.257 |
| CER_raw | 677 | 10.642 | 7.963 | 0.000 | 5.000 | 8.500 | 14.000 | 48.000 |
| CER_std | 677 | 0.205 | 0.169 | 0.000 | 0.085 | 0.160 | 0.277 | 1.000 |
Table 3.
Correlation matrix.
| Variable | 1 | 2 | 3 | 4 | 5 | 6 | 7 | 8 | 9 | 10 |
|---|---|---|---|---|---|---|---|---|---|---|
| 1.ASSET | 1.000 | |||||||||
| 2.DEBT | 0.553 ** | 1.000 | ||||||||
| 3.TOP | −0.146 ** | −0.133 ** | 1.000 | |||||||
| 4.BOARD | 0.240 ** | 0.150 ** | −0.202 ** | 1.000 | ||||||
| 5.OWNER | 0.309 ** | 0.041 | −0.057 | 0.080 | 1.000 | |||||
| 6.LISTAGE | 0.187 ** | 0.202 ** | −0.198 ** | 0.118 ** | −0.231 ** | 1.000 | ||||
| 7.STATE | 0.303 ** | 0.193 ** | −0.320 ** | 0.222 ** | 0.176 ** | 0.310 ** | 1.000 | |||
| 8.ENGOs_60 | 0.108 * | 0.056 | 0.007 | −0.061 | 0.151 ** | −0.027 | 0.173 ** | 1.000 | ||
| 9.ENGOs_80 | 0.087 * | 0.043 | 0.035 | −0.081 | 0.150 ** | −0.045 | 0.134 ** | 0.956 ** | 1.000 | |
| 10.ENGOs_100 | 0.081 | 0.028 | 0.042 | −0.087 * | 0.152 ** | −0.066 | 0.125 ** | 0.914 ** | 0.972 ** | 1.000 |
| 11.CER_std | 0.414 ** | 0.171 ** | −0.041 | 0.202 ** | 0.227 ** | 0.037 | 0.156 ** | 0.085 * | 0.073 | 0.078 |
Note: *—Significant at 0.05 level; **—Significant at 0.01 level.
Table 4.
Tobit regression analysis.
| Variable Name | (1) 60 km | (2) 80 km | (3) 100 km | |||
|---|---|---|---|---|---|---|
| Coefficient | p Value | Coefficient | p Value | Coefficient | p Value | |
| ENGOs60 (H1) | 0.014 * | 0.018 | ||||
| ENGOs80 (H1) | 0.012 * | 0.038 | ||||
| ENGOs100 (H1) | 0.017 ** | 0.005 | ||||
| ASSET (H2) | 0.062 ** | 0.000 | 0.063 ** | 0.000 | 0.063 ** | 0.000 |
| DEBT (H3) | 0.013 | 0.824 | −0.009 | 0.873 | −0.007 | 0.902 |
| TOP (H4) | 0.017 | 0.476 | 0.015 | 0.515 | 0.016 | 0.500 |
| BOARD (H5) | 0.057 | 0.166 | 0.047 | 0.248 | 0.058 | 0.151 |
| OWNER (H6) | 0.164 ** | 0.005 | 0.162 ** | 0.005 | 0.158 ** | 0.005 |
| LISTAGE (H7) | 0.000 | 0.916 | 0.000 | 0.968 | 0.000 | 0.928 |
| STATE (H8) | −0.005 | 0.821 | 0.001 | 0.974 | −0.004 | 0.858 |
| INDUSTRY1 (H9) | 0.231 ** | 0.000 | 0.225 ** | 0.000 | 0.221 ** | 0.000 |
| INDUSTRY2 (H9) | 0.271 ** | 0.000 | 0.272 ** | 0.000 | 0.272 ** | 0.000 |
| INDUSTRY3 (H9) | 0.135 ** | 0.000 | 0.134 ** | 0.000 | 0.135 ** | 0.000 |
| INDUSTRY4 (H9) | 0.115 ** | 0.001 | 0.117 ** | 0.001 | 0.118 ** | 0.001 |
| INDUSTRY5 (H9) | 0.253 ** | 0.000 | 0.254 ** | 0.000 | 0.253 ** | 0.000 |
| INDUSTRY6 (H9) | 0.214 ** | 0.000 | 0.217 ** | 0.000 | 0.212 ** | 0.000 |
Note: *—Significant at 0.05 level; **—Significant at 0.01 level.
Table 5.
CER scores by industry.
| Industry Dummies | Number | Min (X) | Max (X) | Median | AVG | Percentage of Total |
|---|---|---|---|---|---|---|
| 1 Energy and Utilities | 60 | 1.0 | 48.0 | 13.500 | 15.425 | 8.9% |
| 2 Material Industry | 123 | 1.0 | 45.0 | 10.000 | 12.309 | 18.2% |
| 3 Heavy Industry | 208 | 1.0 | 39.5 | 8.000 | 10.113 | 30.7% |
| 4 Light Industry | 95 | 1.0 | 27.5 | 9.000 | 9.658 | 14.0% |
| 5 Health Care Industry | 38 | 2.0 | 44.0 | 9.500 | 11.934 | 5.6% |
| 6 IT Industry | 63 | 0.0 | 45.0 | 7.000 | 9.056 | 9.3% |
| 7 Other Services | 90 | 0.0 | 32.0 | 6.000 | 8.000 | 13.3% |
| Overall | 677 | 0.0 | 48.0 | 8.500 | 10.642 | 100.0% |
© 2017 by the authors. Licensee MDPI, Basel, Switzerland. This article is an open access article distributed under the terms and conditions of the Creative Commons Attribution (CC BY) license (http://creativecommons.org/licenses/by/4.0/).
Share and Cite
MDPI and ACS Style
Yang, Z.; Liu, W.; Sun, J.; Zhang, Y. Corporate Environmental Responsibility and Environmental Non-Governmental Organizations in China. Sustainability 2017, 9, 1756. https://doi.org/10.3390/su9101756
AMA Style
Yang Z, Liu W, Sun J, Zhang Y. Corporate Environmental Responsibility and Environmental Non-Governmental Organizations in China. Sustainability. 2017; 9(10):1756. https://doi.org/10.3390/su9101756
Chicago/Turabian StyleYang, Zhaojun, Weihao Liu, Jun Sun, and Yali Zhang. 2017. "Corporate Environmental Responsibility and Environmental Non-Governmental Organizations in China" Sustainability 9, no. 10: 1756. https://doi.org/10.3390/su9101756
Note that from the first issue of 2016, this journal uses article numbers instead of page numbers. See further details here.