Article

Measuring the Performance of Industrial Green Development Using a Non-Radial Directional Distance Function Approach: A Case Study of Jiangxi Province in China

1
Institute of Ecological Civilization, Jiangxi University of Finance and Economics, Nanchang 330013, China
2
Graduate School of Life and Environmental Sciences, University of Tsukuba, Tsukuba 305-8572, Japan
*
Author to whom correspondence should be addressed.
Sustainability 2017, 9(10), 1757; https://doi.org/10.3390/su9101757
Submission received: 30 August 2017 / Revised: 27 September 2017 / Accepted: 27 September 2017 / Published: 28 September 2017
(This article belongs to the Special Issue Sustainable Energy Development under Climate Change)

Abstract

:
The industrial sector is a major contributor to resource consumption and environmental pollution in China. The energy-intensive industrial development and energy structure are dominated by coal, which has produced an enormous amount of industrial pollutants in China, and put great pressure on the ecological environment. Hence, improving the performance of industrial green development (PIGD) has become an urgent task of utmost importance. This study applies a global non-radial directional distance function to estimate the PIGD for Jiangxi Province during 2003–2015, and provides targeted policy suggestions. The empirical results show a rising trend in the PIGD in Jiangxi Province. At the city level, Nanchang and Fuzhou performed considerably better than other cities in regards to their PIGD. However, the poor environmental performance caused by the excessive discharge of industrial pollutants has also hindered its PIGD. Most cities in Jiangxi Province failed to efficiently use resources, especially energy and labor, in industrial production. The results of the influencing factor analysis show that the performance of industrial green development in Jiangxi could be improved through increasing per capita GDP, decreasing the share of coal consumption in the total industrial energy consumption, and decreasing the share of industrial GDP in the total GDP. Furthermore, a more efficient use of environmental management investment funds and timely transfer of the surplus industrial labor are needed.

1. Introduction

China has achieved remarkable progress in industrial economic development since the reform and opening-up of the late 1970s. However, the great differences between regions in the development of industrial economy are not conducive to the balanced development of the country’s economy. After the successful implementation of two famous development plans (e.g., the Western Development program and Revitalizing the northeast old industrial base), the industrial sectors of the western and northeastern regions are catching up with that in the eastern region. In March 2004, Premier Wen Jiabao pointed out that industrial development in the central region should not be neglected, and implementation of the famous “Central rise” plan officially began [1]. As a result, the industrial development in China’s Jiangxi Province has enjoyed remarkable progress. According to the Jiangxi Statistical Yearbook 2016, the industrial gross domestic product (GDP) was as high as 619.8 billion yuan in 2015, accounting for more than 37 percent of the province’s GDP. The industrial sector has become the pillar of social and economic development in this province [2].
Jiangxi province is located in the southeast of China, and is composed of 11 cities (i.e., Nanchang, Jingdezhen, Pingxiang, Jiujiang, Xinyu, Yingtan, Ganzhou, Ji’an, Yichun, Fuzhou, and Shangrao, see Figure 1). As a traditional agricultural province, Jiangxi’s industrial economy is relatively backward compared with most of the other provinces in the central region (i.e., Henan, Hubei, Hunan, Anhui, and Shanxi). According to the China Statistical Yearbook 2016, in 2015, the industrial GDP in Jiangxi was only 111.1 billion US dollars, which was much lower than Henan’s 254.1 billion US dollars and Hubei’s 191.6 billion US dollars. In addition, the great benefits of industrial production activities have been accompanied by enormous resource consumption and serious environmental pollution [3]. In 2015, more than 50 million tons of standard coal equivalent (tce) of energy were consumed for the purposes of industrial production in Jiangxi Province. The energy-intensive industrial development and energy structure dominated by coal have produced an enormous amount of industrial pollutants, which pose a great threat to the ecological environment. Almost all of the cities in Jiangxi have frequently suffered environmental pollution incidents [4,5]. As shown in Figure 2, the high levels of the three typical industrial pollutants—industrial wastewater, industrial SO2, and industrial solid waste—have remained stable, and have shown no downward trend since 2003. As Albrizio et al. (2017) pointed out, focusing on the economic benefits of industrial development and neglecting environmental protection is not a wise choice; it is an unsustainable endeavor that inevitably leads to disastrous consequences [6]. Further, transitioning to a green economy was recognized by the Chinese central government as an important long-term strategy [7,8]. In this context, achieving green industrial development in Jiangxi Province has become an urgent task [9,10,11].
Fortunately, the local government of Jiangxi Province has already started to pay attention to this problem and attempted to take effective measures [12,13]. Many policies have been issued in recent years that aim for a more effective use of industrial resources and address excessive industrial pollution. An example of such policies is the “Regulations of Jiangxi Province for the Prevention and Control of Environmental Pollution” from December 2000, which pointed out the necessity and urgency of air pollution, water pollution, and solid waste pollution control in Jiangxi Province. In addition, the “Notice of Jiangxi Water Pollution Prevention and Control Plan” and “Regulations on Prevention and Control of Atmospheric Pollution in Jiangxi Province,” which were launched in 2015 and 2016, respectively, provided detailed arrangements for pollution control missions in Jiangxi Province. However, many previous environmental policies have not proven effective. A possible reason is that industrial development varies by city and policy makers may not be aware of regional differences [14]. Therefore, it is of utmost importance to assess the sustainability of industrial development at the provincial and city levels for Jiangxi Province in order to provide appropriate and targeted countermeasures [15].
Regarding the research methods for estimating the sustainability of industrial development, many related studies employed approaches based on multi-index analysis (e.g., the analytic hierarchy process (AHP) approach, the principal component analysis [PCA] approach, or the distance function approach), which incorporate a multitude of representative indicators. As Xie and Wang (2015) pointed out, the AHP and PCA approaches are unsuitable for the task, because the value of weights in the AHP method is determined by subjective scoring, and the dimension reduction in PCA is accompanied by information compression [16]. In contrast, the distance function approach has the advantage of not needing to set parameter weights and compress data information [17]. In particular, there are two main approaches to estimate the distance function: the non-parametric data envelopment analysis (DEA) approach and the parametric approach. A major advantage of the DEA approach over the parametric method is that a specific functional form describing the underlying technology is not required [18].
Several studies evaluated the sustainability of industrial development in Jiangxi Province. He and Wu (2013) estimated the competitiveness of industrial sectors for 11 cities in Jiangxi Province [19]. Zhou et al. (2016) applied an AHP approach to assess the industrial development in this province. Attempting an improved estimation approach [20], Huang et al. (2016) estimated the efficiency of industrial development based on a radial directional distance function (DDF) approach, which takes industrial pollutants into account, for example, industrial wastewater and industrial SO2 [21]. However, the estimation using the radial DDF approach is based on contemporaneous benchmark technology, and the technologies over the years are evidently different. Thus, the estimation results cannot be compared over time. In addition, the major drawback of the radial DDF approach is that it aims to expand the good outputs and contract the bad outputs at the same rate. This is inconsistent with the actual production process, and often leads to many observations under evaluation having the same efficiency value of unity, thus hindering the ranking of observations [22,23]. Therefore, this paper aims to apply a global non-radial directional distance function (GNDDF) approach to analyze the dynamic changes in the performance of industrial green development (PIGD) for Jiangxi Province at the city level in 2003–2015. We further decompose the PIGD into two indicators, i.e., the economic performance of industrial development (ECPID) and the environmental performance of industrial development (ENPID) to explore which one is the main driver of the growth in the PIGD. Lastly, we explore the impacts on the PIGD of energy utilization, industrial development, and environmental management in Jiangxi’s industry to present some policy implications to raise the PIGD.
This study’s contribution to the current literature is threefold. First, we present an empirical analysis of PIGD in Jiangxi Province. We employ a GNDDF approach, which envelops all of the contemporaneous benchmark technologies over the period under study, and estimates results for different years that are comparable with each other. Second, we decompose the PIGD into two indicators: ECPID and ENPID, which refer to the economic performance and the environmental performance of industrial development, respectively, to identify the main driver for the growth of the PIGD. Therefore, we can determine whether the economic performance or the environmental performance of industrial development is more urgent to improve in each city in Jiangxi. Third, based on slack variable analysis, we propose effective countermeasures to improve the PIGD in Jiangxi Province and its 11 cities. Lastly, we select relative factors from among the social and economic aspects, explore their impact on the PIGD by using a panel regression model, and present some policy implications. The following questions are addressed in this study.
(1)
What is the overall situation and dynamic change of the PIGD for Jiangxi Province? Are there obvious regional differences? Which one of the two decomposition indices of the PIGD is the main driver of the growth of the PIGD?
(2)
What are the effective strategies for raising the PIGD?
The remainder of this paper is organized as follows. Section 2 introduces the GNDDF approach and materials. Section 3 presents the empirical results, and Section 4 concludes with a discussion on policy implications and the study’s limitations.

2. Materials and Methods

2.1. Global Non-Radial Directional Distance Function (GNDDF)
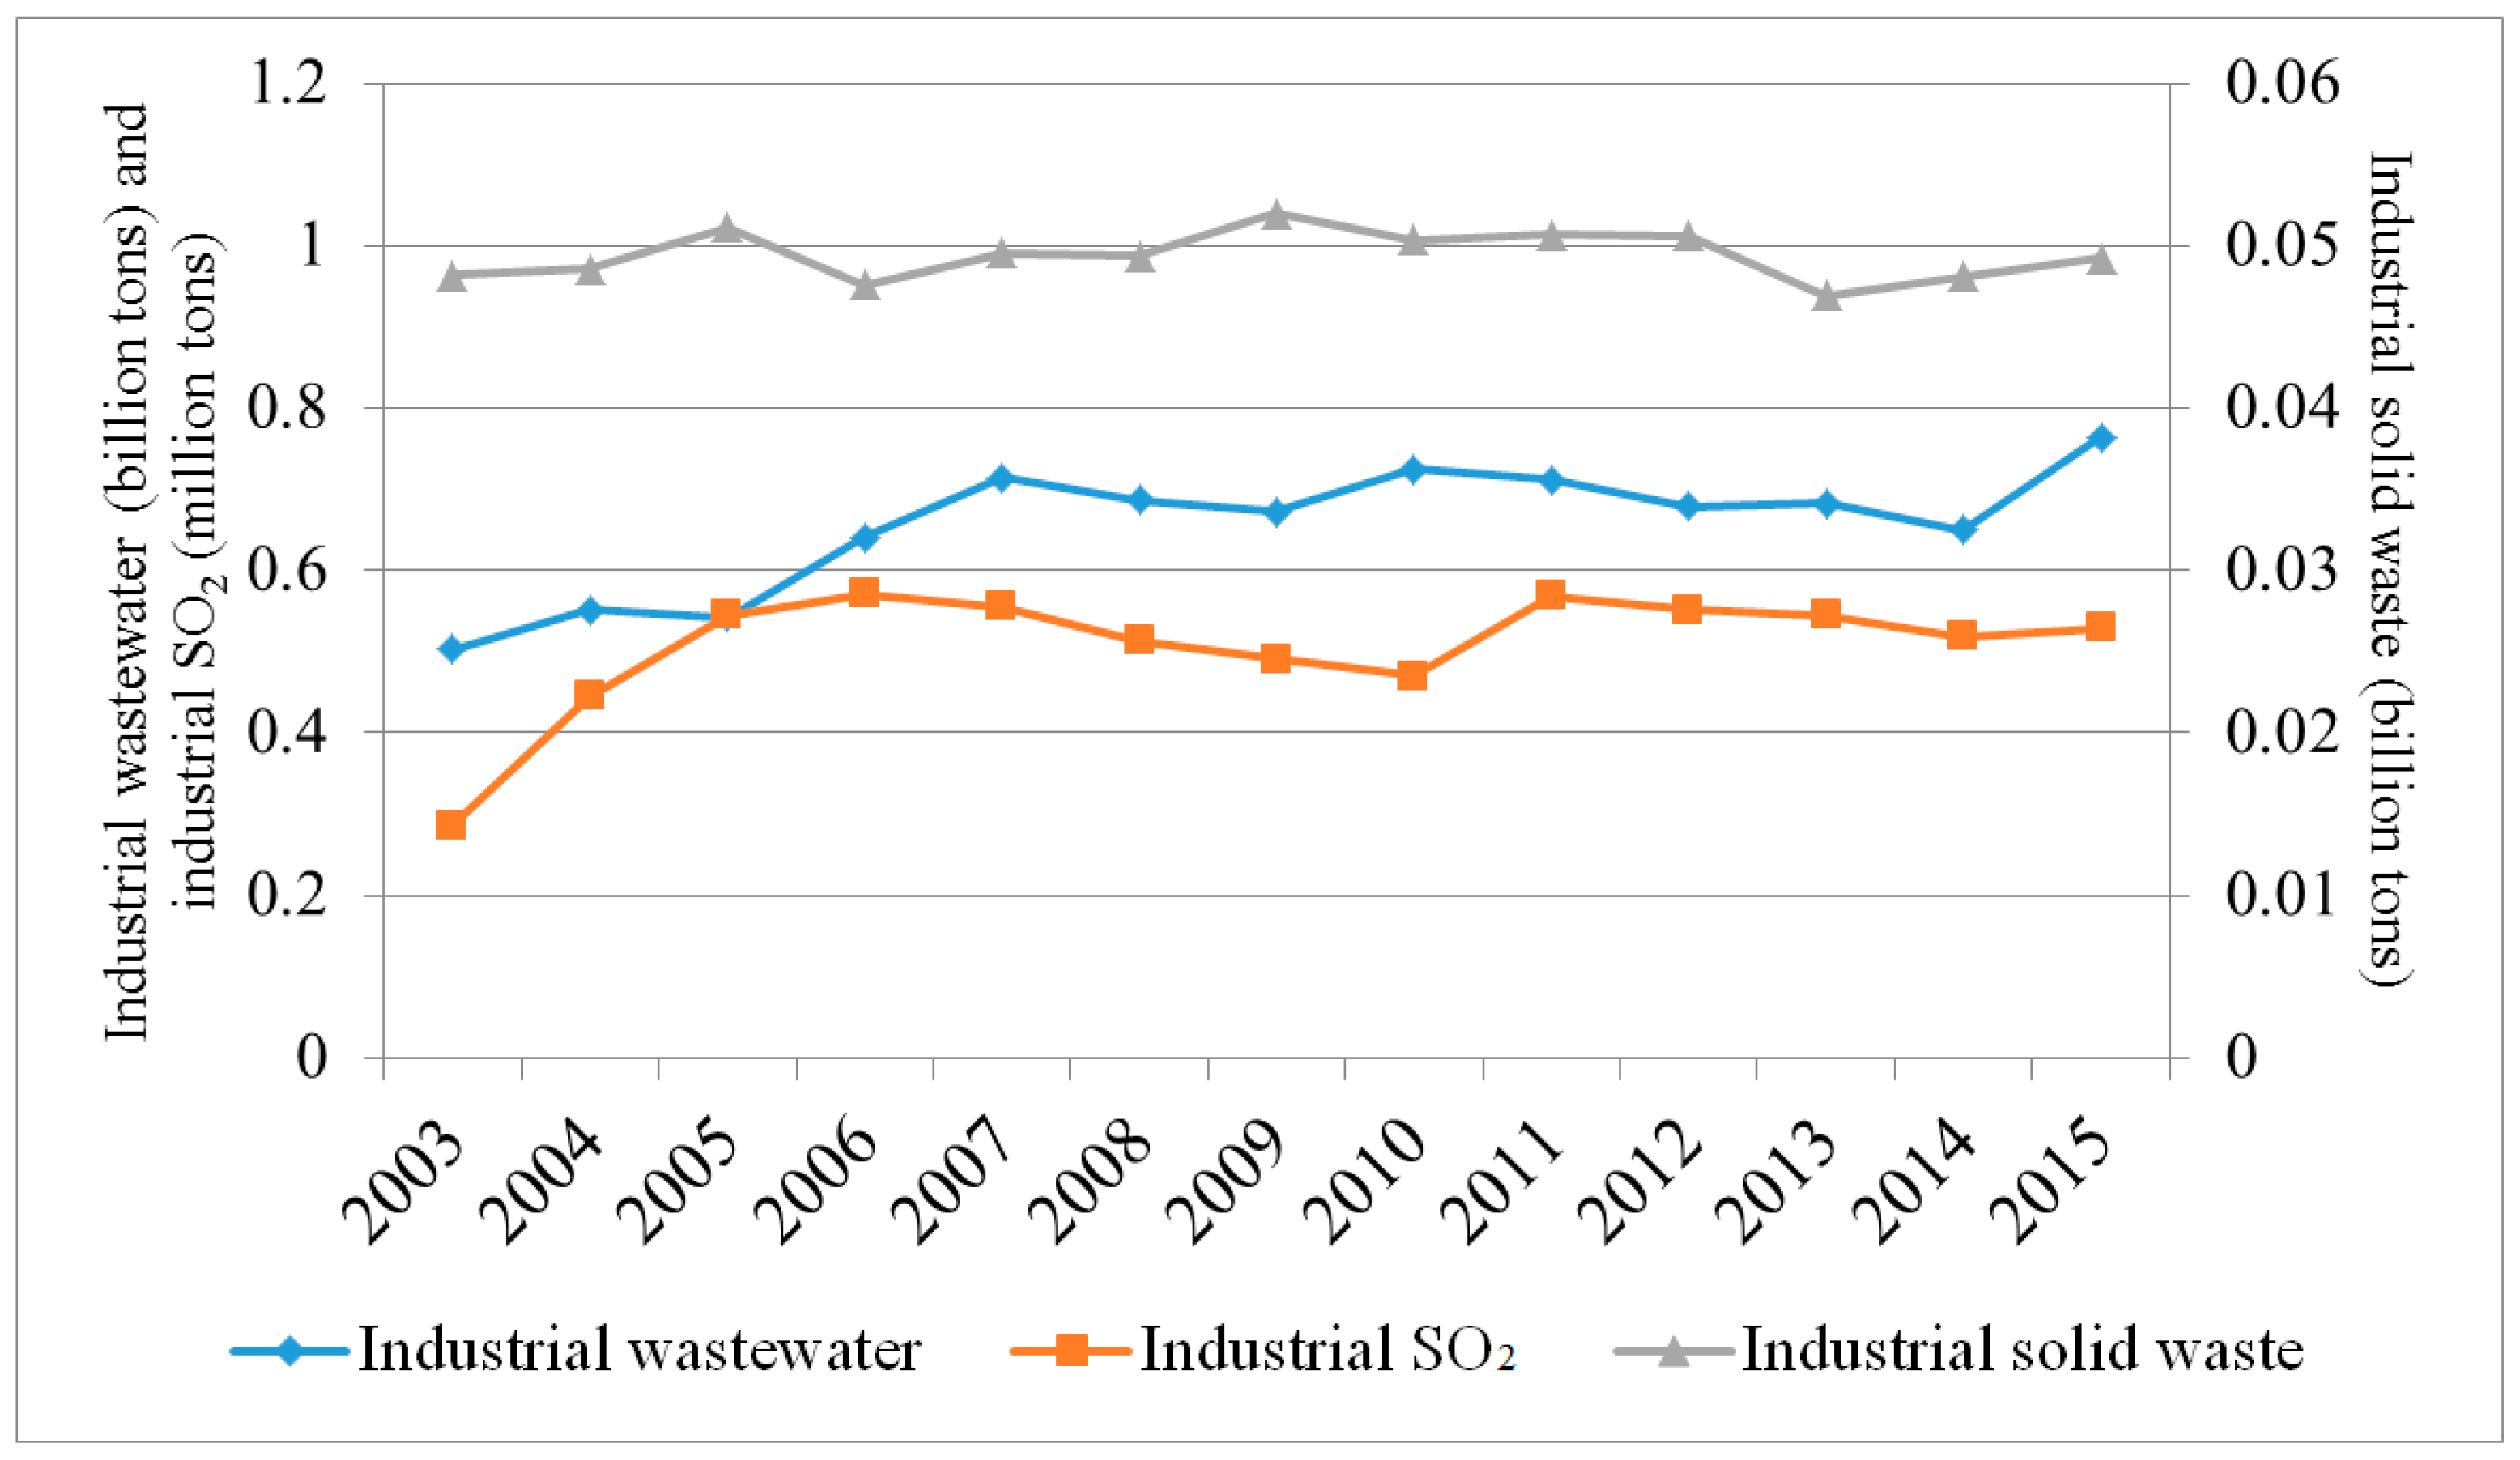
We assume that each of the 11 cities in Jiangxi Province has M inputs (x) to produce J desirable outputs (y) and K undesirable outputs (b). Therefore, each city can use input vector x ϵ R + M to jointly produce output vector y ϵ R + J and undesirable output b ϵ R + K . The production possibility set T(x) can be expressed as follows:
T ( x ) = { ( x , y , b ) x   c a n   p r o d u c e ( y , b ) }
where the production possibility set T(x) is assumed to satisfy the production function theory [24]. The theory states that it is costly to reduce the undesirable outputs during the production process, and industrial production inevitably produces pollutants. In addition, the traditional radial DDF approach assumes that the solution of the linear program reduces the inputs (or undesirable outputs) and expands the outputs at the same rate, denoted as β in Equation (2), where g = ( g x , g y , g b ) is the direction vector [25]:
D ( x , y , b ;   g ) = sup { β : ( ( x , y , b ) + g × β ) T }
Equation (3) represents the non-radial DDF approach, and w T = ( x , y , b ) T is the standard weight matrix of inputs and outputs. β = ( β x , β y , β b ) refers to the adjustment ratios of all the inputs, outputs, and undesirable outputs, thus, they are non-negative numbers. diag denotes the diagonal matrix.
D ( x , y , b ;   g ) = sup { w T β : ( ( x , y , b ) + g × d i a g ( β ) ) T }
Thus, the adjustment ratios of all of the inputs and outputs may be different, which is consistent with actual production. Equation (4) provides the linear programming functions for the global non-radial DDF approach. We select industrial energy, industrial capital, and industrial labor used for industrial production as inputs; industrial GDP as desirable output; and industrial wastewater, industrial SO2, and industrial solid waste as undesirable outputs.
D ( x , y , b ;   g ) = max ( w E β E + w K β K + w L β L + w Y β Y + w W β W + w S O 2 β S O 2 + w S β S ) s . t . { t = 1 T n = 1 N λ n E n ( 1 β E ) E 0 , t = 1 T n = 1 N λ n K n ( 1 β K ) K 0 , t = 1 T n = 1 N λ n L n ( 1 β L ) L 0 , t = 1 T n = 1 N λ n Y n ( 1 + β Y ) Y 0 , t = 1 T n = 1 N λ n W n = ( 1 β W ) W 0 , t = 1 T n = 1 N λ n S O 2 n = ( 1 β S O 2 ) S O 2 0 , t = 1 T n = 1 N λ n S n = ( 1 β S ) S 0 , β E 0 , β K 0 , β L 0 , β Y 0 , β W 0 , β S O 2 0 , β S 0 , n = 1 , 2 , , N ; t = 1 , 2 , , T ; λ n 0 , n = 1 N λ n = 1 ,
where subscripts E, K, and L represent the energy, capital, and labor used in industrial production, respectively. Y refers to industrial GDP. W, SO2, and S represent industrial wastewater, industrial SO2, and industrial solid waste, respectively. N refers to the number of cities and in this paper, N = 11. T refers the number of years in the study period; in this paper, T = 13. The subscript 0 represents the city being evaluated. Symbols β E , β K , β L , β W , β S O 2 , and β S denote potential reduction ratios of industrial energy, industrial capital, industrial labor, industrial wastewater, industrial SO2, and industrial solid waste, respectively. β Y is the potential expanded ratio of industrial GDP. Symbols w E , w K , w L , w Y , w W , w S O 2 , and w S denote the standard weight matrices of industrial energy, industrial capital, industrial labor, industrial GDP, industrial wastewater, industrial SO2, and industrial solid waste, respectively. Symbols E 0 , K 0 , L 0 , Y 0 , W 0 , S O 2 0 , and S 0 denote the original data of the corresponding input indices. λ n is a non-negative vector representing the intensities assigned to each observation in constructing the production technology, and we impose the constraint n = 1 N λ n = 1 , assuming variable returns to scale. The subscript n refers to the number of cities in the sample. The PIGD can be defined as follows:
P I G D = 1 ( β E * + β K * + β L * + β W * + β S O 2 * + β S * ) / 6 1 + β Y *
where β E * , β K * , β L * , β W * , β S O 2 * , β S * , and β Y * are the optimal solutions for inputs and outputs for the city being evaluated. The city is located along the environmental production technology frontier in the g direction if β E * , β K * , β L * , β W * , β S O 2 * , β S * , and β Y * equal zero. To provide further insight into the dynamic change of the PIGD, we define the ECPID by subtracting economic factors from unity as follows:
E C P I D = 1 β E * + β K * + β L * 3
Similarly, we can define the ENPID as follows:
E N P I D = 1 β W * + β S O 2 * + β S * 3
It is obvious that the values of the three indicators lie between 0 and 1. The city has achieved sustainability in industrial performance if the value of the PIGD equals 1. The economic performance of the city’s industry is efficient if the value of the ECPID equals 1, and the environmental performance of its industry is efficient if the value of the ENPID equals 1.

2.2. Data

2.2.1. Input Indicators

In line with previous studies, we select industrial energy, industrial capital, and industrial labor as input indicators. Energy consumption refers to the primary energy consumption in industrial production activities, and is mainly composed of several typical types of energy, such as coal, oil, and gas, and the data are sourced from the China Energy Statistics Yearbook (2004–2016) [9]. Industrial labor refers to the workers in the industrial sectors, and the data of industrial labor are sourced from the China Statistical Yearbook (2004–2016). Industrial capital data could not be obtained from the China Statistical Yearbook. Thus, we compute the data using the perpetual inventory method following Zhang and Kim (2014) [26]:
K t = ( 1 δ ) K t 1 + I t
where Kt and Kt−1 refer to industrial capital stock at times t and t−1, respectively. It represents the investment in industrial fixed assets, and δ refers to the depreciation rate at time t. We use the industrial capital stock in 2003 as the initial industrial capital stock, because 2003 is the first year in our study. The investment in industrial fixed assets and the depreciation rate can be obtained from the China Statistical Yearbook 2004–2013. The depreciation rate and capital stock values were procured from Wu (2007) [27]. Data after 2006, which were not available, were estimated using the perpetual inventory method. To eliminate the effect of price factors, the industrial GDP is converted to 2003 constant prices using the GDP deflator index, and the industrial capital is converted to 2003 constant prices using the industrial capital deflator index, the data of the GDP deflator index and the industrial capital deflator index can be collected from the China Statistical Yearbook (2004–2016) [28].

2.2.2. Output Indicators

We select industrial GDP as the desirable output, and the amount of industrial wastewater, industrial SO2, and industrial solid waste as the undesirable outputs. Data of the four output variables are sourced from the China Statistical Yearbook (2004–2016). Table 1 reports the descriptive statistics of the input and output variables.

2.3. Influencing Factors

To propose effective advice for improving the PIGD, we selected several typical influencing indicators. To overcome the heteroscedasticity problem, the regression model can be expressed in logarithmic form as follows [29]:
Y i t = α i t + β 1 ln ( PGDP i t ) + β 2 ES i t + β 3 ln ( INV i t ) + β 4 IS i t + β 5 LS + ε i t
where i and t (t = 2003, ..., 2015) refer to the ith city and year t, respectively. The term εit is the random error term. Y denotes the PIGD. We describe the data in more detail below.
(1)
We selected per capita GDP (PGDP) to represent the level of economic development in the city of interest. In general, a greater PGDP makes sustainable development of the industrial economy more likely. This is because a city with a relatively higher PGDP pays more attention to the quality of industrial economic development, and does not focus solely on the scale of the industrial economy [30]. Therefore, we assume a positive correlation between PGDP and PIGD; an increase in the PGDP is expected to have a positive impact on the PIGD.
(2)
We selected energy structure (ES), referring to the share of coal in the total energy consumption used for industrial production, to represent the status of industrial energy consumption. It is generally accepted that coal combustion produces significantly more pollutants than many other types of energy sources, and substituting clean energy for coal promotes protection of the ecological environment [31]. According to the China Energy Statistics Yearbook, coal accounted for more than 90% of industrial energy consumption in Jiangxi Province in recent decades; such a state of affairs is clearly not conducive to sustainable industrial development. We assume that decreasing the share of coal in the total energy consumption used for industrial production contributes to improving the PIGD; an increase in the ES is thus assumed to have a negative impact on the PIGD.
(3)
We selected investment in environmental pollution management (INV) to represent the government’s regulation of industrial pollution. This is because many previous studies have found that the government’s investment in environmental management plays an important role in preventing industrial pollution [32,33]. A possible reason is that more investment in environmental protection technology and management may positively affect sustainable industrial development through energy savings and the reduction of industrial pollutants [34,35]. In fact, the investment in environmental pollution management was formally established in 1980s, and the management of industrial pollution is one of its important goals, e.g., the management of industrial pollution sources and reuse of industrial wastewater. The environmental pollution control work in China has always been initiated by the central government and operated by local governments, and the local governments are expected to use the environmental pollution control investment effectively by quickly identifying and dealing with local pollution incidents [36]. Therefore, we assume that an increase in investment in environmental management has a positive impact on the PIGD.
(4)
We selected two indices—the share of industrial labor in the total labor (LS) and the share of industrial GDP in the total GDP (IS)—to represent the current industrial structure. The problem of surplus labor in the industrial sector is common in China, and Jiangxi is no exception. Most industrial enterprises are labor-intensive and engaged in low-tech production activities because of cheap labor. This inevitably impedes the large-scale use of new technologies and industrial upgrading, and negatively affects the PIGD [37]. Further, many studies suggested that China had entered a middle or late stage of industrialization, which implyies that China’s industrial development will shift from a simple emphasis on economic output to improvements in the quality of industrial development [38]. This might lead to a reduction of the IS. Thus, we assume that an increase in both the LS and IS has a negative impact on the PIGD.
Data of PGDP, INV, IS and LS is obtained from the China Statistical Yearbook 2004–2016, and data of ES is obtained from the China Energy Statistics Yearbook 2004–2016. Table 2 shows the descriptions of the influencing indicators on the PIGD.

3. Results and Discussion

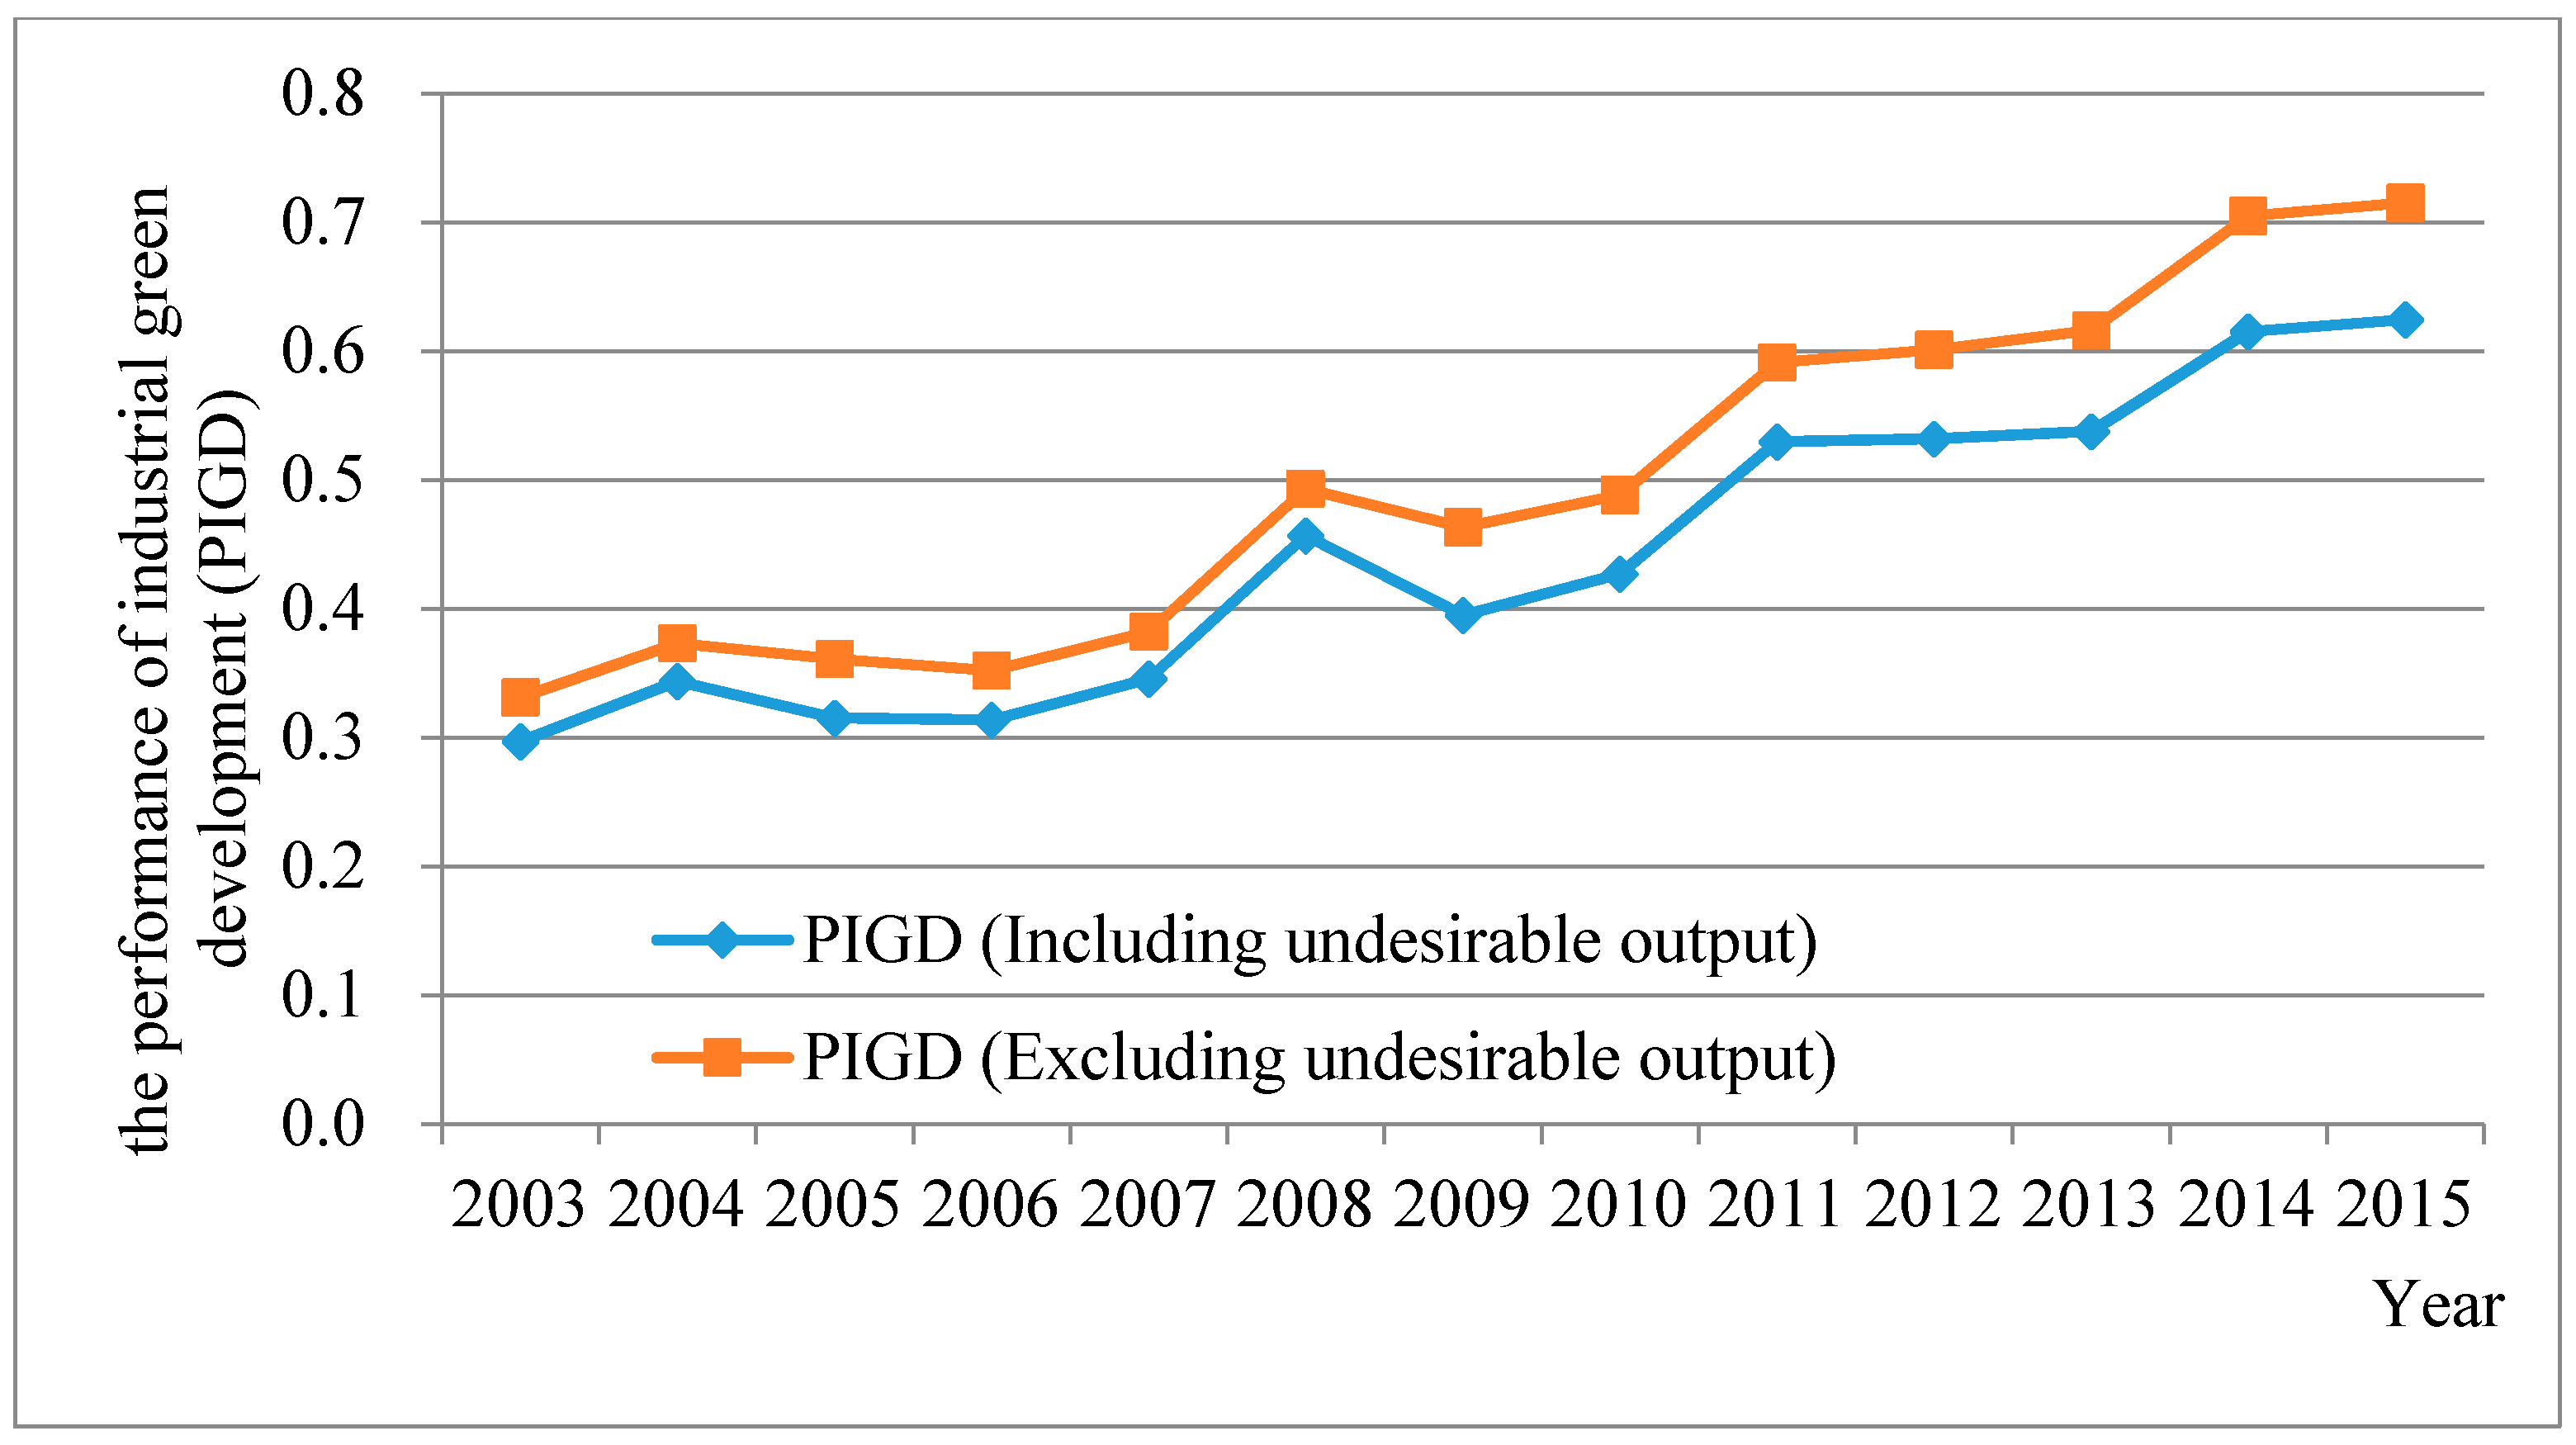
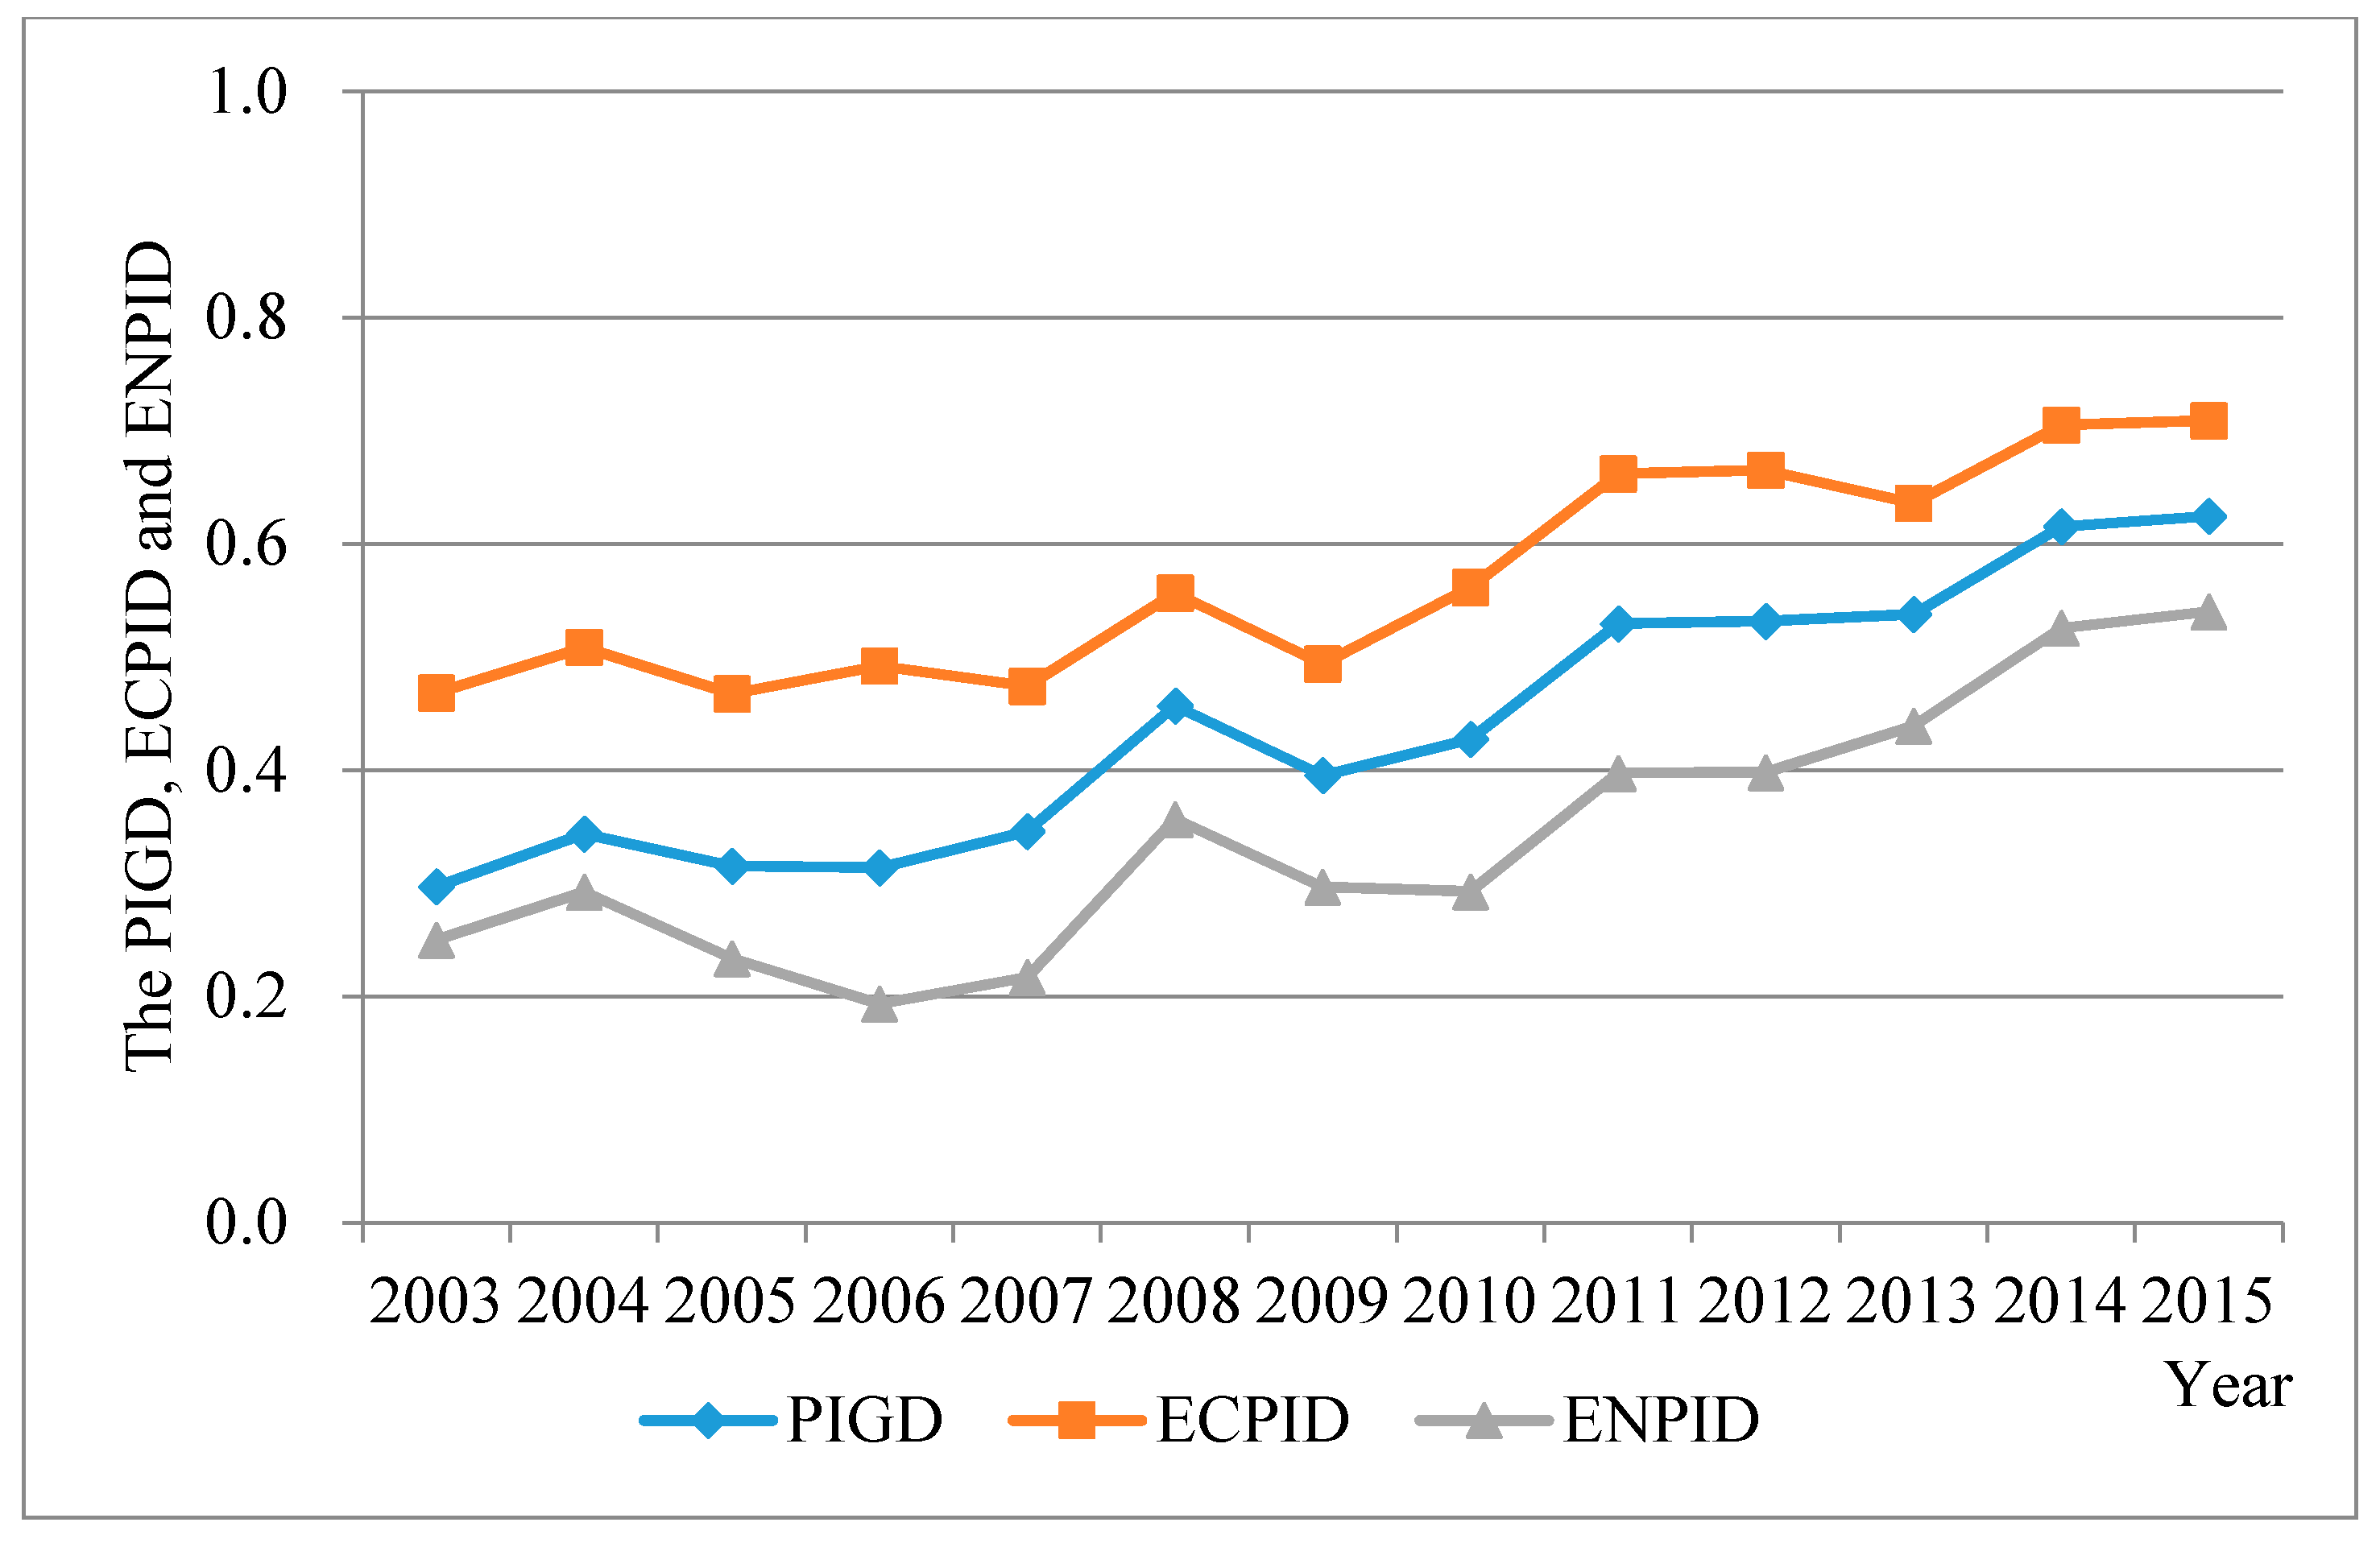
3.1. The PIGD and Its Decomposition Indicators

Based on the GNDDF approach, we computed the PIGDs for Jiangxi Province and its 11 cities during 2003–2015 (Figure 3). For comparison, we also present the results excluding undesirable outputs. As shown in Figure 3, in each year of the period under study, the estimation result including undesirable outputs is lower than the result not accounting for undesirable outputs, with average values of 0.441 and 0.498, respectively. This indicates that ignoring the undesirable outputs would inevitably lead to overestimating the efficiency of industrial development, which is consistent with the conclusion of Ozkan and Ulutas (2017) [39]. Further, the PIGD values show a sustained rising trend, except for in 2006 and 2009. The decline in 2006 may due to the environmental pollution caused by the massive discharge of industrial pollutants, as shown in Figure 2. Both industrial waste and industrial sulfur dioxide emissions have significant upward trends around 2006, which lowers the environmental performance of industrial development. The decline in 2009 may has been caused by the international financial crisis around 2008, which had a serious negative impact on industrial development in Jiangxi Province. Excessive emphasis was put on selected sectors of the heavy industry, while the monitoring and implementation of environmental policy were temporarily suspended in favor of the economic stimulus plan [40]. The result was inefficient industrial production and poor environmental protection, which was reflected in the relatively poor performance, as measured by the PIGD [41].
To gain further insight into the dynamics of the PIGD, it is necessary to estimate its two decomposition indicators, the ECPID and ENPID, and identify which is the main contributor to the increase in the PIGD (Figure 4). We find that both the ECPID and ENPID follow similar trends to the PIGD. The ECPID is greater than the ENPID each year, and the PIGD value lies between them. The average values of the PIGD, ECPID, and ENPID are 0.441, 0.569, and 0.341, respectively. Thus, an increase in the PIGD is mainly driven by the ECPID, and poor environmental performance hinders sustainable industrial development in Jiangxi Province. This implies that the great benefits of industrial production in Jiangxi Province are accompanied by serious environmental pollution, and improving the ecological environment can effectively raise the PIGD. This is consistent with the conclusion of Wan et al. (2017) [42], who stated that environmental problems caused by industrial development deserve more attention than issues of economic development. Therefore, the most important issue of industrial development in Jiangxi province is to achieve environmentally friendly industrial production through various effective ways, e.g., develop new energy saving and environmental protection technologies.
At the city level, as shown in Figure 5, Fuzhou performed best, with an annual average PIGD value of 0.831, annual average ECPID of 0.916, and annual average ENPID value of 0.745. It is followed by Nanchang, with the values 0.749, 0.817 and 0.674, respectively. However, the other nine cities in the province performed significantly worse, as measured by all three indicators. Jiujiang performed the worst, with the lowest annual average PIGD value of 0.26 and annual average ENPID value of only 0.178, and Yingtan had the lowest annual average ECPID value (0.391).
In summary, none of the 11 cities in Jiangxi Province achieved sustainable industrial development. Poor performance concerning the ecological environment is the main reason. Thus, countermeasures aimed at reducing industrial pollution emissions and preventing environmental pollution need to be implemented as soon as possible. In addition, the local government of Jiangxi Province should mitigate regional disparity in sustainable industrial development.

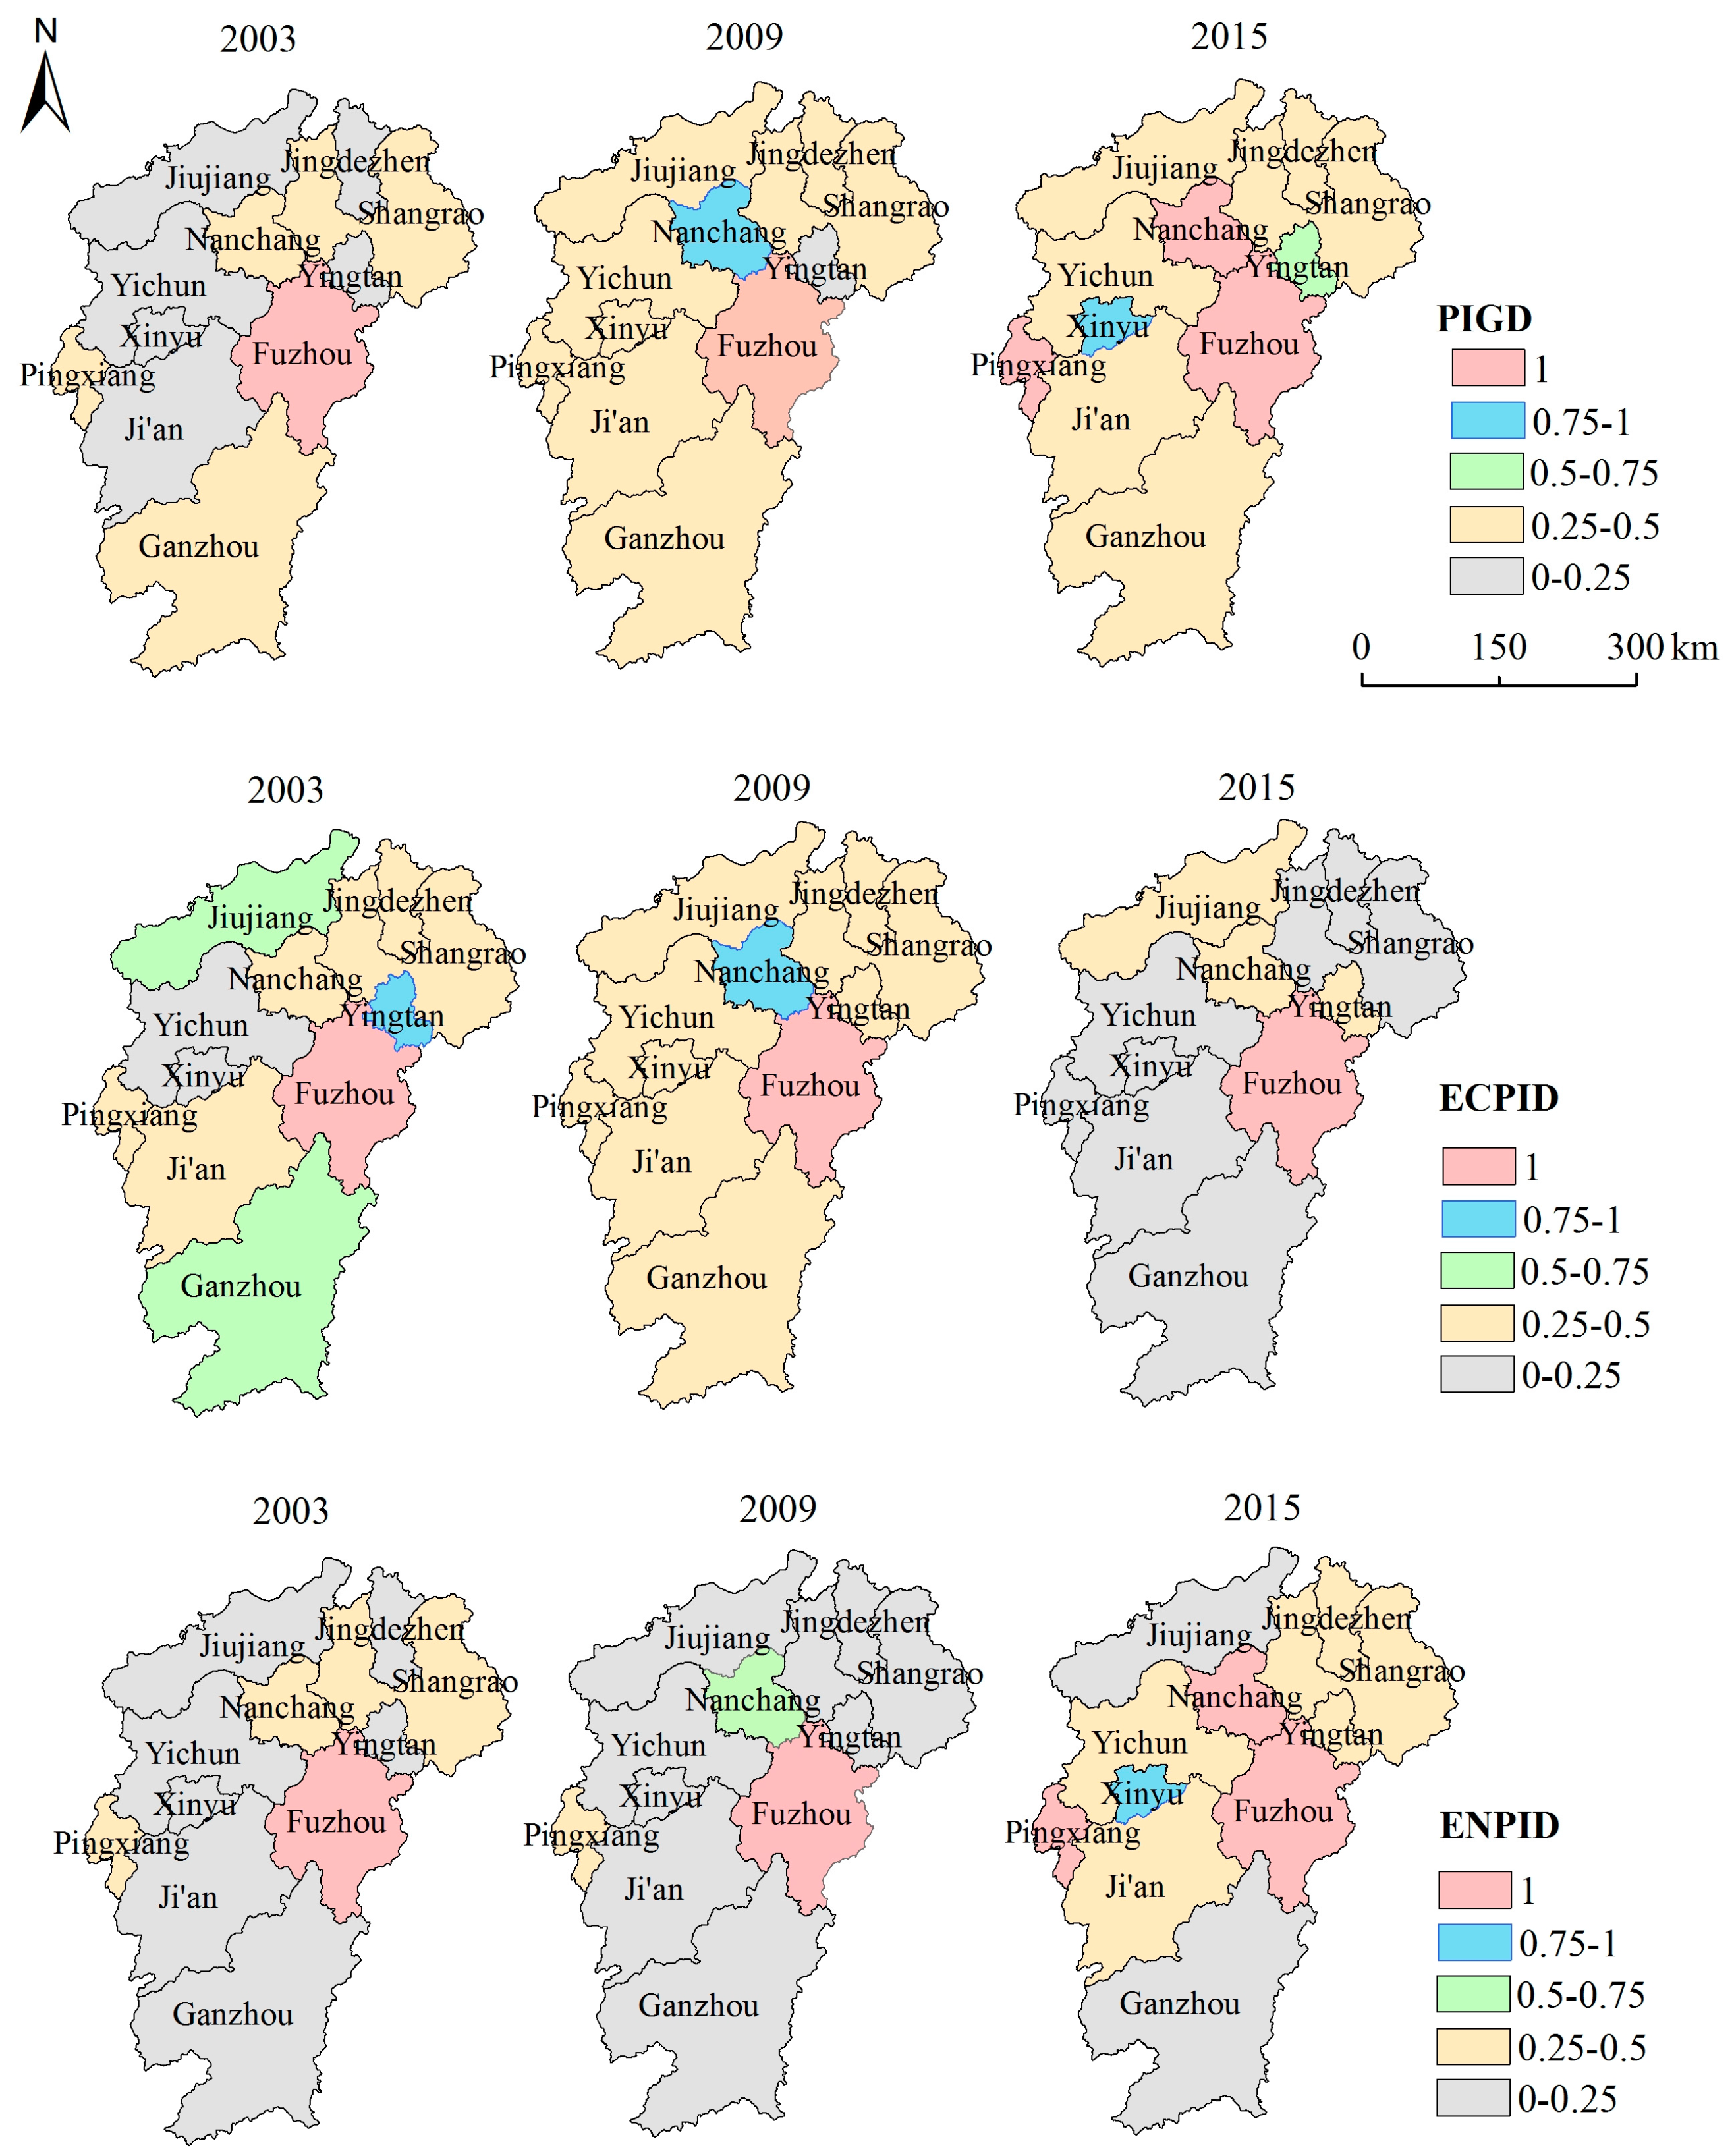
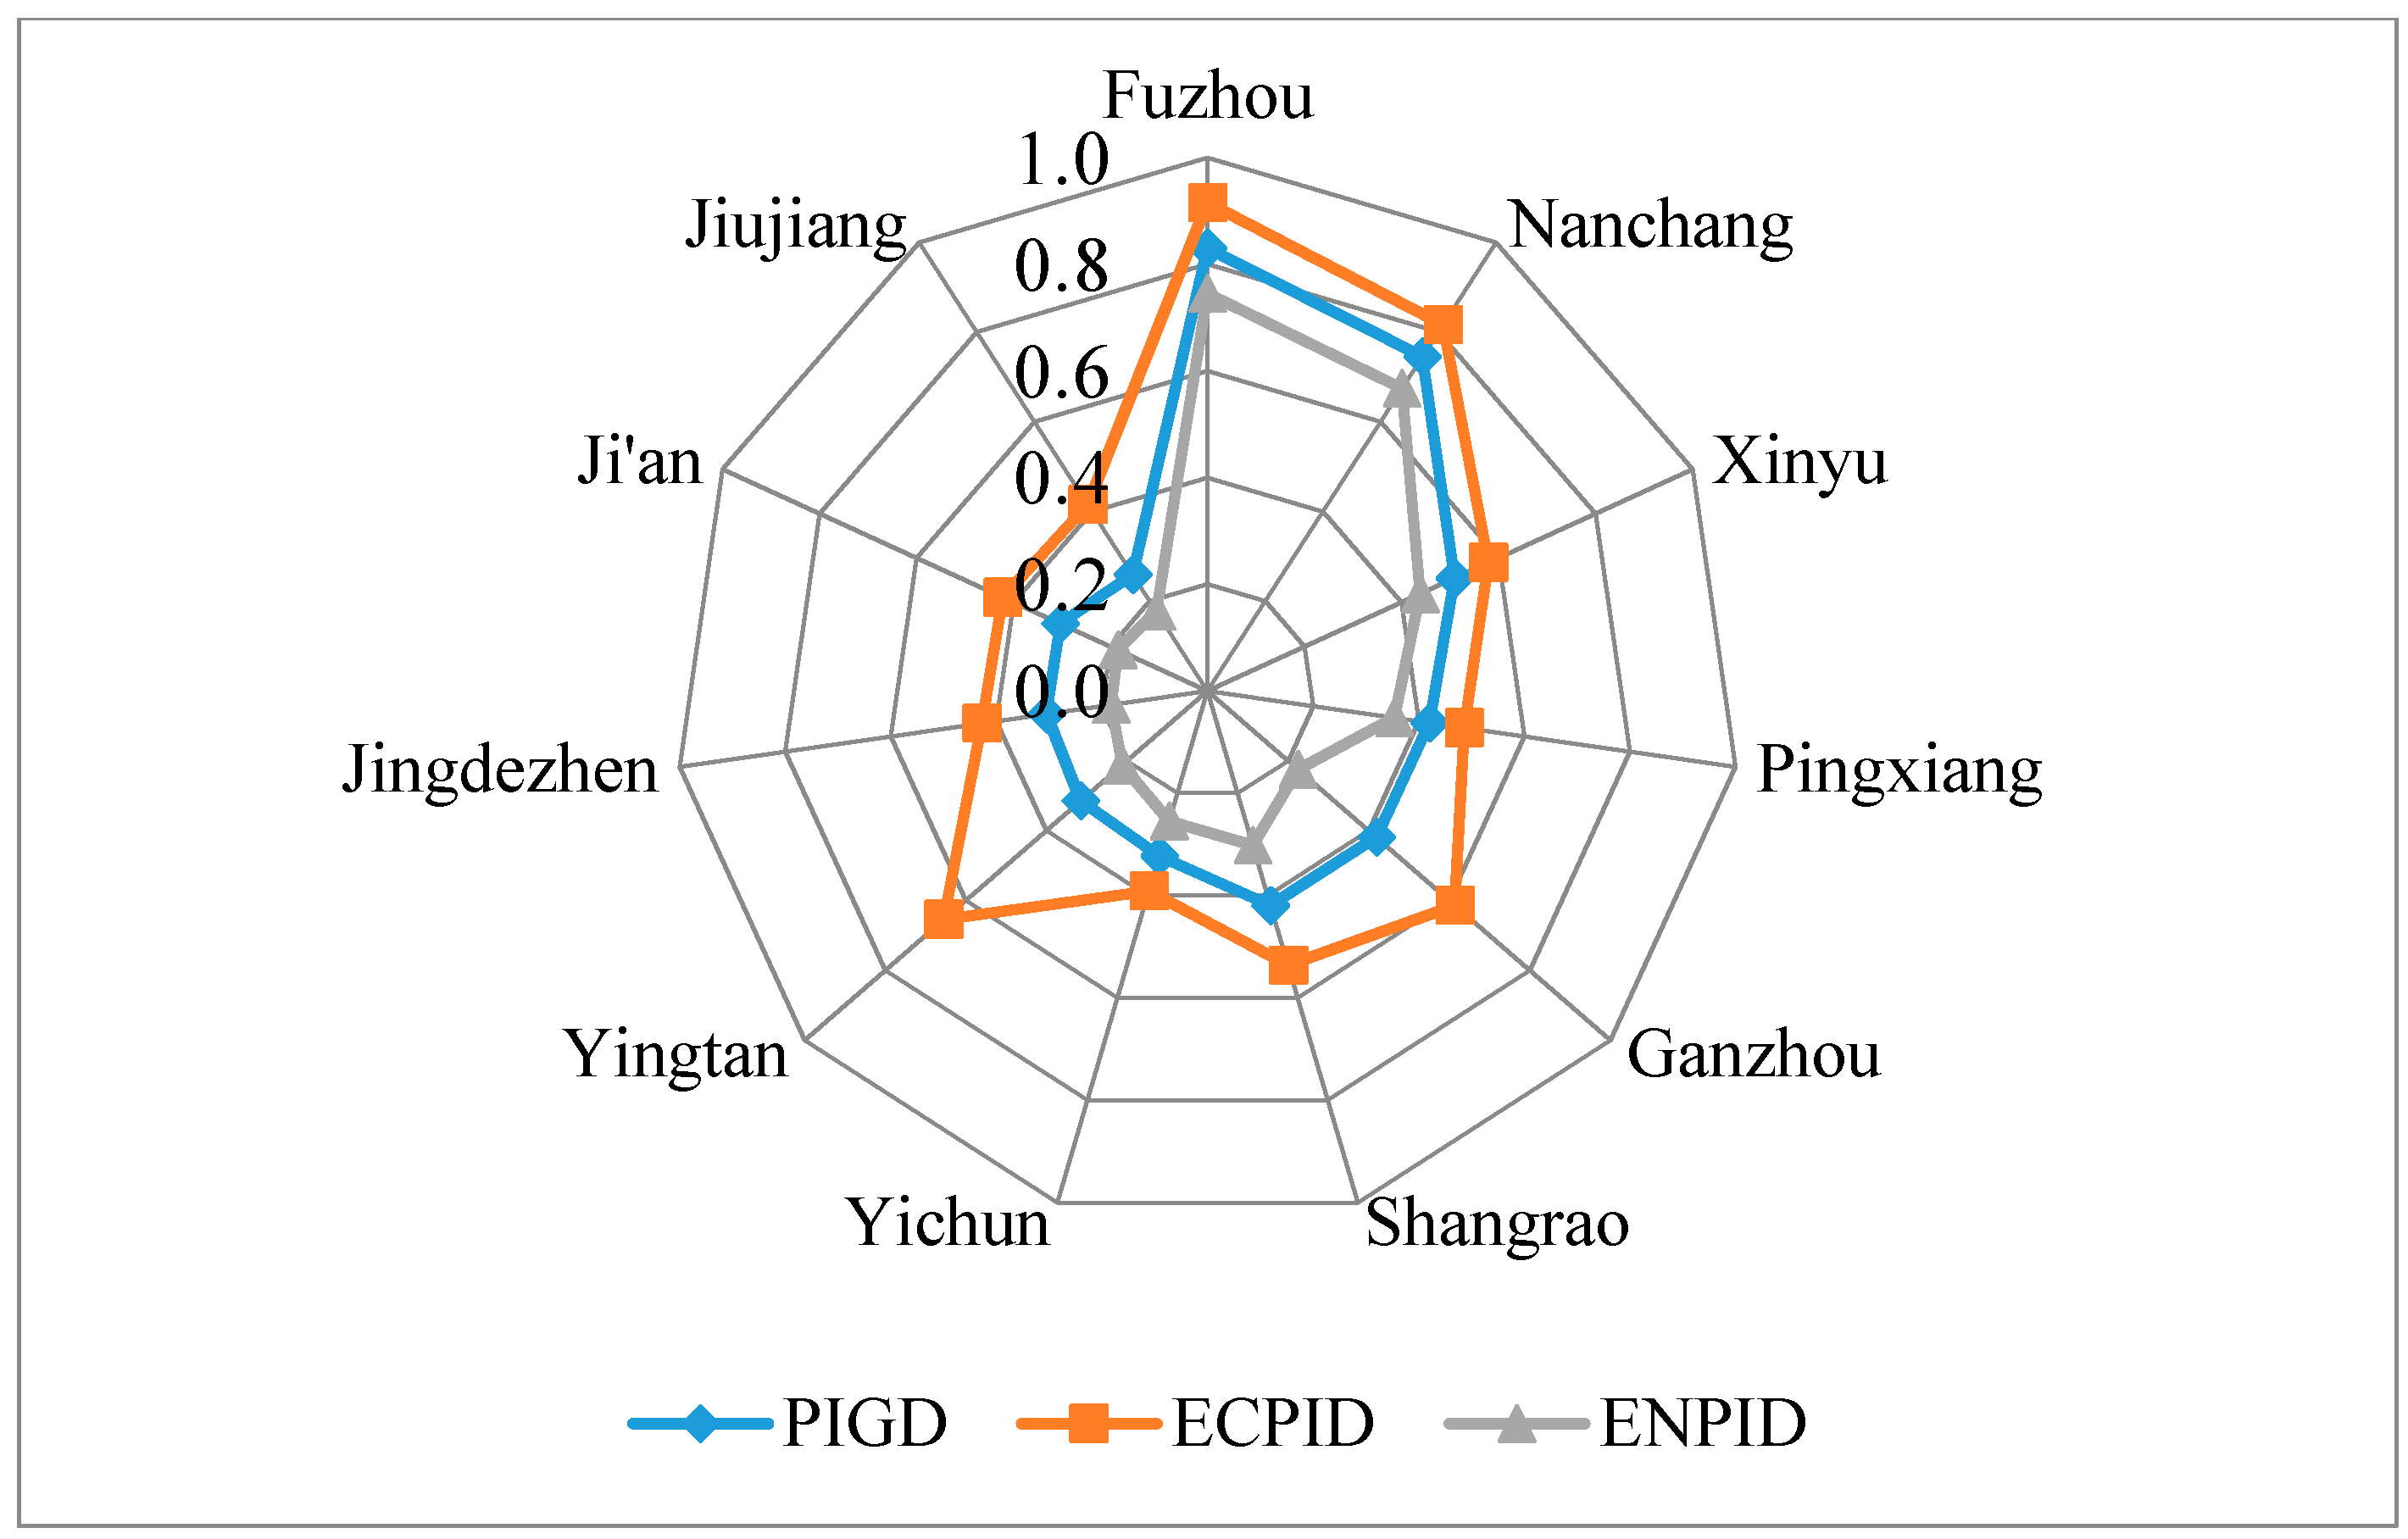
3.2. Spatio-Temporal Pattern of PIGD and Its Decomposition Indicators

To supplement the general trends of PIGD and its decomposition indicators in Jiangxi Province during 2003–2015, this study explored the spatio-temporal pattern of PIGD and its decomposition indicators in the three representative years of 2003, 2009, and 2015. As shown in Figure 6, the PIGD and its decomposition indicators have increased significantly for most cities in the three years. In addition, the ECPIDs are much greater than ENPIDs for most cities in the three years, which further confirm that the relatively low ENPID hinders the improvement of PIGD, and environmental protection against industrial pollution deserves more attention. Out of the 11 cities, Fuzhou is the only city that achieved sustainability in industrial performance, with the values of 1 in all three years. In addition, most cities have improved its PIGD, and three cities achieved sustainability in industrial performance in 2015, i.e., Fuzhou, Nanchang, and Pingxiang. Similar results appeared in the ENPID. As for the ECPID, Fuzhou is the only city that achieved perfect economic performance of industrial development. This may be because the consumption of industrial resources in Fuzhou and Pingxiang are relatively small compared with those of other cities, though the industrial economies in these two cities are not very large, and the volumes of industrial pollutants in Fuzhou and Pingxiang are much smaller than those in other cities. In fact, many high-tech industrial parks have been established in Fuzhou and Pingxiang recently, which has made a great contribution to improving the quality of local industrial development. Additionally, Nanchang enjoys the largest industrial economy in Jiangxi Province, which accounts for about a quarter of the industrial GDP in this province [43], and as the capital city of Jiangxi Province, Nanchang enjoys obvious advantages compared with other cities in many aspects (e.g., policy, technology, and talent) [44]. However, the PIGDs for Shangrao and Ganzhou have not made significant progress, nor have its decomposition indicators. This may be because the industrial economic development of the two cities has not made obvious progress, and more importantly, the discharges of industrial pollutants in these two cities are much larger than those in other cities. In summary, cities with larger industrial economies, less resource consumptions, and less pollutant discharges tend to have better performance in the PIGD.

3.3. Optimization of the PIGD

Equation (4) shows that if the PIGD value is less than 1, the city under estimation has not achieved sustainable industrial development. To examine the reasons for this, and be able to suggest improvements, we can analyze the slack variables from the model. Table 3 shows the excesses of inputs and undesirable outputs and shortages of desirable outputs, which inform us about the direction of PIGD optimization.
In view of the overall situation for Jiangxi Province, the excess ratio of industrial energy, which is as high as 62.51%, ranks first from among all three input indicators. It is followed by industrial labor and industrial capital, whose excess ratios are 52.03% and 20.92%, respectively. This implies unreasonable energy allocation and utilization, as well as a severe labor surplus in the industrial sector in Jiangxi Province. Hence, more attention needs to be paid to these issues, and effective countermeasures need to be taken to save energy, labor, and capital in future industrial production. Some of these countermeasures can include, using energy-saving production equipment, improving energy utilization technology, transferring surplus labor to the tertiary industry sectors, and optimizing capital allocation in the industrial production process. With regard to undesirable outputs, the excess ratio of industrial solid waste ranks first, with a score of 75.42%, followed by industrial SO2 and industrial wastewater, whose excess ratios are 56.31% and 48.30%, respectively. This means that if Jiangxi achieved sustainable industrial development of industrial solid waste, 56.31% of industrial SO2, and 48.30% of industrial wastewater, would be eliminated. The result is consistent with Wang and Dong (2007) [45], who argued that the vigorous industrial development in Jiangxi Province came at the expense of the environment, and was not sustainable. In addition, the shortage ratio of the desirable output is 29.15%, which suggests that a 29.15% increase in the industrial GDP would yield optimal production.
From a city perspective, Fuzhou shows the lowest excess ratio of industrial energy, 0.98%, which is significantly lower than those of the other cities. Hence, if Fuzhou achieved sustainable industrial development, its industrial energy consumption could be potentially reduced by 0.98%. In using industrial capital, Ganzhou and Nanchang performed significantly better than the other cities; the excess ratios of industrial capital in these two cities are 2.21% and 2.25%, respectively. Yingtan shows the lowest excess ratio of industrial labor, with a score of 8.53%. On the other hand, the excess ratio of industrial energy in Yichun is as high as 81.54%, and the scores in Pingxiang and Jingdezhen are close to 80%. These cities need to take effective measures to use energy more efficiently in the industrial production process. In addition, the excess ratios of labor for Ganzhou and Shangrao are greater than 70%, implying that the two cities have serious industrial labor surpluses, and effective measures should be taken to disperse the surplus labor.
Regarding the excess ratios of undesirable outputs, Pingxiang, with a score of 16.83%, has the lowest excess ratio of industrial wastewater. Nanchang shows the lowest excess ratio of industrial SO2 of 20.32%. With respect to the excess ratio of industrial solid waste, Fuzhou has the lowest score, 24.98%.
As for the shortage ratio of industrial GDP, Nanchang and Fuzhou performed best: their scores equal zero. The two cities achieved the maximum industrial GDP under the current constraints on resources and the environment.
In sum, resources for industrial production, especially energy and labor, have not been effectively used in most cities in Jiangxi Province. Optimizing the allocation of resources and using resources more efficiently are thus of prime importance. In addition, the potential for reducing industrial pollution is vast. The local government of Jiangxi Province should take effective measures to counter and prevent industrial pollution, such as severely punishing illegal sewage companies, for instance.

3.4. Influencing Factor Analysis

Using a regression analysis based on Equation (9), we explore the impact of the influencing factors on the PIGD. First, because the PIGD value lies between 0 and 1, we apply a Tobit regression model, which models dependent variables with censored data [46]. The Tobit model can be expressed as follows:
Y i * = γ X i + ε i , i = 1 , 2 , , N
Y i = { Y i * , i f Y i * 0 0 , i f Y i * 0
where Y i is the dependent variable. Y i * is the latent variable, and Y i is a positive value or censored otherwise. X i is a vector of independent variables, and γ is a vector of parameters to be estimated. Generally, zero in Equation (11) can be replaced by any lower limit L _ or upper limit L ¯ , which can be expressed in Equation (12) [47].
Y j = { L ¯ , i f Y j * L ¯ Y j * , i f L _ < Y j * < L ¯ L _ , i f Y j * L _
Second, we use four widely used panel unit root tests, i.e., LLC (Levin-Lin-Chu), IPS (Im-Pesaran-Shin), ADF-Fisher, and PP-Fisher [48,49], to test whether panel data is stationary or not. Table A1 in from the Appendix A reports the estimated results of the unit root test, including the LLC test, IPS test, ADF-Fisher test, and PP-Fisher test. The results of the tests show that all of the variables are stationary in their level form, which rejects the null hypothesis of a non-stationary series at 1% level of significance. Third, the variance inflation factor (VIF) for the variables is much smaller than five, which indicates that there is not much chance of the existence of multicollinearity. Lastly, the Hausman test results reported in Table 4 show that fixed effects are rejected (Hausman test statistic values are small, and all of the Hausman test Prob. Values >0.05); therefore, we establish random effect models. We introduce the influencing factors successively to enhance the robustness of the regression results. The estimation results are shown in Table 4.
We find that PGDP has a positive impact on the PIGD, and is significant at the 1% level in all five columns, indicating that increasing the per capita GDP can effectively help improve the PIGD. This is consistent with our assumptions presented in Section 2.3. The coefficient of ES is significant and negative in Columns (2)–(5), which suggests that to increase the PIGD, the ES needs to be decreased. According to the Jiangxi Statistical Yearbook, the value of ES invariably exceeded 90% during the period under study. The outcome was serious pollution of the ecological environment in the industrial areas around the cities. This is consistent with the findings of Zhou et al. (2017) [50]. The coefficient on IS yields a similar result; it is negatively related with the PIGD and statistically significant in Columns (4)–(5). Thus, the current value of IS is high, and hinders the improvement of the province’s PIGD. This provides further incentive for Jiangxi to enter the post-industrialization stage and aim at reducing the scale but improving the quality of industrial development.
It is worth noting that the coefficient on INV is negative, and statistically significant in Columns (3)–(5), which is not consistent with our assumptions presented in Section 2.3. The result suggests that the government’s investment in environmental management has not achieved the desired effects. This may be due to the inefficient use of investment funds, which would be consistent with Eyraud et al. (2013) [51], who suggested that the improper use of investment allocated to environmental protection is quite common in China.
The coefficient on LS is negative, although not statistically significant, in Column (5). This is consistent with our initial assumptions. The finding suggests that the problem of labor surplus in Jiangxi’s industrial sector is not serious. However, it warrants attention, and timely transfers of the industrial labor surplus are necessary.

4. Conclusions

As resources consumption and pollution in the industrial sector of Jiangxi Province have increased at alarming rates in recent years, estimating the state of performance of industrial green development and proposing effective countermeasures is an urgent task. Employing a GNDDF approach, this study estimates the PIGD for Jiangxi province and its 11 cities in the period 2003–2015, and puts forward some policy suggestions through slack variable analysis and influencing factors analysis.
The empirical results show that industrial pollutants have a significant negative impact on achieving industrial green development and disregarding industrial pollutants would inevitably lead to biased estimation results. It is thus necessary to take industrial pollutants into account in order to estimate the PIGD more accurately. In addition, the PIGD for Jiangxi Province shows a rising trend during most of the research period, and its two decomposition indicators, the ECPID and the ENPID, exhibit similar trends. The improvement in the PIGD is mainly driven by the ECPID, while poor environmental performance hindered sustainable industrial development in Jiangxi Province. At the city level, none of the 11 cities achieved sustainable industrial development. In particular, Fuzhou and Nanchang performed considerably better than other cities in regards to the PIGD as well as its two decomposition indicators. Jiujiang was identified as the city with the lowest PIGD.
The results of our slack variable analysis show that all of the cities are inefficient in using industrial inputs, especially industrial energy and industrial labor. Excessive discharge of industrial pollutants is another important reason for the industry’s failure to achieve sustainable development. Therefore, effective measures should be taken to use industrial resources more efficiently. Further, the results of our influencing factor analysis show that the PGDP is significantly positively related to the PIGD. The ES, INV, and the IS are significantly negatively related to the PIGD. An increase in the LS impacts the PIGD negatively, although the relationship is not statistically significant.
The empirical study holds some policy implications. First, the development of industries with low energy consumption and high economic output, for example, electronics and the information industry, should be promoted, and industries with high energy consumption and high pollution shut down. In addition, the resource utilization efficiency should be improved in the process of industrial production by introducing and developing advanced technologies that save resources and prevent environmental pollution. Second, the local government needs to optimize and properly manage the allocation of industrial capital so as to prevent its inefficient use. Third, the local government needs to actively transfer surplus industrial workers to other sectors, especially to the tertiary industry, and improve the skills of the labor through training and other measures, in order to avoid serious labor surplus and strive to make efficient use of industrial labor. Fourth, the energy structure of the industry needs to be further optimized, and the ES decreased. In particular, the popularity of clean energy (e.g., solar energy and nuclear energy) can be increased through subsidies, while environmental taxes can be imposed on producers using coal and other types of fossil energy. Lastly, efficient use of environmental protection investment is also very important. The local government needs to develop detailed, science-based plans for the use of environmental protection funds.
There are several limitations of this study that deserve consideration. First, our empirical analysis only considers data from the period 2003–2015. A longer period would help improve the accuracy of the empirical analysis. Next, we selected only three typical industrial pollutants as undesirable outputs. Other pollutants (e.g., phosphorus and heavy metals) are not considered, mainly due to data unavailability. Further, factors capturing the humanistic aspect, such as human capital, are not included in this study for the same reason. We will address improvements that allow for more comprehensive empirical results in future research.

Acknowledgments

This study was supported by the National Natural Science Foundation of China (No. 71463020 & No. 41361111); the Key projects of the National Social Science Fund of China, No. 15AZD075; the Key projects of Social Science Fund of Jiangxi Province, No. 17ZD03; the Natural Science Foundation of Jiangxi Province No. 20143ACB21023; the Technology Foundation of Jiangxi Education Department of China, No. KJLD14033 & No. GJJ160431; and the Fok Ying-Tung Fund, No. 141084.

Author Contributions

Hualin Xie and Fucai Lu had the original idea for the study. Wei Wang and Xinmin Zhang were responsible for data collecting. Wei Wang and Xinmin Zhang carried out the analyses. All the authors drafted the manuscript, and approved the final one.

Conflicts of Interest

The authors declare no conflict of interest.

Appendix A

Table A1. Results of panel unit root tests.
Variables(1)(2)Conclusion
LLCIPSADF-FisherPP-Fisher
StatisticProb.StatisticProb.StatisticProb.StatisticProb.
PIGD−9.5050.000 ***−8.0820.000 ***94.4700.000 ***96.8140.000 ***Stationary
lnPGDP−3.9890.000 ***−2.7490.001 ***38.4140.002 ***38.2830.001 ***Stationary
ES−11.3540.000 ***−7.5440.000 ***89.3280.000 ***90.0460.000 ***Stationary
lnINV−9.7110.000 ***−6.3120.000 ***76.8560.000 ***86.4630.000 ***Stationary
IS−4.3470.000 ***−2.8320.002 ***40.3140.002 ***39.4240.002 ***Stationary
LS−5.2330.000 ***−3.4300.000 ***46.4740.001 ***47.6820.001 ***Stationary
*** Denotes p < 0.001, ** denotes p < 0.05, and * denotes p < 0.01. Approach below (1) assumes common unit root process and approaches below (2) assume individual unit root process.

References

  1. Zhou, Y.; Lu, Y.; Xie, J.; Feng, C. Analysis on the factors of out-oriented economy in the western China. Econ. Geogr. 2006, 26, 207–211. (In Chinese) [Google Scholar]
  2. Liu, X.T. On Industrial Cluster Development of Industrial Parks: A Case Study of Jiangxi Province in China. Appl. Mech. Mater. 2011, 55, 2003–2008. [Google Scholar] [CrossRef]
  3. Shi, X.; Heerink, N.; Qu, F. Does off-farm employment contribute to agriculture-based environmental pollution? New insights from a village-level analysis in Jiangxi Province, China. China Econ. Rev. 2011, 22, 524–533. [Google Scholar] [CrossRef]
  4. Yu, Y.; Li, Q.; Wang, H.; Wang, B.; Lu, Q.; Yan, Z.; Ding, A. Exposure risk of young population to lead: A case study in Le’an River Basin in Jiangxi Province, China. Environ. Pollut. 2015, 209, 140–145. [Google Scholar] [CrossRef] [PubMed]
  5. Teng, Y.; Li, J.; Wu, J.; Lu, S.; Wang, Y.; Chen, H. Environmental distribution and associated human health risk due to trace elements and organic compounds in soil in Jiangxi province, China. Ecotoxicol. Environ. Saf. 2015, 155, 406–416. [Google Scholar] [CrossRef] [PubMed]
  6. Albrizio, S.; Kozluk, T.; Zipperer, V. Environmental policies and productivity growth: Evidence across industries and firms. J. Environ. Econ. Manag. 2017, 81, 209–226. [Google Scholar] [CrossRef]
  7. Yi, H.; Liu, Y. Green economy in China: Regional variations and policy drivers. Glob. Environ. Chang. 2015, 31, 11–19. [Google Scholar] [CrossRef]
  8. Chen, S.; Golley, J. ‘Green’ productivity growth in China's industrial economy. Energy Econ. 2014, 44, 89–98. [Google Scholar] [CrossRef]
  9. Xie, H.; Yu, Y.; Wang, W.; Liu, Y. The substitutability of non-fossil energy, potential carbon emission reduction and energy shadow prices in China. Energy Policy 2017, 107, 63–71. [Google Scholar] [CrossRef]
  10. Xie, H.; Wang, W.; Yang, Z.; Choi, Y. Measuring the sustainable performance of industrial land utilization in major industrial zones of China. Technol. Forecast. Soc. Chang. 2016, 112, 207–219. [Google Scholar] [CrossRef]
  11. Wang, W.; Xie, H.; Jiang, T.; Zhang, D.; Xie, X. Measuring the total-factor carbon emission performance of industrial land use in China based on the global directional distance function and non-radial Luenberger productivity index. Sustainability 2016, 8, 336. [Google Scholar] [CrossRef]
  12. Liu, G.; Tao, L.; Liu, X.; Hou, J.; Wang, A.; Li, R. Heavy metal speciation and pollution of agricultural soils along Jishui River in non-ferrous metal mine area in Jiangxi Province, China. J. Geochem. Explor. 2013, 132, 156–163. [Google Scholar] [CrossRef]
  13. Yao, G.; Xie, H. Rural spatial restructuring in ecologically fragile mountainous areas of southern China: A case study of Changgang Town, Jiangxi Province. J. Rural Stud. 2016, 47, 435–448. [Google Scholar] [CrossRef]
  14. Kirchner, M.; Schmid, E. Integrated regional impact assessment of agricultural trade and domestic environmental policies. Land Use Policy 2013, 35, 359–378. [Google Scholar] [CrossRef]
  15. Cheng, J.; Dai, S.; Ye, X. Spatiotemporal heterogeneity of industrial pollution in China. China Econ. Rev. 2016, 40, 179–191. [Google Scholar] [CrossRef]
  16. Xie, H.; Wang, W. Exploring the spatial-temporal disparities of urban land use economic efficiency in China and its influencing factors under environmental constraints based on a sequential slacks-based model. Sustainability 2015, 7, 10171–10190. [Google Scholar] [CrossRef]
  17. Charnes, A.; Cooper, W.W.; Rhodes, E. Measuring the efficiency of decision making units. Eur. J. Oper. Res. 1978, 2, 429–444. [Google Scholar] [CrossRef]
  18. Zhang, N.; Choi, Y. A note on the evolution of directional distance function and its development in energy and environmental studies 1997–2013. Renew. Sustain. Energy Rev. 2014, 33, 50–59. [Google Scholar] [CrossRef]
  19. He, W.; Wu, K. Regional industrial competitiveness evaluation: An empirical analysis based on 11 cities in Jiangxi province. Sci.-Technol. Manag. 2013, 5, 67–71. (In Chinese) [Google Scholar]
  20. Zhou, G.; Guo, Y.; Long, Q. The orientation and path choice of Jiangxi Industrial Park transformation and upgrading. Jiangxi Soc. Sci. 2016, 2, 56–60. (In Chinese) [Google Scholar]
  21. Huang, H.; Wang, L. A Study of the evolution of regional industrial environment technical efficiency and environmental coordination in Jiangxi province from the perspective of environmental constraints. J. Jiangxi Univ. Financ. Econ. 2016, 5, 98–105. (In Chinese) [Google Scholar]
  22. Zhou, P.; Poh, K.L.; Ang, B.W. A non-radial DEA approach to measuring environmental performance. Eur. J. Oper. Res. 2007, 178, 1–9. [Google Scholar] [CrossRef]
  23. Krivonozhko, V.E.; Førsund, F.R.; Lychev, A.V. Measurement of returns to scale using non-radial DEA models. Eur. J. Oper. Res. 2014, 232, 664–670. [Google Scholar] [CrossRef]
  24. Zhang, C.; Chen, Z. Sustainability characteristics of China’s Poyang Lake Eco-Economics Zone in the big data environment. J. Clean. Prod. 2017, 142, 642–653. [Google Scholar] [CrossRef]
  25. Chambers, R.G.; Chung, Y.; Färe, R. Benefit and distance functions. J. Econ. Theory 1996, 70, 407–419. [Google Scholar] [CrossRef]
  26. Zhang, N.; Kim, J.D. Measuring sustainability by Energy Efficiency Analysis for Korean Power Companies: A Sequential Slacks-Based Efficiency Measure. Sustainability 2014, 6, 1414–1426. [Google Scholar] [CrossRef]
  27. Wu, Y. Export performance in China’s regional economies. Appl. Econ. 2007, 39, 1283–1293. [Google Scholar] [CrossRef]
  28. Ederer, N. Evaluating capital and operating cost efficiency of offshore wind farms: A DEA approach. Renew. Sustain. Energy Rev. 2015, 42, 1034–1046. [Google Scholar] [CrossRef]
  29. Liu, J.; Zhang, J.; Fu, Z. Tourism eco-efficiency of Chinese coastal cities—Analysis based on the DEA-Tobit model. Ocean Coast. Manag. 2017, 148, 164–170. [Google Scholar] [CrossRef]
  30. Andreano, M.S.; Laureti, L.; Postiglione, P. Economic growth in MENA countries: Is there convergence of per-capita GDPs? J. Policy Model. 2013, 35, 669–683. [Google Scholar] [CrossRef]
  31. Yu, S.; Wei, Y. Prediction of China’s coal production-environmental pollution based on a hybrid genetic algorithm-system dynamics model. Energy Policy 2012, 42, 521–529. [Google Scholar] [CrossRef]
  32. Che, W. Investment for environmental conservation in China mainland at provincal level. Econ. Geogr. 2009, 29, 237–243. (In Chinese) [Google Scholar]
  33. Yan, W. Fiscal Decentralization, Government Competition and Environmental Pollution Disposal Investment. Financ. Trade Res. 2012, 5, 91–97. (In Chinese) [Google Scholar]
  34. Lan, J.; Kakinaka, M.; Huang, X. Foreign Direct Investment, Human Capital and Environmental Pollution in China. Environ. Resour. Econ. 2012, 51, 255–275. [Google Scholar] [CrossRef]
  35. Cai, X.; Lu, Y.; Wu, M.; Yu, L. Does environmental regulation drive away inbound foreign direct investment? Evidence from a quasi-natural experiment in China. J. Dev. Econ. 2016, 123, 73–85. [Google Scholar] [CrossRef]
  36. Zhu, H.; Fu, Q.; Wei, Q. Calculation of Efficiency on Environmental Expenditure and Study on Influential Factors. China Popul. Resour. Environ. 2014, 24, 91–96. (In Chinese) [Google Scholar]
  37. Xie, H.; Wang, W. Spatiotemporal differences and convergence of urban industrial land use efficiency for China’s major economic zones. J. Geogr. Sci. 2015, 25, 1183–1198. [Google Scholar] [CrossRef]
  38. Jiang, G.; He, X.; Qu, Y.; Zhang, R.; Meng, Y. Functional evolution of rural housing land: A comparative analysis across four typical areas representing different stages of industrialization in China. Land Use Policy 2016, 57, 645–654. [Google Scholar] [CrossRef]
  39. Ozkan, N.F.; Ulutas, B.H. Efficiency analysis of cement manufacturing facilities in Turkey considering undesirable outputs. J. Clean. Prod. 2017, 156, 932–938. [Google Scholar] [CrossRef]
  40. Wu, C.H.; Ding, C.G.; Jane, T.D.; Lin, H.R.; Wu, C.Y. Lessons from the global financial crisis for the semiconductor industry. Technol. Forecast. Soc. Chang. 2015, 99, 47–53. [Google Scholar] [CrossRef]
  41. Zhang, N.; Xie, H. Toward green IT: Modeling sustainable production characteristics for Chinese electronic information industry, 1980–2012. Technol. Forecast. Soc. Chang. 2015, 96, 62–70. [Google Scholar] [CrossRef]
  42. Wan, L.; Zhang, Y.; Qi, S.; Li, H.; Chen, X.; Zang, S. A study of regional sustainable development based on GIS/RS and SD model—Case of Hadaqi industrial corridor. J. Clean. Prod. 2017, 142, 654–662. [Google Scholar] [CrossRef]
  43. Jiangxi Provincial Bureau of Statistics. Jiangxi Statistical Yearbook; China Statistics Press: Beijing, China, 2016. (In Chinese) [Google Scholar]
  44. Du, Q.; Wang, Y.; Ren, F.; Zhao, Z.; Liu, H.; Wu, C.; Li, L.; Shen, Y. Measuring and Analysis of Urban Competitiveness of Chinese Provincial Capitals in 2010 under the Constraints of Major Function-Oriented Zoning Utilizing Spatial Analysis. Sustainability 2014, 6, 3374–3399. [Google Scholar] [CrossRef]
  45. Wang, X.; Dong, X. On the development of circular economy in the process of industrialization in Jiangxi. Jiangxi Soc. Sci. 2007, 1, 254–256. (In Chinese) [Google Scholar]
  46. Tobin, J. Estimation of relationships for limited dependent variables. Econometrica 1958, 26, 24–36. [Google Scholar] [CrossRef]
  47. Niu, D.; Song, Z.; Xiao, X.; Wang, Y. Analysis of wind turbine micrositing efficiency: An application of two-subprocess data envelopment analysis method. J. Clean. Prod. 2018, 170, 193–204. [Google Scholar] [CrossRef]
  48. Levin, A.; Lin, C.F.; Chu, C.S.J. Unit root tests in panel data: Asymptotic and finite sample properties. J. Econom. 2002, 108, 1–24. [Google Scholar] [CrossRef]
  49. Im, K.S.; Pesaran, M.H.; Shin, Y. Testing for unit roots in heterogeneous panels. J. Econom. 2003, 108, 53–74. [Google Scholar] [CrossRef]
  50. Zhou, Y.; Zhu, S.; He, C. How do environmental regulations affect industrial dynamics? Evidence from China’s pollution-intensive industries. Habit Int. 2017, 60, 10–18. [Google Scholar] [CrossRef]
  51. Eyraud, L.; Clements, B.; Wane, A. Green investment: Trends and determinants. Energy Policy 2013, 60, 852–865. [Google Scholar] [CrossRef]
Figure 1. The location of Jiangxi Province and its 11 cities.
Sustainability 09 01757 g001
Figure 2. Trends in industrial wastewater, industrial SO2, and industrial solid waste discharge, 2003–2015. Data source: China Statistical Yearbook (2004–2016).
Sustainability 09 01757 g002
Figure 3. The evolution of the performance of industrial green development (PIGD) for Jiangxi Province during 2003–2015.
Sustainability 09 01757 g003
Figure 4. The evolution of the PIGD, economic performance of industrial development (ECPID), and environmental performance of industrial development (ENPID) for Jiangxi Province during 2003–2015.
Sustainability 09 01757 g004
Figure 5. PIGD and its decomposition indicators for each city.
Sustainability 09 01757 g005
Figure 6. Patterns of PIGD, ECPID and ENPID for each city in 2003, 2009, and 2015.
Sustainability 09 01757 g006
Table 1. Descriptive statistics of the input and output variables.
Type of VariableVariableUnitMax.Min.MeanSt. Dev.
InputEnergy104 ton1209.6713.06410.21277.19
Capital108 yuan1596.6124.90358.12325.95
Labor104 people177.4011.9064.7540.79
Desirable outputGDP108 yuan2179.9637.83428.22375.08
Undesirable outputIndustrial wastewater108 ton1.680.140.600.30
Industrial SO2104 ton10.251.344.592.26
Industrial solid waste104 ton4270.760.37346.031018.14
Table 2. Descriptive statistics of the influencing indicators.
VariableUnitMax.Min.MeanSt. Dev.
PGDP104 yuan2.10-0.900.600.74
ES1.000.480.940.14
INV104 yuan3.24-3.910.731.38
IS0.670.330.520.08
LS0.640.190.430.11
Table 3. Optimization of the PIGD for cities in Jiangxi Province in the period 2003–2015.
Inputs Excess (%)Desirable Output Shortage (%)Undesirable Output Excess (%)
EnergyCapitalLaborGDPWastewaterSO2Solid Waste
Nanchang27.992.2517.480.0030.2020.3243.35
Jingdezhen75.1641.8956.8262.0473.8186.8084.46
Pingxiang76.8724.2355.9116.1916.8375.8983.69
Jiujiang64.9818.7127.7280.8740.1758.1642.21
Xinyu57.1827.4633.5721.1449.4754.8462.32
Yingtan65.6624.878.5351.9569.6166.6988.39
Ganzhou32.702.2178.6812.7567.9870.5788.34
Jian61.9439.2867.2255.4677.4887.2686.01
Yichun81.5430.9468.6150.1046.3869.1885.90
Fuzhou0.988.5521.210.0026.2730.7024.98
Shangrao55.9819.2975.2431.0349.0563.4389.94
Jiangxi Province62.5120.9252.0329.1548.3056.3175.42
Table 4. Regression results.
Dependent Variable: PIGD
(1)(2)(3)(4)(5)
lnPGDP0.1475 ***0.1456 ***0.1954 ***0.2641 ***0.2361 ***
(5.7529)(5.7646)(6.4144)(9.3551)(7.0675)
ES −0.2871 **−0.2648 **−0.2291 *−0.2186 *
(−2.1538)(−2.0355)(−1.8085)(−1.8569)
lnINV −0.0454 ***−0.0582 ***−0.0563 ***
(−2.7738)(−3.9435)(−3.8008)
IS −2.0174 ***−2.0249 ***
(−6.0556)(−6.0986)
LS −0.2453
(−1.0168)
Constant0.3529 ***0.08520.10941.1367 ***1.0323 ***
(14.4801)(0.6736)(0.8853)(5.6181)(4.5636)
Adjusted R20.29310.31770.35820.41210.4153
Prob.0.00000.00000.00000.00000.0000
Hausman test0.481.052.196.766.96
Hausman test Prob.0.78550.79010.70030.23890.3244
*** Denotes p < 0.001, ** denotes p < 0.05, and * denotes p < 0.01. t statistics in parentheses.

