How Urbanization Economies Impact TFP of R&D Performers: Evidence from China


Faculty of Management and Economics, Dalian University of Technology, Dalian 116024, China
*
Author to whom correspondence should be addressed.
Sustainability 2017, 9(10), 1766; https://doi.org/10.3390/su9101766
Submission received: 31 July 2017
/
Revised: 12 September 2017
/
Accepted: 20 September 2017
/
Published: 29 September 2017
(This article belongs to the Special Issue Sustainable Urbanization Strategies in Developing Countries)
Abstract
:There have been extensive studies exploring the relationship between agglomeration economies and economic growth. However, far less attention is paid to the nonlinear relationship of urbanization economies–firm productivity nexus, especially in developing countries. This paper aims to explore how urbanization economies impact the total factor productivity (TFP) of research and development (R&D) performers using a large sample of Chinese manufacturing firms. The generalized propensity score matching methodology is employed to not only address the selection-bias and endogenous issues, but also quantitatively investigate how firm TFP responds to urbanization economies at each urbanization level. Based on the full data sample, our results show that there exists an S-shaped relationship between urbanization economies and TFP of Chinese R&D performers. Importantly, there is an optimal interval in which urbanization economies’ impact on firm TFP can be maximized. There is also a threshold value, only beyond which a further increase in urbanization economies improves firm TFP, and a saturation point, beyond which a further increase in urbanization economies does not increase and even decrease firm TFP. The relationship between urbanization economies and TFP of Chinese R&D performers presents a consistent pattern for firms in high- and medium–low-technology industries, as well as in Eastern and North East China. However, for firms in Central and Western China, there is a much smaller and even no range of optimal interval of urbanization economies, respectively. Our research helps provide insights into policy makers to maximize urbanization economies’ positive impact on firm TFP.
1. Introduction
The relationship between urbanization economies and economic growth has not only attracted much attention from academic researchers, but also become a major policy concern [1,2,3,4,5,6]. Differing from localization economies, implying that firms can derive benefits from the presence of same industry firms in a geographical area [7], urbanization economies imply that firms can enjoy benefit from diversified economic activities’ geographical concentration in a particular area [7,8]. It refers to the inter-industry externalities with an emphasis on city diversification across different industries [9] and corresponds closely to the ideas in Jacob (1969) [10] emphasizing the role of regional economies’ diversity [11]. While localization economies receive earlier research attention, since the original contributions of Marshall (1920) [12] and Weber (1929) [13], more and more contributions have been made to urbanization economies [14,15] since the seminal work of Hoover (1937) [16]. Regarding the corresponding academic analysis, how urbanization economies impact firm productivity has been the object of intense theoretical and empirical research [17]. However, most current studies are from developed countries, while the evidence from developing countries is relatively scant.
Accordingly, this paper aims to explore how urbanization economies impact firms’ total factor productivity (TFP) employing the data of research and development (R&D) performers from a large developing country, China. At least three reasons explain why Chinese R&D performers can be provided as an ideal setting to conduct this research. First, the economy of China has displayed a high-rate growth since the reform and opening up in 1978, for which productivity plays an important role. However, recent years have witnessed a slower rise and even decline in productivity of China compared with other countries. For example, both Conference Board’s reckoning and Chinese statistics show that the growth of Chinese labor productivity fell off in 2015. China’s TFP even shrank in 2015, while India increased TFP by 1.2% in the same year, by the Conference Board’s reckoning. Therefore, important policy implications can be seen from exploring China’s TFP growth at the micro-firm level. Second, the development of urbanization agglomeration in China is policy-directed. Since the reform and opening policy in 1970s, the government has invested preferential policies in China’s various development zones and industrial parks to attract plenty of firms to agglomerate. However, there may be weak or even no agglomeration externalities in this rapid process of firms’ gathering, as many firms in development zones and industrial parks are purely oriented by rent-seeking in policies. As such, it is intriguing to investigate whether urbanization economies can exert positive externalities or not in China. Third, in recent years, many developing countries including China are increasingly advocating technological innovation for the sake of upgrading economic structure [18]. Of note, productivity growth is largely driven by R&D investment. Therefore, this research focuses on Chinese R&D performers to explore urbanization economies’ impact on firm TFP.
This research contributes to the previous literature by exploring a far less studied issue: urbanization economies’ impact on TFP of R&D performers in China. Although the relationship between agglomeration economies and economic growth has been studied extensively, current studies focus mainly on the analysis of localization economies at the industry- and country-level. In addition, the evidence from developing countries is relatively scant. This paper helps enrich the current research in literature stream of urbanization economies and firm productivity. Our empirical results imply that there exists an optimal interval of urbanization economies, in which urbanization economies’ impact on firm TFP can be maximized. This research provides suggestions for Chinese policy makers to guide efficient use of urbanization economies.
Second, the generalized propensity score matching (GPS) methodology is employed to quantitatively evaluate urbanization economies’ impact on firm TFP. Employing this method not only helps address the potential selection-bias issues and the endogenous problem argued by previous studies, such as Combes et al. (2010) [19], but also helps explore the dynamic and potential nonlinear relationship between urbanization economies and firm TFP as explored in many studies, such as Broersma and Oosterhaven (2009) [20]. Up to date, the GPS technique has been utilized in previous literature exploring other research questions, such as understanding public subsidies’ impact on corporate R&D investment [21] and evaluating academic momentum’s effect on transfer rates [22]. However, as far as we know, no previous research has employed this method for evaluating how urbanization economies impact TFP of R&D performers at any given levels of urbanization economies, addressing the selection-bias and endogenous issues well.
Third, this paper examines the potential differences of the urbanization economies effects across different: (i) manufacturing industries; and (ii) geographical regions. The R&D performers in China may prefer cost innovation rather than technological advance [23], especially for those operations in medium–low-technology industries. Hence, congestion effects and agglomeration effects of urbanization economies may differ across industries with different technology intensities. Moreover, China is a vast country in which there are large differences in economic development and resources reallocation efficiency across different geographical regions. This may also lead to heterogeneity in agglomeration economies. Therefore, we finally examine whether urbanization economies exert heterogeneous influences on TFP of R&D performers firms across different subsamples.
The rest of this paper is organized as follows. Section 2 is the literature review. Section 3 describes the data and provides descriptive analysis. Section 4 introduces the methodology and variables. Empirical results and further extension exploration are reported and analyzed in Section 5. Section 6 concludes.
2. Literature Review
Although urbanization economies’ impacts on firm productivity have been extensively explored, there is diverse evidence and a lack of analysis from developing countries. On the one hand, urbanization economies can positively impact firm productivity (denominated agglomeration effects). Firms can derive diversified and complementary knowledge of multiple types across industries, better promoting innovation activities [24]. This helps firms not only improve production efficiency, but also combine heterogeneous resources to maintain their competitive advantages. By geographical concentration in large and economically diverse cities, firms in different industries can also share a wide range of infrastructures and specialized services. This helps firms benefit from economies of scale [25] and lower costs by which in turn to improve their productivity.
On the other hand, urbanization economies can also negatively impact firm productivity, stemming from the diseconomies of agglomeration (such as, congestion effects) [17,24]. Congestion effects exist since factor costs (e.g., land, transportation, and labor) can be increased largely when too many firms agglomerate in one particular area [26,27,28]. This may lead to a series of problems, such as over-competition and scrabbling for public infrastructure, when the number of agglomerated firms exceeds the local economy’s bearing capacity. These problems not only preclude firms enhancing productivity further, but also exert negative effects on the regional economic development.
Moreover, it is worth noting that agglomeration effects and congestion effects exhibit heterogeneous roles in different levels of urbanization economies. Whether urbanization economies can optimally positively impact firm productivity depends on the comparison of agglomeration effects and congestion effects. In the early stage of urbanization economies, congestion effects may increase rapidly and dominate since the agglomeration effects (including such as knowledge externalities, learning effect) come into effect gradually as time goes by. Meanwhile, congestion effects can be great in a short time because a fast agglomeration of firms often brings high costs quickly [28]. With the improvement of urbanization economies, agglomeration effects then improve quickly and may dominate over a certain level of urbanization economies. This indicates that we expect an optimal interval in which the urbanization economies’ positive impact on firm TFP can be maximized. However, congestion effects may increase rapidly again when cities are over urbanized since congestion effects and various costs are great in this stage. In summary, the optimal effects of agglomeration may not be achieved when the number of agglomerated firms is too large or too small [16].
Turning to the current evidence, there has been many studies investigating urbanization economies and its impact at the industry- and country-level [29,30,31,32]. Concerning the analysis of urbanization economies–firm productivity nexus, most current evidence is from developed countries. For example, Jofre-Monseny et al. (2014) [7] explains the distribution and reason not only for urbanization economies but also for localization economies in Spain at micro-firm level. Cainelli et al. (2014) [17] adopts a panel smooth transition regression model for exploring agglomeration economies’ impact on TFP of Italian firms from 1999 to 2007. They find that urbanization economies positively impact firm productivity in Italy only when it exceeds a certain threshold. In the study by Capello (2002) [33], the productivity of Italian firms in Metropolitan Area of Milan is also demonstrated and can be improved by benefiting from both urbanization (diversified) and specialized economies; and the latter plays a more important role. In addition, French firms are found to obtain productivity development benefiting from urbanization economies, though this positive effect is weak [34]. However, the corresponding analysis of urbanization economies from developing countries is relatively scant, deriving different conclusions. For instance, Saito and Gopinath (2009) [35] explore whether firm productivity improvement stems from their self-selection to locate in specific markets or agglomeration externalities (including urbanization, localization and demand-driven scale economies) in Chile. They find that firms’ self-selection outweighs others in terms of firm productivity growth.
Especially with regard to the evidence from China, although recent years have witnessed a growing number of research on urbanization economies’ impact on firm performance, the impact of urbanization economies on firm productivity receives far less attention. For instance, Guo et al. (2016) [36] demonstrate that localization economies predict well entrepreneurship, while the effects of urbanization economies are mixed in China in research years 2001–2007. Hashiguchi and Tanaka (2015) [9] find strong positive externalities of localization economies in productivity of Chinese firms, with insignificant influence of urbanization economies. Since the economic stages are different in developed and developing countries, firms in developing and developed countries exhibit heterogeneous characteristics [37]. Whether and how urbanization economies benefit firm productivity in developing countries, especially in China, which quickly develops agglomeration economies are important questions. Unfortunately, few studies have explored this issue.
3. Data and Descriptive Analysis
3.1. Data
To carry out this research, the dataset of Chinese Annual Survey of Industrial Firms (CASIF) conducted by the State Statistics Bureau of China is employed. This dataset reports basic and financial information of firms yearly. It includes all state-owned enterprises (SOEs) and none-SOEs whose annual sales is above RMB 5 million. On average, these firms account for 95% of total industrial output, cover about 31 mainland provinces and municipalities in China. In this research, firms who have positive R&D expenditures refer to R&D performers. As for the research years, we focus on the analysis from 2005 to 2007 for the following two reasons. On the one hand, enhancing independent innovative capability is regarded as the strategic basic point of scientific and technological development by the Communist Party of China (CPC) Central Committee’s Proposal on the Formulation of the 11th Five-Year Plan. Moreover, improving independent innovative capability is the basis of and a foundation for constructing an innovative country which is emphasized since the 12th Five-Year plan. As such, exploring how TFP of Chinese R&D performers is impacted by urbanization economies during 2005–2007 is of significance for Chinese R&D performers nowadays. On the other hand, we have rich information of firms’ R&D expenditures in years 2005–2007 based on our dataset. Before conducting the empirical research, we further clean the dataset: observations in manufacturing industries are included in this research. To further reduce noisy and misleading firm observations, we filter the dataset following Ding et al. (2013) [38] and Ma et al. (2014) [39]. Of note, observations in the tobacco manufacturing industry are also excluded following Upward et al. (2013) [40], since this industry is still highly regulated in China over the research period. Specifically, observations in the following types are further excluded: those with negative total assets minus total fixed assets, negative total assets minus liquid assets, negative accumulated depreciation minus current depreciation, less than 10 employees, and missing or misreported information for the main financial variables (e.g., operating status, value added, and sale) and calculation of TFP.
With regard to the measurement of urbanization economies, this paper follows He and Pan (2010) [41] and Zhang (2014) [42] to introduce the industrial diversity as a proxy for urbanization economies. It is defined at the industry (2-digit GB/T)-city (provinces and municipalities) level. We set i, c and n to represent industry (2-digit GB/T industries), cities (4-digit geographical regions including prefecture-level cities and municipalities) and the whole country, respectively; then OUTic/OUTin refers to the output of industry i in city c/country n, and OUTc/OUTn the industrial output in city c/the whole country n. As such, the index of urbanization economies can be defined as follows:
where, i′ represents the industries other than the one studied in city c and UEic describes at city-industry level. This index is the inverse of a normalized Herfindhal index of industrial concentration. Its relationship between productivity of R&D performers in China is unclear since it is affected by both positive externalities and the congestion effect of urbanization economies.
Moreover, Table 1 presents an overview of R&D performers and urbanization economies in China, showing a faint declined industrial diversification trend over the research period. R&D performers increase significantly in terms of both the firm number (24,033, 27,903, and 33,019 and the R&D expenditure (82.68, 111.73, and 150.19).
3.2. Descrpitive Analysis
We start with describing the average distribution of firm TFP across top 10 2-digit GB/T manufacturing industries over research years 2005–2007. Estimating firm TFP is the key in this research. The ordinary least squares (OLS) is not employed in this paper since this method cannot address the issues of selection bias, simultaneity and endogeneity. As demonstrated by Simões and Marques (2012) [43], the Tornqvist Productivity Index (TPI) and Malmquist Productivity Index (MPI) can be used for measuring the change of productivity. Since this research focuses on productivity at micro-firm level, the method used by Levinsohn and Petrin (2003) [44] (LP, hereafter) and Olley and Pakes (1996) [45] (OP, hereafter) are more suitable in our analysis. Specifically, we finally employ the LP semi-parametric method used by Levinsohn and Petrin (2003) [44]. On the one hand, it is suited to the annual panel data and firm-level data. On the other hand, although the OP method is also widely used in estimating firm TFP, using this method can result in a significant loss of efficiency employed in this research because there are about two-thirds missing observations of its proxy variable (firm investment) required by the OP method in our dataset.
Specifically, firm TFP using the LP method is estimated assuming a Cobb–Douglas production function and evolving as a first-order Marko process. Firms’ annual average balance of net value of fixed assets and number of employee are employed to be the proxy variable for firm capital and labor, respectively. Firm value-added value is utilized to measure firm output. LP method uses firms’ intermediate inputs as the proxy for unobserved productivity, rather than investment. Intermediate inputs (mit) can be expressed as a function of productivity (pit) and capital (kit): mit = mt(kit,pit). As such, the unobserved productivity can be expressed as a function of observables: pit = st(kit,mit). Based on this, we can measure firm TFP employing the following function as follows: . A more detailed description can be found in Beveren (2012) [46].
Figure 1 describes the average distribution in the top 10 2-digit GB/T manufacturing industries ordered by TFP of R&D performers. As shown in Figure 1, these industries are mainly capital- and technology-intensive characterized. Knowledge spillovers are more likely to occur among R&D performers in these industries. Specifically, petroleum refining and cooking, together with ferrous/non-ferrous metal smelting and pressing, chemical fiber and transportation equipment industries rank the top five.
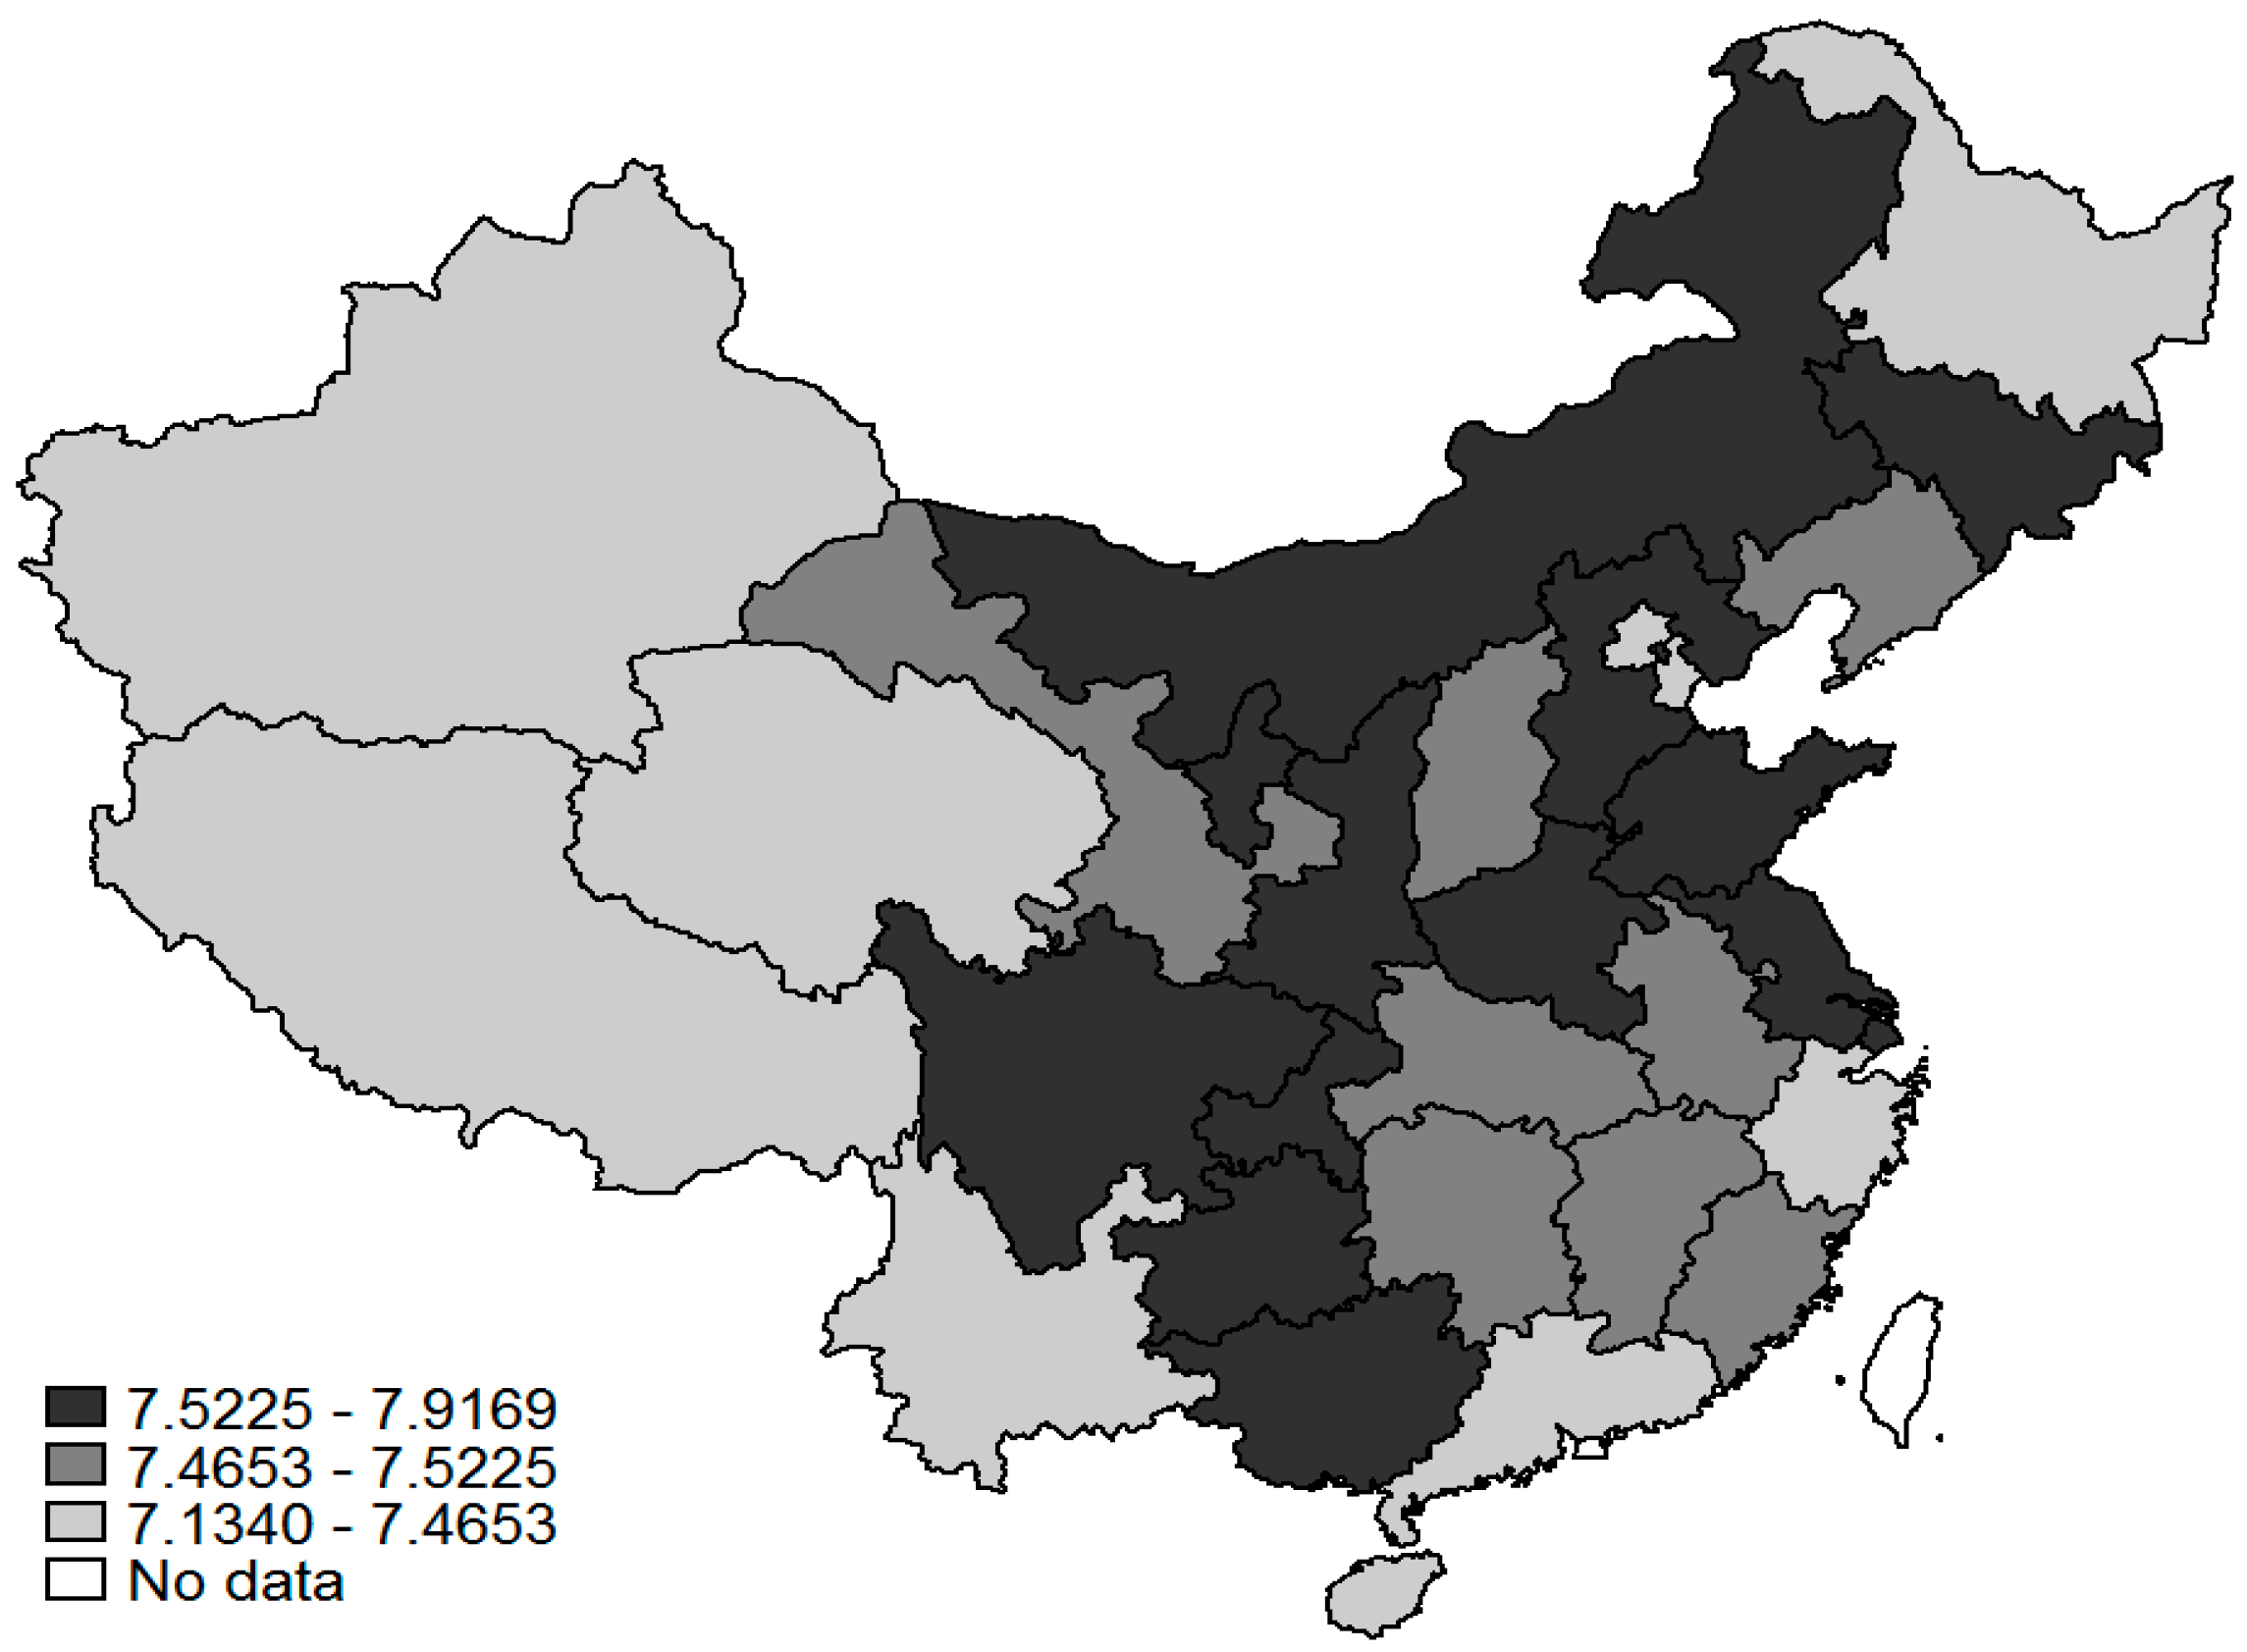
In addition, this research is interested in TFP distribution across different geographical regions. As shown in Figure 2, the average TFP level of Chinese R&D performers differs by provinces and municipalities, over research years 2005–2007. As expected, R&D performers located in Eastern China (e.g., Hebei, Shandong, Jiangsu, and Shanghai) are more productive. These firms have a higher TFP level benefiting from the geographical advantage, sufficient marketization and higher level of economic development. Moreover, many R&D performers located in Western China (e.g., Shanxi, Sichuan, Guizhou, and Chongqing) also exert TFP advantage. This indicates the implementation and successfulness of the government’s preferential policies, such as the Western Development Strategy.
This paper aims to explore how urbanization economies impact firm TFP. Therefore, Figure 3 describes and compares preliminarily the firm TFP distribution across two categories of urbanization economies by estimating their kernel density. As shown in Figure 3, firm observations are separated into two groups: high- and low-level urbanization economies groups in which firms’ UEic index is higher and lower than the mean value, respectively. Obviously, the TFP distribution of high-level urbanization economies group shifts to the right side, compared with that of low-level urbanization economies group. This implies a positive relationship between TFP of Chinese R&D performers and urbanization economies during the sample period. Is this relationship linear or nonlinear? How do urbanization economies impact firm TFP at each continuous level of urbanization? To explore these questions further, we employ the GPS method to carry out the research in the following parts.
4. Methodology and Variables
As discussed above, to investigate the research question, we utilize the generalized propensity score matching (GPS) methodology [47] to address selection-bias, endogenous issues and obtain the continuous impact of urbanization economies on TFP of Chinese R&D performers.
First, there has been a consensus conclusion that firms in large and often diversified cities (higher level of urbanization) are more productive. However, whether more productive firms self-select to these areas (self-selection effect) or urbanization economies positively impact firm productivity growth (agglomeration effect) receives much attention [48,49,50], with the answer remaining ambiguous. This reverse causality results in the endogenous issue.
Second, there are inherent differences between firms that locate in more diversified and urbanized cities relative to others. For example, firms in more urbanized cities are often more productive and have larger scales. As such, if a positive relationship between urbanization economies and firm TFP is observed, it is a question whether this TFP advantage stems from urbanization economies itself. There is hence a potential selection-bias issue in our research.
Third, urbanization economies may exert positive externalities on firm performance only after a certain level of urbanization due to its time-lag effect. Moreover, there may exist the issue of congestion and overcrowding of land and resources beyond a certain threshold of urbanization economies level. Therefore, it is intriguing to investigate urbanization economies’ impact on firm TFP at any given levels and explore whether there is a nonlinear relationship between urbanization economies and TFP of R&D performers.
4.1. Specification of the GPS Model
If it is set that i (i = 1,…, N) and t (t ∈ T) represent each firm unit in our data sample and a given level of treatment (urbanization economies), respectively, the set of outcomes (TFP of R&D performers) for a given level of treatment is indexed by Yi(t). Of note, T (T ∈ [t0,t1]) is a continuous set of treatment values, which makes the investigation of urbanization economies’ continuous impact on firm TFP possible. This is also the reason why the GPS method proposed by Hirano and Imbens (2004) [47] follows and extends the PSM method proposed by Rosenbaum and Rubin (1983) [51] since the treatment is a binary variable in the latter study. In addition, each firm i includes a vector of covariates Xi that impact both the treatment and outcome.
In the GPS estimation, the main objective is to estimate a dose–response function (DRF), . To make the assignment of urbanization economies be random, the GPS method requires the unconfoundedness assumption to multi-valued and continuous treatments. This is referred to as weak unconfoundedness assumption since it does not require the joint independence of all potential outcomes. Specifically, this assumption implies that the outcome Y(t) is independent of different levels of treatment T, conditional on the vector of covariates X:
Then, the generalized propensity score (GPS) and average DRS can be estimated. Let R(T,X) be the GPS and, given all covariates, r(t,x) is the treatment’s conditional density:
Similar to the propensity score matching with a binary treatment, the GPS method also has a balancing property and treatment groups should be independent of the covariates:
Additionally, the regression function estimating the conditional expectation of the outcome does not have a causal interpretation, as emphasized by Hirano and Imbens (2004) [47], whereas estimating the DRF value at each level of the treatment by averaging the conditional expectation function over the GPS does have a causal interpretation.
4.2. Implementation Strategy
With regard to the implementation strategy, a flexible parametric specification of the GPS is employed. Specifically, it can be carried out in three steps. First, we model the conditional distribution of urbanization economies (treatment) employing a lognormal distribution:
After estimating and obtaining the coefficients (α0, α1) utilizing the ordinary least squares regression, the GPS can be estimated:
In a second step, the conditional expectation of R&D performers’ TFP (outcome) as a function of both the treatment level T and the GPS R by a quadratic functional form is estimated (Equation (7)). Note that, a potential nonlinear relationship between the treatment and outcome can be considered by utilizing the quadratic.
Finally, the DRF over the entire range of urbanization economies levels can be estimated given the estimations in the previous two steps:
As such, the impact of each particular level of urbanization economies on TFP of Chinese R&D performers can be obtained, employing the estimated DRS based on the covariates. In the following analysis, the measurements of treatment, outcome and covariates in our GPS model will be introduced.
4.3. Variables
(1) Treatment and outcome variables
In this research, the treatment and outcome variable are urbanization economies and firm TFP, respectively. As discussed in Section 3, the urbanization economies index is estimated following He and Pan (2010) [41] and Zhang (2014) [42] at industry-city level; as for firm TFP, the LP semi-parametric method used by Levinsohn and Petrin (2003) [44] is employed in this research. We do not explain the details here in consideration of the length of paper.
(2) Covariates
As analyzed previously, the non-random assignment of urbanization economies stems from the existence of covariates by controlling for which we can address the selection-bias issue. Specifically, we control for firm size (Scale) measured by firm sale in natural log form in this research. Current evidence shows a positive relationship between firm size and urban agglomeration or firm TFP, we hence expect positive coefficients of Scale covariates. Firm age (Age) is also included to explore the impact of firm experience on their choices to enter into the urbanization economies. This covariate represents the years from firms’ starting their business to the observed time (in natural log form). Third, we control for the return on assets (ROA) which is the ration of net profits divided by total assets. The higher is the firm ROA, the higher is the incentive of the firm to locate in urbanization economies, as it is more likely to participate in diversified economic activities. To investigate whether firm export behavior impacts its decisions on urbanization economies, the Export covariate is included which is measured by the share of firm exports in total sales. In addition, Subsidy covariate measuring firm subsidy from the government is introduced. Finally, sector dummies (2-digit GB/T manufacturing industries) and geographical regional dummies (Eastern, North East, Central and Western China) are introduced as covariates for the sake of controlling for industrial and regional heterogeneity.
Table 2 reports definitions, measurements and summary statistics of all variables.
5. Empirical Results
5.1. Estimating the Treatment and GPS
To investigate the impact of urbanization economies on TFP of R&D performers, we start by modeling the conditional distribution of urbanization economies using an OLS regression (Equation (5)), given all the covariates. Table 3 reports the estimated results. All results are found to be significant (at 1% and 5% level), implying no bias of the covariates that explain the treatment well. Specifically, there is a positive relationship between firm size (age) and urbanization economies. Chinese R&D performers that have a higher level of return on assets are more likely to locate in more urbanized regions. In contrast, we find a negative association between the export intensity of R&D performers and urbanization economies. Moreover, the negative coefficient of Subsidy covariate may indicate that subsidized Chinese R&D performers are less likely to locate in urbanized regions. Of note, as discussed by Hirano and Imbens (2004) [47], the estimated coefficients in Table 3 do not have direct causal interpretation, but just provide evidence for the effective introduction to covariates. More importantly, the GPS estimations can be further obtained as shown in Equation (6) based on the estimation in Table 3.
According to the discussion in Section 4, if the GPS is estimated correctly and properly, there will be no significant differences between the covariates at various levels of treatment, implying a satisfaction of balancing properties. To check this, we first separate firm observations into three treatment groups with respect to their quantiles of urbanization economies. Then, without GPS adjustment, we investigate how every covariate (mean value) in every treatment group is different from that in the other two treatment groups combined.
Finally, with GPS adjustment, we check whether our data sample is balanced by the estimated propensity score. Specifically, the estimated GPS at treatment’s median for all covariates is calculated following Hirano and Imbens (2004) [47]. Meanwhile, the treatment (urbanization economies) is divided into five intervals according to its quartile. As such, we can compare the average covariate values in this GPS range for each interval with that in the same treatment group but outside this GPS range. Within each of the five GPS strata, these average differences in covariate values across treatment levels are then combined into one figure, weighted by the corresponding number of firm in each GPS range. All the t-statistics for the tests of covariates’ mean values without and with GPS adjustment are reported in Table 4.
As shown in Panel A in Table 4, there is a clear lack of balance for covariates without GPS adjustment. For instance, the t-statistics of Scale covariate in interval Q2 is −6.59, implying that there are large differences of the average firm size observations in this treatment group compared with those in other two groups. In contrast, with GPS adjustment shown in Panel B in Table 4, there are few differences after balancing among these three treatment groups. For instance, only four (five) out of 15 t-statistics are larger than 1.96 (1.645), indicating the estimated GPS’ satisfaction of balancing the sample property.
5.2. Estimating the Does-Response Function
Based on the above analysis, we finally aim to estimate the DRF (dose–response function) as shown in Equation (8) for every level of urbanization economies. In this way, the counterfactual of what R&D performers’ TFP would have been to a given unit had they received a different level of urbanization economies can be answered. To obtain this, first, it is necessary to regress R&D performers’ TFP (outcome) on the urbanization economies (treatment) and estimated GPS as expressed by Equation (7). Table 5 reports the corresponding coefficients. Again, Hirano and Imbens (2004) [47] explain that these estimated results do not have a direct interpretation, and are used to calculate the DRF.
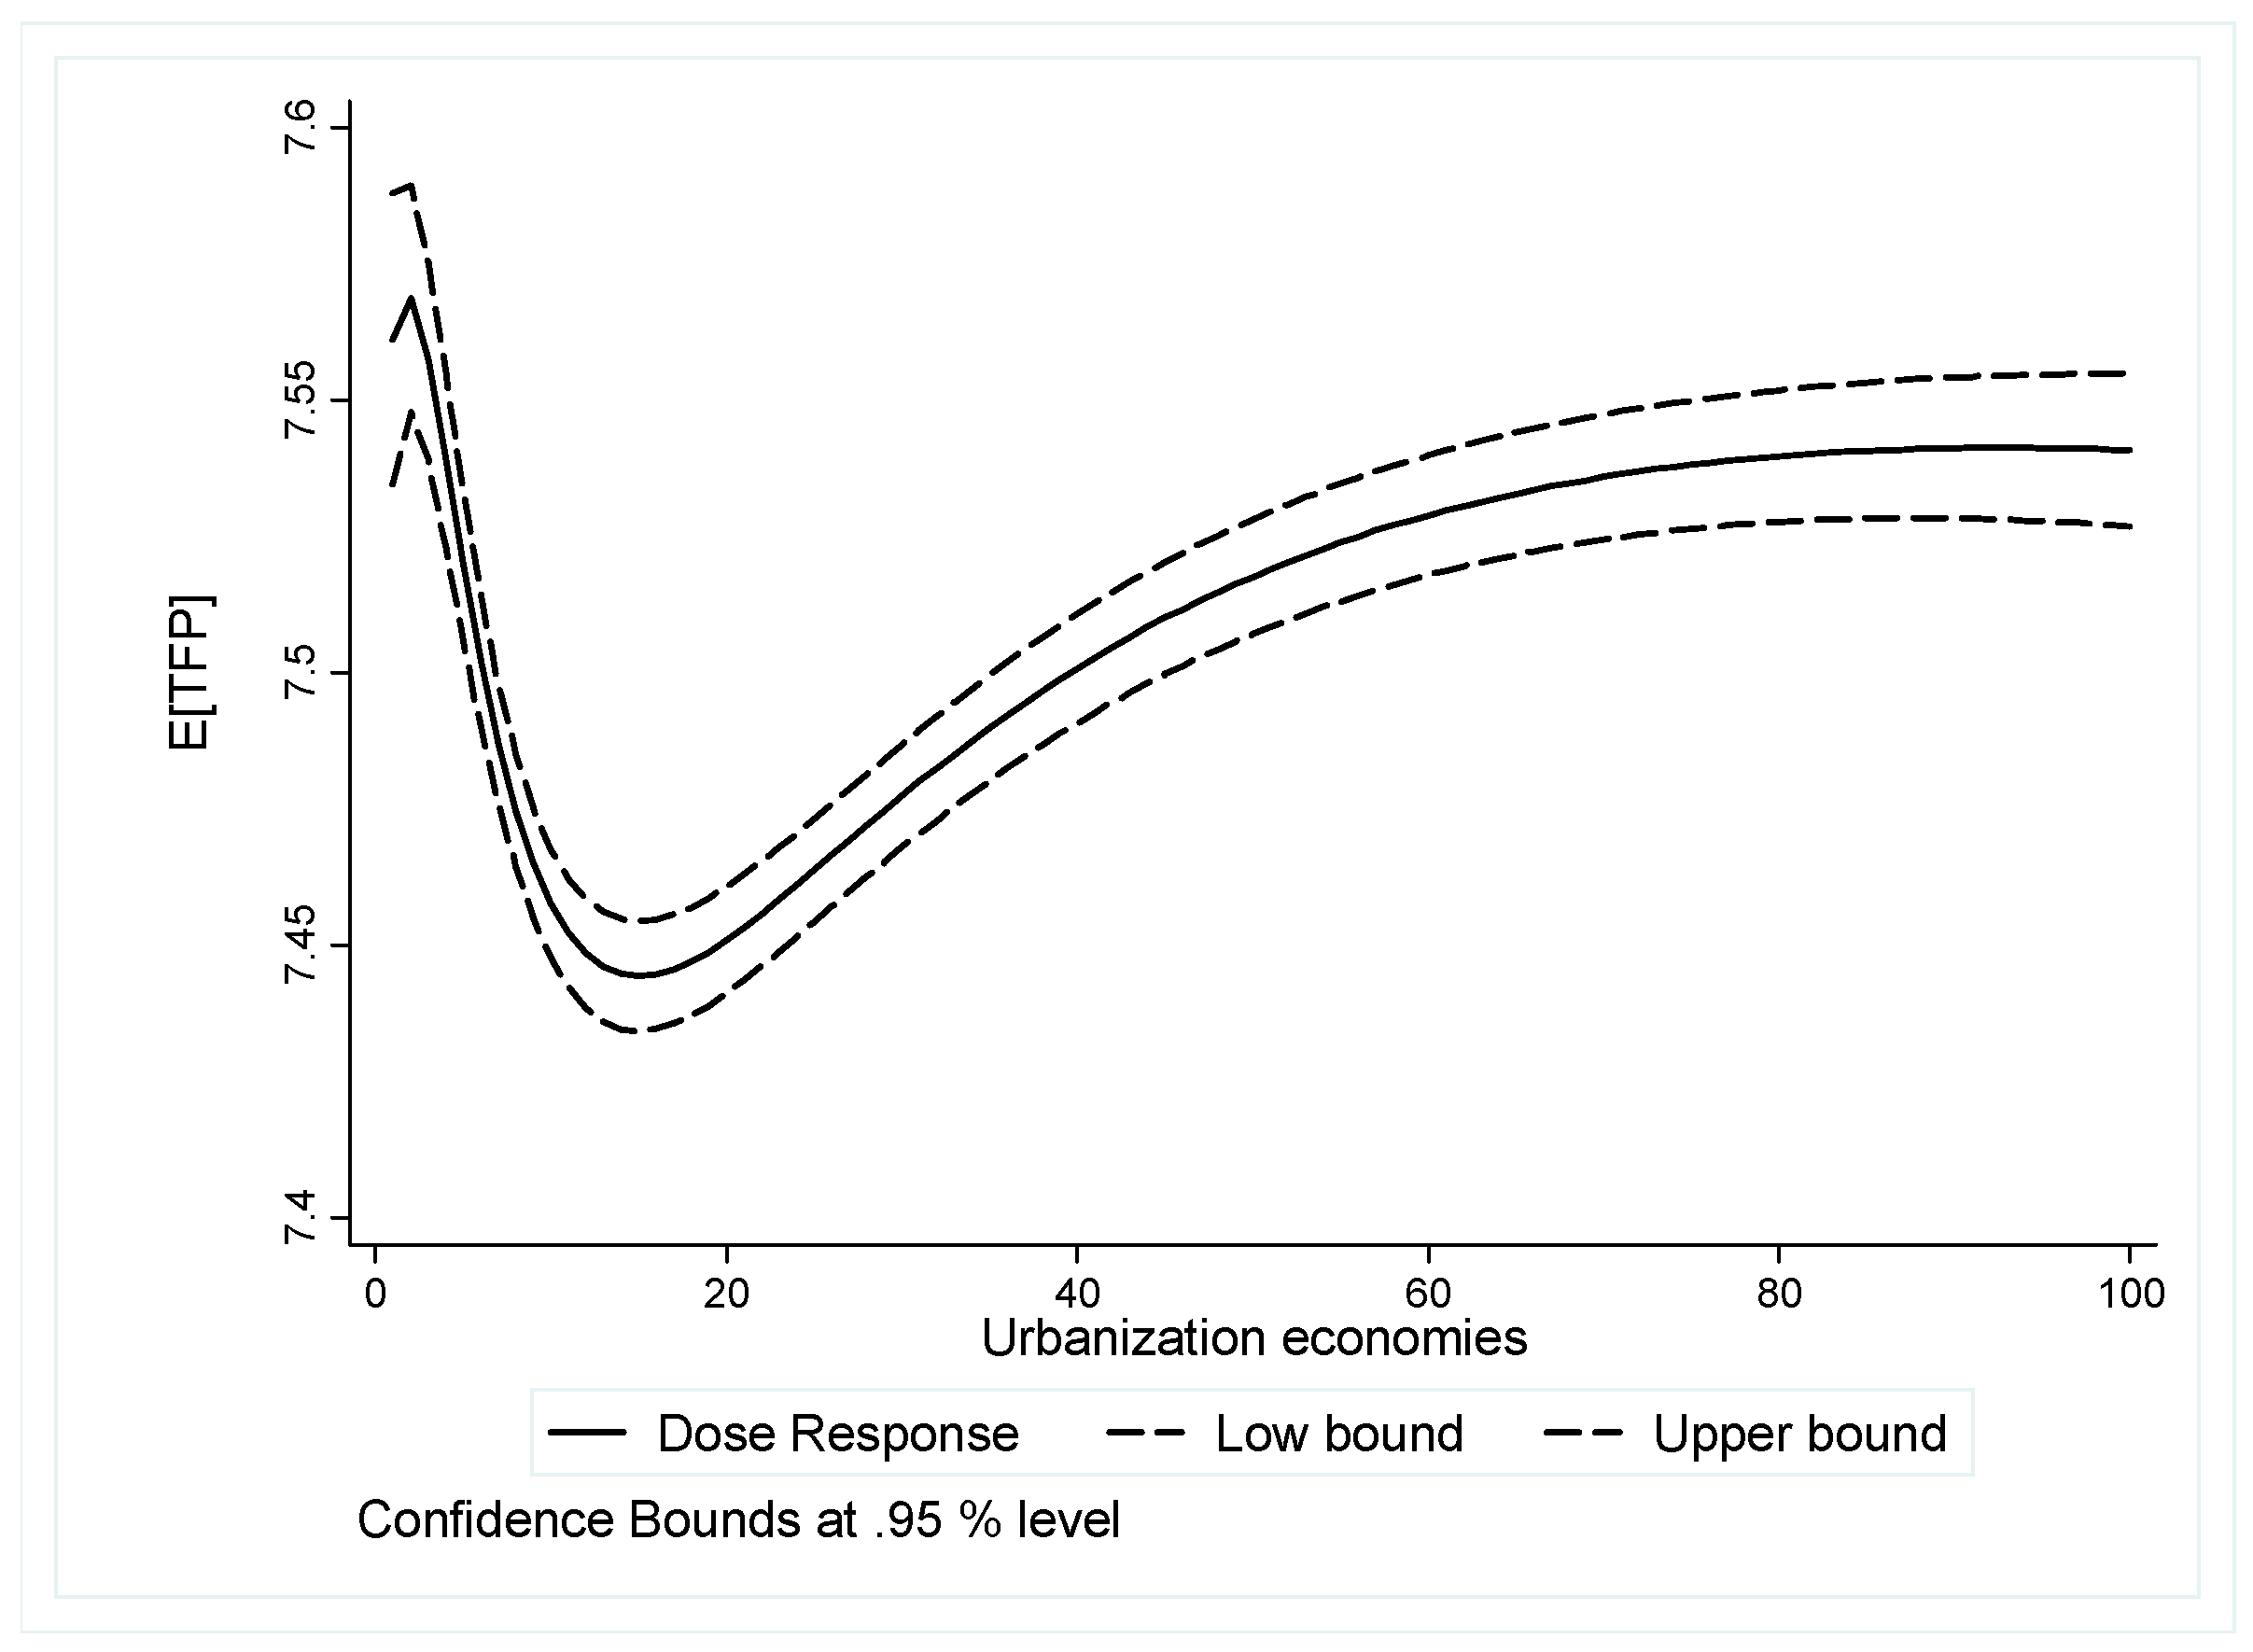
With regard to the estimated dose–response function, its curve is plotted as the solid line in Figure 4, while the 95% bootstrap confidence interval for 10,000 bootstrap replicates is plotted in the dashed lines. As presented in Figure 4, there is a nonlinear relationship between urbanization economies and R&D performers’ TFP. Moreover, the estimated dose–response function is non-negative over the entire range of treatment, showing an S-shaped relationship between urbanization economies and TFP of Chinese R&D performers.
In detail, although the slope rises at first, it rapidly turns to negative presenting a downward trend until the urbanization economies approximately reach 8.02 (18 quantile). Note that the lateral axis of DRS figures in this research shows the 0–100 quantile of treatment (urbanization economies). Second, the slope turns positive (an upward trend) when the urbanization economies level is higher than 8.02. Third, it is worth noting that the DRF’s slope turns negative again to a small extent when the urbanization economies level exceeds 298.19 (98 quantile). This implies that, when the urbanization economies level is larger than 298.19, the TFP of R&D performers shows a trend of declination.
More importantly, the above analysis derives at least three conclusions. In summary, the response of Chinese R&D performers’ TFP differs at heterogeneous levels of urbanization economies. (1) A threshold value (8.02) of urbanization economies exists, only beyond which its impact on firm TFP can be maximized. Before this threshold value, congestion effects play an increasing role, while agglomeration effects decrease, keeping consistent with our expectation. As discussed previously, the large congestion effects in this early stage of urbanization economies stem from not only the time lag effect of knowledge spillovers of agglomeration effects, but also the rapid increased costs and inter-firm competition of agglomeration. (2) The above analysis also implies that the existence of an optimal interval (8.02–298.19) in which urbanization economies’ positive impact on TFP of Chinese R&D performers can be maximized. In this optimal interval, agglomeration effects dominate, bringing a fast increase of firm TFP with the development of urbanization economies. (3) There is a saturation point (298.19), beyond which firm TFP stops growing and even decreases slightly. This implies that agglomeration effects decline again when too many firms agglomerate, resulting in an over-high level of urbanization economies and operation costs.
5.3. Extension
The exploration of urbanization economies–firm TFP nexus in this research focuses on R&D performers in China. Notably, Chinese firms are often described by their lag in the international technology arena behind firms in Western countries. For example, Zeng and Williamson (2007) [52] illustrate that Chinese exporters in high-tech industries may not be effective in catching up with the Western industry leaders, and that technological advancement is still a luxury good for them. Most innovation firms in China employ the cost innovation strategy rather than technological advancement. Considering our data sample as an example, about 16.11% and 83.89% of R&D performers operate in high- and medium–low-technology manufacturing industries, respectively. To explore whether urbanization economies–firm TFP nexus is different across industries with different intensities of technology, we estimate the dose–response function in two groups, as shown in Figure 5: firms operate in high- versus medium–low-technology industries.
The estimated dose–response functions in high- and medium–low-technology industries are consistent with that in Figure 4. This means that there are also optimal intervals, threshold values and saturation points in Figure 5, though with different values. To explore further, it is worth noting that the optimal interval exhibits a much narrower range in high-technology industries (16–43 quantile) compared to that in medium–low-technology industries (16–92 quantile). Moreover, the slope of DRF presents a more obvious downward trend after the saturation point in high-technology industry. We explain this by the fact that, although R&D performers can enjoy large extra benefits (e.g., strong knowledge spillovers) in high-technology industries, they also suffer from huge innovation costs, and large markets risks and uncertainties. These disadvantages may outweigh rapidly the corresponding benefits stemming from agglomeration effects and magnify the congest effects of urbanization economies.
In almost the first 20 years after the adoption of China’s opening-up policy in 1978, Eastern China was given relative development priority to establish strong economic “engines” in this area especially the coastal regions. As such, its agglomeration effects are expected to be larger compared to that in other three regions. In contrast, we expect a higher level of congestion effects in Western China due to its less developed economy. Therefore, to investigate how urbanization economies impact R&D performers’ TFP across different regions, the dose–response function is estimated within Eastern, North East, Central and Western China, respectively.
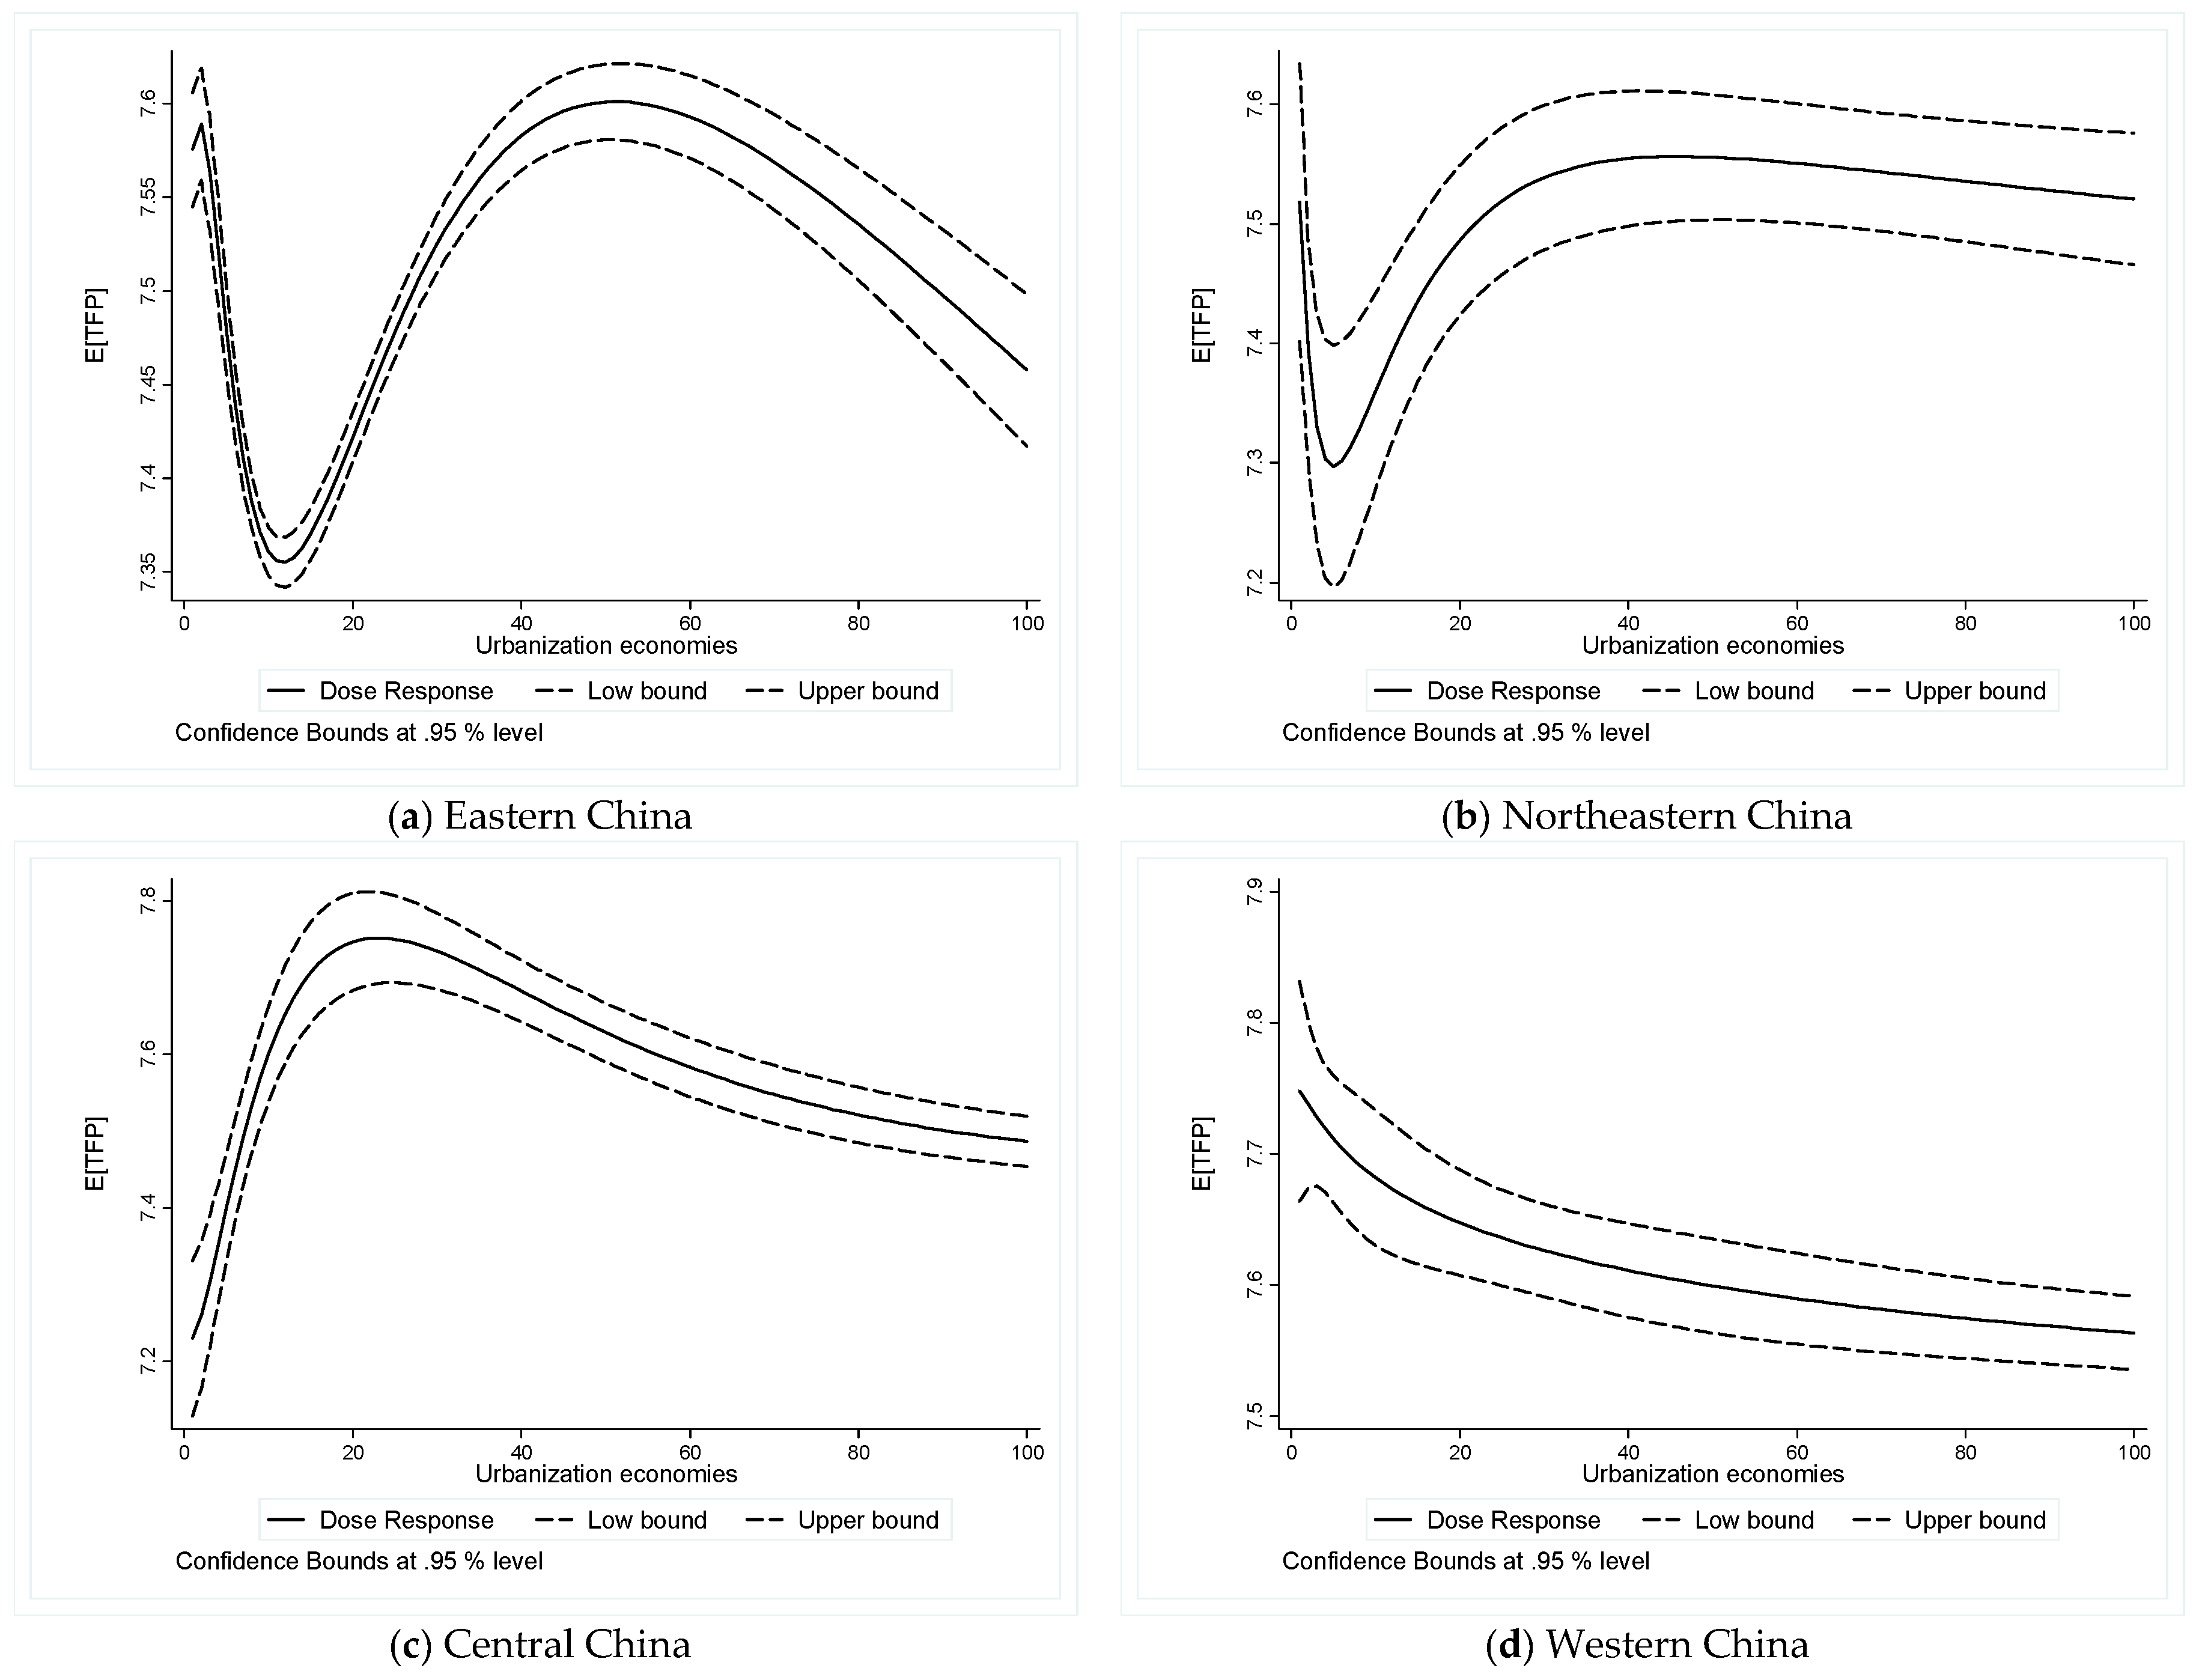
As shown in Figure 6, for Eastern and North East China, the estimated dose–response functions have a consistent pattern with that based on full data sample as shown in Figure 4. That is, urbanization economies present S-shaped relationship with TFP of Chinese R&D performers, though the optimal interval, threshold and saturation point have different values. In a further investigation, Figure 6 shows that the optimal interval of urbanization economies on firm TFP is similar between that in Eastern China (13–52 quantile) and Northeastern (6–46 quantile). Within the optimal interval, the slope of DRS increases more rapidly in the former. However, after the saturation point, the slope of DRF decreases more rapidly and obviously in Eastern China.
The above analysis implies that urbanization economies present more efficiency in its optimal interval in Eastern China compared to that in North East area, since the slope grows faster in the optimal interval. We explain this by the fact that Eastern China enjoys more economic development, which enlarges the impact of agglomeration effects. Nevertheless, a further increase in urbanization economies beyond the saturation point yields a rapid decrease of firm TFP in Eastern China, which means that, when Eastern China is over urbanized, it confronts larger congestion effects, such as higher level of over-competition, decreased profits and limitation public resources.
Of note, for Central China, the slope of estimated DRF presents a different shape from that in Figure 4 and Eastern and North East China: it is positive first and then decrease rapidly. As such, the optimal interval of urbanization economies in Central China is from 0 to 23 quantiles. Why does the optimal interval of urbanization economies come earlier with a much smaller range than that in Eastern and North East areas? Our explanation could be that, in the early period urbanization economies, the lag effects of agglomeration effects is less obvious in Central China benefiting from the government’s preferential policy (such as the strategy of Central Development). As such, its optimal interval comes much earlier. Meanwhile, congestion effects play a more important role in Central China because it is less economically developed, resulting in a much smaller range of the optimal interval of economies.
In addition, for Western China, the congestion effects are much larger since its slope of estimated DRF is negative and decreases over the entire range of urbanization economies. As such, there is no evidence showing an optimal interval in which urbanization economies can maximize its positive impact on TFP of Chinese R&D performers who locate in Western China. Although it reflects the fact that congestion effects dominate in Western China, which is less economically developed, it also implies that there is a great prospect for firms in Western China to improve TFP by efficient use of urbanization economies.
6. Conclusions
This paper aims to explore how urbanization economies impact R&D performers’ TFP in China, a large developing country that advocates technological innovation and is characterized by rapid urban agglomeration development. To conduct this research, the generalized propensity score matching (GPS) methodology is employed to address the selection-bias and endogenous problems. Meanwhile, the continuous and dynamic impact of urbanization economies on firm TFP at every level can be estimated utilizing this method.
The estimated dose–response function based on the full data sample presents a nonlinear (S-shaped) relationship between urbanization economies and TFP of Chinese R&D performers. Specifically, there is a threshold value, beyond which agglomeration effects increase rapidly. There is also a saturation point, beyond which an improvement of urbanization economies does not increase (and even decrease slightly) TFP of Chinese R&D performers. More importantly, our results show that there exists an optimal interval, in which urbanization economies’ impact on TFP of Chinese R&D performers can be maximized. In a further exploration, this S-shaped relationship between urbanization economies and firm TFP also exists in high- and medium-low-technology industries, while the optimal interval of urbanization economies is larger in the later. For Eastern and North East China, estimated dose–response functions also present consistent patterns with that based on full data sample (S-shaped). However, for Central China, there presents an inversed U-shaped relationship between urbanization economies and firm TFP, while, for Western China, there is no optimal interval of urbanization economies, implying that a further increase in urbanization economies decreases TFP of Chinese R&D performers.
Our findings yield important policy implications though there are limitations of this research. First, our research demonstrates a nonlinear (S-shaped) relationship between urbanization economies and firm TFP which is often neglected in previous studies. Importantly, we identify the existence of an optimal interval of urbanization economies in China which can provide constructive information for policy makers to improve the efficient use of urbanization economies.
Second, we suggest policy makers make different policies for firms in industries with different technology intensities since our results show that firm TFP vary among sectors with different technological levels. Specifically, Chinese R&D performers in high-technology industries are suggested to be more financially subsidized to relieve the congestion effects of urbanization economies since they confront a higher level of innovation costs, and hazards exist. Strong financial supports help R&D performers in high-technology industries enlarge the optimal interval and achieve higher efficiency in urbanization economies.
Third, for firms in Eastern China, our results imply that avoiding over-urbanized and weakening congestion effects should be given priority, since the slope of DRF decreases rapidly when urbanization economies exceed a certain value. Based on our data sample, there are about 38.9% of R&D performers in Eastern China whose level of urbanization economies falls within the optimal interval (13–52 quantile). As such, it is important for firms in Eastern China to minimize the congestion effects of urbanization economies, such as decreasing the costs of transportation, operation and the speed of agglomeration.
For firms in North East, Central and Western China, it is of vital importance to maximize the agglomeration effects and enlarge the optimal interval of urbanization economies, especially for the latter two areas. Central and Western China are less urbanized with smaller amounts of firms falling in the optimal interval of urbanization economies. For instance, the corresponding amount in Central China is 23% based on our data sample. As such, we suggest that the government helps Chinese R&D performers in Central and Western China to better improve the agglomeration effects of urbanization economies so as to obtain TFP growth, such as improving the public infrastructure and strengthening the knowledge spillover effects across different industries.
This research also sheds lights on other analyses and future studies in the relevant lines of research. For instance, whether there is a nonlinear relationship between localization economies and firm TFP deserves to be explored further. Investigating the relationship between agglomeration economies and firm performance in service industries is also of significant importance.
Acknowledgments
This work is supported by the National Natural Science Foundation of China (71601028, 71671024, 71421001), and the Fundamental Research Funds for the Central Universities (DUT17JC12).
Author Contributions
Xianneng Li and Meihong Dai designed the research framework, performed the empirical model and wrote the paper. Yuduo Lu contributed to modifying and reviewing the paper. All authors read and approved the final manuscript.
Conflicts of Interest
The authors declare no conflict of interest.
References
- Puga, D. Urbanization patterns: European versus less developed countries. J. Reg. Sci. 1998, 38, 231–252. [Google Scholar] [CrossRef] [PubMed]
- Qi, J. Agglomeration and radiation effect of the pull of urbanization. Chin. Geogr. Sci. 2003, 13, 224–227. [Google Scholar] [CrossRef]
- Finney, M.M.; Kohlhase, J.E. The effect of urbanization on labor turnover. J. Reg. Sci. 2008, 48, 311–328. [Google Scholar] [CrossRef]
- Nakamura, R. Contributions of local agglomeration to productivity: Stochastic frontier estimations from Japanese manufacturing firm data. Pap. Reg. Sci. 2012, 91, 569–597. [Google Scholar]
- Duranton, G. Growing through cities in developing countries. World Bank Res. Obs. 2015, 30, 39–73. [Google Scholar] [CrossRef]
- Chauvin, J.P.; Glaeser, E.; Ma, Y.; Tobio, K. What is different about urbanization in rich and poor countries? Cities in Brazil, China, India and the United States. J. Urban Econ. 2017, 98, 17–49. [Google Scholar] [CrossRef]
- Jofre-Monseny, J.; Marín-López, R.; Viladecans-Marsal, E. The determinants of localization and urbanization economies: Evidence from the location of new firms in Spain. J. Reg. Sci. 2014, 54, 313–337. [Google Scholar] [CrossRef]
- Glaeser, E.L.; Gottlieb, J.D. The wealth of cities: Agglomeration economies and spatial equilibrium in the United States. J. Econ. Lit. 2009, 47, 983–1028. [Google Scholar] [CrossRef]
- Hashiguchi, Y.; Tanaka, K. Agglomeration and firm-level productivity: A Bayesian spatial approach. Pap. Reg. Sci. 2015, 94, S95–S114. [Google Scholar] [CrossRef]
- Jacobs, J. The Economy of Cities; Random House: New York, NY, USA, 1969. [Google Scholar]
- Andersson, M.; Loof, H. Agglomeration and productivity: Evidence from firm-level data. Ann. Reg. Sci. 2011, 46, 601–620. [Google Scholar] [CrossRef]
- Marshall, A. Principles of Economies, 8th ed.; Macmillan: London, UK, 1920. [Google Scholar]
- Weber, A. Theory of the Location of Industries; Chicago University Press: Chicago, IL, USA, 1929. [Google Scholar]
- Rosenthal, S.S.; Strange, W.C. The determinants of agglomeration. J. Urban Econ. 2001, 50, 191–229. [Google Scholar] [CrossRef]
- Melo, P.C.; Graham, D.J.; Noland, R.B. A meta-analysis of estimates of urban agglomeration economies. Reg. Sci. Urban Econ. 2009, 39, 332–342. [Google Scholar] [CrossRef]
- Hoover, E.M. Location Theory and the Shoe Leather Industries; Harvard University Press: Cambridge, UK, 1937. [Google Scholar]
- Cainelli, G.; Fracasso, A.; Marzetti, G.V. Spatial agglomeration and productivity in Italy: A panel smooth transition regression approach. Pap. Reg. Sci. 2014, 94, S39–S67. [Google Scholar] [CrossRef]
- Li, J. China to Promote Competitive Advantage. China Daily, 2012. Available online: http://www.chinadaily.com.cn/bizchina/innovative/2012-02/29/content_14742767.htm (accessed on 12 September 2017).
- Combes, P.P.; Duranton, G.; Gobillon, L. The identification of agglomeration economies. J. Econ. Geogr. 2010, 11, 253–266. [Google Scholar] [CrossRef]
- Broersma, L.; Oosterhaven, J. Regional labor productivity in the Netherlands: Evidence of agglomeration and congestion effects. J. Reg. Sci. 2009, 49, 483–511. [Google Scholar] [CrossRef]
- Dai, X.Y.; Cheng, L.W. The effect of public subsidies on corporate R&D investment: An application of the generalized propensity score. Technol. Forecast. Soc. Chang. 2015, 90, 410–419. [Google Scholar]
- Doyle, W.R. Effect of increased academic momentum on transfer rates: An application of the generalized propensity score. Econ. Educ. Rev. 2012, 30, 191–200. [Google Scholar] [CrossRef]
- Deng, Z.L.; Guo, H.L.; Zhang, W.F.; Wang, C.Q. Innovation and survival of exporters: A contingency perspective. Int. Bus. Rev. 2014, 23, 396–406. [Google Scholar] [CrossRef]
- Feldman, M.P. The new economies of innovation, spillovers and agglomeration: A review of empirical studies. Econ. Innov. New Technol. 1999, 8, 5–25. [Google Scholar] [CrossRef]
- De Witte, K.; Marques, R. Big and beautiful? On non-parametrically measuring scale economies in non-convex technologies. J. Product. Anal. 2011, 35, 213–230. [Google Scholar] [CrossRef]
- Henderson, J.V. The sizes and types of cities. Am. Econ. Rev. 1974, 64, 640–656. [Google Scholar]
- Henderson, J.V. Marshall’s scale economies. J. Urban Econ. 2003, 53, 1–28. [Google Scholar] [CrossRef]
- Brülhart, M.; Mathys, N.A. Sectoral agglomeration economies in a panel of European regions. Reg. Sci. Urban Econ. 2008, 38, 348–362. [Google Scholar] [CrossRef]
- Aberg, Y. Regional productivity differences in Swedish manufacturing. Reg. Urban Econ. 1973, 3, 131–155. [Google Scholar] [CrossRef]
- Sveikauskas, L. The productivity of cities. Q. J. Econ. 1975, 89, 393. [Google Scholar] [CrossRef]
- Lall, S.V.; Shalize, Z.; Deichmann, U. Agglomeration economies and productivity in Indian industry. J. Dev. Econ. 2004, 73, 643–673. [Google Scholar] [CrossRef]
- Graham, D.J.; Kim, H.Y. An empirical analytical framework for agglomeration economies. Annu. Reg. Sci. 2008, 42, 267–289. [Google Scholar] [CrossRef]
- Capello, R. Entrepreneurship and spatial externalities: Theory and measurement. Ann. Reg. Sci. 2002, 36, 387–402. [Google Scholar] [CrossRef]
- Martin, P.; Mayer, T.; Mayneris, F. Spatial concentration and plant-level productivity in France. J. Urban Econ. 2011, 69, 182–195. [Google Scholar] [CrossRef]
- Saito, H.; Gopinath, M. Plants’ self-selection, agglomeration economies and regional productivity in Chile. J. Econ. Geogr. 2009, 9, 539–558. [Google Scholar] [CrossRef]
- Guo, Q.; He, C.; Li, D. Entrepreneurship in China: The role of localization and urbanization economies. Urban Stud. 2016, 53, 2584–2606. [Google Scholar] [CrossRef]
- Goldberg, P.K.; Khandelwal, A.K.; Pavcnik, N.; Topalova, P. Multiproduct firms and product turnover in the developing world: Evidence from India. Rev. Econ. Stat. 2010, 92, 1042–1049. [Google Scholar] [CrossRef]
- Ding, S.; Guariglia, A.; Knight, J. Investment and financing constraints in China: Does working capital management make a difference? J. Bank. Financ. 2013, 37, 1490–1507. [Google Scholar] [CrossRef]
- Ma, Y.; Tang, H.W.; Zhang, Y.F. Factor intensity, product switching, and productivity: Evidence from Chinese exporters. J. Int. Econ. 2014, 92, 349–362. [Google Scholar] [CrossRef]
- Upward, R.; Wang, Z.; Zheng, J. Weighing China’s export basket: The domestic content and technology intensity of Chinese exports. J. Comp. Econ. 2013, 41, 527–543. [Google Scholar] [CrossRef]
- He, C.; Pan, F. Economic transition, dynamic externalities and city-industry growth in China. Urban Stud. 2010, 47, 121–144. [Google Scholar] [CrossRef]
- Zhang, P.; He, C.F.; Sun, Y.F. Agglomeration economies and firm R&D efforts: An analysis of China’s electronics and telecommunications industries. Ann. Reg. Sci. 2014, 53, 671–701. [Google Scholar]
- Simões, P.; Marques, R. Influence of regulation on the productivity of waste utilities. What can we learn with the Portuguese experience? Waste Manag. 2012, 32, 1266–1275. [Google Scholar] [CrossRef] [PubMed]
- Levinsohn, J.; Petrin, A. Estimating production functions using inputs to control for unobservables. Rev. Econ. Stud. 2003, 70, 317–341. [Google Scholar] [CrossRef]
- Olley, G.S.; Pakes, A. The dynamics of productivity in the telecommunication equipment industry. Econometrica 1996, 64, 1263–1297. [Google Scholar] [CrossRef]
- Beveren, I.V. Total factor productivity estimation: A practical review. J. Econ. Surv. 2012, 26, 98–128. [Google Scholar] [CrossRef]
- Hirano, K.; Imbens, G.W. The Propensity Score with Continuous Treatments. Applied Bayesian Modeling and Causal Inference from Incomplete-Data Perspectives; Wiley: New York, NY, USA, 2004; pp. 73–84. [Google Scholar]
- Combes, P.; Duranton, G.; Gobillon, L.; Puga, D.; Roux, S. The productivity advantages of large cities: Distinguishing agglomeration from firm selection. Econometrica 2012, 80, 2543–2594. [Google Scholar]
- Melitz, M.J.; Ottaviano, G.I.P. Market size, trade, and productivity. Rev. Econ. Stud. 2008, 75, 295–316. [Google Scholar] [CrossRef] [Green Version]
- Okubo, T.; Tomiura, E. Industrial relocation policy, productivity and heterogeneous plants: Evidence from Japan. Reg. Sci. Urban Econ. 2012, 42, 230–239. [Google Scholar] [CrossRef]
- Rosenbaum, P.R.; Rubin, D.B. The central role of the propensity score in observational studies for causal effects. Biometrika 1983, 70, 41–55. [Google Scholar] [CrossRef]
- Zeng, M.; Williamson, P.J. Dragons at Your Door: How Chinese Cost Innovation Is Disrupting Global Competition; Harvard Business School Press: Boston, MA, USA, 2007. [Google Scholar]
Figure 1.
Distribution in the top 10 2-digit GB/T manufacturing industries ordered by firm TFP, over 2005–2007.
Figure 1.
Distribution in the top 10 2-digit GB/T manufacturing industries ordered by firm TFP, over 2005–2007.
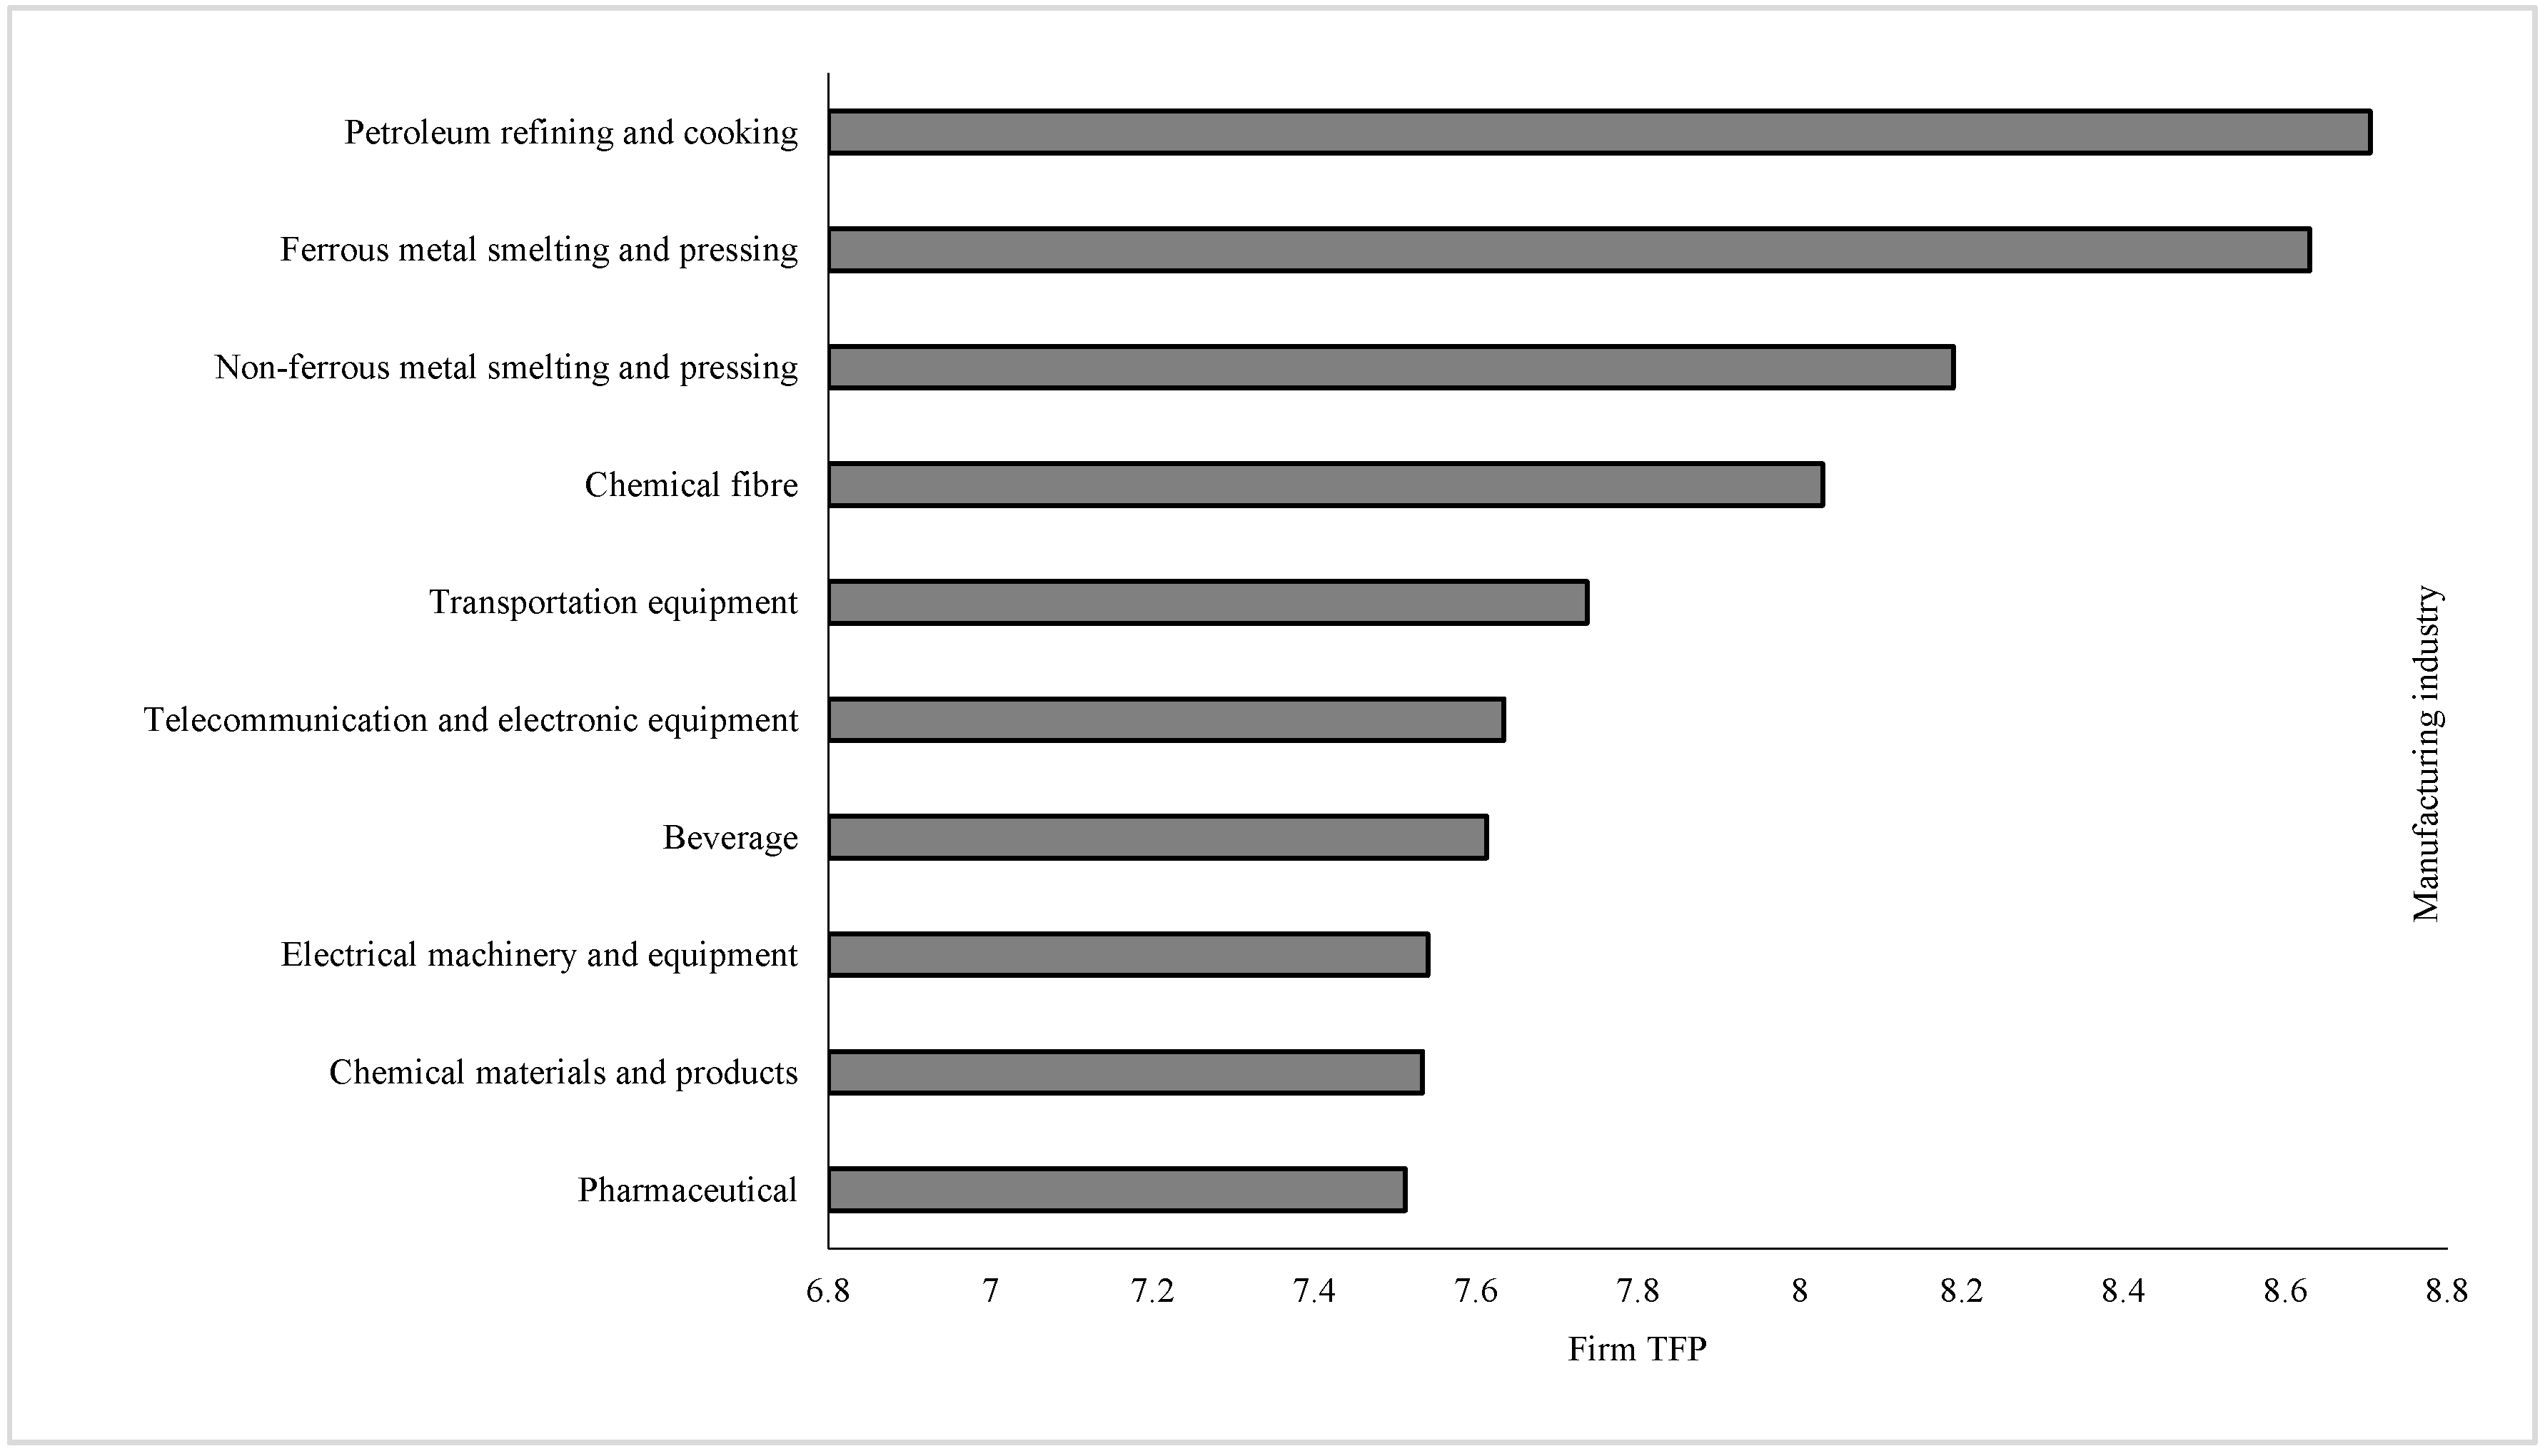
Figure 2.
Average TFP of Chinese R&D performers, by provinces and municipalities, 2005–2007.

Figure 3.
Firm TFP distribution across the category of urbanization economies.
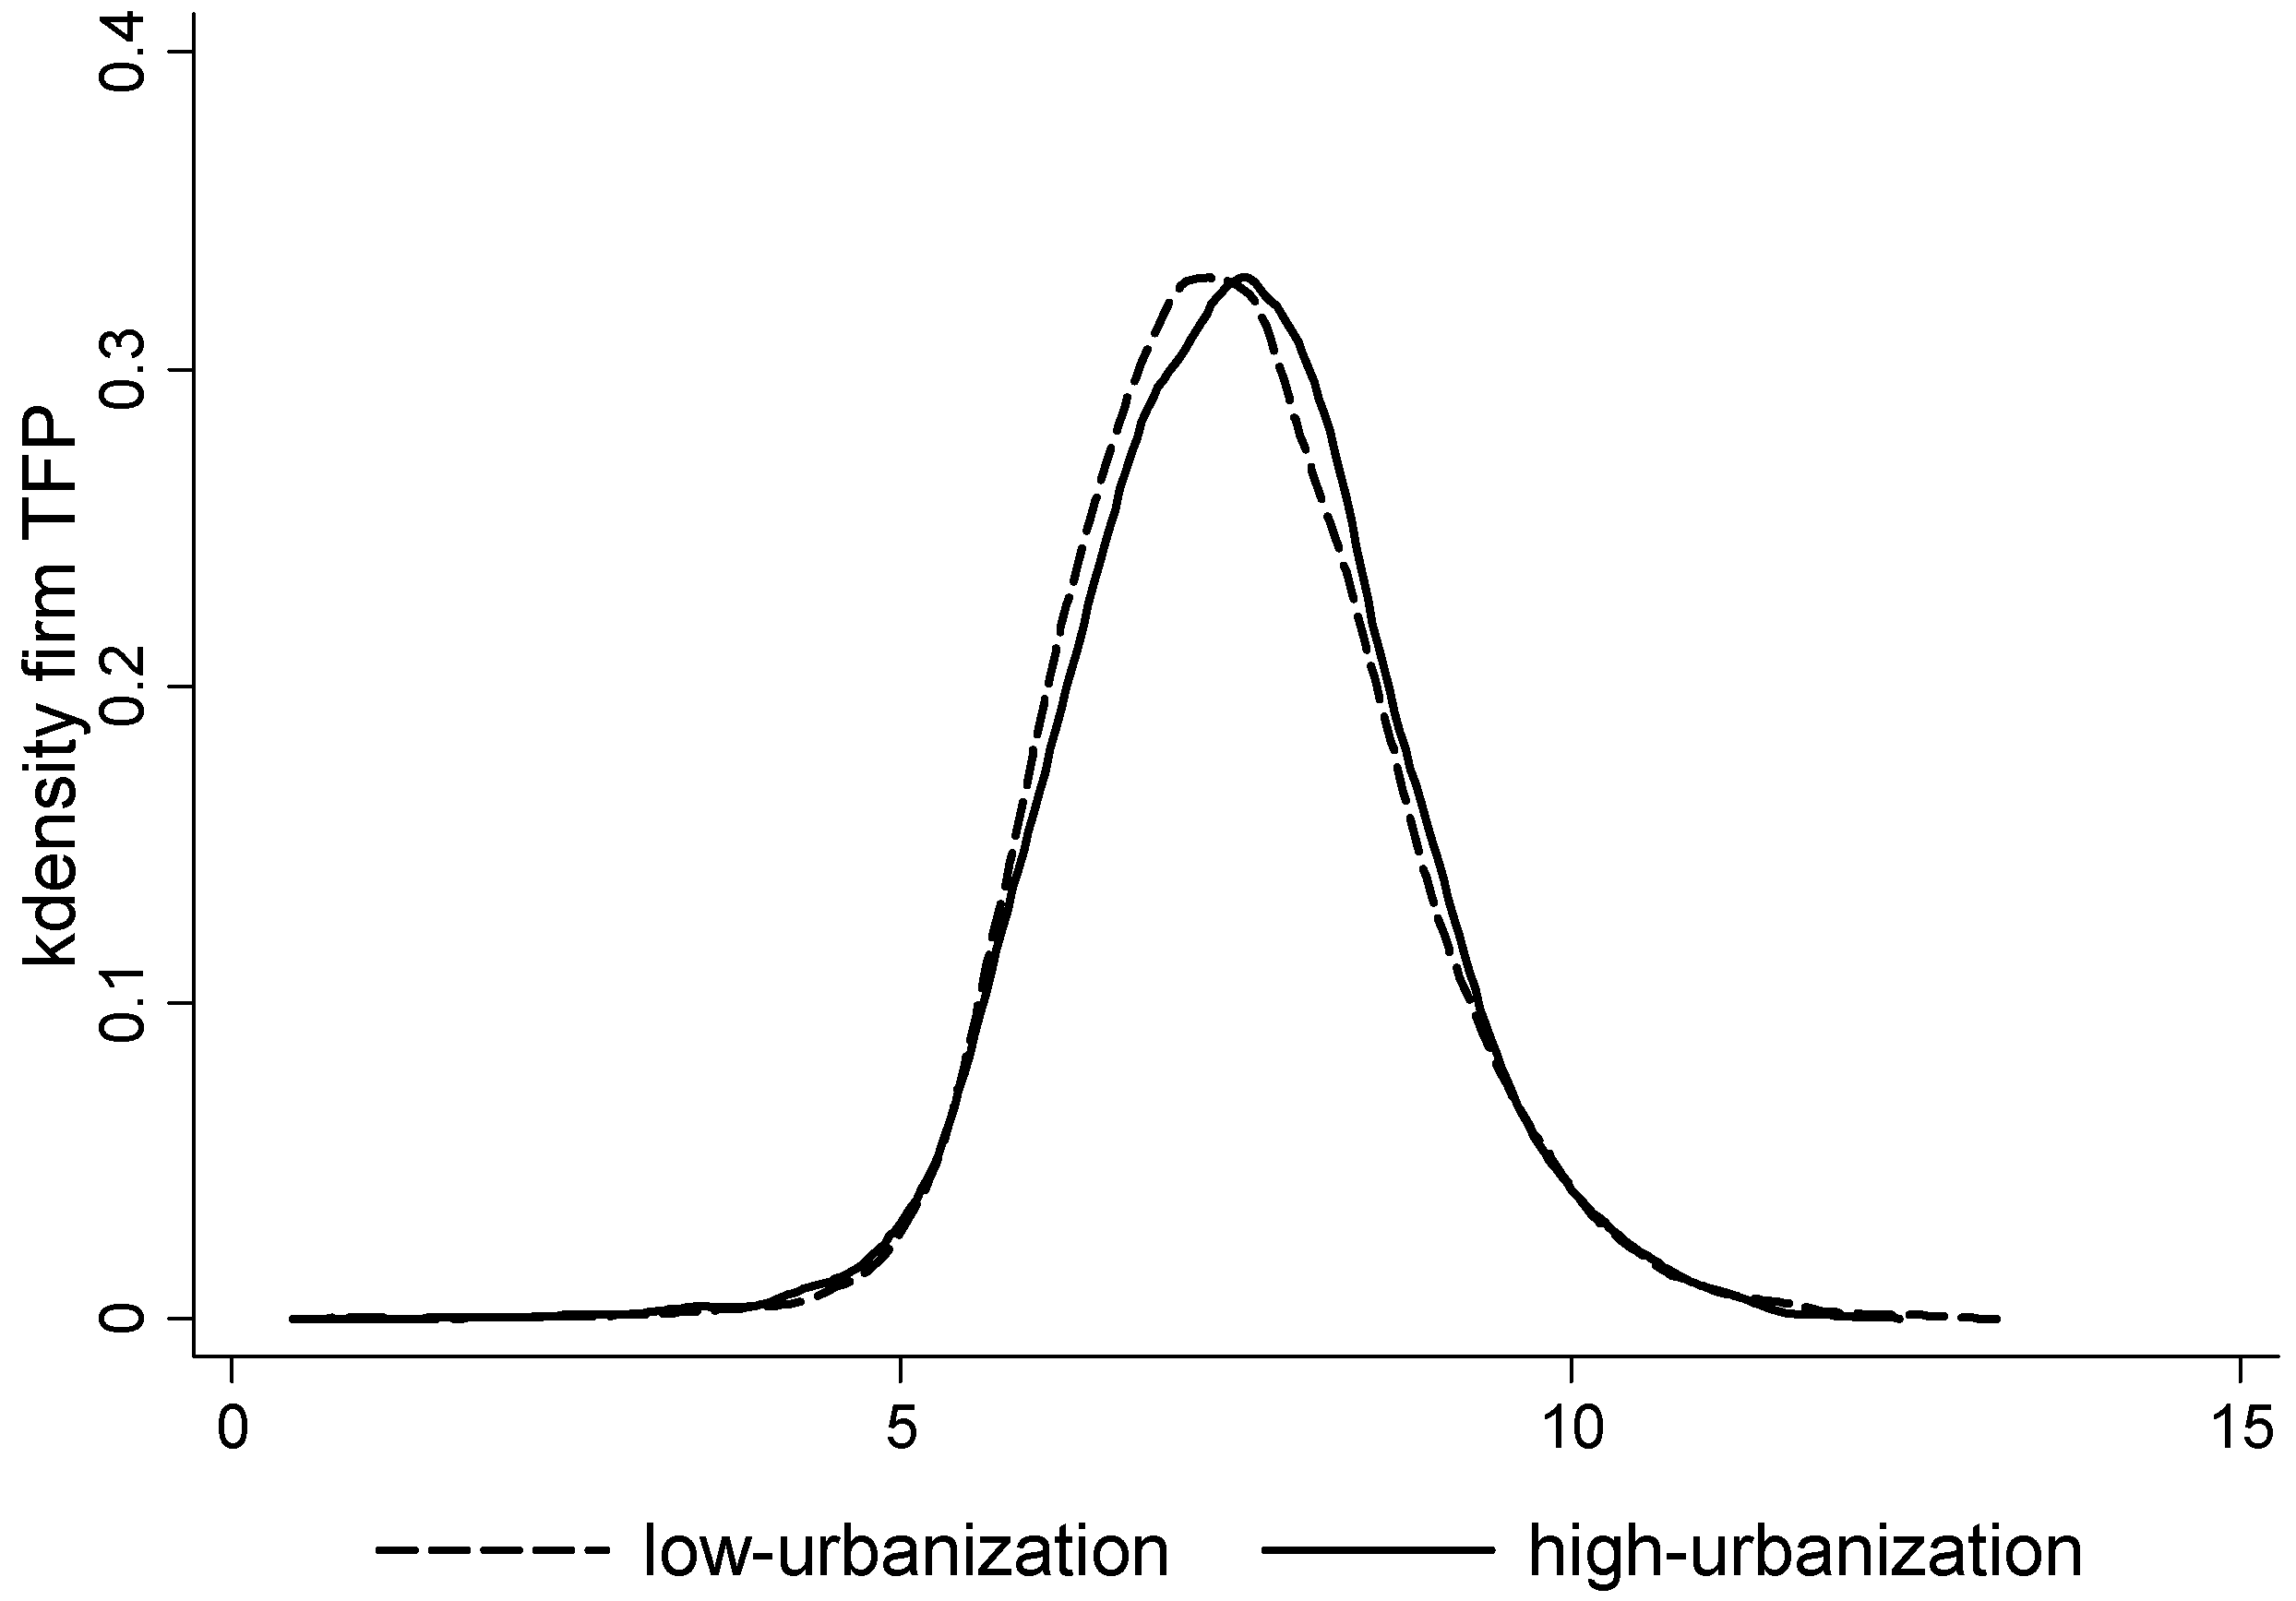
Figure 4.
Estimated dose–response function.

Figure 5.
Estimated dose–response functions across manufacturing industries.
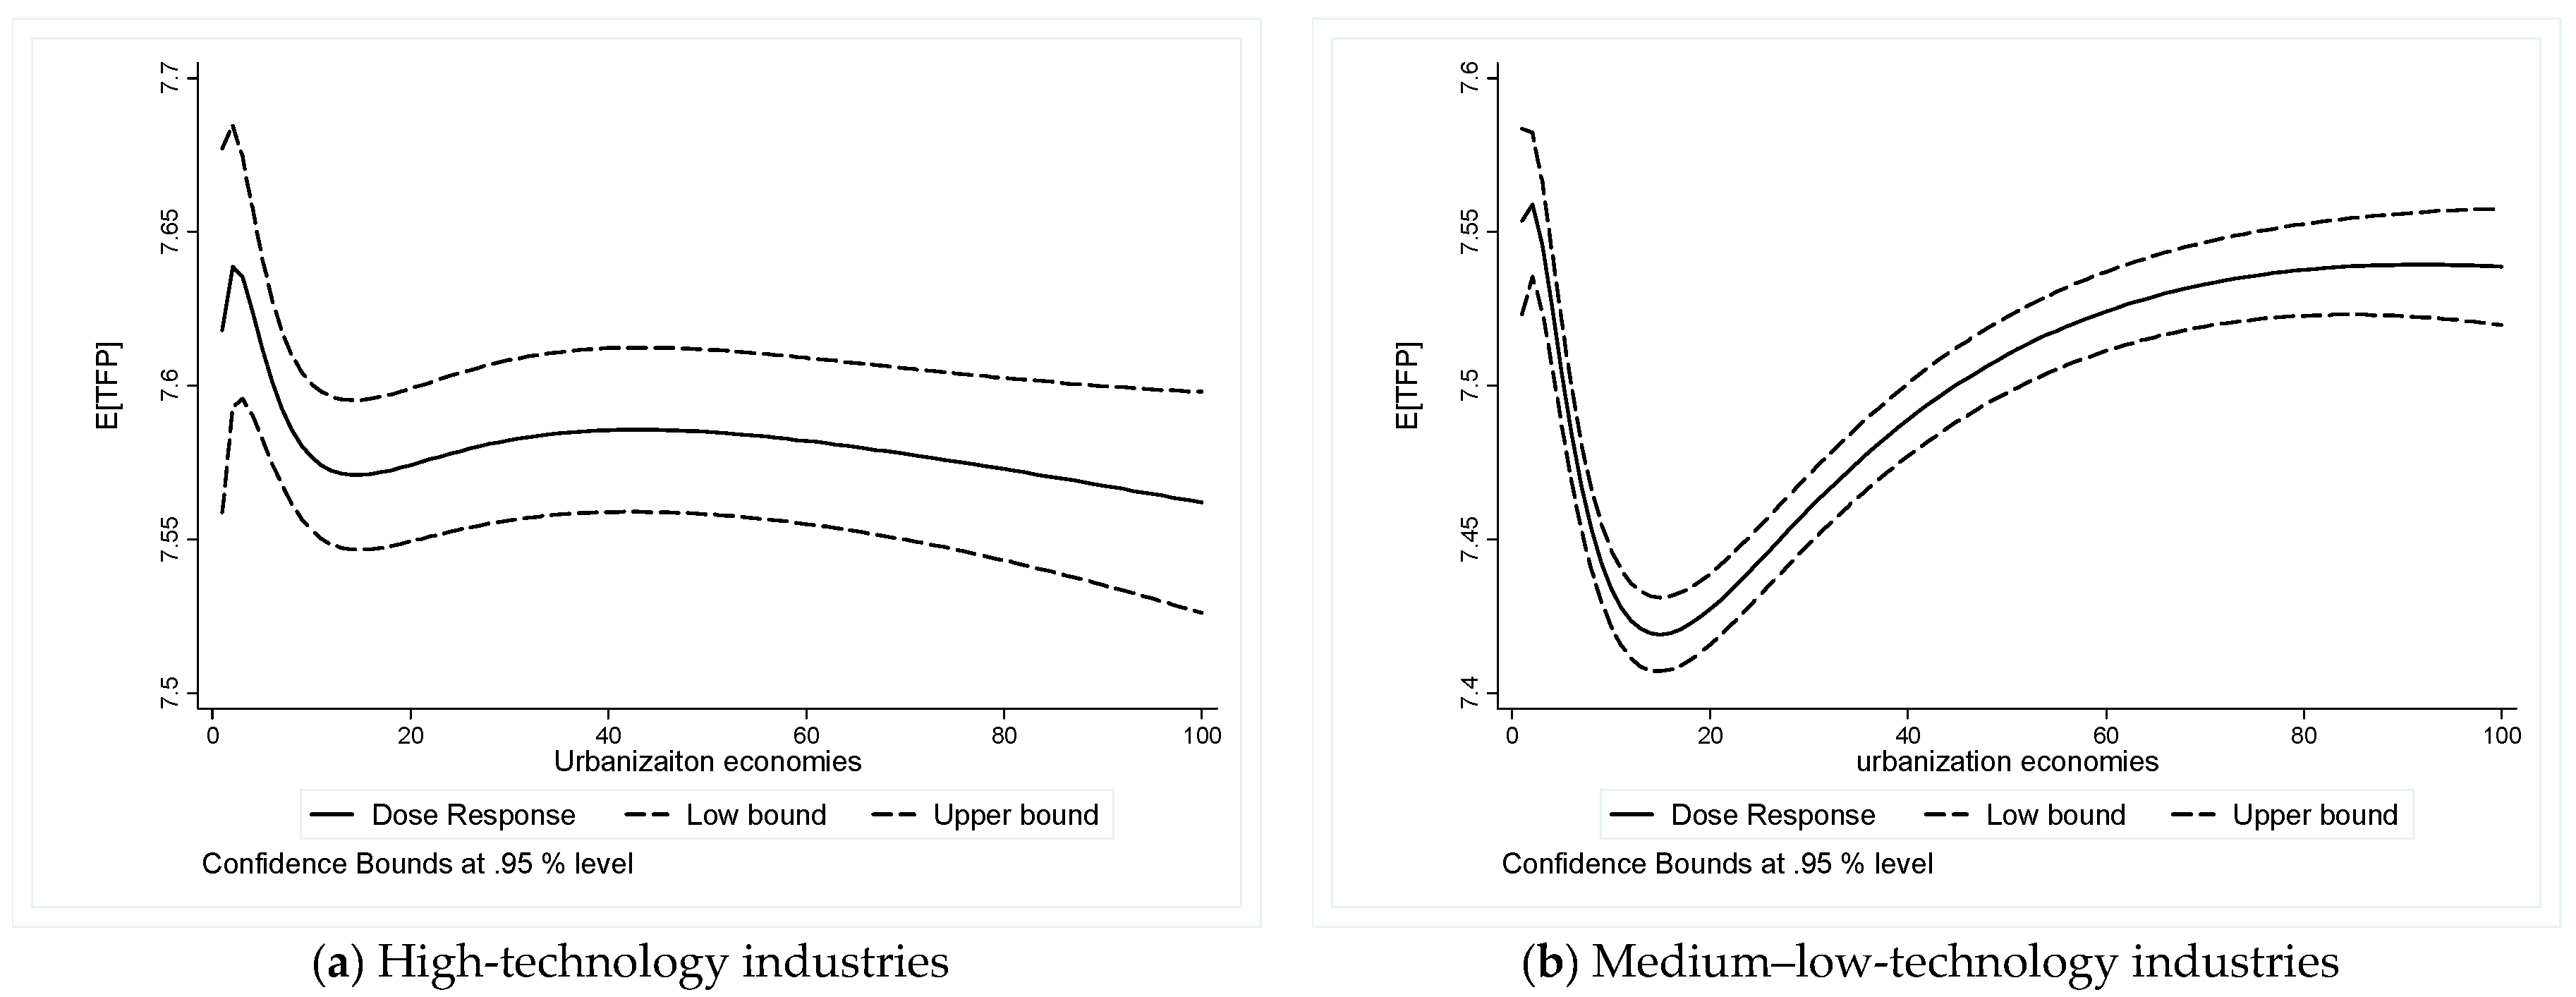
Figure 6.
Estimated dose–response functions across geographical regions.

Table 1.
An overview of R&D performers and urbanization economies.
| Year | Urbanization Economies (Mean Value) | R&D Performers | |
|---|---|---|---|
| No. Firms | R&D (Billion Yuan) | ||
| 2005 | 50.20 | 24,033 | 82.68 |
| 2006 | 49.26 | 27,903 | 111.73 |
| 2007 | 48.26 | 33,019 | 150.19 |
Table 2.
Definitions and measurements of covariates.
| Treatment | Unit | Measurement | Mean | S.D. |
| UE | Ratio | UE index used by He and Pan (2010) [41] and Zhang (2014) [42], | 49.14 | 99.94 |
| Outcome | Measurement | |||
| TFP | Natural logarithm form | TFP used by Levinsohn and Petrin (2003) [44] | 7.48 | 1.25 |
| Covariate | Measurement | |||
| Scale | Natural logarithm form (thousand Yuan) | Firm sale | 5.34 | 1.30 |
| Age | Natural logarithm form (No. years) | No. years since firm started business | 1.99 | 0.92 |
| ROA | Ratio | Net profit per currency unit of total assets | 0.09 | 0.17 |
| Export | Ratio | Export value per unit of total sales | 0.17 | 0.31 |
| Subsidy | Ratio | Firm subsidy per unit of total sales | 4.7 × 10⁻³ | 0.03 |
| Industry dummies | - | Defined at the 2-digit GB/T manufacturing industry level | - | - |
| Region dummies | - | Four regions in total (the Eastern, North East, Central and Western China) | - | - |
Table 3.
Estimations of the GPS.
| Covariate | Coefficient | z-Statistics |
|---|---|---|
| Scale | 0.013 *** | 3.28 |
| Age | 0.015 *** | 2.86 |
| ROA | 0.142 *** | 5.17 |
| Export | −0.350 *** | −21.93 |
| Subsidy | −0.332 ** | −2.28 |
| Industry dummies | Yes. | |
| Region dummies | Yes. | |
| No. observations | 84,955 | |
Note: ** and *** indicates 5% and 1% significance, respectively.
Table 4.
Balance in covariates: t-statistics for equality of means.
| Panel A: Without Adjustment | Interval Q1 | Interval Q2 | Interval Q3 |
| Scale | −11.48 | −6.59 | 17.81 |
| Age | −2.24 | −2.40 | 4.25 |
| ROA | −6.97 | −4.22 | 9.31 |
| Export | 26.68 | 26.46 | −64.65 |
| Subsidy | −1.00 | −1.75 | 3.23 |
| Panel B: with adjustment | Interval Q1 | Interval Q2 | Interval Q3 |
| Scale | −1.28 | −2.99 | 5.79 |
| Age | 0.32 | −2.41 | −1.61 |
| ROA | 1.59 | 0.09 | −0.88 |
| Export | −1.65 | −1.09 | 2.88 |
| Subsidy | 0.56 | 1.23 | 0.77 |
Table 5.
Parameter estimates of conditional distribution of R&D performers’ TFP given the treatment and GPS.
Table 5.
Parameter estimates of conditional distribution of R&D performers’ TFP given the treatment and GPS.
| Variable | Coefficient | t-Statistics |
|---|---|---|
| UE | −8.41 × 10⁻⁴ *** | −7.99 |
| UE2 | 9.21 × 10⁻⁸ *** | 7.67 |
| GPS | 0.94 *** | 4.06 |
| GPS2 | −4.94 *** | −7.40 |
| UE × GPS | 0.01 *** | 8.47 |
| Constant | 7.54 *** | 433.09 |
| No. observations | 84,955 | |
Note: *** indicates 1% significance.
© 2017 by the authors. Licensee MDPI, Basel, Switzerland. This article is an open access article distributed under the terms and conditions of the Creative Commons Attribution (CC BY) license (http://creativecommons.org/licenses/by/4.0/).
Share and Cite
MDPI and ACS Style
Dai, M.; Li, X.; Lu, Y. How Urbanization Economies Impact TFP of R&D Performers: Evidence from China. Sustainability 2017, 9, 1766. https://doi.org/10.3390/su9101766
AMA Style
Dai M, Li X, Lu Y. How Urbanization Economies Impact TFP of R&D Performers: Evidence from China. Sustainability. 2017; 9(10):1766. https://doi.org/10.3390/su9101766
Chicago/Turabian StyleDai, Meihong, Xianneng Li, and Yuduo Lu. 2017. "How Urbanization Economies Impact TFP of R&D Performers: Evidence from China" Sustainability 9, no. 10: 1766. https://doi.org/10.3390/su9101766
Note that from the first issue of 2016, this journal uses article numbers instead of page numbers. See further details here.