Using DEMATEL and Intuitionistic Fuzzy Sets to Identify Critical Factors Influencing the Recycling Rate of End-Of-Life Vehicles in China

1
Business School of Sichuan University, No. 24 South Section 1, Yihuan Road, Chengdu 610065, China
2
College of Economics and Management, Sichuan Tourism University, No. 459 Hong Ling Road, Longquanyi District, Chengdu 610010, China
*
Author to whom correspondence should be addressed.
Sustainability 2017, 9(10), 1873; https://doi.org/10.3390/su9101873
Submission received: 15 August 2017
/
Revised: 13 October 2017
/
Accepted: 16 October 2017
/
Published: 24 October 2017
(This article belongs to the Special Issue Advances in Multiple Criteria Decision Making for Sustainability: Modeling and Applications)
Abstract
:At present, the recycling rate of End-of-life vehicles (ELVs) in China is far lower than the heavily motorized countries, resulting in severe environmental pollution, waste of resource and hidden traffic troubles, which has a negative impact on China’s economic and social sustainable development. With the arrival of the peak season of generating ELVs in China, it is urgent and important to improve the recycling rate of ELVs. The recycling rate of ELVs is influenced by multiple factors together. The existing research about the identification of influence factors of ELV recycling rate fewer considers the interaction effect among different factors. To fill the gap, firstly the influence factors are analyzed from standpoints of economy, policy, recycling network and others. Then a hybrid model based on DEMATEL (decision making trial and evaluation laboratory) and intuitionistic fuzzy sets is employed to examine the cause–effect relationships among factors. In the study, the vagueness of decision makers’ judgment and linguistic inaccuracy is dealt with effectively by intuitionistic fuzzy sets. The research results reveal “fiscal subsidy”, “government’s restrictive policies to reuse ELVs parts”, “coordination of the industry agencies”, “participation of automobile manufacturer” and “supervision of the government” are most significant criteria influencing the recycling rate of ELVs in China. A sensitivity analysis is conducted to verify the robustness of results. Lastly, according to the critical influencing factors identified, some pertinent suggestions to the government, ELV recycling enterprise, owner and vehicle manufacturer are put forward. In addition, the future research directions are proposed.
1. Introduction
In recent years, China’s auto industry maintains more than 10% growth each year. China has become the largest automotive producer and consumer since 2009 [1,2]. It is estimated that the stock of registered vehicles in use will be more than 200 million by the end of 2017, making China the second largest in the world. Accordingly, a large number of end-of-life vehicles (ELVs) are generated. It is estimated that the number of ELVs in China will reach 13 million by 2020 [3,4]. Compared with other end-of-life products, scrap cars have been regarded as the important part of the urban mines. About 75% (by weight meter) materials of an ELV are recyclable. If the dismantled parts are remanufactured, 50% of production cost of a new car can be saved [5]. It is helpful to realize sustainable development of automobile industry by the collecting, disassembling and recycling of ELVs. Besides, it also has positive impact on energy saving and emission reduction [3,6]. ELV dismantling and recycling industry, as an important component of energy saving and environmental protection industry, has been an emphatically supported and encouraged industry in China [4].
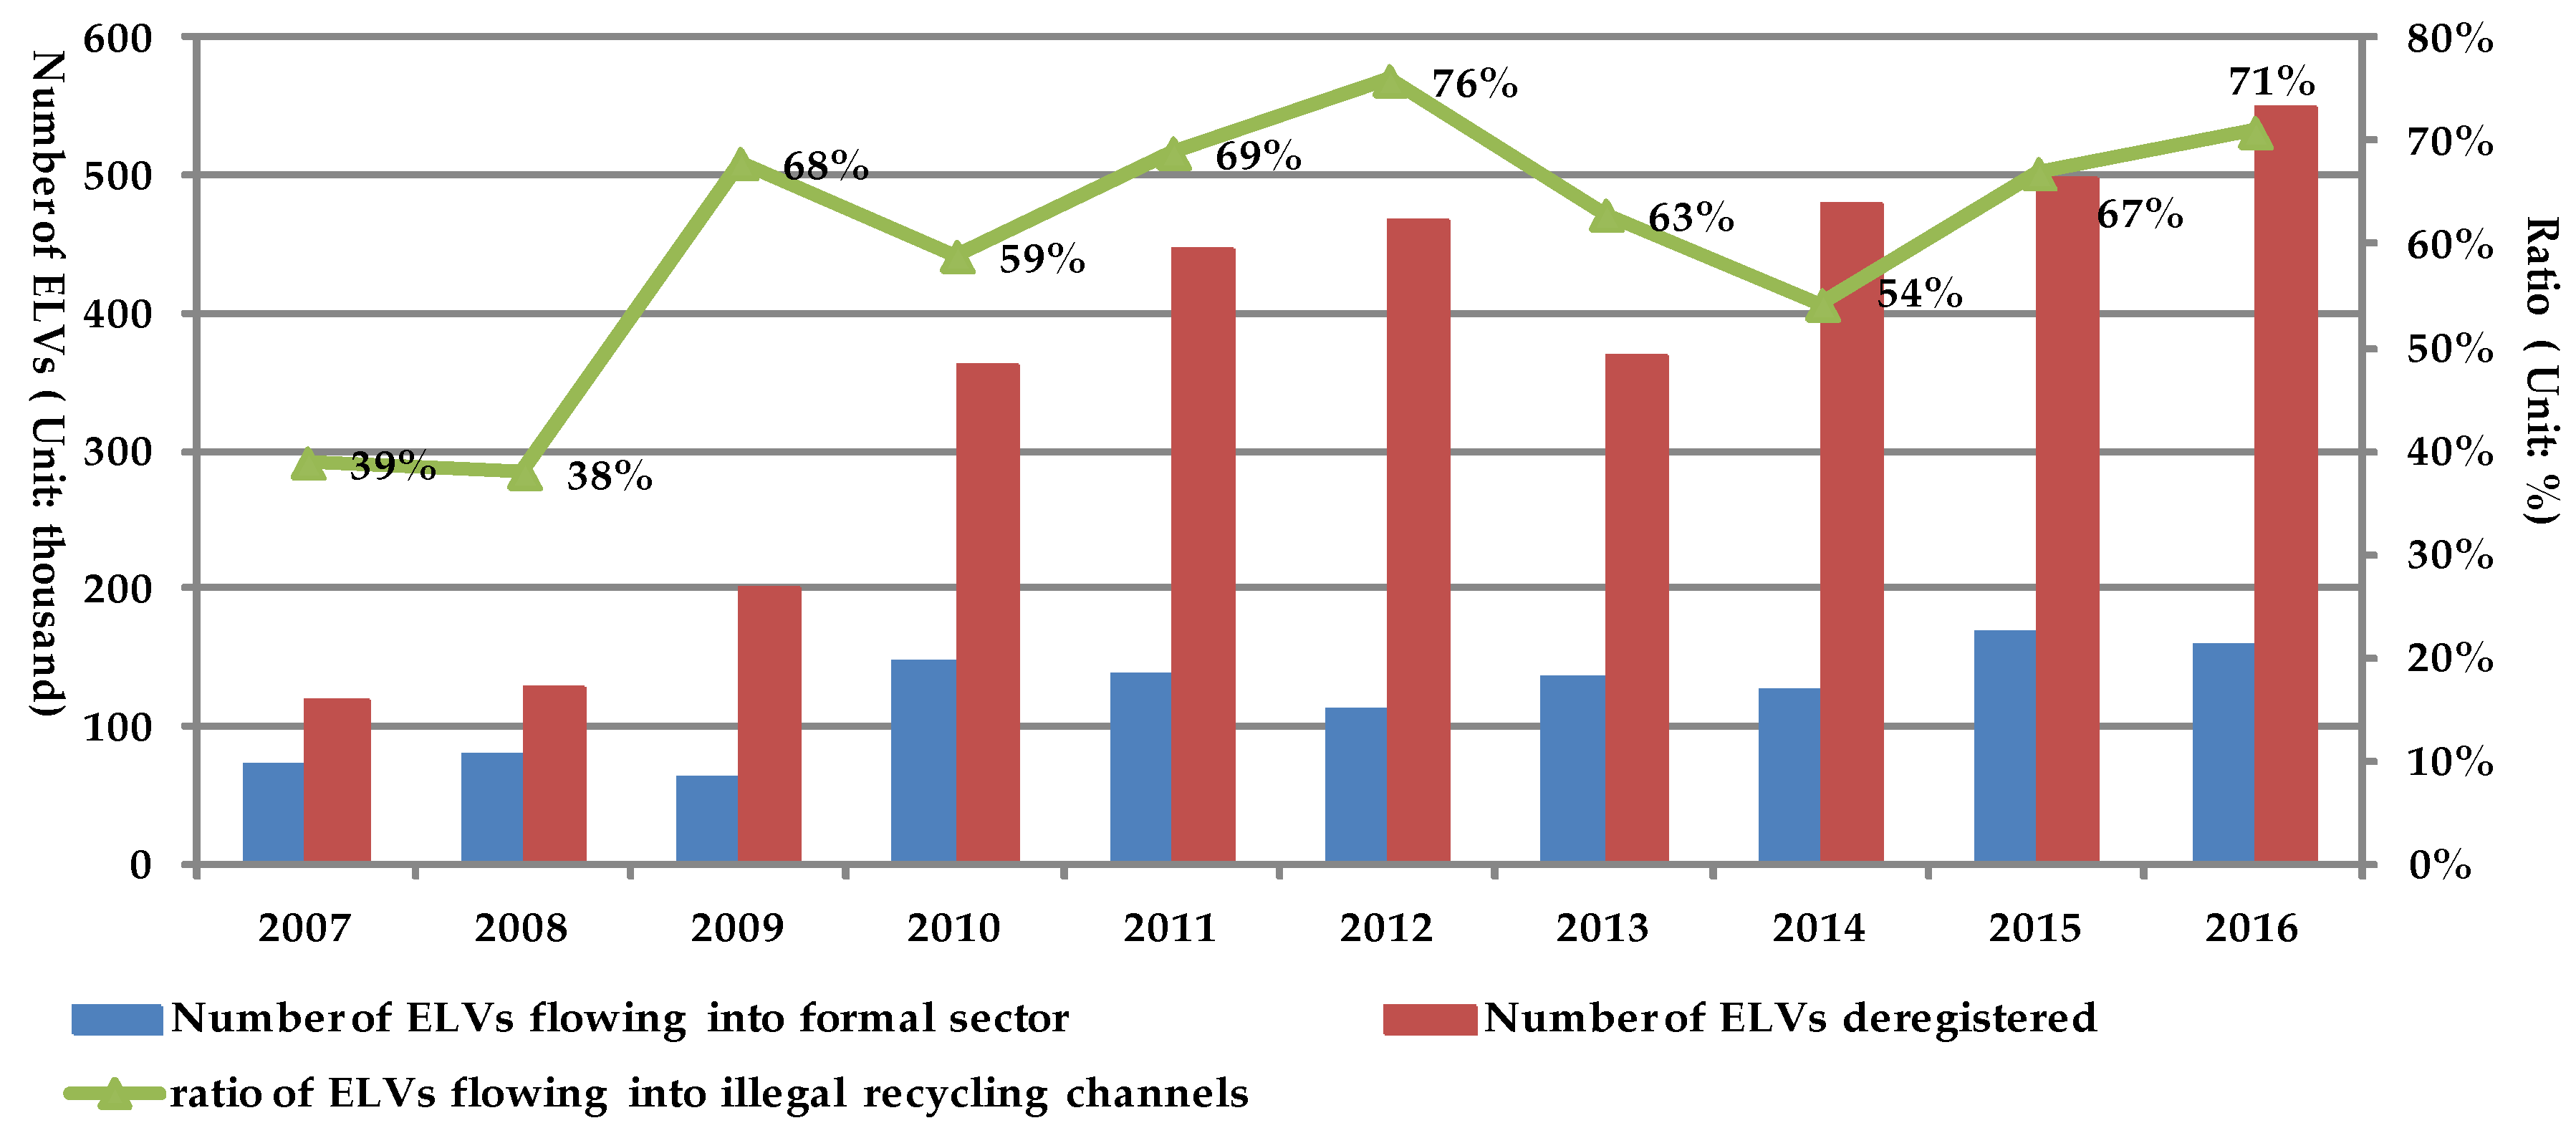
However, the current level of ELV recycling and reuse in China has been far from meeting the requirements of the circular economy development. At present, the deregistered rate of ELVs is only about 4% of the car ownership in China, which is significantly lower than the level of 6–8% in developed countries [1]. Worse, the recycling rate of ELVs (defined as the number of ELVs flowing into the formal sector in a year divided by the vehicle population in the same year) is only 0.5–1% of the volume of automobiles in use, considerably lower than the level of 5–7% in developed countries [7]. The greatest obstacle of ELV dismantling and recycling industry in China is that the ELV taking-back amount is too small to support the industry development [4,8]. Until 2014, there are only about 600 qualified recycling enterprises throughout the country, and 2400 collecting points that are subordinate to these enterprises [9]. The number of enterprises able to collect more than 10,000 ELVs every year is only 40. Over 50% of the vehicles scraped in theory are passing into the informal sectors (Figure 1) [8]. A large number of ELVs are delivered to black market or sold to unlicensed recyclers.
At present, 40% of ELVs are recycled by the formal sectors in China, 30% dismantled illegally for selling their parts and 30% delivered to remote areas to continue to travel as second-hand vehicles [11]. Dismantling ELVs illicitly means that a large number of recyclable and remanufacture components cannot be disassembled due to poor dismantling equipment. At the same time, waste liquid and waste residue are discharged at will, and some hazardous wastes, such as mercury and lead, are treated extensively [4]. Scrapped vehicles entering the black market are sold to third- and fourth-tier cities and rural areas to continue driving on the road, which brings about many social problems such as the waste of resources, traffic accidents, energy consumption and environmental pollution. In short, the illegal recycling of scrapped cars will bring serious economic, environmental and social problems. Therefore, with the arrival of the peak of the automobile scrapping in China, it is urgent and important to improve the recycling rate of ELVs.
To increase the recycling rate of ELVs, it is of great importance to find the key factors that influence the recycling rate so targeted countermeasures can be proposed. Nowadays, existing research about the influence factors of ELV recycling rate is mainly by means of empirical study, mathematical modeling and system dynamics method [1,12,13,14,15,16,17], and proposes that recycling rate is influenced by multiple factors. However, the interaction effect among different factors is hardly considered. Thus, the key factors influencing recycling rate are not easily identified. Meanwhile, existing empirical studies must rely on a mass of data that are hard to handle.
ELVs recycling is a system project, influenced by economy, policy, recycling network and other factors together [18,19,20]. These factors interact with each other. Thus, combined with the shortage of existing research methods, Decision Making Trial and Evaluation Laboratory (DEMATEL) is applied to reveal the comprehensive effect degree of various factors and identify the key factors of affecting ELVs recycling. However, it is difficult to describe the logical relationships among the factors. Due to the uncertainty of the external world, experts’ subjective preferences, and information incompleteness, experts may have fuzzy judgments on the logical relationships among various factors, thus it is hard to describe the influential degree among factors using accurate numerical values. To break the above restrictions, there exists literature that combines fuzzy sets with DEMATEL to solve experts’ fuzzy judgments [21,22]. However, traditional fuzzy sets cannot express the opinion of “neither this nor that”, namely neutral degree. In 1986, Atanassow solved this problem and expanded traditional fuzzy sets by considering the degree of hesitancy and put forward intuitionistic fuzzy sets [23]. Thus, this paper combines intuitionistic fuzzy sets with DEMATEL to identify the influencing factors of ELV recycling rate in China.
Specifically, the following research works will be done: (1) Propose a comprehensive list of influence factors through a systematic literature review and an investigation of ELV dismantling and recycling industry. (2) Considering the dependent relationships among the factors, the comprehensive influence matrix is obtained with the intuitionistic fuzzy-DEMATEL approach. The key factors influencing ELV recycling rate are found and the robustness of the results is verified by a sensitivity analysis. (3) Some related countermeasures and suggestions are put forward to improve the recycling rate of ELVs in China. The novelties of this paper are as follows: (1) using a hybrid model based on DEMATEL and intuitionistic fuzzy sets to identify the critical factors, which is different from the existing research methods; and (2) the vagueness of decision makers’ judgment and linguistic inaccuracy is dealt with effectively by intuitionistic fuzzy sets. Thirdly, a sensitivity analysis is made by applying the statistical test.
The paper is organized as follows: Section 1 introduces the background, motivation and conducts a literature review. Section 2 is about identification of the influence factors to establish the index system of influence factors and the intuitionistic fuzzy-DEMATEL approach is briefly described in this section. The application of the method and results are in Section 3. The analysis and discussion of the research results to recognize the key factors, sensitivity analysis to prove the robustness of the results and the managerial implications are presented in Section 4. Finally, conclusions and the future research directions are proposed in the Section 5.
2. Materials and Methods
2.1. Influence Factors of End-Of-Life Vehicle Recycling Rate in China
2.1.1. Economy Dimension Factors
Economic means is an important lever to regulate the behaviors of market players. Lack of economic stimulus for scrappers is the major factor of low recycling rate in China [8]. Currently, a large number of ELVs are flowing into illegal recycling channels, mostly due to the growing interests gap for scrappers between handling the cars legally and illegally. Scrap tracks and buses now are recycled at the price of about $255 per ton, while cars are usually priced from $120 to $180 per vehicle [8]. At this stage, China’s per capital income level is considerably lower than that of developed countries, so the recycling benefits become an important influencing factor for vehicle owners’ decision-making behavior [8,24]. Meanwhile, most of formal recycling companies, being in a position of marginal profit or loss, have an urgent need for government to give corresponding financial subsidies to improve the current levels of ELV recycling and utilization. For example, in 2009, Chinese Government regulated that the car owners who sent their cars to the designated recycling company to replace a new car can obtain subsidies, ranging from $450 to $900. Introduction of the policy made the ratio of ELVs flowing into the informal sectors significantly decline in 2010 (see Figure 1). Overall, compared to the recycling price in the informal ELV market, ELV recycling updating subsidies were less attractive. Correspondingly, the punishments imposed to illegal recycling enterprises and scrappers also have a direct impact on ELV recycling [25]. Currently, lower illegality cost makes illegal recycling enterprises and scrappers ignore the state policies, laws and regulations and take chances to collect and dispose the ELVs illegally. In addition, the income levels of vehicle owners also affect recycling rate [8,26]. Studies suggest that the owners with better economic conditions are less sensitive to the recycling price. Even if the legal recycling companies provide lower price, they are also willing to deliver their ELVs voluntarily. In conclusion, based on the analysis of the literature and current practices of ELV recycling industry, from the perspective of economy, the recycling rate of ELVs in China is affected by the following factors:
- S1
- recycling cost
- S2
- fiscal subsidy
- S3
- punishments on illegal recycling enterprises and scrappers
- S4
- vehicle owner’s income level
2.1.2. Policy Dimension Factors
Since 2001, China has gradually issued a series of ELV recycling policies and regulations, but the effect of policies implementation is deflected from the expected objective. The policies and regulations have little effect on improving the ELV recycling rate [27].In recent years, with the transformation and upgrading of ELV recycling industry in China, and due to the lack and hysteresis of the existing policies and regulations, the negative effect on the industry development becomes more and more obvious. Firstly, the formal channel has complicated processes, is required to submit various proof materials, requires multisectoral approval and must wait a long time to receive subsidies. In today’s fast-paced world, the inconvenience caused by cumbersome recovery procedures has seriously affected the enthusiasm of scrappers [15,16]. Moreover, the lack of effective supervision from the government on the owners, vehicle repairers, 4S shops, used car dealers and dismantlers is leading a large number of ELVs entering illegal channels. Thus, supervision of government is an important factor for ELV recycling. For example, in China, taxis and buses are under greater government supervision, whose scrap rate and recycling rate are significantly higher than ordinary cars [28].In addition, research generally agrees that the current policy that the five functional assemblies (a general term for the engine, front and back bridges, accelerator pedal, direction gear and chassis) can only be sold as scrap metals that cannot be remanufactured is seriously affecting the profit margins and production enthusiasm of ELV recycling enterprises, thereby also affecting the recycling rate [4,15,16]. In addition, in the field of recycling waste materials in China, recycling enterprises cannot get input tax invoice, thereby paying the value added tax in full amount, increasing the burden on enterprises, restricting the improvement of recycling rate [17,28]. In summary, from the perspective of policy, the recycling rate of ELVs in China is affected by the following factors:
- S5
- scrap procedures
- S6
- supervision of the government
- S7
- government’s restrictive policies on re-use of ELVs parts
- S8
- tax policy
2.1.3. Recycling Network Dimension Factors
At present, inadequate quantity and poor location of ELV collecting points in China has caused great inconvenience for car owners when delivering their ELVs, which not only impedes the enthusiasm of the car owners but also increases the operating cost of the ELV recycling companies [16,27]. Convenient and efficient reverse logistics network lays the basis of effective ELV recycling [29,30,31]. Previous study has concluded that the scientific design of the reverse logistics network has an important influence on the ELV recycling rate [6,32,33,34]. As an important supporter of ELV recycling, ELV reverse logistics network is closely related to the ELV recycling mode [6,11]. The participators of the ELV reverse logistics activities, the nodes in the network and the recycling efficiency are of difference in different recycling modes. Thus, the ELV recycling mode is widely considered as an important factor affecting the recycling rate [4,8,35]. Third parties dominate while vehicle manufacturers do not currently participate in China .This is another factor contributing to low recycling rate [4,36]. The lack of the linkage and collaboration of car manufacturers and ELV recycling companies fails to develop a closed-loop supply chain network, resulting in a large number of ELVs flowing into the black market. Under Extended Producer Responsibility (EPR), it is the manufacturers that are responsible for ELV recycling. According to the experience from developed countries, the car manufacturers’ involvement in ELV recycling will contribute to the improvement in the recycling technology, dismantling equipment and quality of employees, and eventually increase the rate of ELVs recycling [37]. In summary, from the view of the recycling network, the influence factors of the ELV recycling rate are as follow:
- S9
- reverse logistics system
- S10
- recycling mode
- S11
- participation of automobile manufacturer
2.1.4. Other Influence Factors
In addition to the above factors, the ELV recycling rate in China is also affected by technology, marketing and environmental awareness. ELV recycling involves many participants, including car owners, recycling enterprises, bureau of commerce (it regulates ELV collecting and recycling in China), public security departments, and insurance companies [7,8]. Current ELV recovery management in China lacks effective information communication and sharing mechanism among the participatory bodies, so the motor vehicles management department could not clarify the vehicles with major accidents through the annual inspection, leading to an inaccurate safety evaluation of the vehicle, and it is difficult to judge which one should be scraped. Thus, the information management system is assumed as an important influencing factor of the ELV recycling rate [8,38]. Besides, the ELV recycling rate is also impeded by backward ELV collecting and dismantling technology, low renewable resources utilization rate, and poor economic performance of the industry [7]. With the restriction of the dismantling technology, 90% of an ELV is sold as scrap iron and steel at less than $150 per ton [39], while only 5–10% is sold as reusable spare parts, which is far below the level of other developed countries (70%). Furthermore, some of the car owners lack knowledge about ELV policies and regulations, and do not know when, where and to whom to scrap the cars. All of the above will block owners’ hands in ELV recycling. Some studies assume that it is urgent to strengthen the publicity and promotion for improving ELV recycling rate [1,8]. In addition, ELV recycling can hardly be done without the cooperation of industry associations, which play a more and more important role in promoting the recycling rate of ELVs [16]. Moreover, ELV recycling rate is also affected by the car owner’s own environmental awareness and legal awareness [8,28,40]. Individual environmental and legal awareness are directly related to their cognition of the importance of ELV recycling, which will affect their behaviors and decisions. Based on the above analysis, the influence factors are as follow.
- S12
- information management system
- S13
- dismantling and recycling technologies
- S14
- marketing and propaganda and popularization
- S15
- coordination of the industry agencies
- S16
- environmental and legal awareness of the car owners
In summary, the factors affecting the ELV recycling rate in China are shown in Table 1.
2.2. Methods
2.2.1. The Basic DEMATEL Method
DEMATEL was proposed by American Bas title National Laboratory in 1971 [41,42]. It is a system factor analysis method using graph theory and matrix [42]. Through analyzing the logical relationships among various factors in the system, a direct-relation matrix can be constructed and the influential degree, influenced degree, cause degree and center degree of each factor can be calculated further to reveal the system structural relation [41,43]. The advantage of this method is that it can clearly identify the correlativity among factors and judge the importance degree of each factor to the result. Meanwhile, this method needs fewer data and is easier to operate. Nowadays, DEMATEL is widely used in supplier selection [44,45], remanufacturing management [2,46,47], human resource management [48,49], facility location selection [50,51,52], risk management [53,54], consumers’ behavior analysis [55], financial performance diagnosis of insurance companies [56] and E-learning effectiveness evaluation [57]. The basic steps of this method are as follows:
- (1)
- Determine influence factors: Through literature review, survey and interview, the influence factors for the system can be determined, denoted as S1, S2, …, Sn.
- (2)
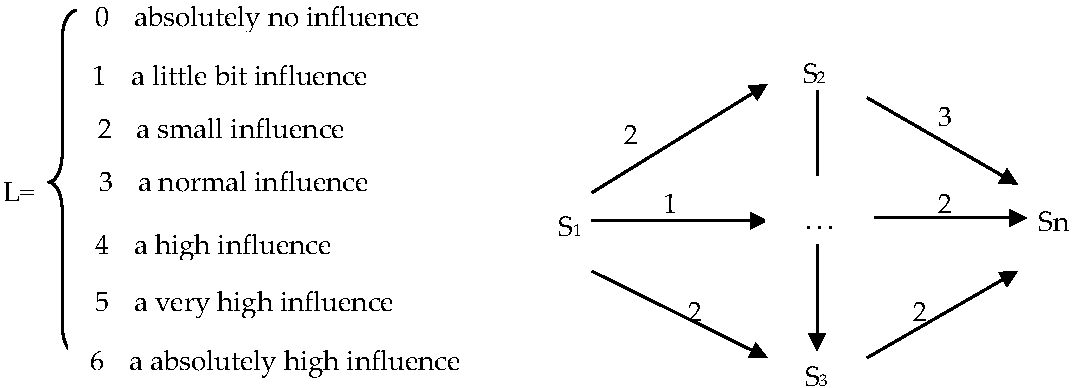
- Establish relationships among influence factors: Analyze the existence of direct influence relationship and its degree of strength or weakness among factors. If Si has direct influence on Sj, then draw an arrow from Si to Sj, and use numbers to express the affecting degree (see Figure 2).
- (3)
- Initialize Direct-relation matrix: Use matrix to express the direct influence relationship among factors. If there are influence factors, then . If Si has direct influence on Sj, define as the number that is used to express degree of the strength or weakness of the relationship, or .
- (4)
- Judge the influence degree that factor Si has on Sj by experts: Suppose there are K experts, is denoted as the degree that factor Si has on Sj from the kth expert’s judgment. Because these experts come from different fields, each expert’s judgment has different importance weight on the final result. Define the as the weight of kth expert, as the mean value from K experts’ scores and . The value of can be calculated by Equation (1). In this paper, the triangular fuzzy numbers are used to substitute the linguistic variables for experts’ weights. Then, the corresponding crisp weight is obtained according to the triangular fuzzy number.
- (5)
- Normalize direct-relation matrix using Equation (2), marking it as G ():
- (6)
- Calculate comprehensive influence matrix () with Equation (3), where is an identity matrix. expresses all the influential relationships among factors including both direct and indirect. is an element of matrix , and is in ith row and jth column.
- (7)
- denotes the sum of rows and denotes sum of columns, which are separately computed with Equations (4) and (5). A cause and effect graph can be obtained by mapping the dataset of (, ).
In Equation (4), indicates the total influence including both direct and indirect influence that factor Si has given other factor Sj. Similarly, shows the total influence that factor Sj has received from other factor Si. If the value of () is positive, factor Si affects factor Sj more easily. Thus, the factor Si is a causal factor. On the contrary, a negative value of () shows factor Si is more easily affected by factor Sj. Thus, factor Si is an effect factor. () is named “prominence” which reveals the importance of the influence of every factor.
2.2.2. Intuitionistic Fuzzy Set Theory
As an extension of traditional fuzzy set, intuitionistic fuzzy set (IFS) can describe the fuzzy nature of the external world better, and is widely used in fuzzy multi-attribute decision and group decision. Intuitionistic triangular fuzzy number and trapezoidal intuitionistic fuzzy number (TrIFNs) are the expansion of intuitionistic fuzzy set (intuitionistic triangular fuzzy number is the specialness of trapezoidal intuitionistic fuzzy number), which makes universe of discourse from discrete set to continuous set [58,59]. Intuitionistic fuzzy set has two advantages compared to the traditional fuzzy set proposed by Zadeh. The first advantage lies in semantic expression [60,61]. The membership, non-membership and hesitancy of intuitionistic fuzzy set can express support, opposition and neutrality, while the single membership of traditional fuzzy set can only express support or opposition. The second advantage is that the computational accuracy of intuitionistic fuzzy set clearly improves. The conformity of inference rule is also better than traditional fuzzy set.
Definitions of intuitionistic fuzzy set are described below [20].
Definition 1.
Suppose X is a given domain of discourse, then IFS A in X can be described as:
In Equation (6), and , respectively, represents the membership function and non-membership function of A. Furthermore, , .
represents the hesitancy of to A, .
Definition 2.
Suppose A is a intuitionistic fuzzy number on the set of real numbers and its membership function and non-membership function can be described as follow [62].
In Equations (7) and (8), , , , A is the intuitionistic trapezoidal fuzzy number and . If and , Equations (8) and (9) can be obtained based on [63]. Comparing with trapezoidal fuzzy number, a non-membership function is added into the intuitionistic trapezoidal fuzzy number and . Non-membership function represents the probability that the decision makers think the decision information does not belong to or .
Theorem 1.
Suppose is a TrIFN. When , , the expected crisp value of , is obtained with Equation (11) [63] by converting the TrIFNs into the crisp values. Then, the DEMATEL method can be used to identify the critical factors.
3. Results
This paper takes the recycling of ELVs in Chengdu city as an example to explore the influence factors of ELV recycling rate in China using intuitionistic fuzzy-DEMATEL approach. Chengdu, located in the southwest of China, is the one of the largest city in China. Car ownership in Chengdu is ranked second in China, reaching 4,120,000 by the end of 2016 [64]. Thus, the choice of Chengdu has a certain representativeness. There are four proposed steps as follows.
Step1: Develop the direct-relation matrix
First, questionnaires were designed based on the influence factors shown in Table 1. Then, four experts were invited to complete the questionnaires, including industry expert, government expert and scholars from the university. The industry expert is from Chengdu Xingyuan Renewable Resources Investment Co., Ltd. which is the only company in Chengdu with the qualified ELVs recycling license. The scrap auto recycling volume of this enterprise was ranked first in China in 2012. The government expert is from the Chengdu Municipal Commission of Commerce, which regulates the ELVs collecting and recycling in Chengdu. The two university academics’ professional backgrounds relate to renewable resources management and reverse logistics, respectively. The two experts have abundant experience and knowledge in ELVs recovery and recycling. The direct-relation matrixes were built through four experts judging the effect degree between any two factors in Table 1 and scoring from 0 to 6 according to Figure 2. The matrixes are presented in Table A2, Table A3, Table A4 and Table A5 (see Appendix B).
Step2: Interpret the linguistic information into intuitionistic fuzzy number
The influence scores of linguistic information in Table A2, Table A3, Table A4 and Table A5 are transformed into TrIFNs according to Table A6. Subsequently, the TrIFNs are converted into the expected crisp values using Equation (11). Meanwhile, due to the different knowledge structure and working experiences of experts, the degree of knowledge for ELV recycling rate is also different. Thus, it is considered that every expert’s opinion has a specific weight. The determination of the weight is ambiguous. Table A7 presents linguistic variable for the importance weight of expert. The weight of every expert is shown as semantic variables in Table A8. Considering the expert’s weight, Equation (1) is used to get total averaged crisp matrix A (see Table A9). The normalized direct-relation matrix G is presented in Table A10 using Equation (2). Table A7, Table A8, Table A9 and Table A10 are shown in Appendix B.
Step3: Set up the total relation matrix
According to the normalized direct-relation matrix G in Table A10, the total relation matrix is acquired using Equations (2) and (3), and is shown in Table A11 (see Appendix B).
Step4: Obtain the comprehensive influence relation table and overall DEMATEL prominence-causal relationship diagram
The influential impact D, influenced impact R, degree of prominence (D + R) and degree of cause (D − R) can be calculated using Equations (4) and (5). The results are presented in the comprehensive influence relation table (see Table A12 in Appendix B).
4. Discussion and Implications
4.1. Discussion
4.1.1. Discussion from the Perspective of Single Factor
According to the value of degree of cause factor (D − R), the factors affecting the recycling rate of ELVs in China are divided into two categories: cause factors and effect factors. Compared with effect factors, cause factors are more initiative and stable, not easily changed, and are the most fundamental factors affecting the whole system. Therefore, the cause factors should be paid attention first during the analysis of the factors. It can be seen in Table A12 that the values of degree of cause factors rank as follows: S7 > S4 > S13 > S8 > S11 > S3 > S2 > S12.Becausethe influence degree D of these factors is greater than their influenced impact R, they have a direct impact on other factors. Their performances can affect the system’s goal. Thus, the factors in cause group should be emphasized and, based on these factors, some long-term measures to improve the recycling rate of ELVs must be made. On the contrary, effect factors ((D − R) is negative) are more easily affected by other factors. The size of the absolute value of degree of cause factors to the effect factors can be sorted as follows: S1 > S14 > S16 > S6 > S9 > S5 > S15 > S10.These factors can be changed more easily than other factors. At the current stage, some short-term measures can be taken to raise the ELV recycling rate based on the effect factors, such as adjusting the collection price; strengthening marketing, propaganda and popularization; and simplifying the scrap procedures. In terms of degree of the prominence (D + R), the (D + R) score of S2 is highest, following by S6, S15, S14, S10, S16, and S1 in (D + R) ranking.
Both (D − R) and (D + R) ranking should be considered together to identify critical factors according to Table A12. Among all factors, fiscal subsidy (S2) has the highest (D + R) scores with 3.953 and the value of the degree of influential impact D is 2.095 which is also ranked first. Besides, the (D − R) score of S2 is positive, so S2 is a cause factor. Therefore, fiscal subsidy (S2) should be considered as a key factor. The factor whose value of degree of cause ranks first is government’s restrictive policies on the reuse of ELVs parts (S7). S7 has great influence on other criteria and so it should be recognized as a key factor. For coordination of the industry agencies (S15), although the (D − R) score is slightly less than 0, its (D + R) and D are ranked in the top three among all factors. In addition, the R score is fifth highest. Therefore, coordination of the industry agencies (S15) with an important influence in the system is another key factor. Furthermore, the (D − R) score of participation of automobile manufacturer (S11) is positive and obtains a higher ranking (5th). Its D ranks second and R ranks only 11th, which means that S11 has a considerable impact on the other factors while the influence it receives is small. Thus, S11 is also considered a key factor. Similarly, the (D − R) of supervision of the government (S6) is negative, but (D + R) score of S6 is second highest, which shows that S6 has a great influence on the whole system. Meanwhile the values of D and R are ranked fifth and second, respectively. Hence, S6 is regarded as a key factor. Nevertheless, in (D − R) ranking, the vehicle owner’s income level (S4) is the second highest, but the scores of D, R and (D + R) are ranked last. Thus, it is not a key factor. Analogously, the D scores of tax policy (S8) and punishments on illegal recycling enterprises and scrappers (S3) have high rankings, but their D, R and (D + R) get low rankings. Therefore, S3 and S8 are not key factors. In summary, the key factors influencing the ELV recycling rate in China are as follows: S2, S7, S15, S11, and S6. The study results from Hu and Wen [8] support the above conclusion. They also believe that the present law enforcement for the illegal recycling ELVs in China is not enough and the restriction on the reuse of components is unreasonable such as the policy that “five functional assemblies” must be treated as scrap, resulting in a large number of scrapped cars flowing into illegal channels. The findings of Wang and Chen [4] also show that the key to improve the ELV recycling rate in China lies in increasing financial subsidies, close cooperation with the relevant agencies in the ELV recycling industry and the active participation of automobile manufacturers.
4.1.2. Discussion from the Perspective of Different Dimensions
The sum of affecting degree D, central degree (D + R), and causal degree (D − R) of factors can also be calculated from the standpoints of economy, policy, recycling network and other dimensions. The result can be seen in Table 2.
It can be seen in Table 2 that causal degree (D − R) of factors from policy dimension is the largest and affecting degree D ranks second. It shows that government plays a vital role in promoting the recycling rate of ELVs in China, which is consistent with the status quo in China. Both resource integration and transformation, and upgrading of ELV recycling need policy guidance and standardization, which makes enterprises and vehicle users adjust economic behaviors according to the government policy guidance. Besides, compared to the values of center degree (D + R), the “others” dimension is the largest. It shows that factors, such as coordination of the industry agencies (S15), marketing and propaganda and popularization (S14) and environmental and legal awareness of the car owners (S16), play an important function in influencing recycling rate of ELVs in China.
4.2. Sensitivity Analysis
To avoid potential biases of the experts affecting the results of the study, the sensitivity analysis is needed to verify the robustness of the results. In this paper, the sensitivity analysis is completed by using Chi-square test to prove the consistency of the research results under different expert weights. Firstly, we change the weight of government expert to “low” (0.1,0.3,0.5) and “medium” (0.3,0.5,0.7) and the weights of other experts are unchanged. Scenarios A, B and C, respectively, stand for the government expert with weights “high” (0.5,0.7,0.9),“low” (0.1,0.3,0.5) and “medium” (0.3,0.5,0.7). In the same way, we change the weight of industry expert to “high” (0.5,0.7,0.9) and “medium” (0.3,0.5,0.7) and the weights of other experts are unchanged (Scenario D and Scenario E, respectively). Besides, Scholar1’s weight is changed to “high” (0.5,0.7,0.9) and “low” (0.1,0.3,0.5) and the weights of other experts are unchanged (Scenario F and Scenario G, respectively). Lastly, we change the Scholar2’s weight to “high” (0.5,0.7,0.9) and “low” (0.1,0.3,0.5) and the weights of other experts are unchanged (Scenario H and Scenario I, respectively). For the nine experiments (scenarios), the (D + R) and (D − R) of every factor under different scenarios are shown in Table 3 and Table 4.
Firstly, we apply Chi-square test to testify whether there is difference in (D + R) scores of factors at different experts weights based on Table 3. The steps are as follows:
- (1)
- The hypotheses of the tested question are put forward. H0: there exists no difference in (D + R) scores of factors for different experts’ weights; and H1: there exists difference in (D + R) scores of factors for different experts’ weights.
- (2)
- The level of significance is defined at p < 0.01.
- (3)
- Calculate the value of .
- (4)
- Look up the table of and make adjustment.
When the number of degrees of freedom is 120 ((16 − 1) × (9 − 1) = 120), . Thus, H0 is accepted and H1 is refused.
Therefore, there is no difference in (D + R) scores of factors for different experts’ weights.
In the same way, we can use Chi-square test to prove whether there is difference in (D − R) scores of factors for different experts’ weights. In Table 4, if the values of (D − R) are negative, the absolute values of (D − R) of the factors will be used in the Chi-square test (see Table 5).
Testing steps are as follows.
- (1)
- H0: There exists no difference in (D − R) scores of all factors for different experts’ weights. H1: there exists difference in (D − R) scores of all factors for different experts’ weights.
- (2)
- The level of significance is defined at p < 0.01.
- (3)
- Calculate the value of .
- (4)
- Look up the table of . When the number of degrees of freedom is 120 ((16 − 1) × (9 − 1) = 120), . Thus, H0 is accepted and H1 is refused.
Therefore, there is also no difference in (D − R) scores of factors for different experts’ weights.
In summary, there is no difference in (D + R) scores or (D − R) scores of all factors when the weights of the experts are changed. Thus, the study results have strong robustness.
4.3. Managerial Implications
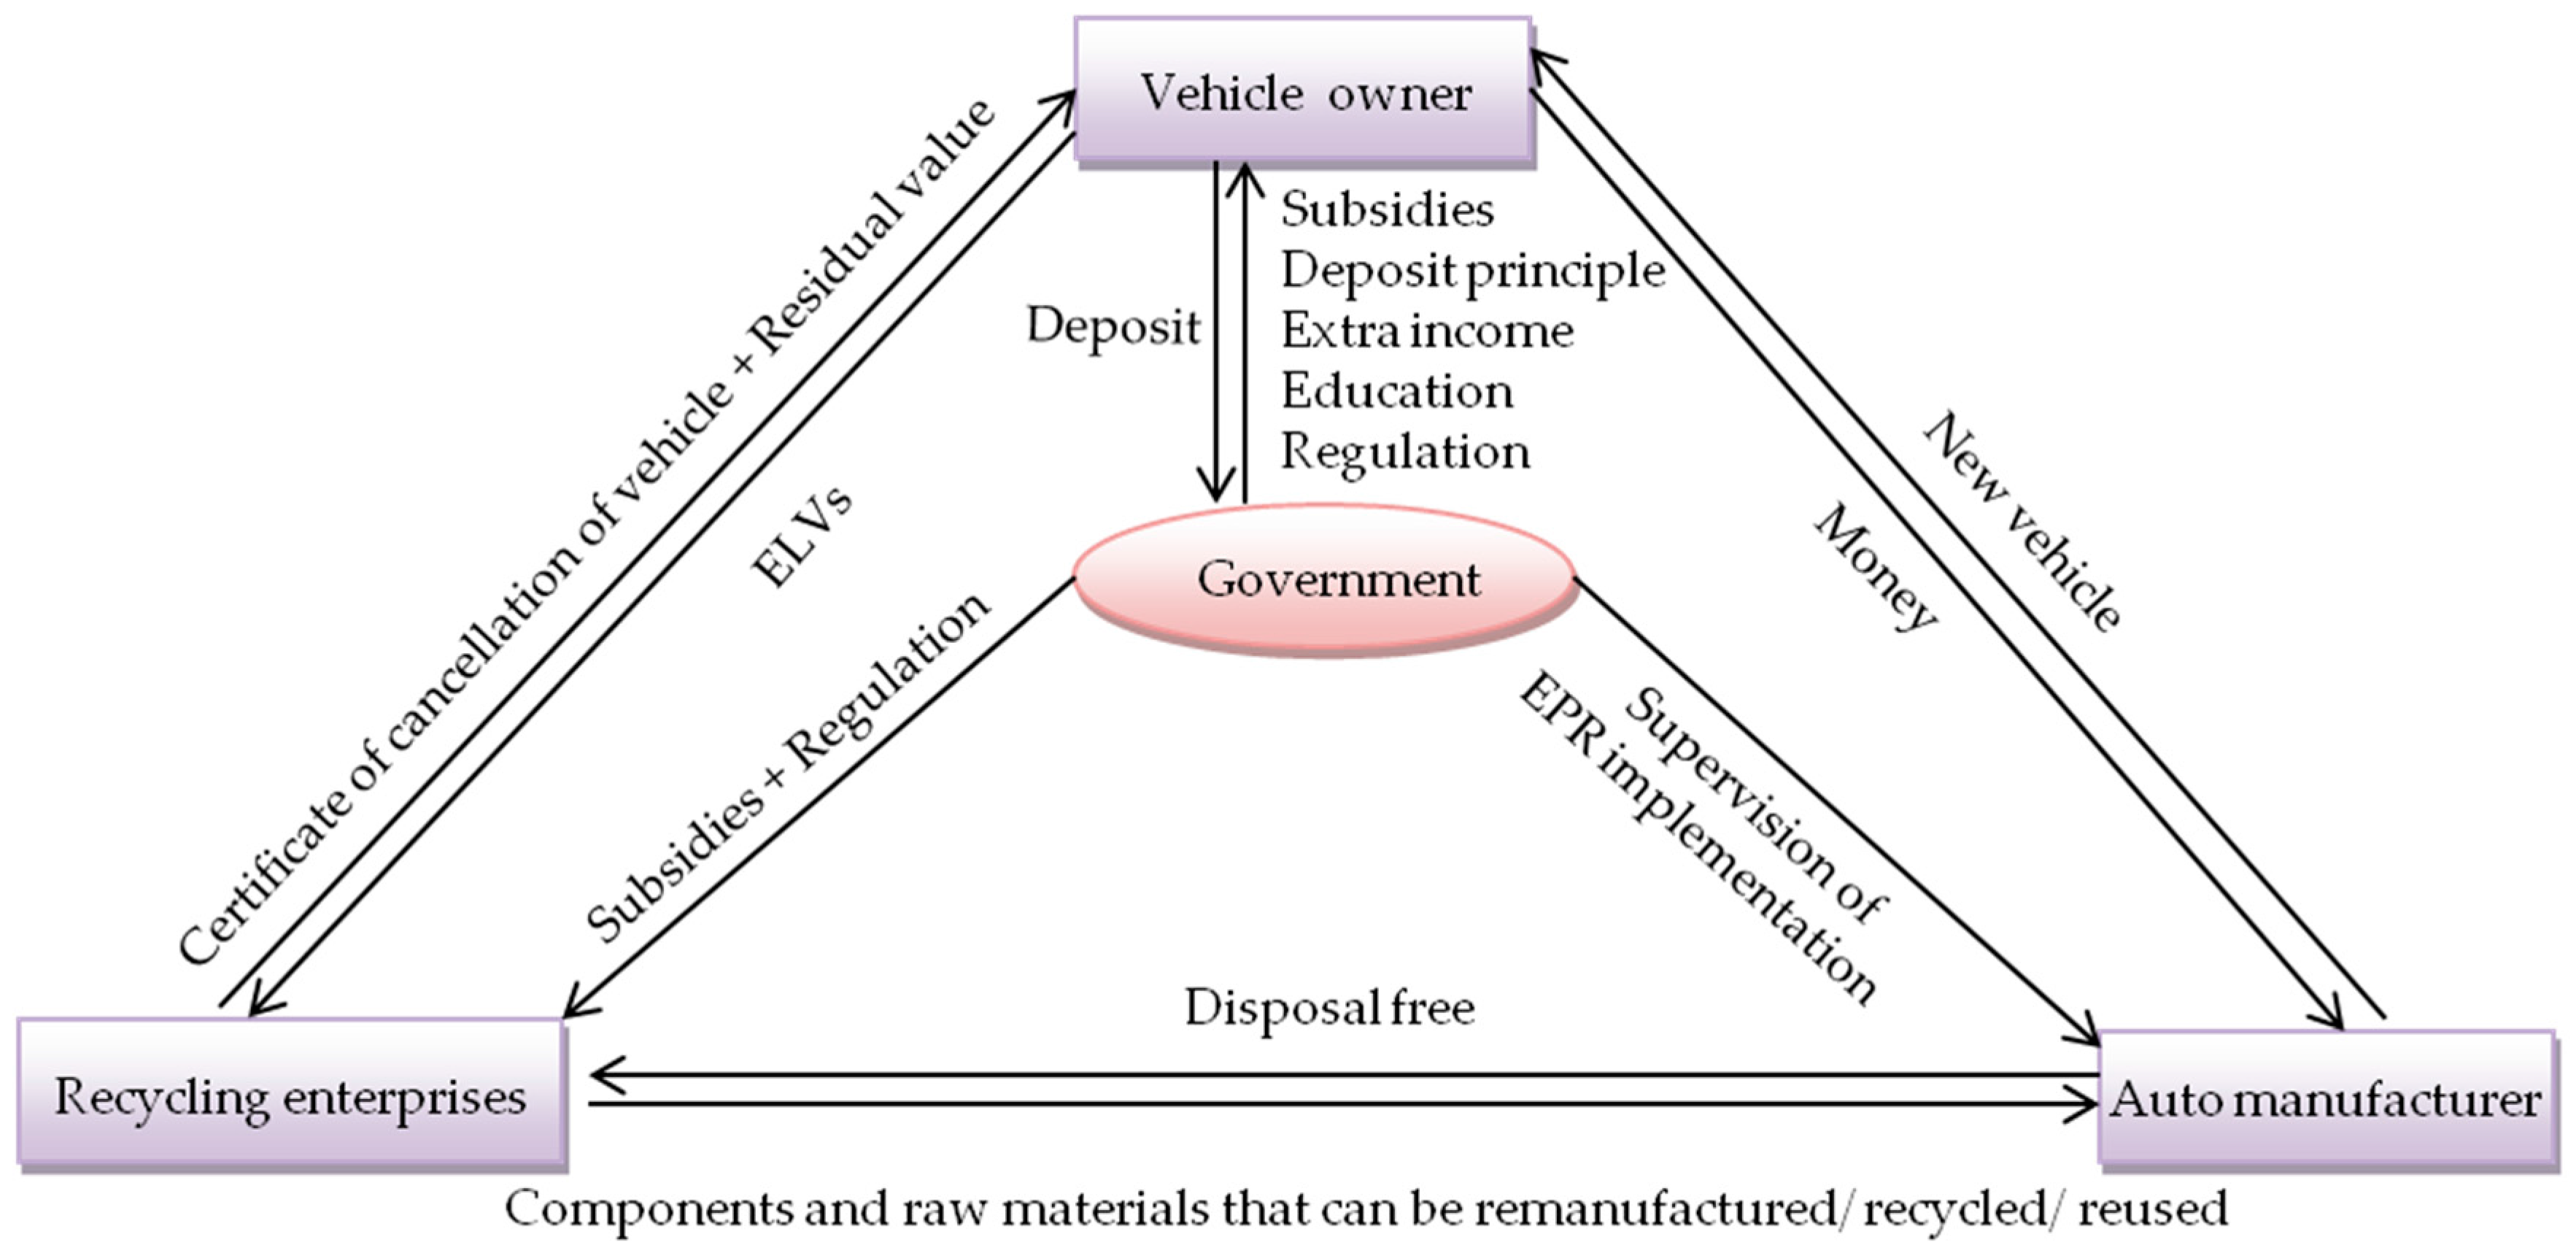
Above research comprehensively and quantitatively considers the interactions among various factors and presents the key affecting factors of ELV recycling rate in China. This paper proposes three types of countermeasures based on different factors: long-term measures based on cause factors, short-term measures based on effect factors and key measures based on prominence factors. It can provide theoretical guidance for managers to reasonably allocate management resources and adopt different management measures in different development stages to improve the recycling rate of ELVs. According to the results of above research, five factors, fiscal subsidy (S2), government’s restrictive policies on the re-use of ELVs parts (S7), coordination of the industry agencies (S15), participation of automobile manufacturer (S11), and government supervision (S6), according to government regulators and enterprises, should especially be worthy of more attention. Thus, a conceptual model (government–recycler–manufacturer–owner recycling model) was built, involving government, recycling enterprises, auto manufacturers and vehicle owners, to improve the end-of-life vehicle recycling rate in China (Figure 3).
In terms of government, firstly fiscal subsidy policies of ELV recycling should be enacted and perfected. A new subsidy mechanism should be explored based on old-to-new replacement to encourage vehicle owners to deliver the ELVs voluntarily. Meanwhile, government should give financial supports to ELV recycling and dismantling enterprises in the aspects of recycling system construction, information system perfection, scrap process optimization and market propaganda promotion to solve the problems of continuous financial losses and operational difficulties that are generally faced in the whole industry in China. Secondly, government should issue and revise relevant policies and mechanisms of the ELV recycling management. Combined with the practical situation of the ELV recycling industry and the improvement of remanufacturing technology in China, the restriction on the reuse of vehicle parts should be loosened. Permission for remanufacturing vehicle five functional assemblies should be made to raise economic benefits of ELV recycling industry. Besides, the specific collection, recycling and recovery targets for the overall recycling rate and various raw materials should be set within a period frame. Thirdly, government should intensify the supervision of ELVs recycling and strike illegal recycling and refitting of ELVs by enhancing punishment. At the same time, the supervision of car owners should be strengthened, and a record of the vehicle that is about to be scraped to trace and reduce illegal drain of ELVs should be established. Fourthly, the recycling deposit policy is recommended. The new vehicle buyer needs to pay some money to the government as the recycling deposit. The government uses the deposit to encourage the formal ELV treatment sectors. Eventually, when the vehicle is scrapped, the vehicle owner will obtain the principle of the deposit and additional benefits if the end-of-life vehicle is delivered to the licensed recyclers. Otherwise, if the vehicle owner submits the ELV to the black market, they will lose the deposit. Moreover, Extended Producer Responsibility (EPR) should be enforced and the government should supervise the manufacturers’ participation to strengthen the responsibilities of automobile manufacturers. If automobile manufacturers participate in ELV recycling, their capital and brands can be taken advantage of to improve the recycling rate. Lastly, government should strengthen guidance and encourage industry associations, insurance companies and automobile dealers to take part in the recycling of ELVs.
For recycling enterprises, firstly they should work with other organizations to explore recycling modes using the Internet, and optimize reverse logistics system. Secondly, recycling enterprises should also improve industry self-discipline and win over governments’ policy support and fiscal subsidy to increase economic efficiency. Thirdly, the recycling enterprises should carry out dismantling technology innovation to improve scrap car recycling rate and reduce the environmental pollution in the recycling and dismantling process. Lastly, the recycling enterprises should strengthen cooperation with auto manufacturers to form a closed supply chain, so the components and raw materials of the ELVs can be remanufactured/recycled/reused further.
For the vehicle owners, they need to continue to raise awareness of environmental protection, and take the initiative to report illegal recovery actions to the local government. For the auto manufacturer, they can perform the EPR indirectly by paying the disposal fee to the recyclers. Meanwhile, the environmentally friendly materials and components should be considered at the automotive design phase. Besides, manufacturers play a capital and technological advantage to drive innovation, such as remanufacturing technology innovation, and eventually build a sustainable supply chain ecosystem for the whole automobile industry.
5. Conclusions
Nowadays, the recycling rate of ELVs is quite low in China. Many ELVs flow into illegal channel, causing a serious waste of resources, environment pollution and public security problems. With the coming of ELVs’ peak season, increasing the recycling rate is urgently needed. Identifying the key factors to influence ELV recycling is the premise and basis for setting out measures to increase the recycling rate.
Combined with the practical recycling situation, this paper systematically proposes 16 factors that influence ELV recycling rate in China through expert interviews, field research and literature review. Intuitionistic fuzzy DEMATEL method is adopted to calculate the values of influential degree, influenced degree, and prominence degree to identify cause factors, effect factors and key factors. The results provide theoretical references for the government and enterprises to make decisions on ELV recycling. In this paper, the influence scores of linguistic information are transformed into TrIFNs and the TrIFNs are converted into the expected crisp values. Besides, Fuzzy numbers are used to express the weight of every expert. The fuzziness of experts’ scoring results and the importance weight are solved effectively. Through systematic study, cause factors are: government’s restrictive policies on the re-use of ELVs parts (S7), income level of car owner (S4), dismantling and recycling technologies (S13), tax policy (S8), participation of automobile manufacturer (S11), punishments on illegal recycling enterprises and scrappers (S3), fiscal subsidy (S2) and information management system (S12). Long-term countermeasures should be made according to the cause factors to increase recycling rate persistently. Effect factors are: recycling price (S1), marketing and propaganda and popularization (S14), environment and legal consciousness of car owner (S16), supervision of the government (S6), reverse logistics system (S9), scrap procedures (S5), cooperation between profession organizations (S15) and recycling mode (S10). Short-term countermeasures should be made according to these effect factors. Moreover, the key factors are fiscal subsidy (S2), restrictions on the reuse of parts (S7), coordination of the industry agencies (S15), participation of automobile manufacturer (S11) and supervision of the government (S6). To conclude, this paper proposes suggestions and countermeasures to increase the recycling rate of ELVs from perspective of government, recycling enterprises, auto manufacturers and vehicle owners. A sensitivity analysis has been carried out to verify the robustness of the results. Besides, the research results of this paper can also be used as reference for developing countries with low recycling rate of end-of-life vehicles such as Turkey and Mexico to improve the rate of end-of-life vehicle recycling. At present, these developing countries are facing similar problems to China in terms of the recycling of waste automobiles, such as the prevalence of illegal recycling, inadequate awareness of consumer environmental protection and imperfect laws and regulations [29,32].
Nonetheless, there are some limitations in the paper and future research may further expand these results. In this paper, only four experts are selected, from government, enterprise and universities. Future research may expand the range of experts to car owners, industry associations and automobile dealers to reduce the influence that expert preference may have on the results. Meanwhile, some certain areas with lower recycling rate of ELVs in China can be selected, such as Chongqing, Zhengzhou, Suzhou, etc., whose recycling rate in 2014 are, respectively, 0.35%,0.36% and 0.37%. Data from these areas can be collected to prove the validity of the results. Otherwise, the redundancy of the information that is expressed by the 16 factors is not examined. Future research can simplify the information through rough set theory to ensure no existence of information redundancy in the index system and improve the accuracy of the research result.
Acknowledgments
This work was financially supported by the Planning Project of Philosophy and Social Science Research of Sichuan Province (SC16C021), the programs from Sichuan Key Research Base of Social Science-Sichuan Province Cycle Economy Research Center (XHJJ-1615),Sichuan Key Research Base of Social Science-System Science and Enterprise Development Research Center (Xq16C08), Sichuan Key Research Base of Social Science-Sichuan Center for Rural Development Research (CR1516) and Sichuan Research Center of Electronic Commerce and Modern Logistics (DSWL17–12).
Author Contributions
Junwei Gan conducted interviews and questionnaires, put forward the idea and wrote the manuscript. Li Luo offered some advice and guidance for the article. All co-authors revised the paper together and agreed with the final manuscript.
Conflicts of Interest
The authors declare no conflict of interest.
Appendix A. Example of DEMATEL Questionnaire
The questionnaire includes the following five aspects: (1) cover letter; (2) introduction; (3) description of the connotation of the factors; (4) the method of how to fill in the questionnaire; and (5) pair-wise comparisons of the factors.
Those surveyed are invited to evaluate the existence of direct influence relationship and its degree of strength or weakness among factors (see Table 2), scoring from 0 to 6 (0: absolutely no influence; 1: a little bit influence; 2: a small influence; 3: a normal influence; 4: a high influence; 5: a very high influence; 6: an absolutely high influence).The DEMATEL pair-wise comparison questionnaire is shown in Table A1.

Table A1.
The DEMATEL pair-wise comparison questionnaire.
| No. 1 | S1 | S2 | S3 | S4 | S5 | S6 | S7 | S8 | S9 | S10 | S11 | S12 | S13 | S14 | S15 | S16 |
|---|---|---|---|---|---|---|---|---|---|---|---|---|---|---|---|---|
| S1 | 0 | |||||||||||||||
| S2 | 0 | |||||||||||||||
| S3 | 0 | |||||||||||||||
| S4 | 0 | |||||||||||||||
| S5 | 0 | |||||||||||||||
| S6 | 0 | |||||||||||||||
| S7 | 0 | |||||||||||||||
| S8 | 0 | |||||||||||||||
| S9 | 0 | |||||||||||||||
| S10 | 0 | |||||||||||||||
| S11 | 0 | |||||||||||||||
| S12 | 0 | |||||||||||||||
| S13 | 0 | |||||||||||||||
| S14 | 0 | |||||||||||||||
| S15 | 0 | |||||||||||||||
| S16 | 0 |
1 S1: recycling cost; S2: fiscal subsidy; S3: punishments on illegal recycling enterprises and scrappers; S4: vehicle owner’s income level; S5: scrap procedures; S6: supervision of the government; S7: government’s restrictive policies on re-use of ELVs parts; S8: tax policy; S9: reverse logistics system; S10: recycling mode; S11: participation of automobile manufacturer; S12: information management system; S13: dismantling and recycling technologies; S14: marketing and propaganda and popularization; S15: coordination of the industry agencies; S16: environmental and legal awareness of the car owners.
Appendix B
Table A2.
Direct-relation matrix by industry expert.
| No. | S1 | S2 | S3 | S4 | S5 | S6 | S7 | S8 | S9 | S10 | S11 | S12 | S13 | S14 | S15 | S16 |
|---|---|---|---|---|---|---|---|---|---|---|---|---|---|---|---|---|
| S1 | 0 | 2 | 1 | 0 | 0 | 2 | 0 | 1 | 0 | 0 | 0 | 0 | 0 | 0 | 0 | 4 |
| S2 | 6 | 0 | 2 | 0 | 2 | 3 | 3 | 3 | 4 | 3 | 3 | 4 | 5 | 4 | 4 | 3 |
| S3 | 2 | 1 | 0 | 0 | 0 | 4 | 0 | 0 | 0 | 0 | 0 | 1 | 2 | 2 | 1 | 5 |
| S4 | 3 | 2 | 0 | 0 | 0 | 1 | 0 | 0 | 1 | 1 | 0 | 0 | 0 | 1 | 0 | 3 |
| S5 | 2 | 2 | 3 | 0 | 0 | 2 | 0 | 0 | 3 | 3 | 1 | 4 | 0 | 3 | 2 | 2 |
| S6 | 1 | 2 | 4 | 0 | 3 | 0 | 4 | 2 | 0 | 1 | 1 | 5 | 0 | 3 | 1 | 5 |
| S7 | 5 | 4 | 3 | 0 | 1 | 3 | 0 | 0 | 2 | 2 | 2 | 0 | 4 | 3 | 2 | 2 |
| S8 | 4 | 4 | 1 | 0 | 2 | 2 | 0 | 0 | 0 | 0 | 0 | 0 | 0 | 1 | 2 | 1 |
| S9 | 5 | 4 | 1 | 0 | 3 | 1 | 0 | 0 | 0 | 5 | 3 | 4 | 0 | 2 | 2 | 1 |
| S10 | 4 | 3 | 0 | 0 | 4 | 3 | 0 | 0 | 6 | 0 | 5 | 4 | 0 | 4 | 3 | 2 |
| S11 | 5 | 4 | 2 | 0 | 4 | 2 | 4 | 4 | 6 | 6 | 0 | 5 | 5 | 3 | 3 | 2 |
| S12 | 4 | 3 | 3 | 0 | 5 | 5 | 0 | 0 | 4 | 4 | 2 | 0 | 0 | 5 | 3 | 4 |
| S13 | 4 | 4 | 0 | 0 | 1 | 2 | 3 | 0 | 0 | 0 | 2 | 0 | 0 | 0 | 2 | 0 |
| S14 | 5 | 3 | 1 | 0 | 3 | 4 | 0 | 0 | 2 | 2 | 3 | 2 | 0 | 0 | 3 | 5 |
| S15 | 3 | 5 | 3 | 0 | 3 | 4 | 3 | 2 | 2 | 2 | 2 | 3 | 2 | 4 | 0 | 4 |
| S16 | 3 | 2 | 4 | 2 | 3 | 5 | 0 | 0 | 2 | 2 | 1 | 3 | 0 | 4 | 3 | 0 |
Table A3.
Direct-relation matrix by government expert.
| No. | S1 | S2 | S3 | S4 | S5 | S6 | S7 | S8 | S9 | S10 | S11 | S12 | S13 | S14 | S15 | S16 |
|---|---|---|---|---|---|---|---|---|---|---|---|---|---|---|---|---|
| S1 | 0 | 2 | 0 | 0 | 0 | 2 | 0 | 1 | 0 | 3 | 2 | 0 | 0 | 3 | 3 | 3 |
| S2 | 5 | 0 | 1 | 0 | 2 | 3 | 0 | 2 | 4 | 4 | 4 | 3 | 4 | 4 | 4 | 3 |
| S3 | 1 | 2 | 0 | 0 | 0 | 4 | 0 | 0 | 0 | 0 | 2 | 0 | 0 | 3 | 3 | 4 |
| S4 | 2 | 2 | 0 | 0 | 0 | 2 | 0 | 0 | 0 | 2 | 1 | 0 | 0 | 2 | 1 | 3 |
| S5 | 4 | 1 | 0 | 0 | 0 | 2 | 0 | 0 | 3 | 2 | 1 | 4 | 0 | 3 | 2 | 3 |
| S6 | 2 | 3 | 3 | 0 | 4 | 0 | 1 | 0 | 1 | 1 | 2 | 3 | 0 | 3 | 3 | 3 |
| S7 | 4 | 2 | 0 | 0 | 0 | 3 | 0 | 0 | 3 | 1 | 3 | 1 | 3 | 2 | 3 | 2 |
| S8 | 4 | 2 | 0 | 0 | 3 | 0 | 0 | 0 | 0 | 0 | 4 | 0 | 0 | 3 | 2 | 1 |
| S9 | 5 | 3 | 0 | 0 | 3 | 0 | 0 | 0 | 0 | 2 | 1 | 2 | 0 | 2 | 1 | 1 |
| S10 | 4 | 3 | 0 | 0 | 3 | 3 | 0 | 0 | 6 | 0 | 2 | 3 | 0 | 3 | 4 | 2 |
| S11 | 3 | 3 | 0 | 0 | 3 | 2 | 0 | 0 | 6 | 6 | 0 | 2 | 3 | 3 | 4 | 3 |
| S12 | 3 | 2 | 0 | 0 | 4 | 4 | 0 | 0 | 3 | 3 | 1 | 0 | 0 | 4 | 2 | 4 |
| S13 | 3 | 4 | 0 | 0 | 0 | 0 | 4 | 0 | 4 | 3 | 4 | 0 | 0 | 4 | 2 | 2 |
| S14 | 3 | 3 | 0 | 0 | 1 | 4 | 0 | 0 | 0 | 2 | 3 | 1 | 0 | 0 | 4 | 6 |
| S15 | 3 | 4 | 0 | 0 | 3 | 4 | 0 | 0 | 4 | 4 | 3 | 1 | 4 | 4 | 0 | 4 |
| S16 | 3 | 3 | 0 | 0 | 1 | 4 | 0 | 0 | 3 | 3 | 2 | 2 | 0 | 4 | 3 | 0 |
Table A4.
Direct-relation matrix by Scholar1.
| No. | S1 | S2 | S3 | S4 | S5 | S6 | S7 | S8 | S9 | S10 | S11 | S12 | S13 | S14 | S15 | S16 |
|---|---|---|---|---|---|---|---|---|---|---|---|---|---|---|---|---|
| S1 | 0 | 2 | 1 | 0 | 1 | 3 | 2 | 3 | 2 | 1 | 2 | 1 | 1 | 4 | 2 | 4 |
| S2 | 5 | 0 | 2 | 1 | 3 | 3 | 1 | 4 | 4 | 3 | 4 | 4 | 1 | 4 | 4 | 4 |
| S3 | 3 | 3 | 0 | 0 | 1 | 5 | 4 | 0 | 0 | 1 | 2 | 1 | 2 | 4 | 3 | 4 |
| S4 | 2 | 2 | 0 | 0 | 0 | 2 | 0 | 0 | 1 | 1 | 1 | 0 | 0 | 2 | 0 | 3 |
| S5 | 4 | 1 | 1 | 0 | 0 | 4 | 1 | 0 | 3 | 3 | 1 | 4 | 0 | 3 | 2 | 2 |
| S6 | 3 | 3 | 5 | 0 | 3 | 0 | 3 | 0 | 1 | 1 | 1 | 4 | 1 | 3 | 4 | 4 |
| S7 | 5 | 5 | 3 | 0 | 3 | 3 | 0 | 0 | 3 | 2 | 2 | 3 | 4 | 2 | 1 | 2 |
| S8 | 4 | 4 | 2 | 0 | 1 | 2 | 0 | 0 | 0 | 0 | 2 | 0 | 0 | 2 | 2 | 1 |
| S9 | 5 | 3 | 1 | 0 | 4 | 3 | 0 | 0 | 0 | 4 | 3 | 4 | 0 | 3 | 1 | 1 |
| S10 | 4 | 2 | 1 | 0 | 4 | 3 | 0 | 0 | 6 | 0 | 4 | 4 | 0 | 3 | 4 | 2 |
| S11 | 4 | 4 | 1 | 0 | 3 | 3 | 0 | 0 | 4 | 4 | 0 | 3 | 4 | 4 | 3 | 2 |
| S12 | 3 | 1 | 4 | 0 | 4 | 4 | 0 | 0 | 3 | 3 | 1 | 0 | 0 | 3 | 2 | 2 |
| S13 | 4 | 4 | 1 | 0 | 1 | 3 | 4 | 0 | 2 | 2 | 2 | 1 | 0 | 3 | 3 | 1 |
| S14 | 3 | 3 | 0 | 0 | 2 | 3 | 0 | 0 | 1 | 2 | 2 | 2 | 0 | 0 | 3 | 5 |
| S15 | 3 | 3 | 1 | 0 | 3 | 5 | 0 | 0 | 4 | 4 | 1 | 1 | 2 | 4 | 0 | 3 |
| S16 | 2 | 2 | 3 | 0 | 2 | 4 | 0 | 0 | 1 | 2 | 1 | 2 | 0 | 4 | 3 | 0 |
Table A5.
Direct-relation matrix by Scholar2.
| No. | S1 | S2 | S3 | S4 | S5 | S6 | S7 | S8 | S9 | S10 | S11 | S12 | S13 | S14 | S15 | S16 |
|---|---|---|---|---|---|---|---|---|---|---|---|---|---|---|---|---|
| S1 | 0 | 1 | 1 | 0 | 1 | 3 | 0 | 1 | 1 | 2 | 2 | 0 | 0 | 3 | 3 | 3 |
| S2 | 5 | 0 | 3 | 0 | 1 | 3 | 0 | 1 | 4 | 3 | 4 | 3 | 3 | 4 | 3 | 3 |
| S3 | 2 | 2 | 0 | 0 | 1 | 5 | 1 | 0 | 1 | 2 | 2 | 1 | 0 | 4 | 3 | 4 |
| S4 | 3 | 2 | 0 | 0 | 1 | 2 | 0 | 0 | 0 | 1 | 1 | 0 | 0 | 3 | 1 | 3 |
| S5 | 4 | 2 | 2 | 0 | 0 | 3 | 0 | 0 | 2 | 2 | 1 | 4 | 0 | 3 | 1 | 2 |
| S6 | 3 | 2 | 4 | 0 | 4 | 0 | 3 | 0 | 3 | 3 | 1 | 4 | 0 | 3 | 4 | 4 |
| S7 | 3 | 2 | 3 | 0 | 2 | 4 | 0 | 0 | 3 | 2 | 2 | 1 | 4 | 3 | 3 | 2 |
| S8 | 4 | 3 | 0 | 0 | 2 | 0 | 0 | 0 | 0 | 1 | 2 | 1 | 0 | 2 | 2 | 1 |
| S9 | 4 | 2 | 1 | 0 | 3 | 4 | 0 | 0 | 0 | 4 | 1 | 3 | 0 | 3 | 3 | 2 |
| S10 | 4 | 2 | 1 | 0 | 4 | 3 | 0 | 0 | 6 | 0 | 2 | 3 | 0 | 3 | 3 | 2 |
| S11 | 3 | 3 | 0 | 0 | 2 | 3 | 0 | 0 | 4 | 4 | 0 | 1 | 4 | 2 | 3 | 2 |
| S12 | 2 | 2 | 0 | 0 | 4 | 4 | 0 | 0 | 3 | 3 | 1 | 0 | 0 | 4 | 2 | 2 |
| S13 | 3 | 3 | 0 | 0 | 1 | 2 | 2 | 0 | 3 | 2 | 2 | 0 | 0 | 2 | 3 | 2 |
| S14 | 3 | 4 | 1 | 0 | 2 | 3 | 1 | 0 | 2 | 3 | 3 | 1 | 2 | 0 | 3 | 5 |
| S15 | 3 | 3 | 0 | 0 | 2 | 4 | 0 | 0 | 3 | 4 | 2 | 3 | 3 | 3 | 0 | 3 |
| S16 | 3 | 3 | 0 | 0 | 3 | 5 | 0 | 0 | 1 | 2 | 1 | 2 | 0 | 3 | 3 | 0 |
Table A6.
Linguistic values of TrIFNs for linguistic terms.
| Linguistic Variable | Influence Score | Corresponding Trapezoidal Intuitionistic Fuzzy Numbers (TrIFNs) | Expected Crisp Value |
|---|---|---|---|
| absolutely no influence | 0 | <(0,0,0,0), (0,0,0,0)> | 0 |
| a little bit influence | 1 | <(0,0.1,0.2,0.3), (0,0.1,0.2,0.3)> | 0.15 |
| small influence | 2 | <(0.1,0.2,0.3,0.4), (0,0.2,0.3,0.5)> | 0.25 |
| normal influence | 3 | <(0.3,0.4,0.5,0.6), (0.2,0.4,0.5,0.7)> | 0.45 |
| high influence | 4 | <(0.5,0.6,0.7,0.8), (0.4,0.6,0.7,0.9)> | 0.65 |
| very high influence | 5 | <(0.7,0.8,0.9,1), (0.7,0.8,0.9,1)> | 0.85 |
| absolutely high influence | 6 | <(1,1,1,1), (1,1,1,1)> | 1 |
Table A7.
Linguistic variable for the importance weight of expert.
| Linguistic Variable | Fuzzy Numbers |
|---|---|
| very low (VL) | (0,0.1,0.3) |
| low (L) | (0.1,0.3,0.5) |
| medium (M) | (0.3,0.5,0.7) |
| high (H) | (0.5,0.7,0.9) |
| very high (VH) | (0.7,0.9,1) |
Table A8.
The semantic variables in expert weight.
| Experts | Linguistic Variable | Important Weight | Crisp Weight |
|---|---|---|---|
| industry expert | Low | (0.1,0.3,0.5) | 0.3 |
| Government expert | High | (0.5,0.7,0.9) | 0.7 |
| Scholar 1 | Medium | (0.3,0.5,0.7) | 0.5 |
| Scholar 2 | Medium | (0.3,0.5,0.7) | 0.5 |
Table A9.
Total averaged crisp matrix A.
| No. | S1 | S2 | S3 | S4 | S5 | S6 | S7 | S8 | S9 | S10 | S11 | S12 | S13 | S14 | S15 | S16 |
|---|---|---|---|---|---|---|---|---|---|---|---|---|---|---|---|---|
| S1 | 0.00 | 1.75 | 0.65 | 0.00 | 0.50 | 2.50 | 0.50 | 1.50 | 0.75 | 1.80 | 1.70 | 0.25 | 0.25 | 2.80 | 2.30 | 3.40 |
| S2 | 5.15 | 0.00 | 1.90 | 0.25 | 2.00 | 3.00 | 0.70 | 2.40 | 4.00 | 3.35 | 3.85 | 3.40 | 3.15 | 4.00 | 3.75 | 3.25 |
| S3 | 1.90 | 2.10 | 0.00 | 0.00 | 0.50 | 4.50 | 1.25 | 0.00 | 0.25 | 0.75 | 1.70 | 0.65 | 0.80 | 3.35 | 2.70 | 4.15 |
| S4 | 2.40 | 2.00 | 0.00 | 0.00 | 0.25 | 1.85 | 0.00 | 0.00 | 0.40 | 1.35 | 0.85 | 0.00 | 0.00 | 2.10 | 0.60 | 3.00 |
| S5 | 3.70 | 1.40 | 1.20 | 0.00 | 0.00 | 2.75 | 0.25 | 0.00 | 2.75 | 2.40 | 1.00 | 4.00 | 0.00 | 3.00 | 1.75 | 2.35 |
| S6 | 2.35 | 2.60 | 3.90 | 0.00 | 3.60 | 0.00 | 2.45 | 0.30 | 1.35 | 1.50 | 1.35 | 3.80 | 0.25 | 3.00 | 3.20 | 3.80 |
| S7 | 4.15 | 3.05 | 1.95 | 0.00 | 1.40 | 3.25 | 0.00 | 0.00 | 2.85 | 1.65 | 2.35 | 1.35 | 3.65 | 2.40 | 2.35 | 2.00 |
| S8 | 4.00 | 3.05 | 0.65 | 0.00 | 2.10 | 0.80 | 0.00 | 0.00 | 0.00 | 0.25 | 2.40 | 0.25 | 0.00 | 2.20 | 2.00 | 1.00 |
| S9 | 4.75 | 2.90 | 0.65 | 0.00 | 3.25 | 1.90 | 0.00 | 0.00 | 0.00 | 3.45 | 1.80 | 3.05 | 0.00 | 2.50 | 1.65 | 1.25 |
| S10 | 4.00 | 2.50 | 0.50 | 0.00 | 3.65 | 3.00 | 0.00 | 0.00 | 6.00 | 0.00 | 2.95 | 3.40 | 0.00 | 3.15 | 3.60 | 2.00 |
| S11 | 3.55 | 3.40 | 0.55 | 0.00 | 2.90 | 2.50 | 0.60 | 0.60 | 5.00 | 5.00 | 0.00 | 2.45 | 3.80 | 3.00 | 3.35 | 2.35 |
| S12 | 2.90 | 1.90 | 1.45 | 0.00 | 4.15 | 4.15 | 0.00 | 0.00 | 3.15 | 3.15 | 1.15 | 0.00 | 0.00 | 3.90 | 2.15 | 3.00 |
| S13 | 3.40 | 3.75 | 0.25 | 0.00 | 0.65 | 1.55 | 3.35 | 0.00 | 2.65 | 2.05 | 2.70 | 0.25 | 0.00 | 2.65 | 2.50 | 1.45 |
| S14 | 3.30 | 3.25 | 0.40 | 0.00 | 1.80 | 3.50 | 0.25 | 0.00 | 1.05 | 2.25 | 2.75 | 1.40 | 0.50 | 0.00 | 3.35 | 5.35 |
| S15 | 3.00 | 3.65 | 0.70 | 0.00 | 2.75 | 4.25 | 0.45 | 0.30 | 3.45 | 3.70 | 2.10 | 1.80 | 2.95 | 3.75 | 0.00 | 3.50 |
| S16 | 2.75 | 2.60 | 1.35 | 0.30 | 2.05 | 4.40 | 0.00 | 0.00 | 1.85 | 2.35 | 1.35 | 2.15 | 0.00 | 3.75 | 3.00 | 0.00 |
Table A10.
The normalized direct-relation matrix G.
| No. | S1 | S2 | S3 | S4 | S5 | S6 | S7 | S8 | S9 | S10 | S11 | S12 | S13 | S14 | S15 | S16 |
|---|---|---|---|---|---|---|---|---|---|---|---|---|---|---|---|---|
| S1 | 0.00 | 0.03 | 0.01 | 0.00 | 0.01 | 0.05 | 0.01 | 0.03 | 0.01 | 0.04 | 0.03 | 0.00 | 0.00 | 0.05 | 0.04 | 0.07 |
| S2 | 0.10 | 0.00 | 0.04 | 0.00 | 0.04 | 0.06 | 0.01 | 0.05 | 0.08 | 0.07 | 0.08 | 0.07 | 0.06 | 0.08 | 0.07 | 0.06 |
| S3 | 0.04 | 0.04 | 0.00 | 0.00 | 0.01 | 0.09 | 0.02 | 0.00 | 0.00 | 0.01 | 0.03 | 0.01 | 0.02 | 0.07 | 0.05 | 0.08 |
| S4 | 0.05 | 0.04 | 0.00 | 0.00 | 0.00 | 0.04 | 0.00 | 0.00 | 0.01 | 0.03 | 0.02 | 0.00 | 0.00 | 0.04 | 0.01 | 0.06 |
| S5 | 0.07 | 0.03 | 0.02 | 0.00 | 0.00 | 0.05 | 0.00 | 0.00 | 0.05 | 0.05 | 0.02 | 0.08 | 0.00 | 0.06 | 0.03 | 0.05 |
| S6 | 0.05 | 0.05 | 0.08 | 0.00 | 0.07 | 0.00 | 0.05 | 0.01 | 0.03 | 0.03 | 0.03 | 0.07 | 0.00 | 0.06 | 0.06 | 0.07 |
| S7 | 0.08 | 0.06 | 0.04 | 0.00 | 0.03 | 0.06 | 0.00 | 0.00 | 0.06 | 0.03 | 0.05 | 0.03 | 0.07 | 0.05 | 0.05 | 0.04 |
| S8 | 0.08 | 0.06 | 0.01 | 0.00 | 0.04 | 0.02 | 0.00 | 0.00 | 0.00 | 0.00 | 0.05 | 0.00 | 0.00 | 0.04 | 0.04 | 0.02 |
| S9 | 0.09 | 0.06 | 0.01 | 0.00 | 0.06 | 0.04 | 0.00 | 0.00 | 0.00 | 0.07 | 0.04 | 0.06 | 0.00 | 0.05 | 0.03 | 0.02 |
| S10 | 0.08 | 0.05 | 0.01 | 0.00 | 0.07 | 0.06 | 0.00 | 0.00 | 0.12 | 0.00 | 0.06 | 0.07 | 0.00 | 0.06 | 0.07 | 0.04 |
| S11 | 0.07 | 0.07 | 0.01 | 0.00 | 0.06 | 0.05 | 0.01 | 0.01 | 0.10 | 0.10 | 0.00 | 0.05 | 0.07 | 0.06 | 0.07 | 0.05 |
| S12 | 0.06 | 0.04 | 0.03 | 0.00 | 0.08 | 0.08 | 0.00 | 0.00 | 0.06 | 0.06 | 0.02 | 0.00 | 0.00 | 0.08 | 0.04 | 0.06 |
| S13 | 0.07 | 0.07 | 0.00 | 0.00 | 0.01 | 0.03 | 0.07 | 0.00 | 0.05 | 0.04 | 0.05 | 0.00 | 0.00 | 0.05 | 0.05 | 0.03 |
| S14 | 0.06 | 0.06 | 0.01 | 0.00 | 0.04 | 0.07 | 0.00 | 0.00 | 0.02 | 0.04 | 0.05 | 0.03 | 0.01 | 0.00 | 0.07 | 0.10 |
| S15 | 0.06 | 0.07 | 0.01 | 0.00 | 0.05 | 0.08 | 0.01 | 0.01 | 0.07 | 0.07 | 0.04 | 0.04 | 0.06 | 0.07 | 0.00 | 0.07 |
| S16 | 0.05 | 0.05 | 0.03 | 0.01 | 0.04 | 0.09 | 0.00 | 0.00 | 0.04 | 0.05 | 0.03 | 0.04 | 0.00 | 0.07 | 0.06 | 0.00 |
Table A11.
Total relation matrix.
| No. | S1 | S2 | S3 | S4 | S5 | S6 | S7 | S8 | S9 | S10 | S11 | S12 | S13 | S14 | S15 | S16 |
|---|---|---|---|---|---|---|---|---|---|---|---|---|---|---|---|---|
| S1 | 0.065 | 0.084 | 0.037 | 0.001 | 0.056 | 0.106 | 0.022 | 0.037 | 0.064 | 0.083 | 0.072 | 0.049 | 0.025 | 0.113 | 0.097 | 0.121 |
| S2 | 0.225 | 0.103 | 0.081 | 0.006 | 0.129 | 0.174 | 0.039 | 0.062 | 0.173 | 0.162 | 0.151 | 0.147 | 0.097 | 0.195 | 0.175 | 0.174 |
| S3 | 0.111 | 0.101 | 0.031 | 0.001 | 0.064 | 0.156 | 0.041 | 0.010 | 0.062 | 0.073 | 0.079 | 0.064 | 0.040 | 0.135 | 0.115 | 0.148 |
| S4 | 0.090 | 0.073 | 0.017 | 0.001 | 0.036 | 0.077 | 0.008 | 0.007 | 0.042 | 0.060 | 0.044 | 0.031 | 0.013 | 0.082 | 0.050 | 0.098 |
| S5 | 0.148 | 0.088 | 0.053 | 0.001 | 0.059 | 0.127 | 0.019 | 0.011 | 0.112 | 0.107 | 0.067 | 0.129 | 0.021 | 0.132 | 0.098 | 0.117 |
| S6 | 0.144 | 0.126 | 0.111 | 0.002 | 0.137 | 0.098 | 0.064 | 0.018 | 0.102 | 0.105 | 0.086 | 0.137 | 0.036 | 0.152 | 0.142 | 0.162 |
| S7 | 0.176 | 0.135 | 0.073 | 0.001 | 0.093 | 0.150 | 0.022 | 0.014 | 0.128 | 0.107 | 0.105 | 0.090 | 0.100 | 0.137 | 0.125 | 0.125 |
| S8 | 0.132 | 0.101 | 0.033 | 0.001 | 0.078 | 0.068 | 0.011 | 0.010 | 0.044 | 0.051 | 0.081 | 0.043 | 0.020 | 0.095 | 0.085 | 0.072 |
| S9 | 0.171 | 0.116 | 0.043 | 0.001 | 0.120 | 0.113 | 0.014 | 0.013 | 0.066 | 0.129 | 0.084 | 0.114 | 0.023 | 0.125 | 0.099 | 0.099 |
| S10 | 0.181 | 0.128 | 0.048 | 0.001 | 0.145 | 0.153 | 0.018 | 0.014 | 0.192 | 0.085 | 0.117 | 0.137 | 0.030 | 0.157 | 0.151 | 0.131 |
| S11 | 0.188 | 0.156 | 0.052 | 0.002 | 0.139 | 0.153 | 0.035 | 0.027 | 0.187 | 0.184 | 0.074 | 0.127 | 0.105 | 0.166 | 0.158 | 0.146 |
| S12 | 0.148 | 0.107 | 0.063 | 0.001 | 0.145 | 0.164 | 0.017 | 0.012 | 0.130 | 0.130 | 0.078 | 0.067 | 0.024 | 0.160 | 0.117 | 0.141 |
| S13 | 0.152 | 0.138 | 0.036 | 0.001 | 0.071 | 0.107 | 0.080 | 0.013 | 0.118 | 0.106 | 0.105 | 0.062 | 0.032 | 0.129 | 0.117 | 0.102 |
| S14 | 0.152 | 0.131 | 0.043 | 0.002 | 0.099 | 0.151 | 0.022 | 0.014 | 0.092 | 0.114 | 0.106 | 0.090 | 0.038 | 0.087 | 0.138 | 0.179 |
| S15 | 0.169 | 0.154 | 0.055 | 0.002 | 0.130 | 0.179 | 0.032 | 0.021 | 0.151 | 0.154 | 0.108 | 0.111 | 0.087 | 0.173 | 0.092 | 0.162 |
| S16 | 0.137 | 0.115 | 0.059 | 0.007 | 0.101 | 0.162 | 0.017 | 0.012 | 0.100 | 0.110 | 0.078 | 0.100 | 0.025 | 0.151 | 0.127 | 0.080 |
Table A12.
The comprehensive influence relation table.
| D Sum | Ranking | R Sum | Ranking | R + D | Ranking | D − R | Ranking | |
|---|---|---|---|---|---|---|---|---|
| S1 | 1.030 | 14 | 2.387 | 1 | 3.417 | 7 | −1.357 | 16 |
| S2 | 2.095 | 1 | 1.858 | 6 | 3.953 | 1 | 0.237 | 7 |
| S3 | 1.232 | 13 | 0.832 | 12 | 2.064 | 13 | 0.4 | 6 |
| S4 | 0.731 | 16 | 0.032 | 16 | 0.763 | 16 | 0.699 | 2 |
| S5 | 1.287 | 12 | 1.603 | 9 | 2.89 | 11 | −0.316 | 11 |
| S6 | 1.622 | 5 | 2.138 | 3 | 3.76 | 2 | −0.516 | 13 |
| S7 | 1.580 | 6 | 0.461 | 14 | 2.041 | 14 | 1.119 | 1 |
| S8 | 0.926 | 15 | 0.296 | 15 | 1.222 | 15 | 0.63 | 4 |
| S9 | 1.332 | 11 | 1.765 | 7 | 3.097 | 9 | −0.433 | 12 |
| S10 | 1.691 | 4 | 1.760 | 8 | 3.451 | 5 | −0.069 | 9 |
| S11 | 1.899 | 2 | 1.437 | 11 | 3.336 | 8 | 0.462 | 5 |
| S12 | 1.506 | 7 | 1.498 | 10 | 3.004 | 10 | 0.008 | 8 |
| S13 | 1.371 | 10 | 0.717 | 13 | 2.088 | 12 | 0.654 | 3 |
| S14 | 1.458 | 8 | 2.189 | 2 | 3.647 | 4 | −0.731 | 15 |
| S15 | 1.779 | 3 | 1.889 | 5 | 3.668 | 3 | −0.11 | 10 |
| S16 | 1.382 | 9 | 2.059 | 4 | 3.441 | 6 | −0.677 | 14 |
References
- Chen, Z.G.; Chen, D.J.; Wang, T.; Hu, S.Y. Policies on end-of-life passenger cars in China: Dynamic modeling and cost-benefit analysis. J. Clean. Prod. 2015, 108, 1140–1148. [Google Scholar] [CrossRef]
- Xia, X.Q.; Govindan, K.; Zhu, Q.H. Analyzing internal barriers for automotive parts remanufacturers in China using grey-DEMATEL approach. J. Clean. Prod. 2015, 87, 811–825. [Google Scholar] [CrossRef]
- Tian, J.; Chen, M. Sustainable design for automotive products: Dismantling and recycling of end-of-life vehicles. Waste Manag. 2014, 34, 458–467. [Google Scholar] [CrossRef] [PubMed]
- Wang, L.; Chen, M. Policies and perspective on end-of-life vehicles in China. J. Clean. Prod. 2013, 44, 168–176. [Google Scholar] [CrossRef]
- Harraz, N.A.; Galal, N.M. Design of sustainable end-of-life vehicle recovery network in Egypt. Ain Shams Eng. J. 2011, 2, 211–219. [Google Scholar] [CrossRef]
- Ene, S.; Öztürk, N. Network modeling for reverse flows of end-of-life vehicles. Waste Manag. 2015, 38, 284–296. [Google Scholar] [CrossRef] [PubMed]
- Wang, X.; Chen, M. Implementing extended producer responsibility: Vehicle remanufacture in China. J. Clean. Prod. 2011, 19, 680–686. [Google Scholar]
- Hu, S.H.; Wen, Z.G. Why does informal sector of end-of-life vehicle treatment thrive? A case study of China and lesson for development countries in motorization process. Resour. Conserv. Recycl. 2015, 95, 91–99. [Google Scholar] [CrossRef]
- Pan, Y.X.; Li, H.T. Sustainability evaluation of end-of-life vehicle recycling based on energy analysis: A case study of an end-of-life vehicle recycling enterprise in China. J. Clean. Prod. 2016, 131, 219–227. [Google Scholar] [CrossRef]
- Ministry of Commerce People’s Republic of China. Industry Development Report of Recycled Resources of China; Ministry of Commerce People’s Republic of China: Beijing, China, 2017.
- Li, J.H.; Yu, K.L.; Gao, P. Recycling and pollution control of the end of life vehicles in China. J. Mater. Cycles Waste. 2014, 16, 31–38. [Google Scholar] [CrossRef]
- Nawon, K. Exploring determinant factors for effective end-of-fife vehicle policy. LIIEE Rep. 2002, 7, 324–331. [Google Scholar]
- Yang, L.B. How to implement the automobile reverse logistics. Logist. Technol. 2006, 8, 97–99. [Google Scholar]
- Liu, X.P.; Xie, J.P.; Yin, J. Incentive factors of the client’s voluntary return of discarded cars. Contemp. Econ. Manag. 2007, 29, 67–70. [Google Scholar]
- Hu, S.H. Study on Influence of Vehicle Recovery Policy on End-of-Life Vehicle Recycling Rate. Master’s Thesis, Hunan University, Hunan, China, 2009. [Google Scholar]
- Wu, X.N. The Optimization Research on Hebei Scrap Car Recycling System. Master’s Thesis, Shijiazhuang Tiedao University, Shijiazhuang, China, 2014. [Google Scholar]
- Gen, P.L.; Rong, H.J.; Wang, N.N. The effect of tax refunds on recovery rate of scrap cars. Sci. Technol. Dev. 2012, 6, 28–29. [Google Scholar]
- Reuter, M.A.; Schaik, A.V.; Ignatenko, O.; Haan, G.J.D. Fundamental limits for the recycling of end-of-life vehicles. Miner. Eng. 2006, 19, 433–449. [Google Scholar] [CrossRef]
- Ferrão, P.; Amaral, J. Design for recycling in the automobile industry: New approaches and new tools. J. Eng. Des. 2007, 17, 447–462. [Google Scholar] [CrossRef]
- Fiore, S.; Ruffino, B.; Zanetti, M. Automobile Shredder Residues in Italy: Characterization and valorization opportunities. Waste Manag. 2012, 32, 1548–1559. [Google Scholar] [CrossRef] [PubMed]
- Lin, R.J. Using fuzzy DEMATEL to evaluate the green supply chain management practices. J. Clean. Prod. 2013, 40, 32–39. [Google Scholar] [CrossRef]
- Chang, B.; Chang, C.W.; Wu, C.H. Fuzzy dematel method for developing supplier selection criteria. Expert Syst. Appl. 2011, 38, 1850–1858. [Google Scholar] [CrossRef]
- Atanassov, K. Intuitionistic fuzzy sets. Fuzzy Set. Syst. 1986, 20, 87–96. [Google Scholar] [CrossRef]
- Wang, Z.; Obata, N.O. Study on ELV dismantling system in China-based on the results of interviewing with certificated dismantlers and uncertificated dismantlers. Policy Sci. 2009, 16, 41–49. [Google Scholar]
- Hu, S.H.; Wen, Z.G. Monetary evaluation of end-of-life vehicle treatment from a social perspective for different scenarios in China. J. Clean. Prod. 2017, 159, 257–270. [Google Scholar] [CrossRef]
- Liu, Y.W.; Zhang, Y.; Yao, Y. Study of the current situation and countermeasure on Chinese waste automobiles recovery. Value Eng. 2012, 19, 308–309. [Google Scholar]
- Wang, L.; Chen, M. End-of-Life Vehicle Dismantling and Recycling Enterprises: Developing Directions in China. JOM 2013, 65, 1015–1020. [Google Scholar] [CrossRef]
- Long, S.H. The current situation and development trend of scrap auto recycling and dismantling industry in China. Iron Steel Scrap China 2015, 2, 20–26. [Google Scholar]
- Demirel, E.; Demirel, N.; Gökçen, H. A mixed integer linear programming model to optimize reverse logistics activities of end-of-life vehicles in Turkey. J. Clean. Prod. 2016, 112, 2101–2113. [Google Scholar] [CrossRef]
- Mahmoudzadeh, M.; Mansour, S.; Karimi, B. To develop a third-party reverse logistics network for end-of-life vehicles in Iran. Resour. Conserv. Recycl. 2013, 78, 1–14. [Google Scholar] [CrossRef]
- Simic, V. Fuzzy risk explicit interval linear programming model for end-of-life vehicle recycling planning in the EU. Waste Manag. 2015, 35, 265–282. [Google Scholar] [CrossRef] [PubMed]
- Cruz-Rivera, R.; Ertel, J. Reverse logistics network design for the collection of end-of-life vehicles in Mexico. Eur. J. Oper. Res. 2009, 196, 930–939. [Google Scholar] [CrossRef]
- Simic, V. Interval-parameter chance-constraint programming model for end-of-life vehicles management under rigorous environmental regulations. Waste Manag. 2016, 52, 180–192. [Google Scholar] [CrossRef] [PubMed]
- Simic, V. End-of-life vehicles allocation management under multiple uncertainties: An interval-parameter two-stage stochastic full-infinite programming approach. Resour. Conserv. Recycl. 2016, 114, 1–17. [Google Scholar] [CrossRef]
- Zhou, F.; Lin, Y.; Wang, X.; He, Y. ELV recycling service provider selection using the hybrid MCDM method: A case application in China. Sustainability 2016, 8, 482. [Google Scholar] [CrossRef]
- Zhao, Q.; Chen, M. A comparison of elv recycling system in China and Japan and China’s strategies. Resour. Conserv. Recycl. 2011, 57, 15–21. [Google Scholar] [CrossRef]
- Ferrão, P.; Nazareth, P.; Amaral, J. Strategies for meeting EU end-of-life vehicle reuse/recovery targets. J. Ind. Ecol. 2006, 10, 77–93. [Google Scholar] [CrossRef]
- Schaik, A.V.; Reuter, M.A. The time-varying factors influencing the recycling rate of products. Resour. Conserv. Recycl. 2004, 40, 301–328. [Google Scholar] [CrossRef]
- Liu, J. Scrap Car Recycling Can No Longer Rely On “Selling Scrap Iron”; China Economic Net: Beijing, China, 2016. [Google Scholar]
- Zhang, H.S.; Chen, M. Research on the recycling industry development model for typical exterior plastic components of end-of-life passenger vehicle based on the SWOT method. Waste Manag. 2013, 33, 2341–2352. [Google Scholar] [CrossRef] [PubMed]
- Gabus, A.; Fontela, E. World Problems, an Invitation to Further Thought within the Framework of DEMATEL; Battelle Geneva Research Centre: Geneva, Switzerland, 1972. [Google Scholar]
- Wu, W.W.; Lee, Y.T. Developing global managers’ competencies using the fuzzy DEMATEL method. Expert Syst. Appl. 2007, 32, 499–507. [Google Scholar] [CrossRef]
- Fontela, E.; Gabus, A. The DEMATEL Observer, DEMATEL 1976; Battelle Geneva Research Centre: Geneva, Switzerland, 1976. [Google Scholar]
- Yazdani, M.; Chatterjee, P.; Zavadskas, E.K.; Zolfani, S.H. Integrated QFD-MCDM framework for green supplier selection. J. Clean. Prod. 2017, 142, 3728–3740. [Google Scholar] [CrossRef]
- Song, W.Y.; Xu, Z.T.; Liu, H.C. Developing sustainable supplier selection criteria for solar air-conditioner manufacturer: An integrated approach. Renew. Sustain. Energy Rev. 2017, 79, 1461–1471. [Google Scholar] [CrossRef]
- Zhu, Q.; Sarkis, J.; Lai, K. Supply chain-based barriers for truck-engine remanufacturing in China. Transport. Res. E 2014, 68, 103–117. [Google Scholar] [CrossRef]
- Deng, Q.; Liu, X.; Liao, H. Identifying critical factors in the eco-efficiency of remanufacturing based on the fuzzy DEMATEL method. Sustainability 2015, 7, 15527–15547. [Google Scholar] [CrossRef]
- Tsai, S.B. Using the DEMATEL model to explore the job satisfaction of research and development professionals in china’s photovoltaic cell industry. Renew. Sustain. Energ. Rev. 2018, 81, 62–68. [Google Scholar] [CrossRef]
- Tooranloo, H.S.; Azadi, M.H.; Sayyahpoor, A. Analyzing factors affecting implementation success of sustainable human resource management (SHRM) using a hybrid approach of FAHP and type-2 fuzzy DEMATEL. J. Clean. Prod. 2017, 162, 1252–1265. [Google Scholar] [CrossRef]
- Celik, E. A cause and effect relationship model for location of temporary shelters in disaster operations management. Int. J. Disast. Risk Reduct. 2017, 22, 257–268. [Google Scholar] [CrossRef]
- Gigović, L.; Pamučar, D.; Božanić, D.; Ljubojević, S. Application of the GIS-DANP-MABAC multi-criteria model for selecting the location of wind farms: A case study of Vojvodina, Serbia. Renew. Energy 2017, 103, 501–521. [Google Scholar] [CrossRef]
- Łaska, G. Wind Energy and multi-criteria analysis in making decisions on the location of wind farms. Procedia Eng. 2017, 182, 418–424. [Google Scholar]
- Govindan, K.; Chaudhuri, A. Interrelationships of risks faced by third party logistics service providers: A DEMATEL based approach. Transp. Res. E 2016, 90, 177–195. [Google Scholar] [CrossRef]
- Song, W.Y.; Ming, X.G.; Liu, H.C. Identifying critical risk factors of sustainable supply chain management: A rough strength-relation analysis method. J. Clean. Prod. 2017, 143, 100–115. [Google Scholar] [CrossRef]
- Liu, Y.; Chen, Y.; Tzeng, G.H. Identification of key factors in consumers’ adoption behavior of intelligent medical terminals based on a hybrid modified MADM model for product improvement. Int. J. Med. Inform. 2017, 105, 68–82. [Google Scholar] [CrossRef] [PubMed]
- Shen, K.Y.; Hu, S.K.; Tzeng, G.H. Financial modeling and improvement planning for the life insurance industry by using a rough knowledge based hybrid MCDM model. Inform. Sci. 2016, 375, 296–313. [Google Scholar] [CrossRef]
- Tzeng, G.H.; Chiang, C.H.; Li, C.W. Evaluating intertwined effects in e-learning programs: A novel hybrid MCDM model based on factor analysis and DEMATEL. Expert Syst. Appl. 2007, 32, 1028–1044. [Google Scholar] [CrossRef]
- Liao, H.C.; Xu, Z.S. Priorities of intuitionistic fuzzy preference relation based on multiplicative consistency. IEEE Trans. Fuzzy Syst. 2014, 22, 1669–1681. [Google Scholar] [CrossRef]
- Liao, H.C.; Xu, Z.S. Multi-criteria decision making with intuitionistic fuzzy PROMETHEE. J. Intell. Fuzzy Syst. 2014, 27, 1703–1717. [Google Scholar]
- Xu, Z.; Liao, H. Intuitionistic fuzzy analytic hierarchy process. IEEE Trans. Fuzzy Syst. 2013, 22, 749–761. [Google Scholar] [CrossRef]
- Xu, Z.; Liao, H. A survey of approaches to decision making with intuitionistic fuzzy preference relations. Knowl.-Based Syst. 2015, 80, 131–142. [Google Scholar] [CrossRef]
- Nehi, H.M.; Maleki, H.R. Intuitionistic fuzzy numbers and it’s applications in fuzzy optimization problem. In Proceedings of the 9th WSEAS international conference on systems, Athens, Greece, 11–13 July 2005; pp. 1–5. [Google Scholar]
- Grzegrorzewski, P. The hamming distance between intuitionistic fuzzy sets. In Proceedings of the 10th IFSA world congress, Istanbul, Turkey, 30 June–2 July 2003; pp. 35–38. [Google Scholar]
- Chen, B.H. Hundreds of Components Have Been Disassembled within 6 Minutes during the Whole Process of Scrap Car Recycling and Dismantling in Chengdu City; Sichuan Daily: Chengdu, China, 2016. [Google Scholar]
Figure 1.
Number of end-of-life vehicles collected legally, deregistered vehicles and ratio of ELVs flowing into the informal sector in China 2007–2016. Data source: Ministry of Commerce People’s Republic of China [10].
Figure 1.
Number of end-of-life vehicles collected legally, deregistered vehicles and ratio of ELVs flowing into the informal sector in China 2007–2016. Data source: Ministry of Commerce People’s Republic of China [10].

Figure 2.
The influence relation among various factors.

Figure 3.
Government–recycler–manufacturer–owner recycling model.

Table 1.
The factors affecting the ELV recycling rate in China.
| Dimensions | Influence Factors of ELVs Recycling in China | Sources |
|---|---|---|
| Economy | recycling cost (S1) | [8,24] |
| fiscal subsidy (S2) | [1] | |
| punishments on illegal recycling enterprises and scrappers (S3) | [25] | |
| car owner’s income level (S4) | [8,26] | |
| Policy | scrap procedures (S5) | [15,16] |
| supervision of the government (S6) | [28] | |
| government’s restrictive policies on re-use of ELVs parts (S7) | [4,15,16] | |
| tax policy (S8) | [17,28] | |
| Recycling network | reverse logistics system (S9) | [6,29,30,31,32,33,34] |
| recycling mode (S10) | [4,6,8,11,35] | |
| participation of automobile manufacturer (S11) | [4,36,37] | |
| Others | information management system (S12) | [7,8,38] |
| dismantling and recycling technologies (S13) | [7,39] | |
| marketing and propaganda and popularization(S14) | [1,8] | |
| coordination of the industry agencies (S15) | [16] | |
| environmental and legal awareness of the car owners (S16) | [8,28,40] |
Table 2.
Affecting degree, central degree and causal degree from the different dimensions.
| Dimension | D | D + R | D − R |
|---|---|---|---|
| Economy | 5.088 | 10.197 | −0.021 |
| Policy | 5.415 | 9.913 | 0.917 |
| Recycling Network | 4.922 | 9.884 | −0.04 |
| Others | 7.496 | 25.848 | −0.856 |
Table 3.
The (D + R) scores of every factor under different scenarios.
| S1 | S2 | S3 | S4 | S5 | S6 | S7 | S8 | S9 | S10 | S11 | S12 | S13 | S14 | S15 | S16 | Sum | |
|---|---|---|---|---|---|---|---|---|---|---|---|---|---|---|---|---|---|
| A | 3.42 | 3.95 | 2.06 | 0.76 | 2.89 | 3.76 | 2.04 | 1.22 | 3.10 | 3.45 | 3.34 | 3.00 | 2.09 | 3.65 | 3.67 | 3.44 | 45.84 |
| B | 3.42 | 3.93 | 2.26 | 0.76 | 2.94 | 3.86 | 2.16 | 1.24 | 3.14 | 3.43 | 3.27 | 3.07 | 2.05 | 3.63 | 3.59 | 3.39 | 46.11 |
| C | 3.51 | 3.91 | 2.58 | 0.74 | 3.01 | 3.98 | 2.35 | 1.28 | 3.18 | 3.37 | 3.19 | 3.12 | 2.05 | 3.57 | 3.47 | 3.29 | 46.62 |
| D | 2.99 | 3.53 | 1.81 | 0.57 | 2.52 | 3.32 | 1.82 | 1.09 | 2.74 | 3.02 | 2.95 | 2.82 | 1.73 | 3.14 | 3.17 | 3.07 | 40.29 |
| E | 3.08 | 3.61 | 1.88 | 0.62 | 2.57 | 3.44 | 1.84 | 1.08 | 2.83 | 3.12 | 3.04 | 2.81 | 1.84 | 3.32 | 3.30 | 3.13 | 41.51 |
| F | 3.19 | 3.65 | 1.96 | 0.63 | 2.62 | 3.54 | 1.88 | 1.09 | 2.89 | 3.16 | 3.03 | 2.77 | 1.90 | 3.36 | 3.36 | 3.12 | 42.15 |
| G | 3.14 | 3.66 | 1.77 | 0.64 | 2.59 | 3.49 | 1.80 | 1.07 | 2.88 | 3.19 | 3.07 | 2.78 | 1.90 | 3.40 | 3.43 | 3.19 | 42.00 |
| H | 3.19 | 3.65 | 1.16 | 0.65 | 2.64 | 3.58 | 1.85 | 1.07 | 2.93 | 3.20 | 3.02 | 2.77 | 1.91 | 3.42 | 3.41 | 3.17 | 41.62 |
| I | 3.14 | 3.66 | 1.85 | 0.62 | 2.58 | 3.43 | 1.83 | 1.08 | 2.84 | 3.14 | 3.07 | 2.76 | 1.90 | 3.33 | 3.36 | 3.14 | 41.73 |
| Sum | 29.08 | 33.55 | 17.34 | 5.99 | 24.36 | 32.39 | 17.57 | 10.22 | 26.53 | 29.08 | 27.98 | 25.90 | 17.36 | 30.82 | 30.75 | 28.95 | 387.87 |
Table 4.
The (D − R) scores of every factor under different scenarios.
| S1 | S2 | S3 | S4 | S5 | S6 | S7 | S8 | S9 | S10 | S11 | S12 | S13 | S14 | S15 | S16 | |
|---|---|---|---|---|---|---|---|---|---|---|---|---|---|---|---|---|
| A | −1.36 | 0.24 | 0.40 | 0.70 | −0.32 | −0.52 | 1.12 | 0.63 | −0.43 | −0.07 | 0.46 | 0.01 | 0.65 | −0.73 | −0.11 | −0.68 |
| B | −1.35 | 0.25 | 0.31 | 0.68 | −0.34 | −0.54 | 1.10 | 0.59 | −0.32 | −0.02 | 0.52 | −0.05 | 0.61 | −0.69 | −0.10 | −0.66 |
| C | −1.26 | 0.28 | 0.24 | 0.65 | −0.36 | −0.58 | 1.09 | 0.56 | −0.18 | 0.07 | 0.56 | −0.16 | 0.63 | −0.75 | −0.11 | −0.66 |
| D | −1.43 | 0.31 | 0.23 | 0.51 | −0.32 | −0.46 | 0.90 | 0.45 | −0.30 | 0.06 | 0.61 | 0.10 | 0.43 | −0.52 | 0.11 | −0.67 |
| E | −1.40 | 0.33 | 0.28 | 0.56 | −0.31 | −0.48 | 0.94 | 0.50 | −0.37 | 0.04 | 0.60 | 0.05 | 0.52 | −0.64 | 0.02 | −0.63 |
| F | −1.35 | 0.35 | 0.36 | 0.57 | −0.32 | −0.50 | 1.00 | 0.55 | −0.39 | 0.02 | 0.53 | −0.01 | 0.60 | −0.72 | −0.04 | −0.66 |
| G | −1.40 | 0.34 | 0.43 | 0.60 | −0.31 | −0.49 | 0.98 | 0.57 | −0.46 | −0.03 | 0.53 | 0.06 | 0.56 | −0.66 | −0.03 | −0.65 |
| H | −1.37 | 0.35 | 1.16 | 0.61 | −0.32 | −0.50 | 1.01 | 0.57 | −0.41 | −0.02 | 0.52 | 0.01 | 0.57 | −0.68 | −0.05 | −0.65 |
| I | −1.38 | 0.34 | 0.35 | 0.56 | −0.30 | −0.49 | 0.97 | 0.54 | −0.42 | 0.02 | 0.55 | 0.04 | 0.60 | −0.71 | 0.00 | −0.66 |
Table 5.
The tested sample data for proving the consistency for (D − R) scores under different scenarios.
Table 5.
The tested sample data for proving the consistency for (D − R) scores under different scenarios.
| S1 | S2 | S3 | S4 | S5 | S6 | S7 | S8 | S9 | S10 | S11 | S12 | S13 | S14 | S15 | S16 | Sum | |
|---|---|---|---|---|---|---|---|---|---|---|---|---|---|---|---|---|---|
| A | 1.36 | 0.24 | 0.40 | 0.70 | 0.32 | 0.52 | 1.12 | 0.63 | 0.43 | 0.07 | 0.46 | 0.01 | 0.65 | 0.73 | 0.11 | 0.68 | 8.42 |
| B | 1.35 | 0.25 | 0.31 | 0.68 | 0.34 | 0.54 | 1.10 | 0.59 | 0.32 | 0.02 | 0.52 | 0.05 | 0.61 | 0.69 | 0.10 | 0.66 | 8.12 |
| C | 1.26 | 0.28 | 0.24 | 0.65 | 0.36 | 0.58 | 1.09 | 0.56 | 0.18 | 0.07 | 0.56 | 0.16 | 0.63 | 0.75 | 0.11 | 0.66 | 8.12 |
| D | 1.43 | 0.31 | 0.23 | 0.51 | 0.32 | 0.46 | 0.90 | 0.45 | 0.30 | 0.06 | 0.61 | 0.10 | 0.43 | 0.52 | 0.11 | 0.67 | 7.41 |
| E | 1.40 | 0.33 | 0.28 | 0.56 | 0.31 | 0.48 | 0.94 | 0.50 | 0.37 | 0.04 | 0.60 | 0.05 | 0.52 | 0.64 | 0.02 | 0.63 | 7.67 |
| F | 1.35 | 0.35 | 0.36 | 0.57 | 0.32 | 0.50 | 1.00 | 0.55 | 0.39 | 0.02 | 0.53 | 0.01 | 0.60 | 0.72 | 0.04 | 0.66 | 7.97 |
| G | 1.40 | 0.34 | 0.43 | 0.60 | 0.31 | 0.49 | 0.98 | 0.57 | 0.46 | 0.03 | 0.53 | 0.06 | 0.56 | 0.66 | 0.03 | 0.65 | 8.10 |
| H | 1.37 | 0.35 | 1.16 | 0.61 | 0.32 | 0.50 | 1.01 | 0.57 | 0.41 | 0.02 | 0.52 | 0.01 | 0.57 | 0.68 | 0.05 | 0.65 | 8.80 |
| I | 1.38 | 0.34 | 0.35 | 0.56 | 0.30 | 0.49 | 0.97 | 0.54 | 0.42 | 0.02 | 0.55 | 0.04 | 0.60 | 0.71 | 0.00 | 0.66 | 7.93 |
| Sum | 12.30 | 2.79 | 3.76 | 5.43 | 2.89 | 4.56 | 9.11 | 4.96 | 3.28 | 0.35 | 4.87 | 0.48 | 5.17 | 6.11 | 0.57 | 5.91 | 72.54 |
© 2017 by the authors. Licensee MDPI, Basel, Switzerland. This article is an open access article distributed under the terms and conditions of the Creative Commons Attribution (CC BY) license (http://creativecommons.org/licenses/by/4.0/).
Share and Cite
MDPI and ACS Style
Gan, J.; Luo, L. Using DEMATEL and Intuitionistic Fuzzy Sets to Identify Critical Factors Influencing the Recycling Rate of End-Of-Life Vehicles in China. Sustainability 2017, 9, 1873. https://doi.org/10.3390/su9101873
AMA Style
Gan J, Luo L. Using DEMATEL and Intuitionistic Fuzzy Sets to Identify Critical Factors Influencing the Recycling Rate of End-Of-Life Vehicles in China. Sustainability. 2017; 9(10):1873. https://doi.org/10.3390/su9101873
Chicago/Turabian StyleGan, Junwei, and Li Luo. 2017. "Using DEMATEL and Intuitionistic Fuzzy Sets to Identify Critical Factors Influencing the Recycling Rate of End-Of-Life Vehicles in China" Sustainability 9, no. 10: 1873. https://doi.org/10.3390/su9101873
Note that from the first issue of 2016, this journal uses article numbers instead of page numbers. See further details here.