1. Introduction
Since China’s Reform and Opening up, Chinese cities have been experiencing an unprecedented rapid urbanization process [
1,
2], with the country’s urbanization rate increasing from 17.9% in 1978 to 56.1% in 2016. That has led to a major human migration from the countryside to cities, especially to Beijing, Shanghai and other large cities [
3]. The population in the city center, which is overly aggregative and monocentric, has resulted in many urban ailments, such as traffic congestion [
4], environmental degradation [
5], housing shortages [
6] and other problems. Decentralization and a polycentric urban structure are considered to be useful methods for solving these problems [
7,
8]. A survey conducted by the National Reform and Development Commission of China showed that 133 of the 144 prefectural level cities surveyed are developing normative plans and policies that target polycentric urban development and that new districts/towns will be built in the future outside of the existing urban cores [
9]. Thanks to China’s six population censuses, many studies have focused on the spatial structure of the residential population of China cities and have found that most cities show an obvious trend toward decentralization and polycentricity [
10,
11,
12]. A polycentric city is defined as a city which has other employment subcenters beyond the CBD (traditional central business district). Compared with the population, the role of employment in the structuring of urban spaces is more significant [
13]. First, the urban employment is the most important resource for the development of the urban economy; second, the concentration of employment can produce agglomeration economies and employment centers paly important role in land values, and population density and other economic activities. Therefore, the emergence of employment subcenters, not residential population subcenters, is considered to be an important symbol of a polycentric urban structure [
14]. Most studies analyzing the urban spatial structure thus takes the viewpoint of population. However, studies on the spatial structure of the employment space in China’s cities are relatively few due to the availability of employment data. With the completion of the three economic censuses, research on the spatial structure of the employment space and its evolution is gradually emerging.
The urban employment spatial structure not only is a simple physical form, but also has special economic significance, and its formation and development are guided by the market mechanism. According to economic theory, the external economy among producers will decrease with an increase of distance [
15]. The external economy creates centripetal force, which is the original power driving cities to take shape and develop, and this will drive employment to agglomerate in a centralized commercial district. At the same time, commuting costs, land rent costs and other congestion costs keep increasing, and enterprises subsequently suffer from negative economic externalities. A centrifugal force that weakens agglomeration is thus produced [
16]. The game between the centripetal and centrifugal forces brings about the formation and structural transition of urban systems. The urban may be capable of yielding multiple equilibria, and make its structure polycentric, monocentric or dispersed patterns under the influence of different centripetal and centrifugal forces [
15].
Most large cities in developed countries are polycentric and are undergoing a process of employment decentralization [
17,
18]. Geographers and economists have reached a consensus on the phenomenon of employment decentralization in large international cities, but there is still controversy about how decentralized employment will be redistributed in spatial terms after the suburbanization stage [
19,
20,
21]. Some scholars raised a generalized dispersion hypothesis, they believed that with the development of transport and telecommunication technology, physical proximity is no longer an obstacle to business communication and that will make agglomeration economies less important [
18,
22]. On the contrary, others argued that transport and telecommunications would expand the spatial domain where external benefits are exhibited, importance of geographical proximity has not decreased [
17,
18,
23]. In this context, most activities continued to need face-to-face contacts frequently, and the decentralized employment tending to concentrate in the certain locations and forming subcenters outside [
17,
24]. This viewpoint has obtained universal approval by scholars.
An interesting phenomenon is that the spatial structural characteristics of market-oriented Chinese metropolises are not completely the same as those of foreign cities. Studies have shown that China’s metropolitan areas, such as Beijing, Shanghai, Guangzhou and Shenzhen, gained new employment subcenters outside of the central business district between 2004 and 2008 [
25,
26,
27,
28,
29], yet strangely, employment still continuously concentrated in the city center, and the monocentric urban spatial structure still dominated in Chinese cities. Before the 1980s, urban spatial development was derived from the order of priority for economic development instead of through land rent adjustment. After the Reform and Opening up, China transformed into a market-oriented economy. City lands were developed and utilized through market competition as manufacturers and individuals’ pursued benefit maximization [
30]. However, normative plans and policies still have a critical effect on shaping the urban employment spatial structure in China. At the same time, China’s urban center employment density still shows a major gap compared to New York, Hong Kong, Tokyo and other international metropolises according to the International Urbanized Area Analysis and Data Product [
31]. The central business district can, therefore, accumulate more employment in the future.
Is employment in China’s cities centripetal agglomerate or decentralized? If employment decentralization occurred, whether the employment spatial structure moves towards polycentricity or scatteration? These issues in China has not reached consensus and still need further research, but some hypotheses are proposed according to the existing results. Firstly, as stated above, most large cities in developed countries are undergoing a process of employment decentralization. Although Chinese megacities experienced centripetal development between 2004 and 2008, the urban center was aggregative as employment concentrated. Therefore, the decentralization hypothesis is proposed, stating that employment will move out of the city centers over time. Secondly, in Chinese megacities, there are many the plans and policies targeted at polycentric development. The firms will concentrated in new districts or towns because of cities’ administrative power. At the same time, the geographical proximity is still essential. The upgrade industrial structure makes the industries tend to be concentrated together in certain locations in order to benefit from agglomeration economies. So we hypothesize that the decentralized employment will concentrate together in subcenter and the megacities will become more polycentric. With the gradual publication of the third economic census data, it is important to test the hypotheses concerning the urban spatial structure and explore the difference in urban spatial structure between China and other developed countries. For this reason, this paper aims to investigate whether employment decentralization happened and intends to contribute the polycentricity–scatteration debate concerning the evolving urban spatial structure in Beijing Metropolitan Area between 2004 and 2013.
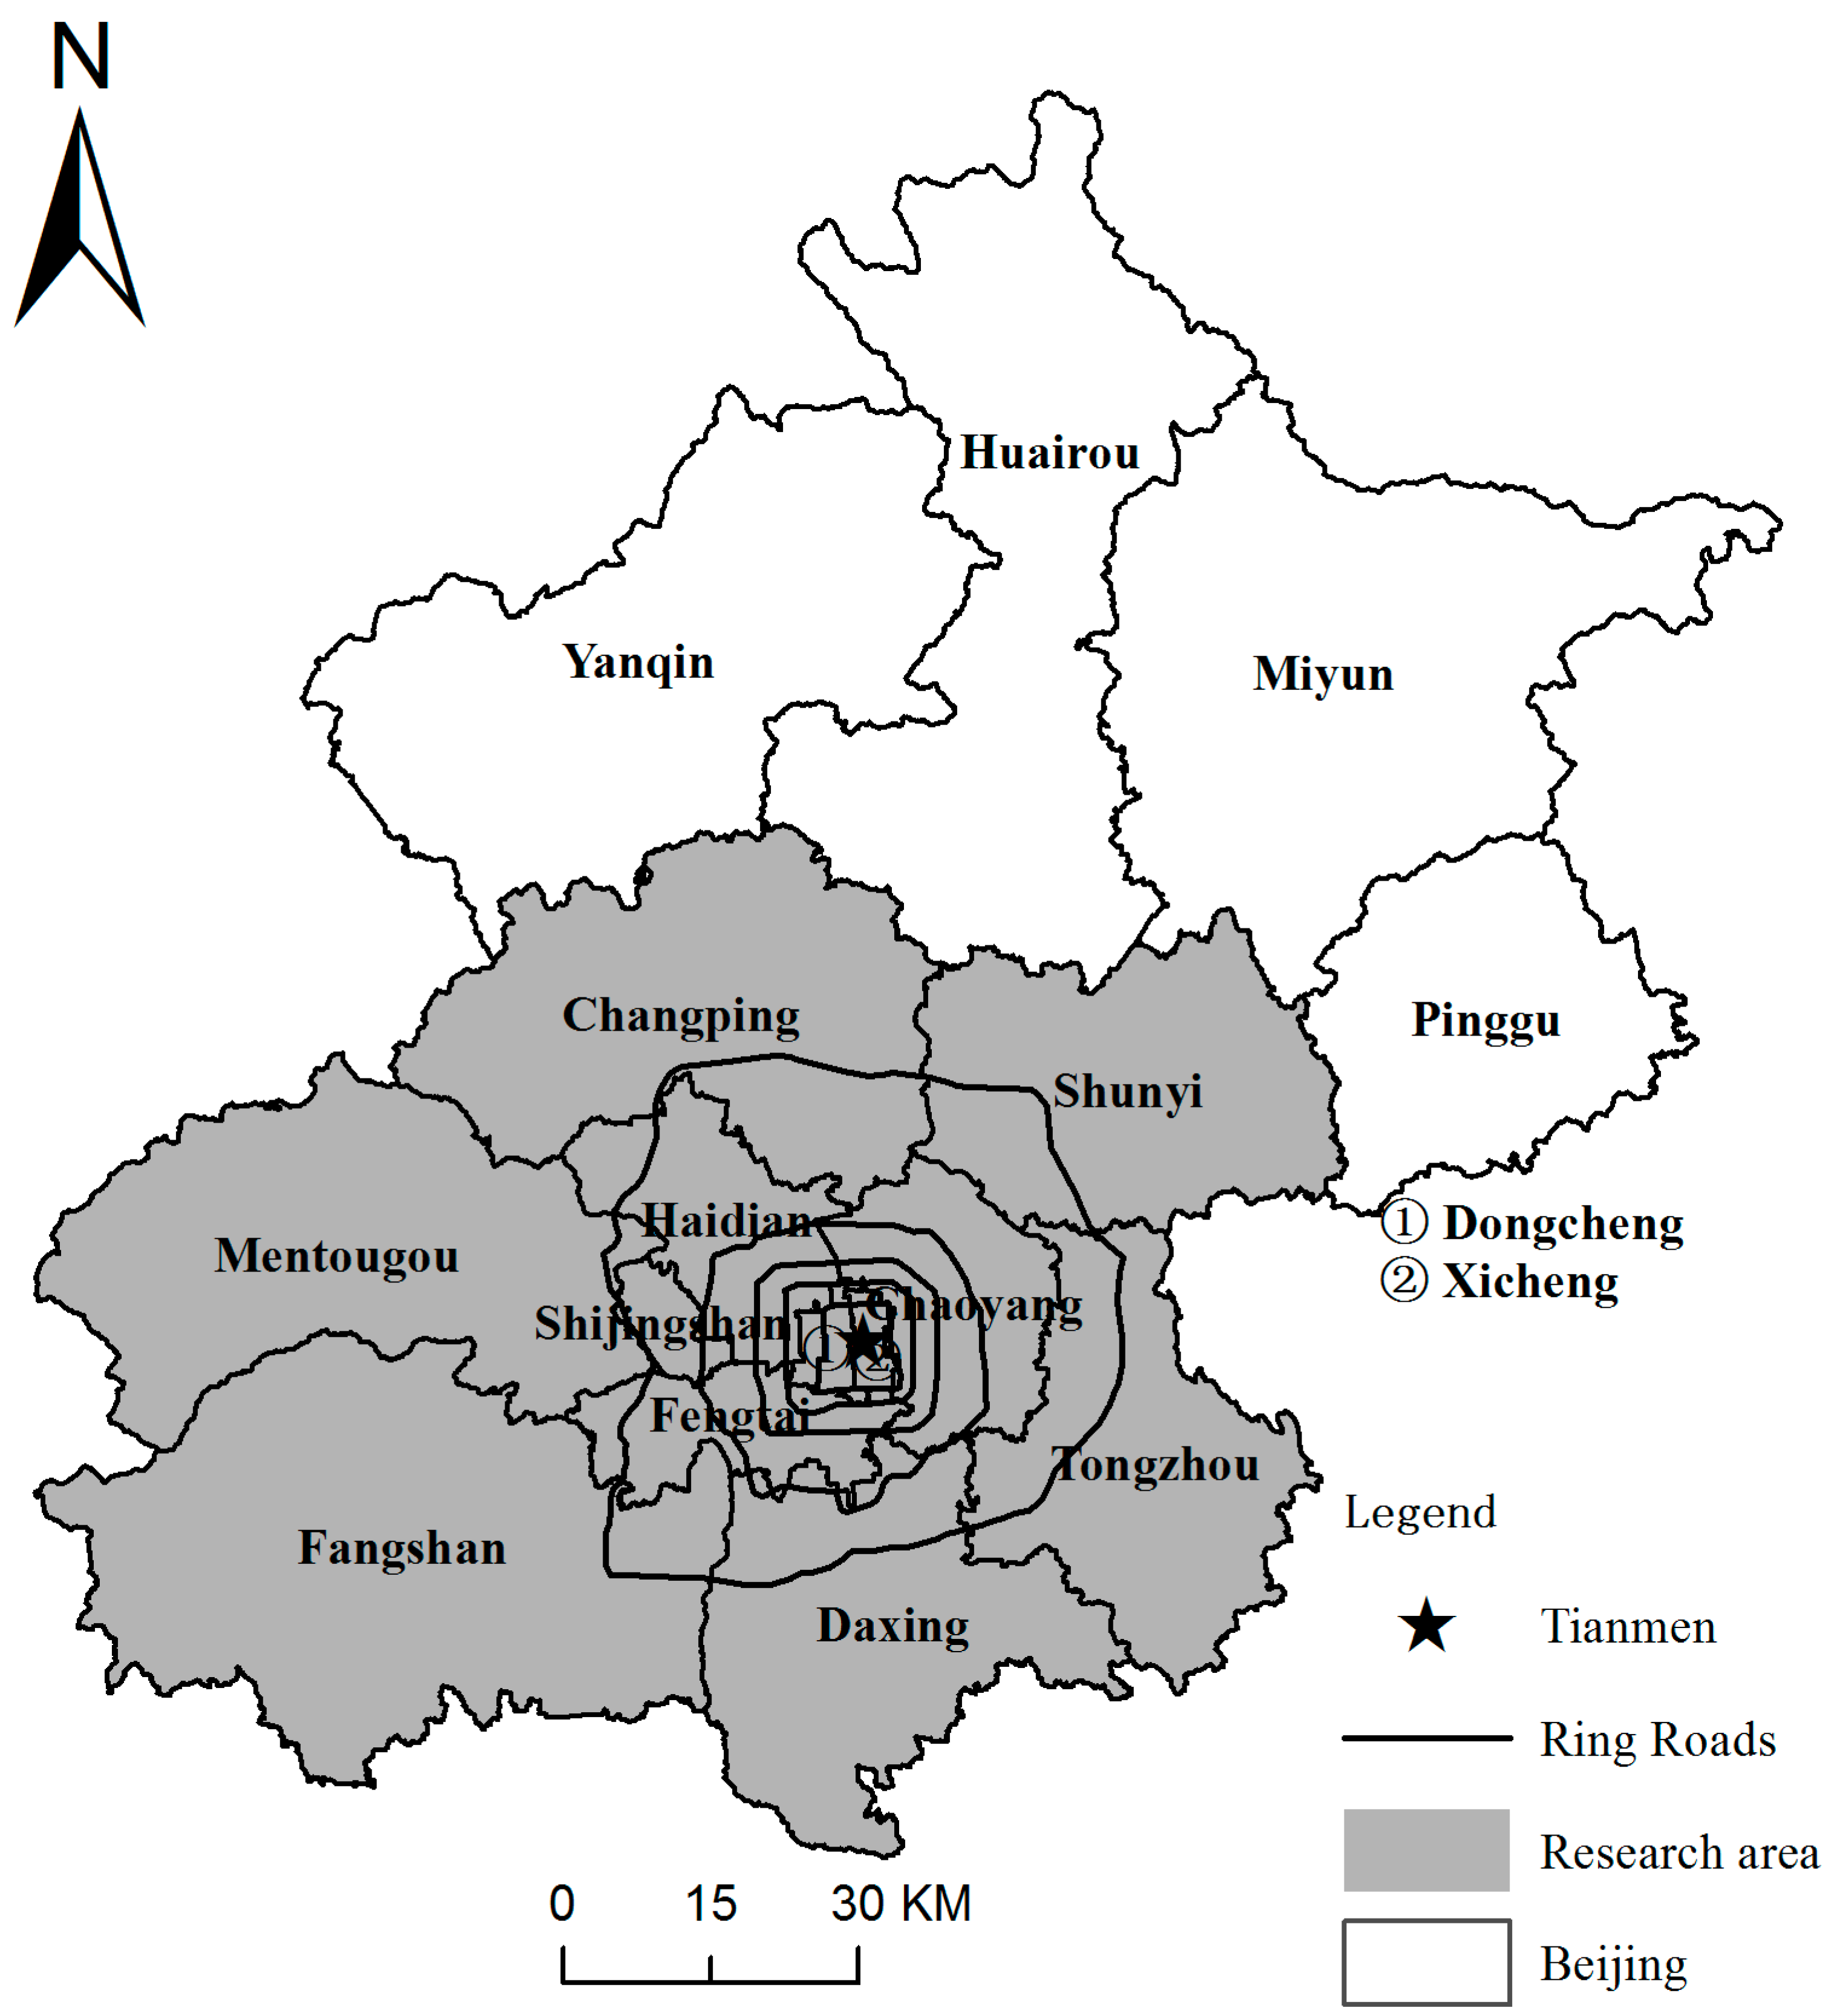
This article uses the Beijing Metropolitan Areas as a case for the following reasons: first, Beijing, the country’s capital and economic center, is one of the most crowded cities, and its secondary and tertiary industry employment population in 2013 reached 11.11 million. Traffic congestion, environmental degradation and other forms of urban disease limit the development of the city and affect the daily lives of residents [
32]. The reasonless urban spatial structure is considered to be an important cause of urban diseases [
33]. Second, since the Reform and Opening up, Beijing has issued four comprehensive city plans. Each of these plans, particularly the most recent two, targeted the formation of a polycentric development pattern. How the urban spatial structure changes under urban normative plans, national policies and mark mechanisms deserves scholars’ full attention.
This paper is organized as follows:
Section 2 describes the research area, data origin and method, while
Section 3 provides a general description of whether employment is decentralized or not and identifies the subcenters in Beijing for all three economic censuses. Using monocentric and polycentric density models,
Section 3 also examines the subcenters’ ability to explain the entire employment density distribution of the city and explores changes to the urban spatial structure after the suburbanization stage. The conclusions are presented in
Section 4.
3. Results and Analysis
3.1. Growth and Decentralization of Employment in the Beijing Metropolitan Area
According to the descriptive statistics of employment in the Beijing Metropolitan Area (
Table 2), we can see that the total employment grew from 2004 to 2013. The average employment of each sub-district in 2004, 2008 and 2013 was 26,955, 31,596 and 42,594 respectively, and the growth rate of employed persons between the two periods (2004–2008 and 2008–2013) accelerated (average annual growth rate of 4.05% and 6.16%, respectively). The reason for this growth may be that for economic development, the Beijing Metropolitan Area has obvious advantages over the surrounding area, so its internal employment opportunities and higher wage levels attract a large influx of migrant workers [
27]. Therefore, the Beijing Metropolitan Area is still at the stage of continuing to attract a migrant employed population, and the sustained and rapid growth of employment is an important feature in its future. The standard deviation of the employed population and the employment density gradually increased from 2004 to 2013, which indicates that the spatial heterogeneity between different sub-districts gradually increased and that the phenomenon of employment polarization strengthened. Therefore, under the common influence of these factors, there was a major change in the spatial structure of the Beijing Metropolitan Area.
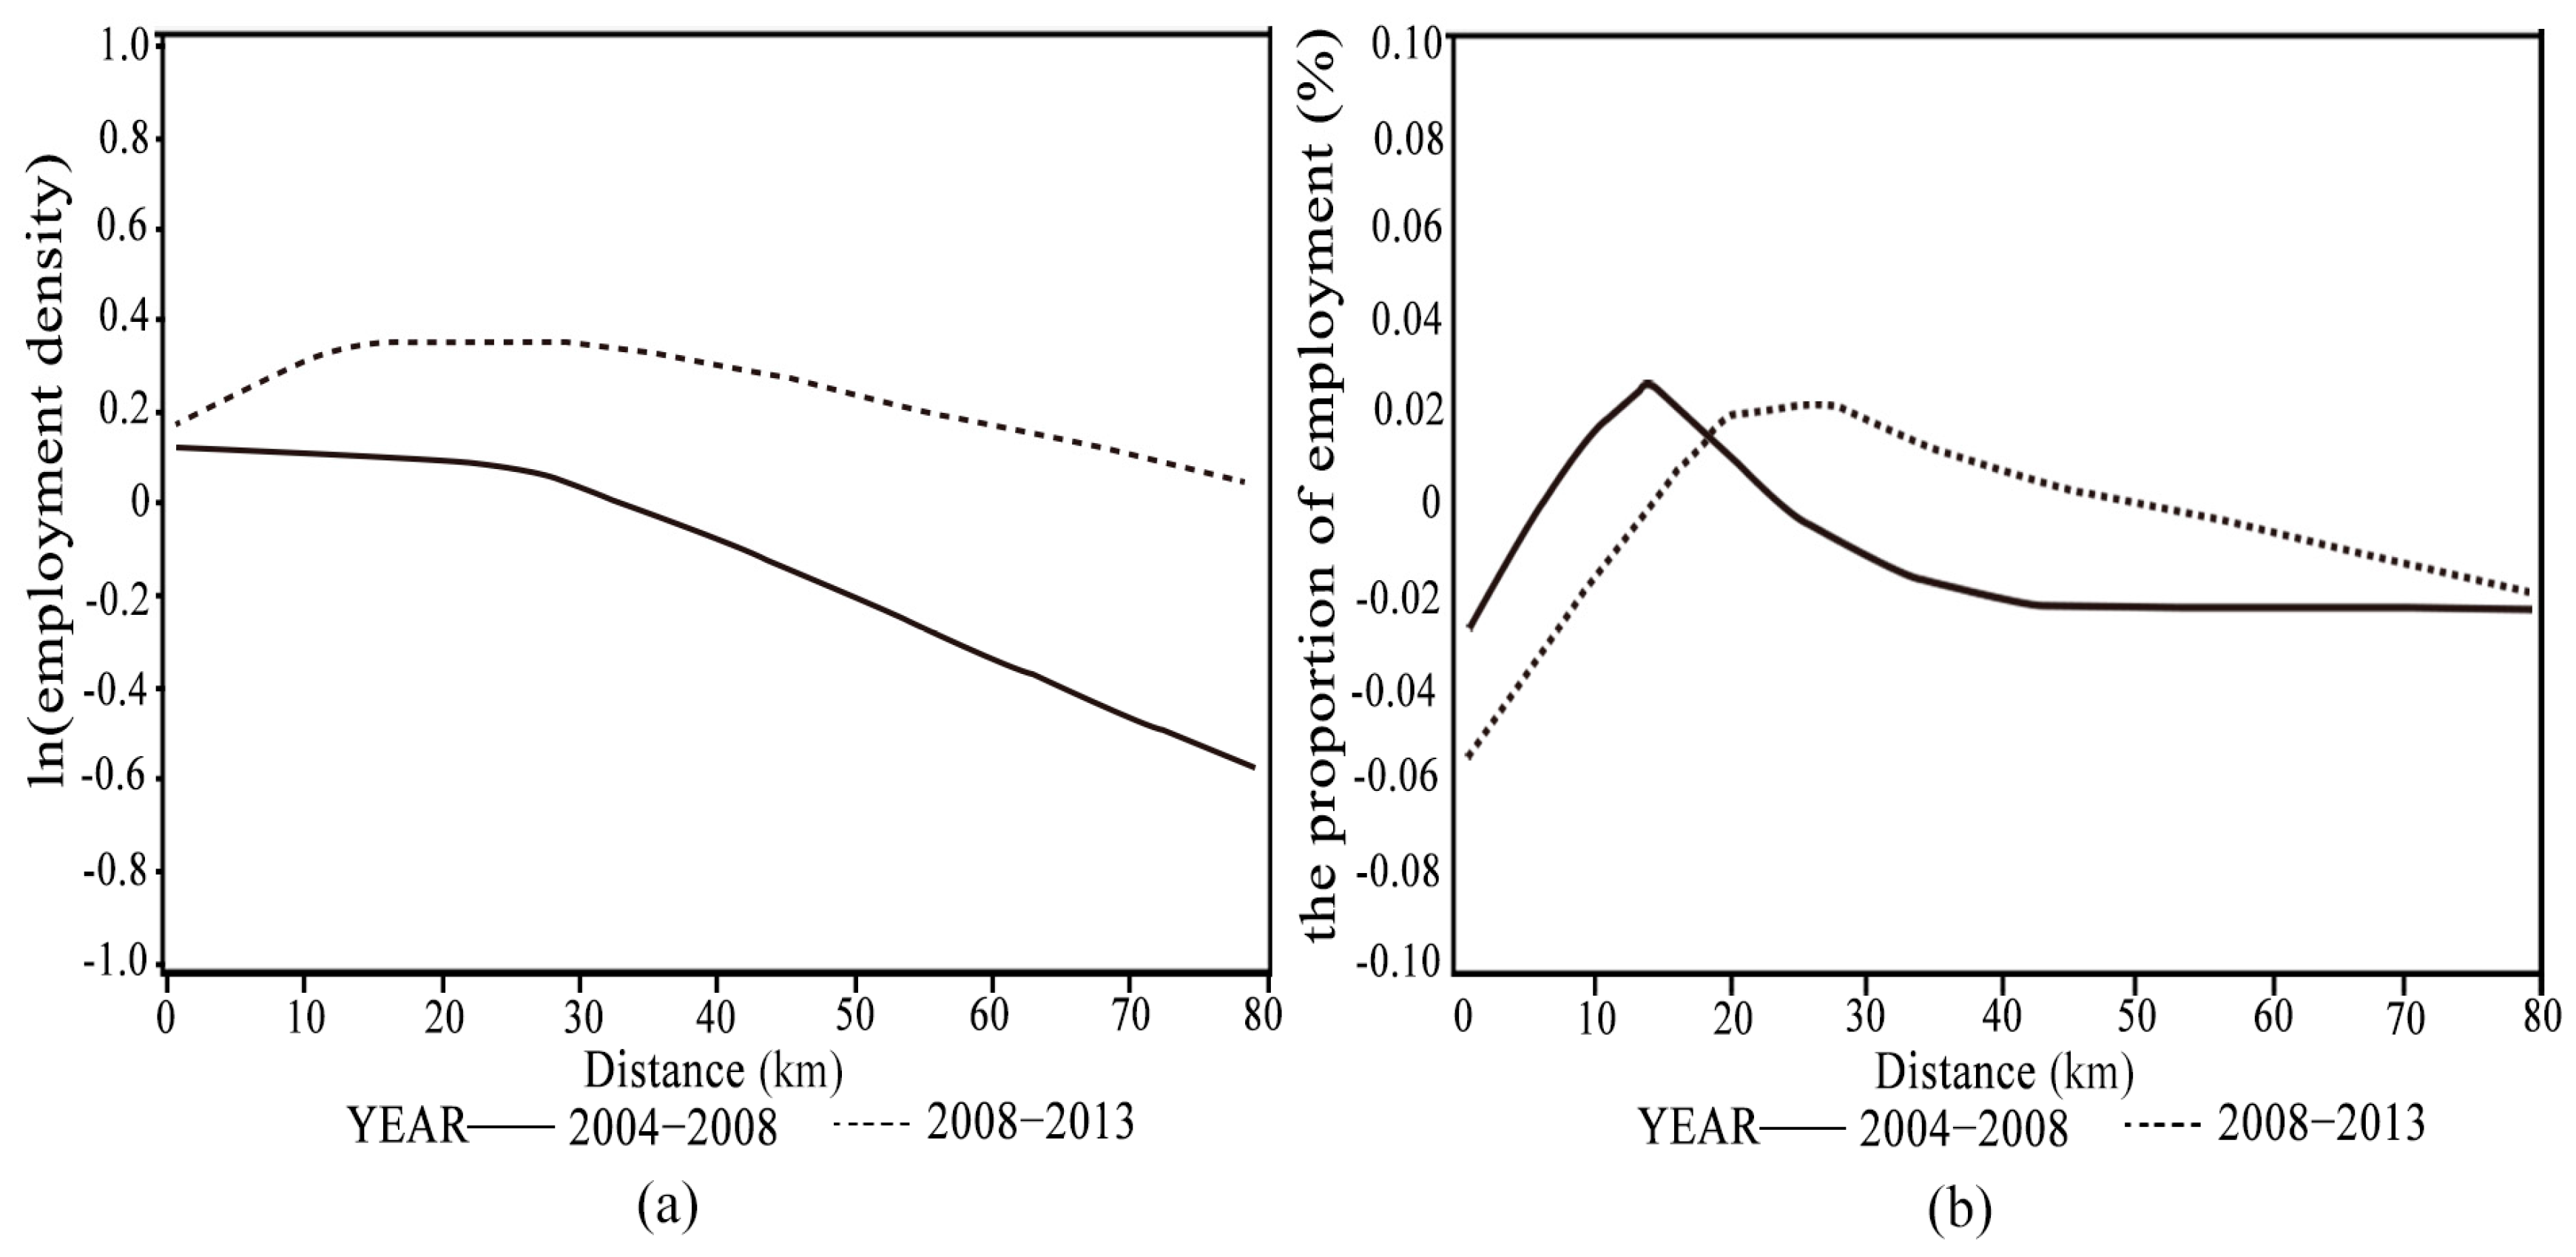
In this research, the non-parametric method was used to analyze the changes in employment in the Beijing Metropolitan Area. In the model, the change in the logarithm of employment density and the change in the proportion of the employed population were the dependent variables, and the distance to the main center of the city (Tiananmen) was the independent variable (
Figure 2).
The changes in the logarithm of employment density for different streets (towns) reflected the change in the absolute scale of employment. From a characteristic point of view, the employment density in streets (towns) within 30 km of Tiananmen increased gradually and that of other streets (towns) outside of 30 km decreased between 2004 and 2008. In addition to new employment migration, the centripetal agglomeration effect of employment in the urban suburbs was the main factor affecting the spatial changes in employment distribution. During 2008–2013, the employment density of all streets (towns) in the Beijing Metropolitan Area entered into a stage of steady growth. In addition, the change in the spatial structure of employment was mainly affected by the unbalanced spatial redistribution of the newly employed population in the Beijing Metropolitan Area.
The changes in the proportion of the employed population for different streets (towns) reflected the change in the relative scale of employment. In general, from the center to the outskirts, the relative scale of employment first increased and then decreased. From the relative scale of employment, there was obvious decentralization in the Beijing Metropolitan Area. The scope at which the streets’ proportion of total employment decreased changed from 6 km to 15 km in two periods. The scope of the relative growth of the employed population between 2004 and 2008 was 6 to 25 km away from the city center and changed to 15 to 50 km from the city center between 2008 and 2013. The scope at which the proportion of employment increases expanded to the periphery of the metropolitan area. It can be seen that from 2004 to 2008, the process of decentralization and central agglomeration occurred simultaneously, but after 2008, the process of decentralization played the critical role in the Beijing Metropolitan Area.
In summary, unlike the hollowing of residential populations [
43], the absolute size of urban employment in central Beijing did not decline; on the contrary, it gathered more employment. However, consistent with other international cities, the process of decentralization steadily continues to exist, and its range has expanded due to the proportion of the employed population.
3.2. Subcenters and Their Spatial Change
During the period of 2004–2013, employment in the Beijing Metropolitan Area was in a process of sustainable growth, and in the sub-district, the spatial segregation of employment expanded and the process of decentralization continued. These trends will inevitably lead to changes in the spatial structure of urban employment. To analyze the changes in the spatial structure of urban employment, a combination of the cut-off and non-parametric approaches was adopted as a new “two phase” method to identify the subcenters.
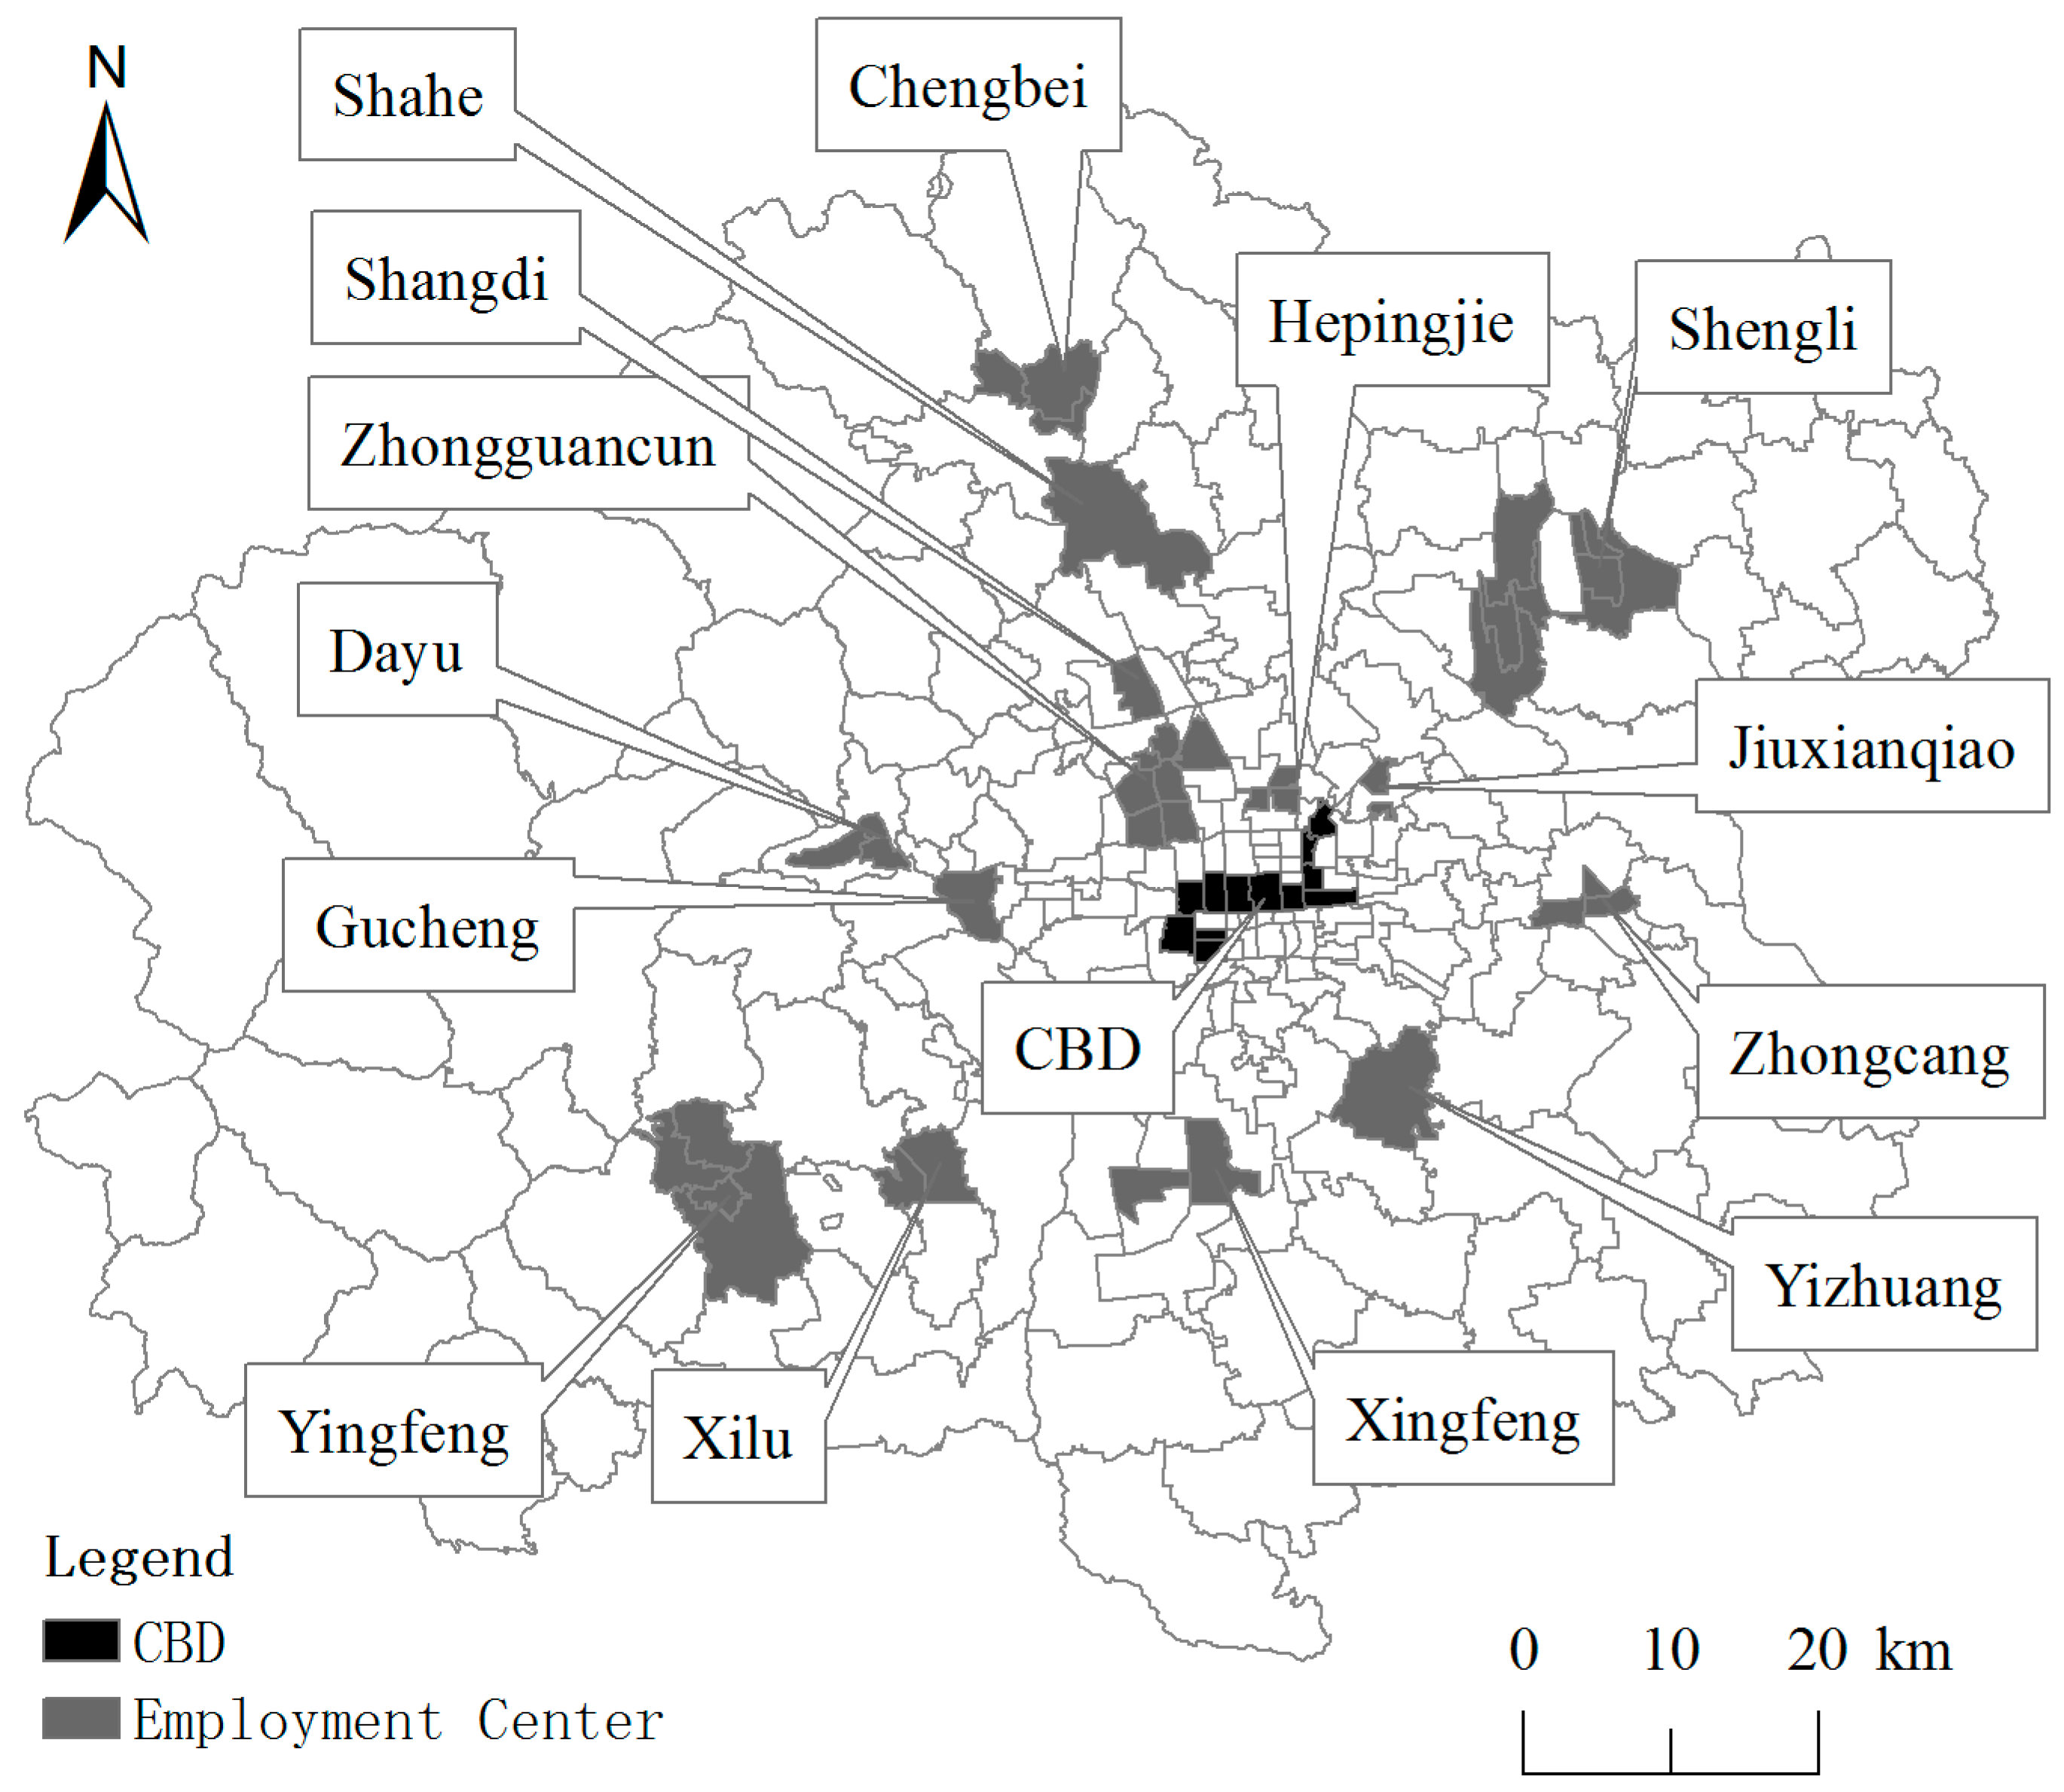
During the three economic censuses, the number of subcenters in the Beijing Metropolitan Area was 14, 16 and 17; a total of three new subcenters emerged (as shown in
Figure 3,
Figure 4 and
Figure 5). The employment subcenters can be divided into three categories by their spatial distribution:
The first category is the center streets of the peripheral counties in Beijing, such as Xingfeng Street (Daxing District), Yingfeng Street and Xi Lu Street (Fangshan District), Shengli Street (Shunyi District), Gucheng Street (Shijingshan District), Dayu Street (Mentougou District), Zhongcang Street (Tongzhou District), Chenbei Street (Changping District). These subcenters are new districts/towns outside of the original urban cores. Their density is higher than that in the surrounding areas, and their emergence and development are strongly affected by normative plans and policies. As key areas for future industry and employment development, they have an important impact on the spatial structure of employment in the Beijing Metropolitan Area.
The second category relies on the development of high-tech industrial parks, such as Zhongguancun Street (Haidian District), Shangdi Street (Haidian District), Jiuxianqiao Street (Chaoyang District), Yizhuang (Daxing District), Shahe (Changping District) and Donggaodi Street (Fengtai District). Among these, Zhongguancun Street, Shangdi Street and Jiuxianqiao Street hold important science and electronic information industry parks. Yizhuang is the location of the Beijing economic-technological development area. Donggaodi Street relies on the recent development of an advanced astronautic city in Beijing. The third category is the traditional commercial center of Beijing, such as Hepingjie Street, Yangfangdian Street and Dongtiejiangying Street.
It can be seen that the original employment subcenters have had a stable existence. Over the ten years, there have been three additional employment subcenters added: (1) From 2004 to 2008, as a commercial district, the employment population of new two subcenters (Yangfandian Street and Dongtiejiangying Street, which are located between the Fourth Ring and the Fifth Ring Road) was growing rapidly, and its influence on the periphery gradually increased. (2) From 2008 to 2013, the additional Donggaodi Street was relying on the recent development of the advanced astronautic city in Beijing.
Judging from the proportion of the employed population in each center (
Table 3), the employment of all centers (main center and subcenters) in the Beijing Metropolitan Area increased from 49.52% to 53.81%. The clustering toward employment centers was one of the important features.
Jinrongjie Street (Xichegn District) and CBD in Chaoyang District formed the main center; it had the largest employment compared to other centers, but its proportion decreased. In contrast, the employment proportion of the subcenters increased. Therefore, the decline in the main center and the rise in subcenters are the other important features of the Beijing Metropolitan Area. It appears that after decentralization, employment in the Beijing Metropolitan Area displayed a dispersed agglomeration structure rather than a generalized dispersion. In addition, the spatial structure of employment gradually developed toward a polycentric structure.
Among those subcenters, Zhongguancun Street was the largest; the second largest subcenter was Shengli Street (Shunyi District), which developed due to Beijing Airport. Yizhuang, as an important industrial park and manufacturing base, gradually became the third employment subcenter because of its growth in the number of workers.
3.3. Estimation of the Monocentric Density Function
The Beijing Metropolitan Area has a double main center urban structure under the influence of the Imperial Palace, which is also known as the Forbidden City. Jinrongjie Street in Xicheng District and the new CBD in Chaoyang District are the two main centers and have higher employment density than the others. Based on the study of relevant scholars, this paper took Tiananmen as the main center of the Beijing Metropolitan Area in the urban density functions [
27].
Table 4 lists the results of the monocentric density function, which were estimated using the ordinary least squares method (OLS).
From the monocentric density function in the Beijing Metropolitan Area (
Table 4), we found that both the intercept
and the coefficient of the distance to Tiananmen (
b) were statistically significant at a 99% confidence level, and the adjusted
R2 for the various years were all approximately 0.7. These results mean that it is reasonable to use the negative exponential function to explain employment distribution in the Beijing Metropolitan Area.
The increase in the adjusted R2 meant that the monocentric urban structure could explain the whole employment distribution. The increase of the intercept and the coefficient (b) for various years showed that the employment density of the employment central area increased, as did the regional density gradient. The employment density was still in the process of continuous growth in the urban center, the employment pattern in the whole Beijing Metropolitan Area was still at the central agglomeration stage and the employment distribution became more concentrated as time passed. This was slightly different from the previous result. However, the regional density gradient’s growing strength weakened, so the central agglomeration of employment in the Beijing Metropolitan Area showed a reduced trend.
The results show that the negative exponential function was useful in analyzing employment distribution. To identify features in different ring zones, we varied the limits of the research area to the different ring zones. When limiting the research area to the area encircled by the Second Ring Road, the monocentric model was not significant. When the research area extended to the area encircled by the Third and Fourth Ring Roads, the monocentric model became significant at the 90% confidence level, but the explanatory power was very low; when extending to the area encircled by the Fifth and Sixth Ring Roads, the monocentric model was highly significant at the 99% confidence level. The employment density within the Fourth Ring Road had no apparent decline away from Tiananmen. The area encircled by the Fourth Ring Road could be considered to be a high-density cluster because it has higher density than the outer suburban cluster. When limiting the research area to the area encircled by the Fifth and Sixth Ring Roads, the decrease in the coefficient of the distance to Tiananmen (b) showed that employment became more dispersed and decentralization occurred.
So considering both the change of intercept and the coefficient (b) in the different research areas, central agglomeration and decentralization occurred together in the Beijing Metropolitan Area between 2004 and 2013. The high-density cluster within the Fourth Ring Road zones was still absorbing employment and played a more important role in shaping the monocentric urban structure in the Beijing Metropolitan Area, but employment decentralized to the inner suburban area when local employment decentralization occurred.
3.4. Estimation of the Polycentric Density Function
Based on the previous analysis of the monocentric density function, the large Beijing Metropolitan Area, the high-density cluster within the Fourth Ring Road zones and the low-density area in the outer suburban area mean that the Beijing Metropolitan Area is a monocentric urban spatial structure, and the degree of fit for the monocentric density function increased. In the monocentric density function analysis, the author limited the research area in order to eliminate the effects of the low-density area in the outer suburbs and to find more interesting phenomenon. For the same reason, the central district of Beijing (six core districts) and Beijing Metropolitan Area were selected as the research area. This paper used a polycentric density function to analyze the changes in the urban spatial structure and the centers’ influence on non-central employment distribution.
In
Section 3.2, the author identified multiple employment centers of the Beijing Metropolitan Area in three different years. There was a main major urban center and a group of subcenters (between 14 and 17 in different years), including three new subcenters between 2004 and 2013. In this section, the author adopted a polycentric employment density function to describe the employment distribution. To describe the role of different centers on employment distribution, the employment centers identified in 2004 and 2013 were selected respectively as the baseline. The fit results for various years are shown in
Table 5 and
Table 6.
When taking the Beijing Metropolitan Area as the research area, all of the coefficients were significant in different years. The negative signs for b1 and b2 indicate that employment decreased with the distance to the centers. The employment centers influenced the non-central employment location outside of their borders. From a longitudinal point of view, the polycentric density functions showed the same trend when taking the subcenters identified in 2004 and 2013 as the baseline. The R2 of the polycentric function increased over time, showing that the Beijing Metropolitan Area became more polycentric over these ten years.
The main center’s gradient increased before 2008, but it remained unchanged after that. In the meantime, the main center’s significance increased over time. These patterns show that the main center continued to influence employment outside of the centers, but the growth rate of its structuring role slowed down in the Beijing Metropolitan Area. In addition, these results suggest that this role might decrease in the future. On the other hand, the increase in the subcenters’ gradient and significance verified that all of the subcenters, including the three new subcenters, played an increasingly important role in structuring the employment location outside of their borders. The spatial structure in the Beijing Metropolitan Area can be described as all centers aggregation between 2004 and 2013.
When limiting the research area to the central district, all of the coefficients were significant, and the gradients b1 and b2 were negative in all years, as they were in the Beijing Metropolitan Area. From a longitudinal point of view, the R2 of the polycentric function decreased over time, showing that the central district of Beijing became less polycentric and more scattered over these ten years. The main center’s gradient and significance showed a decreasing trend, so the main center’s role in structuring employment distribution weakened over time in the central district of Beijing.
Taking the subcenters identified in 2004 (columns 1–3 in
Table 6) as the baseline, the subcenters’ gradient increased before 2008 but remained unchanged after that, and its significance increased over time. By contrast, taking the subcenters identified in 2013 (columns 4–6 in
Table 6) as the baseline, the subcenters’ gradient and significance increased continuously. Comparing the differences in these, the growth of the old subcenters’ role in structuring the employment location outside of their borders might weaken in the future, but the three new subcenters mean that all subcenters played an increasingly important role for non-central employment. The spatial structure in the central district of Beijing can be described as subcenter agglomeration between 2004 and 2013.
The results showed that the scope of the research area affected the spatial structure of urban employment and that the Beijing Metropolitan Area and the central district had different spatial structure trends. The subcenters’ role in structuring employment distribution strengthened over time in all research areas. However, the main center’s influence showed different results as the scope of the study area changed. Taking the Beijing Metropolitan Area as the research area, the main high-density cluster and the low-density area in the outer suburbs showed a central agglomeration pattern, and the main center’s influence on employment distribution strengthened. When limiting the research area to the central district, employment decentralized to the edge of the central district, and its role in structuring employment weakened over time.
4. Discussion and Conclusions
Although most large cities in developed countries decentralize and have polycentric or even dispersed employment patterns, a study of the long-term serial variation in the spatial structure of Chinese cities is still missing. Based on the employment data of three economic censuses, the spatial structure and its evolution in the Beijing Metropolitan Area from 2004 to 2013 were analyzed. Taking China’s major metropolitan area as an example, this paper not only provides a general description of how employment decentralized or concentrated over a ten-year period but also studies the polycentricity-scatteration discussion. The non-parametric method and the threshold value-setting method were used to identify the employment subcenters, and monocentric and polycentric density functions were used to show the influence of the different types of centers on the location of employment external to these centers. This paper also explored the urban spatial structural change after the suburbanization stage. The conclusions are as follows:
(1) The centripetal agglomeration effect of employment in the urban suburbs and new migrant employment outside of the Beijing Metropolitan Area were the two main factors affecting the spatial changes in employment distribution, and the latter’s influence increased as time passed. Beijing Metropolitan Area’s employment opportunities and higher wage levels attracted a large influx of migrant workers. These migrant workers were from other provinces in China and made the urban center overly aggregative. Because of the high housing price and rents, the new migrant workers might live in suburbs and exurbs. All of these made traffic more congested and the enterprises might decentralize to decrease the communication costs. Consistent with cities outside of China, the process of decentralization persisted, and its scope expanded due to the proportion of the employed population. The Beijing Metropolitan Area was polycentric for the three economic censuses, and the number of subcenters increased, relying on the central streets of the peripheral counties, high-tech industrial parks and traditional commercial centers.
(2) The Beijing Metropolitan Area continued to have very strong monocentric characteristics, and the monocentric density function explained almost 70% of its employment distribution. However, limiting the research area to within the Fifth Ring Road, the capacity of the monocentric model to explain the employment distribution was less than 50%, and the model’s degree of fit decreased. Considering both the change of intercept and the coefficient (b) in different research areas, in contrast with the ongoing decentralization of employment seen in foreign cities, central agglomeration and decentralization occurred concurrently in the Beijing Metropolitan Area between 2004 and 2013. The very large high-density cluster within the Fourth Ring Road zones and the low-density area in the outer suburbs together shaped the monocentric urban structure. This large cluster will accumulate more employment in the future, but the more rapid employment growth in the inner suburban area meant that local employment decentralization occurred in limited spatial domain.
(3) The role of all centers in structuring the employment location outside of their borders increased in the Beijing Metropolitan Area. Its spatial structure can be described as all centers aggregation (
Table 1) between 2004 and 2013. However, the spatial structure in the central district of Beijing took the form of subcenter agglomeration. The subcenters’ role in shaping urban structure in the central district of Beijing increased, and the main center’s role decreased. Three new employment subcenters were created during these ten years, and the increase of the subcenters’ gradient and significance verify that the subcenters had a strong influence on the employment outside of their borders. The spatial structure became more polycentric in the Beijing Metropolitan Area, while in the central district, the spatial structure was polycentric but became more scattered over time. As a result, the polycentric model still prevailed in the Beijing Metropolitan Area; moreover, it had a critical influence on employment distribution.
Summing up the basic results, similar to metropolitan areas in other countries, the spatial structure of Beijing Metropolitan Area has two distinct trends: decentralization and polycentricity. The employment spatial structure is the outcome of both the centripetal force and centrifugal force. Diseconomies of agglomeration, such as high rents, the congestion of transportation and public services, increase the centrifugal force in the city main center, so lots of firms decentralize outside of the urban main center. However, firms in subcenter can enjoy agglomeration economies, such as labour market pooling, knowledge spillovers and input sharing, and avoid the agglomeration diseconomies in the urban main center, so the decentralized employment concentrate in subcenters. Market forces and the government all play important roles in constructing urban form [
44]. Under the market economy condition, each firm selects their location by pursuing their own benefit maximization. Market forces, instead of administrative allocations, started to affect employment distribution after China’s Reform and Opening up. The land market has forced firms to move to the suburbs and promoted the emergence of subcenters [
44]. However, not all firms benefit equally from agglomeration [
18]. Because of the upgrading of industrial structure in Beijing, the knowledge based manufacturing and service gradually dominate the economy in Beijing [
45]. These industries tend to be concentrated together in certain locations in order to benefit from agglomeration. The government still plays an important role in constructing urban form [
26,
27] by comprehensive city plans and other polycentric policies. The construction of infrastructure in new towns outside the urban core attracts more firms and makes subcenters emerge. But the effect of government’s force on promoting urban polycentricity are not as strong as we think [
46]. The subcenter in exurbs develops slowly and the most decentralized employment are only distributed in suburbs [
27,
45]. We can see that the government’s force in shaping urban structure may decrease and the market forces may be more important than before.
However, employment still central agglomerated to the central district from the exurbs, as found in other research results for the Beijing Metropolitan Area from 2004 to 2008. There may be many different reasons driving this phenomenon: China’s urban spatial structure research addresses a much greater area than that addressing modern cities in Europe and the United States due to China’s administrative division. Sub-districts are taken as the spatial research unit, meaning that there are many low-density sub-districts in the border areas of cities. The municipal government planned to development new towns or districts in exurbs and made that form the new subcenters in cities. But these new towns or districts develops slowly and the employment may centripetal agglomerated to central district. Limiting the research area in order to eliminate the effects of the low-density areas, the same employment phenomenon seen in foreign cities can be seen in our results. Therefore, choosing the appropriate research area is the first important step in the study of urban spatial structure in China. Decentralization and polycentricity also happened in Chinese cities, but the employment decentralized to suburbs and some suburbs subcenter formed. Furthermore, the development of subcenter in exurbs (urban new towns) does not meet the expectations of urban plans and other policies, the employment in exurbs may centripetal agglomerated to central district. In order to realize the polycentric development in Chinese megacities, it is suggested that the municipal government should comply with the urban development trend, formulate policies to promote the development of suburbs subcenter nowadays and do much more to develop the subcenter in exurbs in the future.


