Exploring the Trends in Nitrogen Input and Nitrogen Use Efficiency for Agricultural Sustainability

National Key Laboratory of Crop Genetic Improvement, MOA Key Laboratory of Crop Ecophysiology and Farming System in the Middle Reaches of the Yangtze River, College of Plant Science and Technology, Huazhong Agricultural University, Wuhan 430070, China
*
Author to whom correspondence should be addressed.
Sustainability 2017, 9(10), 1905; https://doi.org/10.3390/su9101905
Submission received: 21 July 2017
/
Revised: 20 October 2017
/
Accepted: 20 October 2017
/
Published: 23 October 2017
(This article belongs to the Section Sustainable Agriculture)
Abstract
:Crop production is threatened by the increased nitrogen (N) input and declining N use efficiency (NUE). Information on total N input from planted seeds/tubers, atmospheric deposition, irrigation water, crop residues, animal manure, biological N fixation, and synthetic N fertilizer and NUE based on these N inputs in China’s crop production is limited. We calculated the amount of various N inputs and NUE based on 117 primary crops from 1961 to 2012 in China. The total N input increased from 8.0 Mt in 1961 to 60.8 Mt in 2012. The substantial shift in the types of N input was observed from animal manure and biological N fixation toward synthetic N fertilizer. Animal manure plus biological N fixation and synthetic N fertilizer accounted for 70.9% and 6.8% of total N input in 1961, respectively, and these values were changed to 15.7% and 74.0% in 2012. Partial factor productivity of applied synthetic N and crop’s recovery efficiency of total N input declined substantially during the study period. These results suggest that it is essential to reduce synthetic N input and increase NUE with improved crop management practices and N-efficient crop varieties to achieve the sustainability of crop production in China.
1. Introduction
Producing sufficient food in a sustainable manner to meet the growing global demand is one of the greatest challenges facing mankind in the 21st century [1]. As the world’s most populous nation, China has spared no effort in pursuing national food security as a means of advancing economic development and maintaining social stability [2]. Crop production in China has increased by nearly five times over the past 50 years [3], which has created the so-called “Miracle in China” with approximately 5% of the planet’s water resources and 7% of its arable land feeding 22% of the global population [2]. This was mainly achieved thanks to crop genetic improvement, increased application of synthetic fertilizers and pesticides, and improved irrigation system, among which increased application of synthetic nitrogen (N) fertilizer has been by far the most important [1,4,5].
There has been a dramatic increase worldwide in the application of synthetic N fertilizer since the 1960s, and this has been particularly the case in China [6]. To maximize crop yield, farmers often apply more mineral and organic N than the crop requires [7]. However, numerous adverse environmental effects on freshwater and terrestrial resources, climate, and air quality have accompanied the over-application of synthetic N fertilizer to croplands [5,8]. Excessive use of N may not only cause N losses [9], which further induced soil acidification [10], water pollution [2], and increased emissions of nitrous oxide (N2O) into the atmosphere [11], but also reduce crop yield due to lodging [12,13]. Further increases in application of N to croplands are unlikely to be effective as a method for increasing crop yield, especially in China [1,14]. Moreover, field experiments consistently indicated that the proportion of added N that is accumulated in crops and the yield increase from N application tends to decline with increasing N input [4,6].
Many studies on the N budget have been conducted to improve the general understanding of the N cycle, environmental consequences of increased N application to croplands, and possible strategies for achieving sustainable intensification of crop production at global [15,16] or national scale [8,17]. The ecosystem of crop production is threatened by the increased N input and declining N use efficiency (NUE) in China, and exploring the trends in various N inputs to the croplands and NUE in China’s crop production is vital for agricultural sustainability. Generally, N inputs from planted seeds/tubers, atmospheric deposition, irrigation water, crop residues, animal manure, biological N fixation, and synthetic N fertilizer are considered the major sources of total N inputs to cropland. However, previous studies only included some of those N sources to estimate the total N input to cropland [18,19,20]. Furthermore, crop production and synthetic N fertilizer have increased substantially in China during the past decades [2], but the investigation on the partial factor productivity of applied synthetic N fertilizer (PFPN) is limited in China. The harvest index has been increased dramatically with the crop breeding [21]. Whether the N harvest index (NHI) was also improved remains unknown.
For that purpose, we evaluated annual changes in the types and amounts of N input and determined how efficiently N has been used for crop production in China. We calculated the amount of various N inputs including planted seeds/tubers, atmospheric deposition, irrigation water, crop residues, animal manure, biological N fixation, and synthetic N fertilizer to the croplands and the NUE of crop production system based on 117 primary crops from 1961 to 2012 in China. Notably, compared with other studies [18,19,20], this is the first study to estimate the total N input and NUE by including all seven major N resources to croplands in China’s crop production. Moreover, the Chinese government has issued a policy to reduce the use of fertilizers and pesticides in agriculture recently [22]. This study provides an overview of the total N input and NUE during the past five decades, which could imply ways to reduce the N input with the goal of ensuring the long-term sustainability of crop production in China. The objectives of the present study are therefore as follows: (1) to analyze the trends in the types and amounts of N inputs in China’s crop production system from 1961 to 2012; (2) to determine how effectively N has been used within this system during the study period; and (3) to evaluate trend in N surplus, NUE, and its implication on the environment consequences.
2. Materials and Methods
Our analysis focuses on calculating the total N input and NUE for the production of agricultural crops per year from 1961 to 2012 based on the available data. Total N input to croplands was defined as the N returns to croplands in the forms of planted seeds/tubers, atmospheric deposition, irrigation water, recycling of crop residues, animal manure, symbiotic N fixation, and synthetic N fertilizer.
2.1. Categories of Total N Input
2.1.1. Planted Seeds/Tubers
Planted seeds/tubers have a minor N input that is relatively easy to quantify. The total seeding rates for more than 25 major crops in China were listed in the Food and Agriculture Organization of the United Nations Statistical Database (FAOSTAT) [23], which were multiplied by the average tissue N concentration of planted seeds/tubers [24] to calculate the N input in China’s crop production system during the investigation period. N input of planted seeds/tubers from 92 minor crops was ignored because of unavailable data on seeding rates [24]. The N contained in planted seeds/tubers was calculated only from 25 major crops due to the unavailability of data, which may contribute some uncertainties in N input, although the quantity was relatively small.
2.1.2. Atmospheric Deposition
Atmospheric N deposition results from emissions of reactive N species and their atmospheric transport, which reflects the footprint of local alterations to the N cycle. Globally, China is one of the heaviest N-deposition areas because of the extensive use of fossil fuels in industry and transportation, use of synthetic N fertilizer in agriculture, and expansion of intensive animal husbandry in recent decades [25]. Increased reactive N emissions have been the main cause of steadily increasing wet and dry deposition of N compounds to croplands in China.
Due to the data availability, estimating N deposition was divided into two durations. As reported previously [26], bulk N deposition increased with an average annual growth rate of 0.41 kg N ha−1 during the past several decades in China. This parameter was used to estimate N deposition from 1961 to 1979 in this study. Previous studies suggested that a relationship existed between N deposition and emissions [10]. Therefore, we used this relationship to estimate N deposition during 1980 to 2013 from gaseous N emission data. First, the emission rates of reduced N (NH4+/NH3) and oxidized N (NO3−/NOx) in China from 1980 to 2012 were collected from the Regional Emission inventory in Asia [27]. Next, we calculated the deposition/emission ratios for reduced N and oxidized N in China from Xi et al. [28]. The area-weighted average deposition/emission ratios of reduced and oxidized N in China were 0.63 and 0.29, respectively. The total atmospheric N deposition was calculated from the deposition of oxidized and reduced N compounds to croplands. The estimation of atmospheric N deposition is an important contributor to the uncertainties in N input. This is due to the scarcity of location-specific data in emission rates and large temporal variability in the measurement of emission rates.
2.1.3. Irrigation Water
Data on the total area equipped with irrigation in China’s crop production system were obtained from the FAOSTAT database [23]. Irrigation water always contains some N, and the average N concentration in irrigation water was 1.5 mg N kg−1 in China [29]. The annual input of N from irrigation water may be higher than the average value as described above in intensified systems such as double-cropped rice systems; however, it may be lower in the predominantly rainfed crops that receive only some supplementary irrigation, with an average water application of 9500 m3 ha−1 [30]. Therefore, the N input from irrigation per hectare was calculated as the product of the average irrigation water and the average N concentration in irrigation water. The estimation of N contained in irrigation water is another source of uncertainty in total N input. Irrigation water always contains some N, but its N concentrations may vary spatially and temporally, and it is difficult to assess the district- and period-specific N concentration data.
2.1.4. Recycling of Crop Residues
Recycling of crop residues, both directly (by leaving them to decay on field surfaces after the harvest or incorporating them into soil) and indirectly (by using them in mulches and composts or returning them to fields in animal waste), has been practiced throughout agricultural history and remains an essential part of modern field management [31]. The management of crop residues influences the nutrient-supplying power of soils in the short term (e.g., next growing season) and long term (e.g., several years later), particularly those residues containing N, phosphorus, potassium, sulfur, and micronutrients [29]. The residues of different crops also differ in their recycling factor and nutrient content. Thus, we estimated the crop residue production by multiplying crop yield data by residue/yield ratio dry weight basis for each crop (see Supplementary Materials, Table S1). N input from crop residue was estimated by multiplying the residue production by residue N concentrations and the recycling factor for each crop [29,32,33,34,35,36]. Estimation of N content in harvestable components and crop residues is important in studies such as this, but the tissue N concentration of each crop may vary locally according to crop variety, management practice, and environmental conditions [10]. Therefore, some uncertainties exist for the calculation of total crop N uptake and N input from recycling of crop residues.
2.1.5. Animal Manure
The N input from animal manure was calculated by estimating the manure production and accounting for the fraction added to croplands. Manure production was estimated by multiplying the number of livestock for each year by the average manure N production per head per year for each livestock type [18]. Annual N production of main livestock (donkeys, buffaloes, cattle, chickens, goats, horses, mules, pigs, and sheep) and the fraction of animal manure production available for croplands application were adopted from previous studies [18,37,38,39,40,41] and are presented in Table 1. The N input from animal manure is also a source of uncertainty in total N input because of the use of a fixed average annual N production of main livestock and a constant fraction of animal manure production available for croplands application over the years.
2.1.6. Biological N Fixation
The N input from biological N fixation was estimated by multiplying sowing area and its corresponding area-based N fixation coefficient [42]. The area-based N fixation coefficients of 117 primary crops are shown in Supplementary Materials (Table S2). Biological N fixation was estimated by using crop-specific area-based N fixation coefficients. However, these coefficients may be variable under different conditions including available N, soil moisture, vigor of crop stand, and other management practices, which influence N fixation.
2.1.7. Synthetic N Fertilizers
The annual data on synthetic N fertilizer application of different forms of fertilizers were obtained from the FAOSTAT database [23] for the entire study period. The data on annual synthetic N fertilizer consumption in FAOSTAT database [23] include the total use in agriculture; hence, these data are for the entire agricultural sector without any separation of permanent pasture from the crop production area. Moreover, the synthetic N fertilizer consumption was for the entire agricultural production sectors without any separation of permanent pasture from the crop production, and thus might be a source of uncertainty in total N input. As suggested by Lassaletta et al. [42], it was necessary but difficult to subtract the proportion of synthetic N fertilizer for grassland from the total amount used, and, therefore, we considered fertilizer use on grassland as negligible [43].
Due to the variability in measured N input and scattered data from various references and databases, there were some unavoidable uncertainties and limitations in our estimates of total N input. Therefore, a sensitivity analysis of various N input sources was conducted to identify the most sensitive parameters to the total N input to cropland. Each parameter (N input source) was changed by 10%, and the corresponding change in the total N input was measured. The change in total N input to each N input source was calculated annually, and the data presented in this study were the average of these values from each year.
2.2. NUE and Related Parameters
Total crop N uptake was calculated as the sum of N in harvestable components and in crop residues, which were estimated as the product of biomass of harvestable components and crop residues and their corresponding tissue N concentration [20]. Total crop production and sowing area were calculated according to the yearly harvest and sowing area of 117 primary crops in China’s crop production system. The partial factor productivity of applied synthetic N fertilizer (PFPN) was calculated as the total harvestable products dry weight basis divided by the applied synthetic N fertilizer. The crop’s recovery efficiency of total N input (REN) was defined as the percent of total crop N uptake to total N input to croplands. The N harvest index (NHI) was defined as the proportion of N in harvestable components to the total crop N uptake. The N surplus was calculated as the difference between the total N input and the total crop N uptake. The ratios of N input from planted seeds/tubers, atmospheric deposition, irrigation water, recycling of crop residues, animal manure, biological fixation, and synthetic fertilizer to the total N input were calculated for each year.
3. Results and Discussion
3.1. Trend in N Input
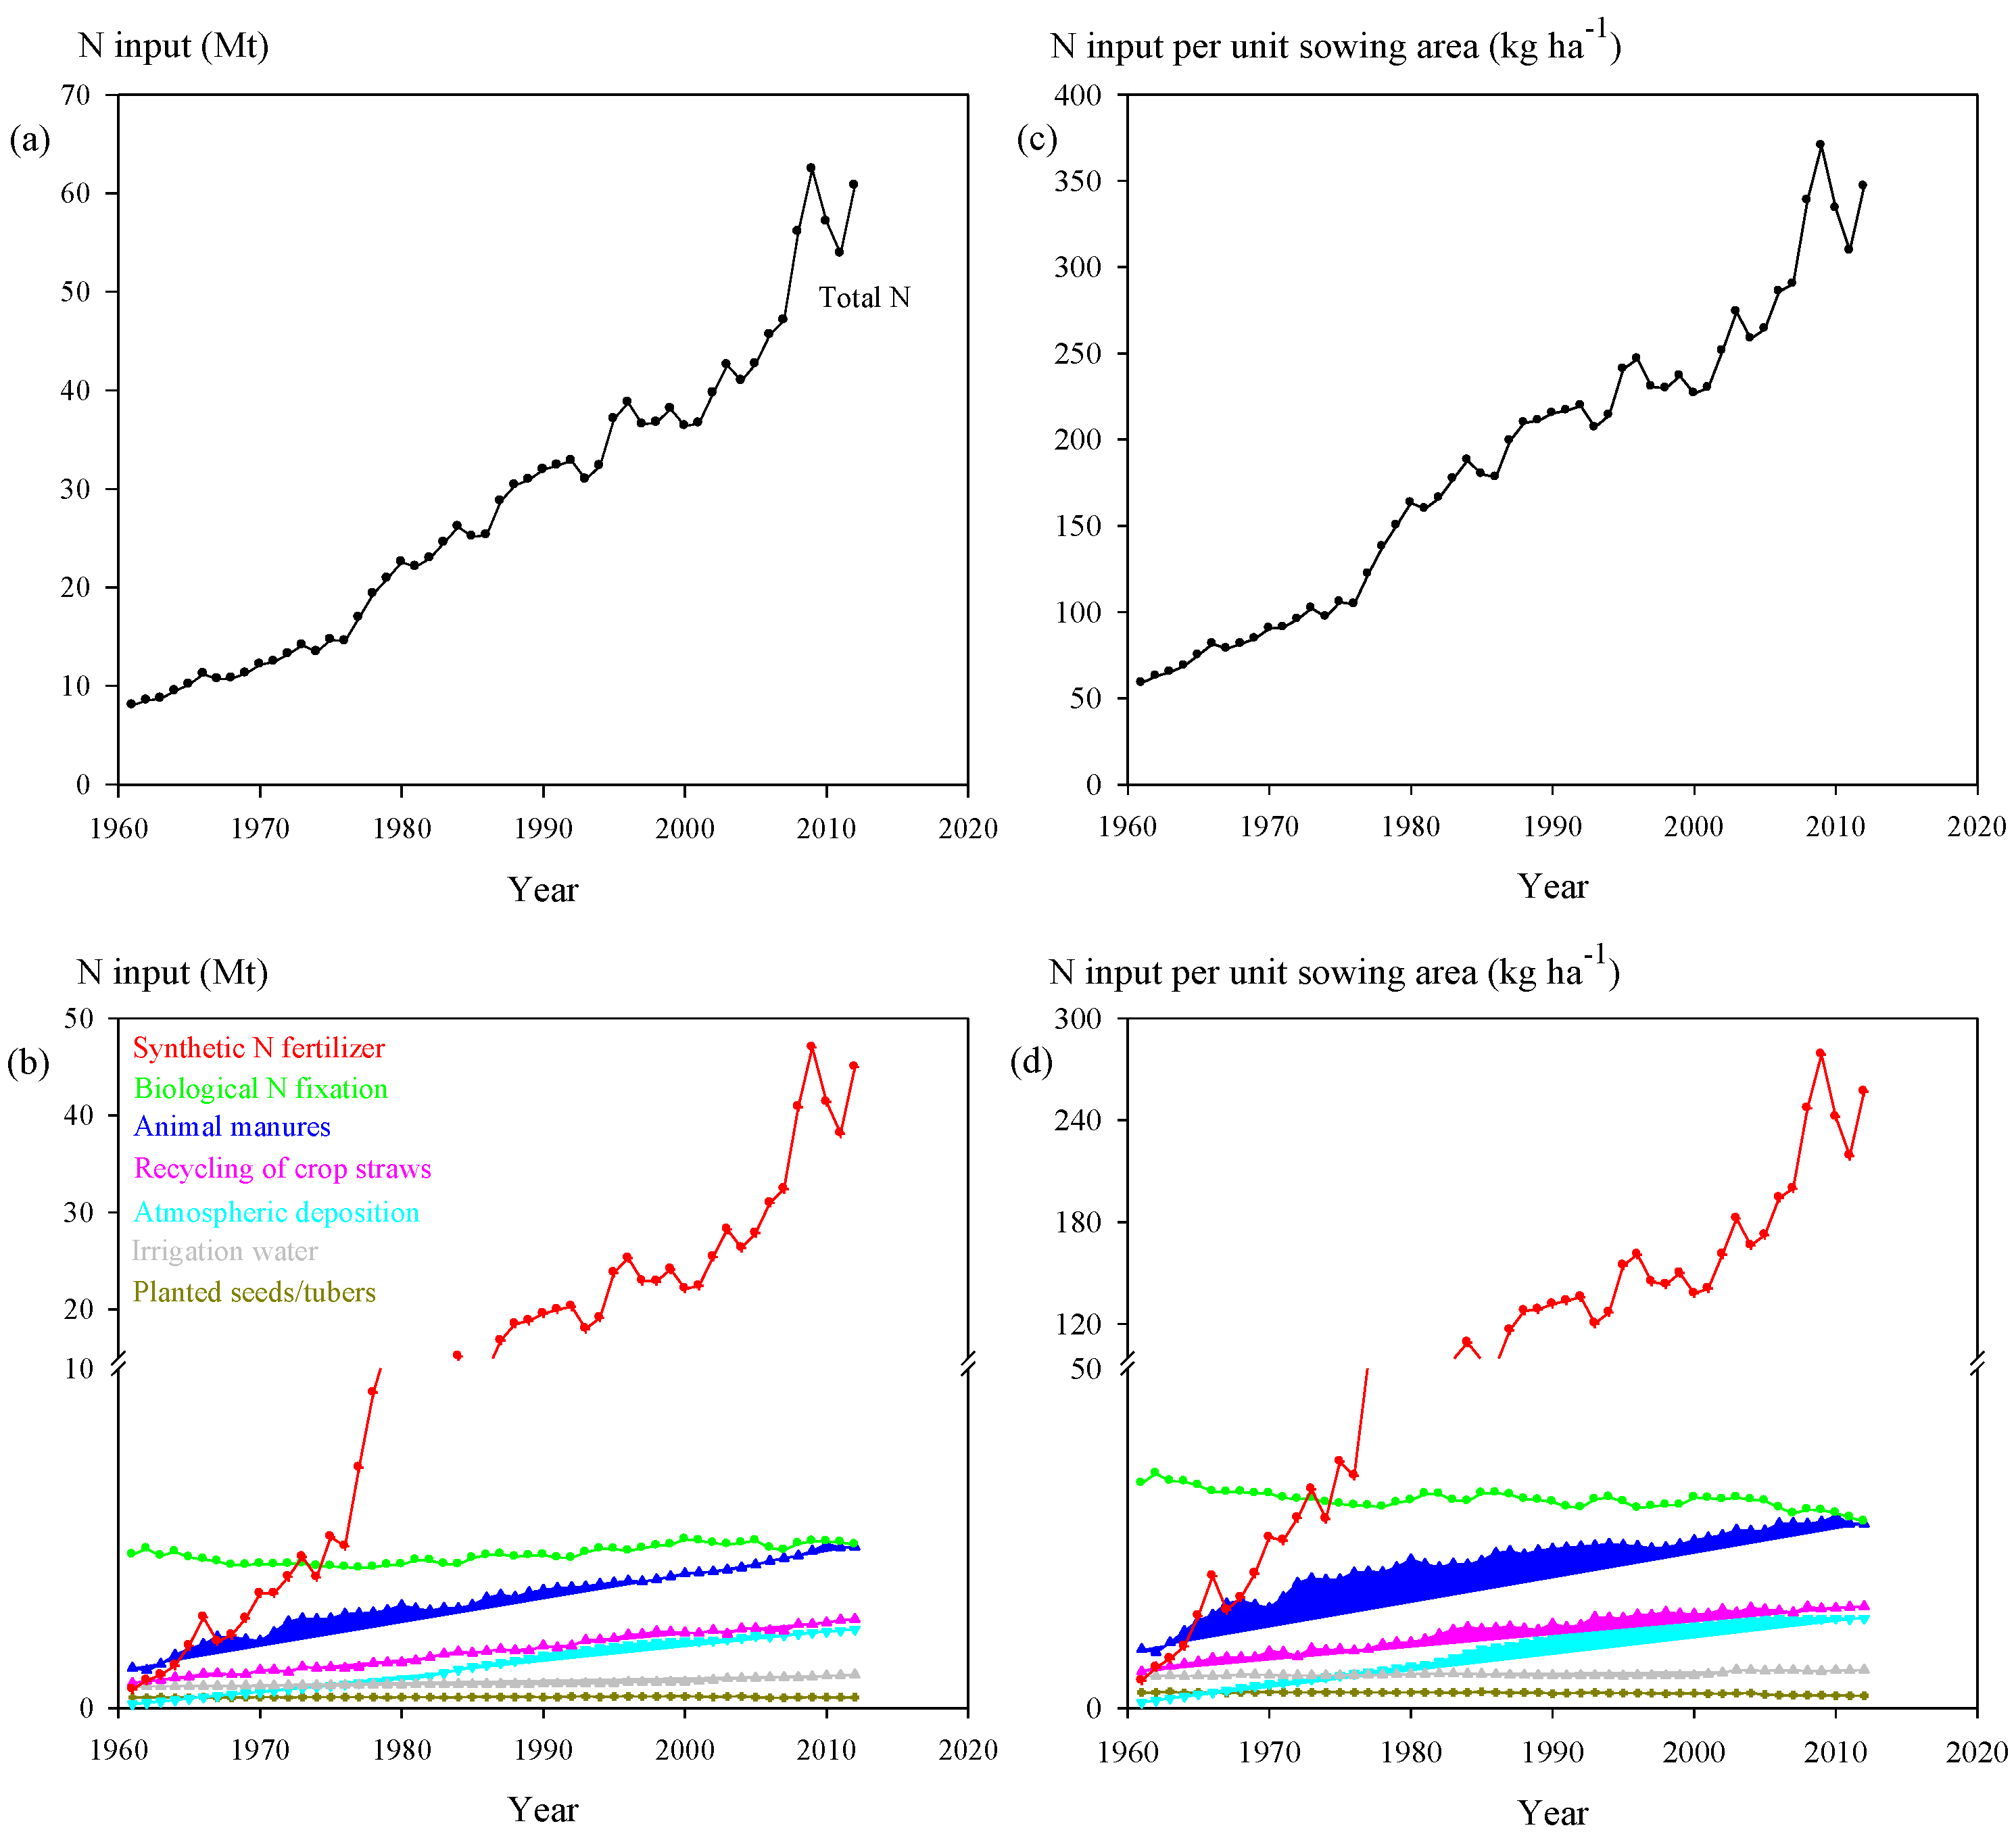
During the study period, total N input from planted seeds/tubers, atmospheric deposition, irrigation water, recycling of crop residues, animal manure, biological fixation, and synthetic fertilizer to croplands in China’s crop production system increased by 660.0%, from 8.0 million tons (Mt) in 1961 to 60.8 Mt in 2012 (Figure 1a). During the same period, the population of China increased by 105.6%, while the total crop production increased by 482.9% [44]. The estimated total N input from this study is similar to the estimate of Conant et al. [19], but higher than the estimate of Ti et al. [18]. This discrepancy is partly attributable to the exclusion of N inputs from planted seeds/tubers, irrigation water, animal manure, and recycling of crop residues by Ti et al. [18].
For the different categories of N input, there was almost no change in N inputs from planted seeds/tubers and biological fixation between 1961 and 2012 (Figure 1b). However, N inputs from animal manures, recycling of crop residues, and irrigation water increased substantially from 1961 to 2012, with average annual growth rates of 0.9–2.8%. Larger increase in N input from atmospheric deposition was observed during the same period, with an average annual growth rate of 6.1%. N input from synthetic fertilizer showed the largest increase from 0.5 Mt in 1961 to 45.0 Mt in 2012, with an average annual growth rate of 9.0%.
Total N input per unit sowing area increased by 489.8%, from 58.8 kg ha−1 in 1961 to 346.8 kg ha−1 in 2012 (Figure 1c). The increase in total N input was mainly resulted from an increase in total N input per unit sowing area rather than the increase in crop sowing area, which increased only by 28.5% from 1961 to 2012. Except for planted seeds/tubers and biological fixation, the various N input forms per unit sowing area increased significantly over the study period (Figure 1d). Synthetic N fertilizer input per unit sowing area showed the largest increase from 4.0 kg ha−1 in 1961 to 256.8 kg ha−1 in 2012, with an average annual growth rate of 8.5%. The next category of N input which had large increase over the same period was atmospheric deposition per unit sowing area with an average annual growth rate of 5.6%, followed by N inputs from animal manure, recycling of crop residues, and irrigation water with average annual growth rates of 0.4–2.3%. Lassaletta et al. [42] compared total N input per unit sowing area in crop production between China and the world during the period similar to our study. They reported that total N input per unit sowing area was significantly higher in China than in the world, particularly for N input from synthetic fertilizer.
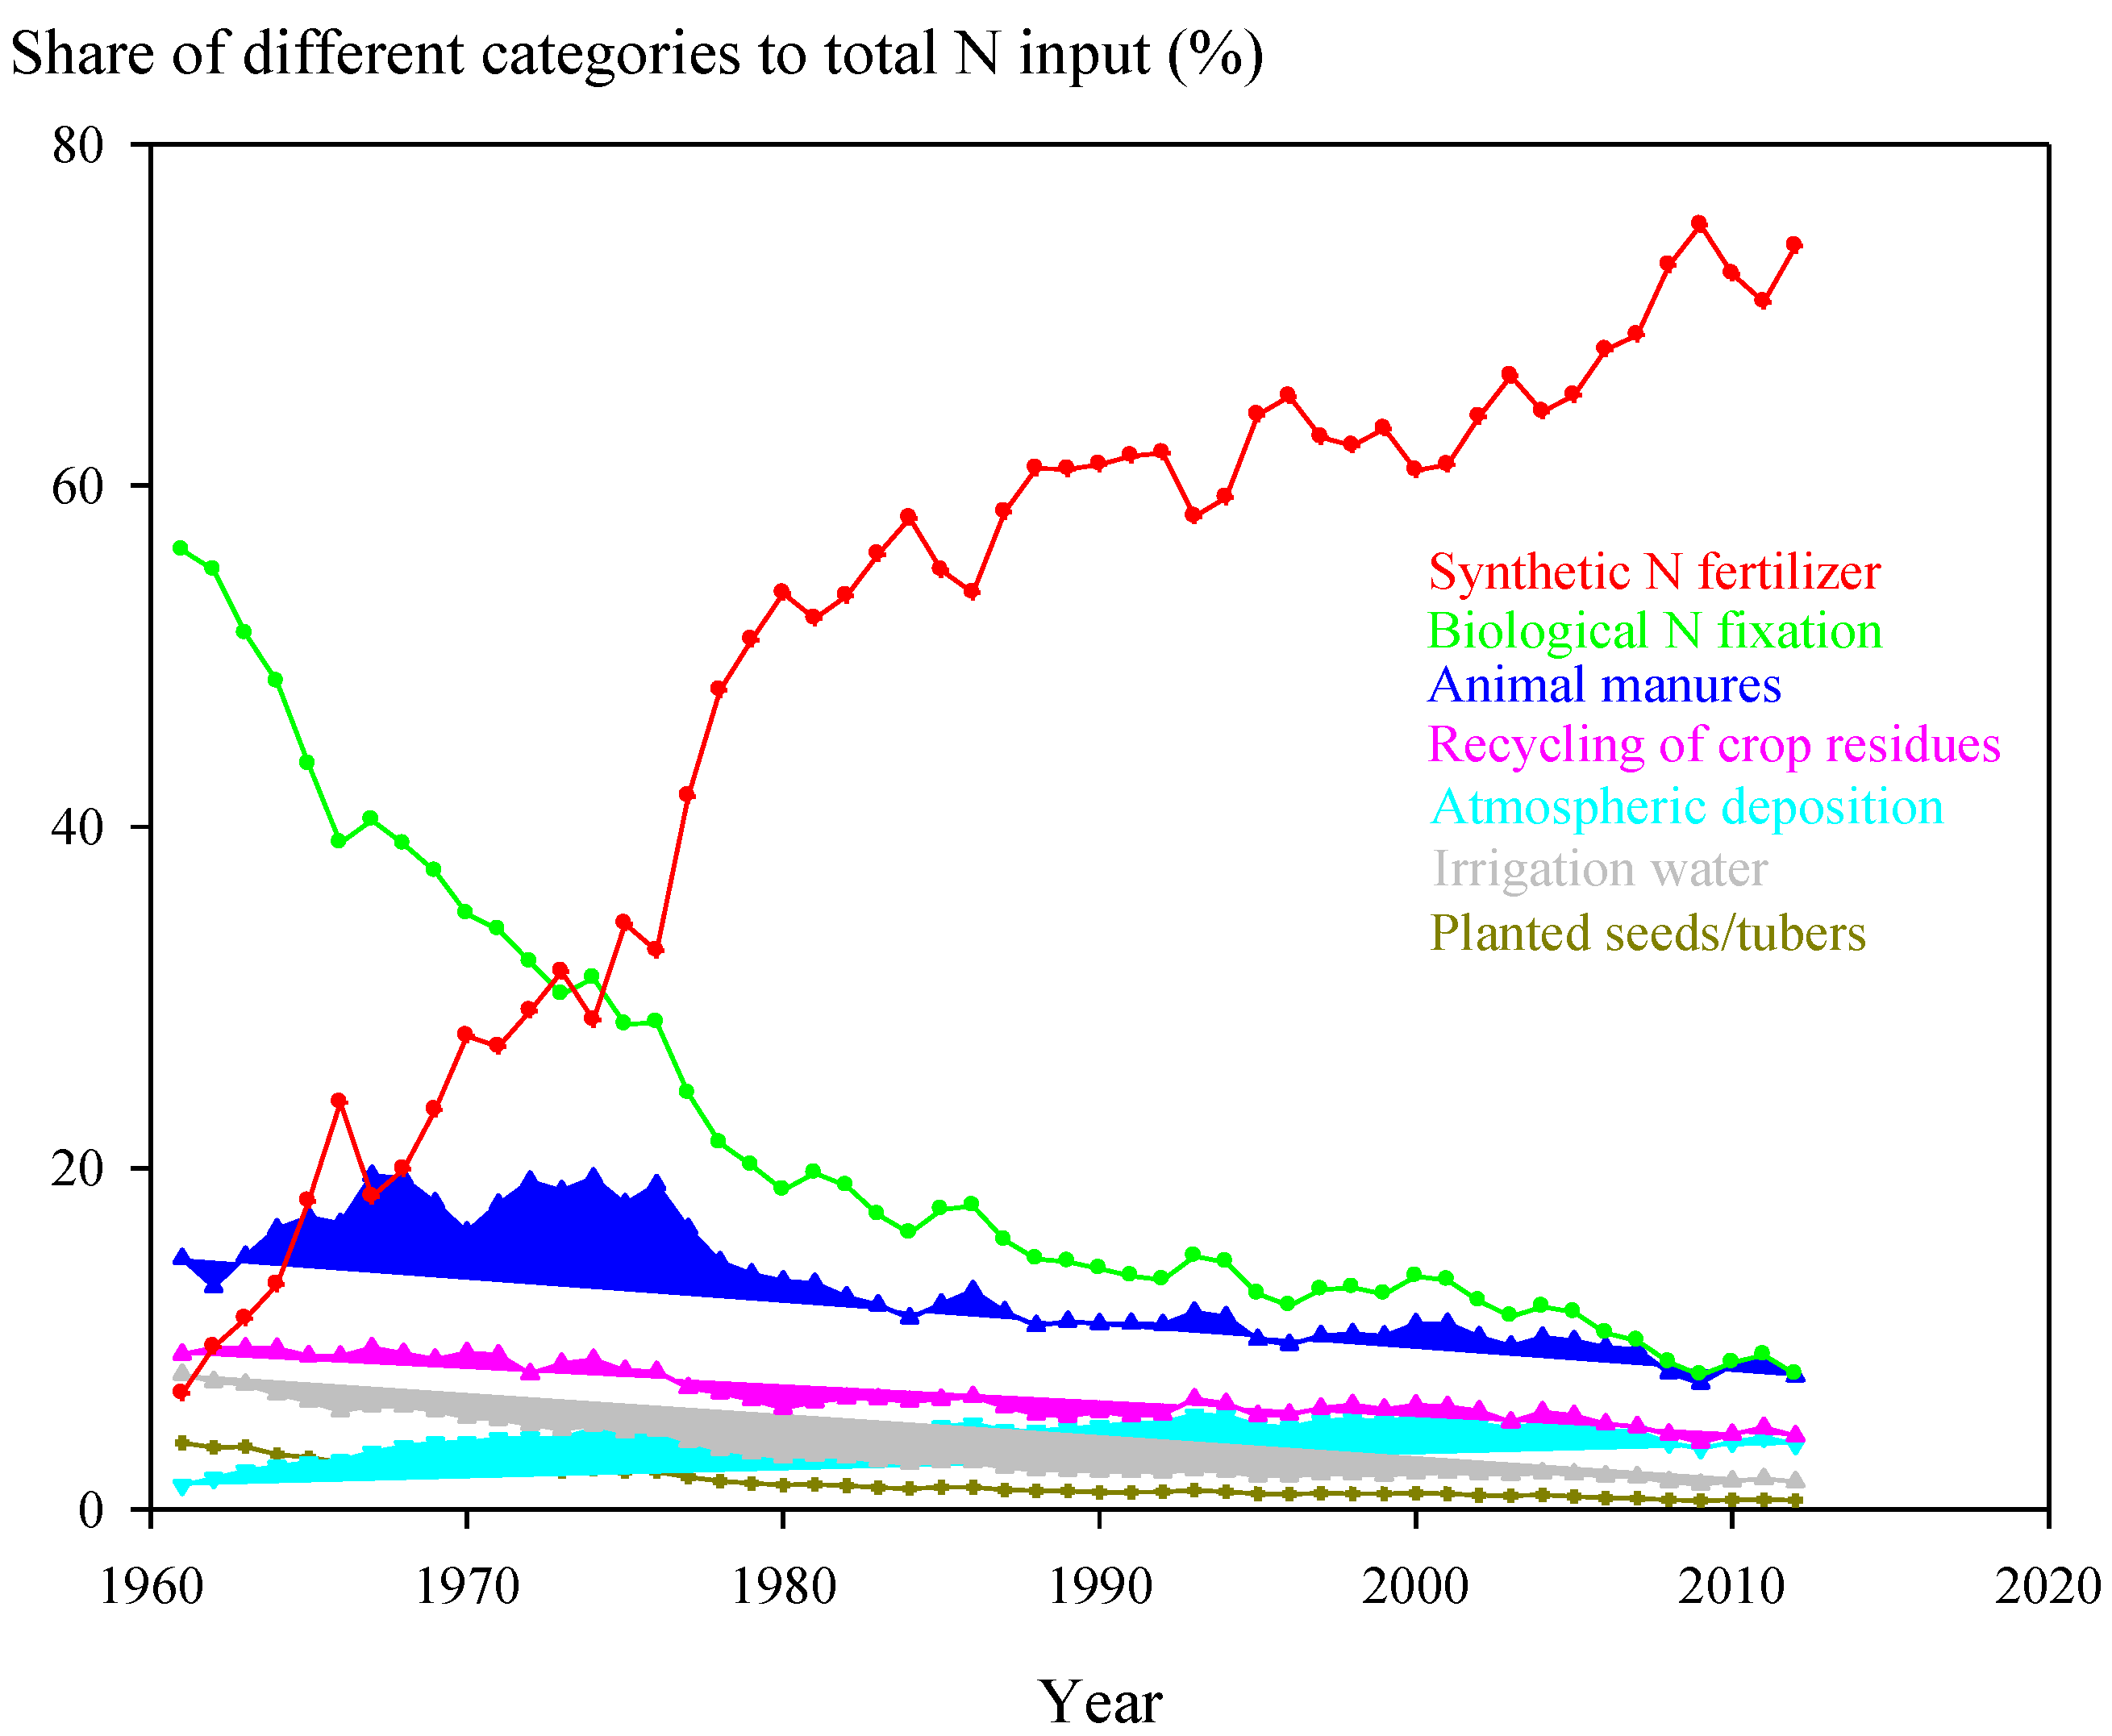
In 1961, the biological N fixation was the single largest N input to croplands, accounting for 56.2% of the total N input in China’s crop production system (Figure 2). N input from animal manure was the second largest contributor (14.7%), followed by the recycling of crop residues (9.1%), irrigation water (7.9%), synthetic N fertilizer (6.8%), planted seeds/tubers (3.9%), and atmospheric deposition (1.4%). By 2012, the contribution of synthetic N fertilizer to the total N input had increased rapidly to 74.0%. The contribution of other categories to the total N input ranged from 0.5% to 7.9%.
Overall, there was almost no change in N inputs from planted seeds/tubers and biological fixation and only a slight increase in N inputs from atmospheric deposition, irrigation water, recycling of crop residues, and animal manure during the study period. In contrast, there was a sharp increase in the N input from synthetic fertilizer from 1961 to 2012. Therefore, trend in N input appears to be moving away from animal manure and biological fixation towards synthetic N fertilizer, and synthetic N fertilizer became a dominant source of total N input to China’s croplands during the 52-year period. The shift toward synthetic fertilizer in N input is in agreement with the general situation in many developed and developing countries [19,42].
The increase in total N input to croplands and the shift toward synthetic fertilizer in N input in China’s crop production were mainly resulted from the growing demand for crop production [19]. The increase in total crop production in China has arisen mainly as a result of increase in yield per unit area rather than from increase in the cultivated area [2]. To improve the crop yields per unit area, the application rate of synthetic N fertilizer was kept at a high level [45]. Rice, maize, and wheat are the most important cereals, representing 99% of the total cereal production in China. Following an on-farm country-wide survey, Li et al. [46] found that synthetic N fertilizer rates for rice, maize, and wheat in China were 231, 237, and 229 kg N ha−1, respectively. Peng et al. [5] stated that the synthetic N fertilizer application rate per unit area for rice production in China is 67% higher than in other rice-growing countries. They reported that the application rates of 180–250 kg N ha−1 are common in China’s rice paddy fields and can reach to 300 kg N ha−1 in some places. Overall, the rate of synthetic N fertilizer application in China’s crop production was substantially higher than the global average and the amount of N application exceeded the N demand of the crops [47].
3.2. Trends in NUE and Related Parameters
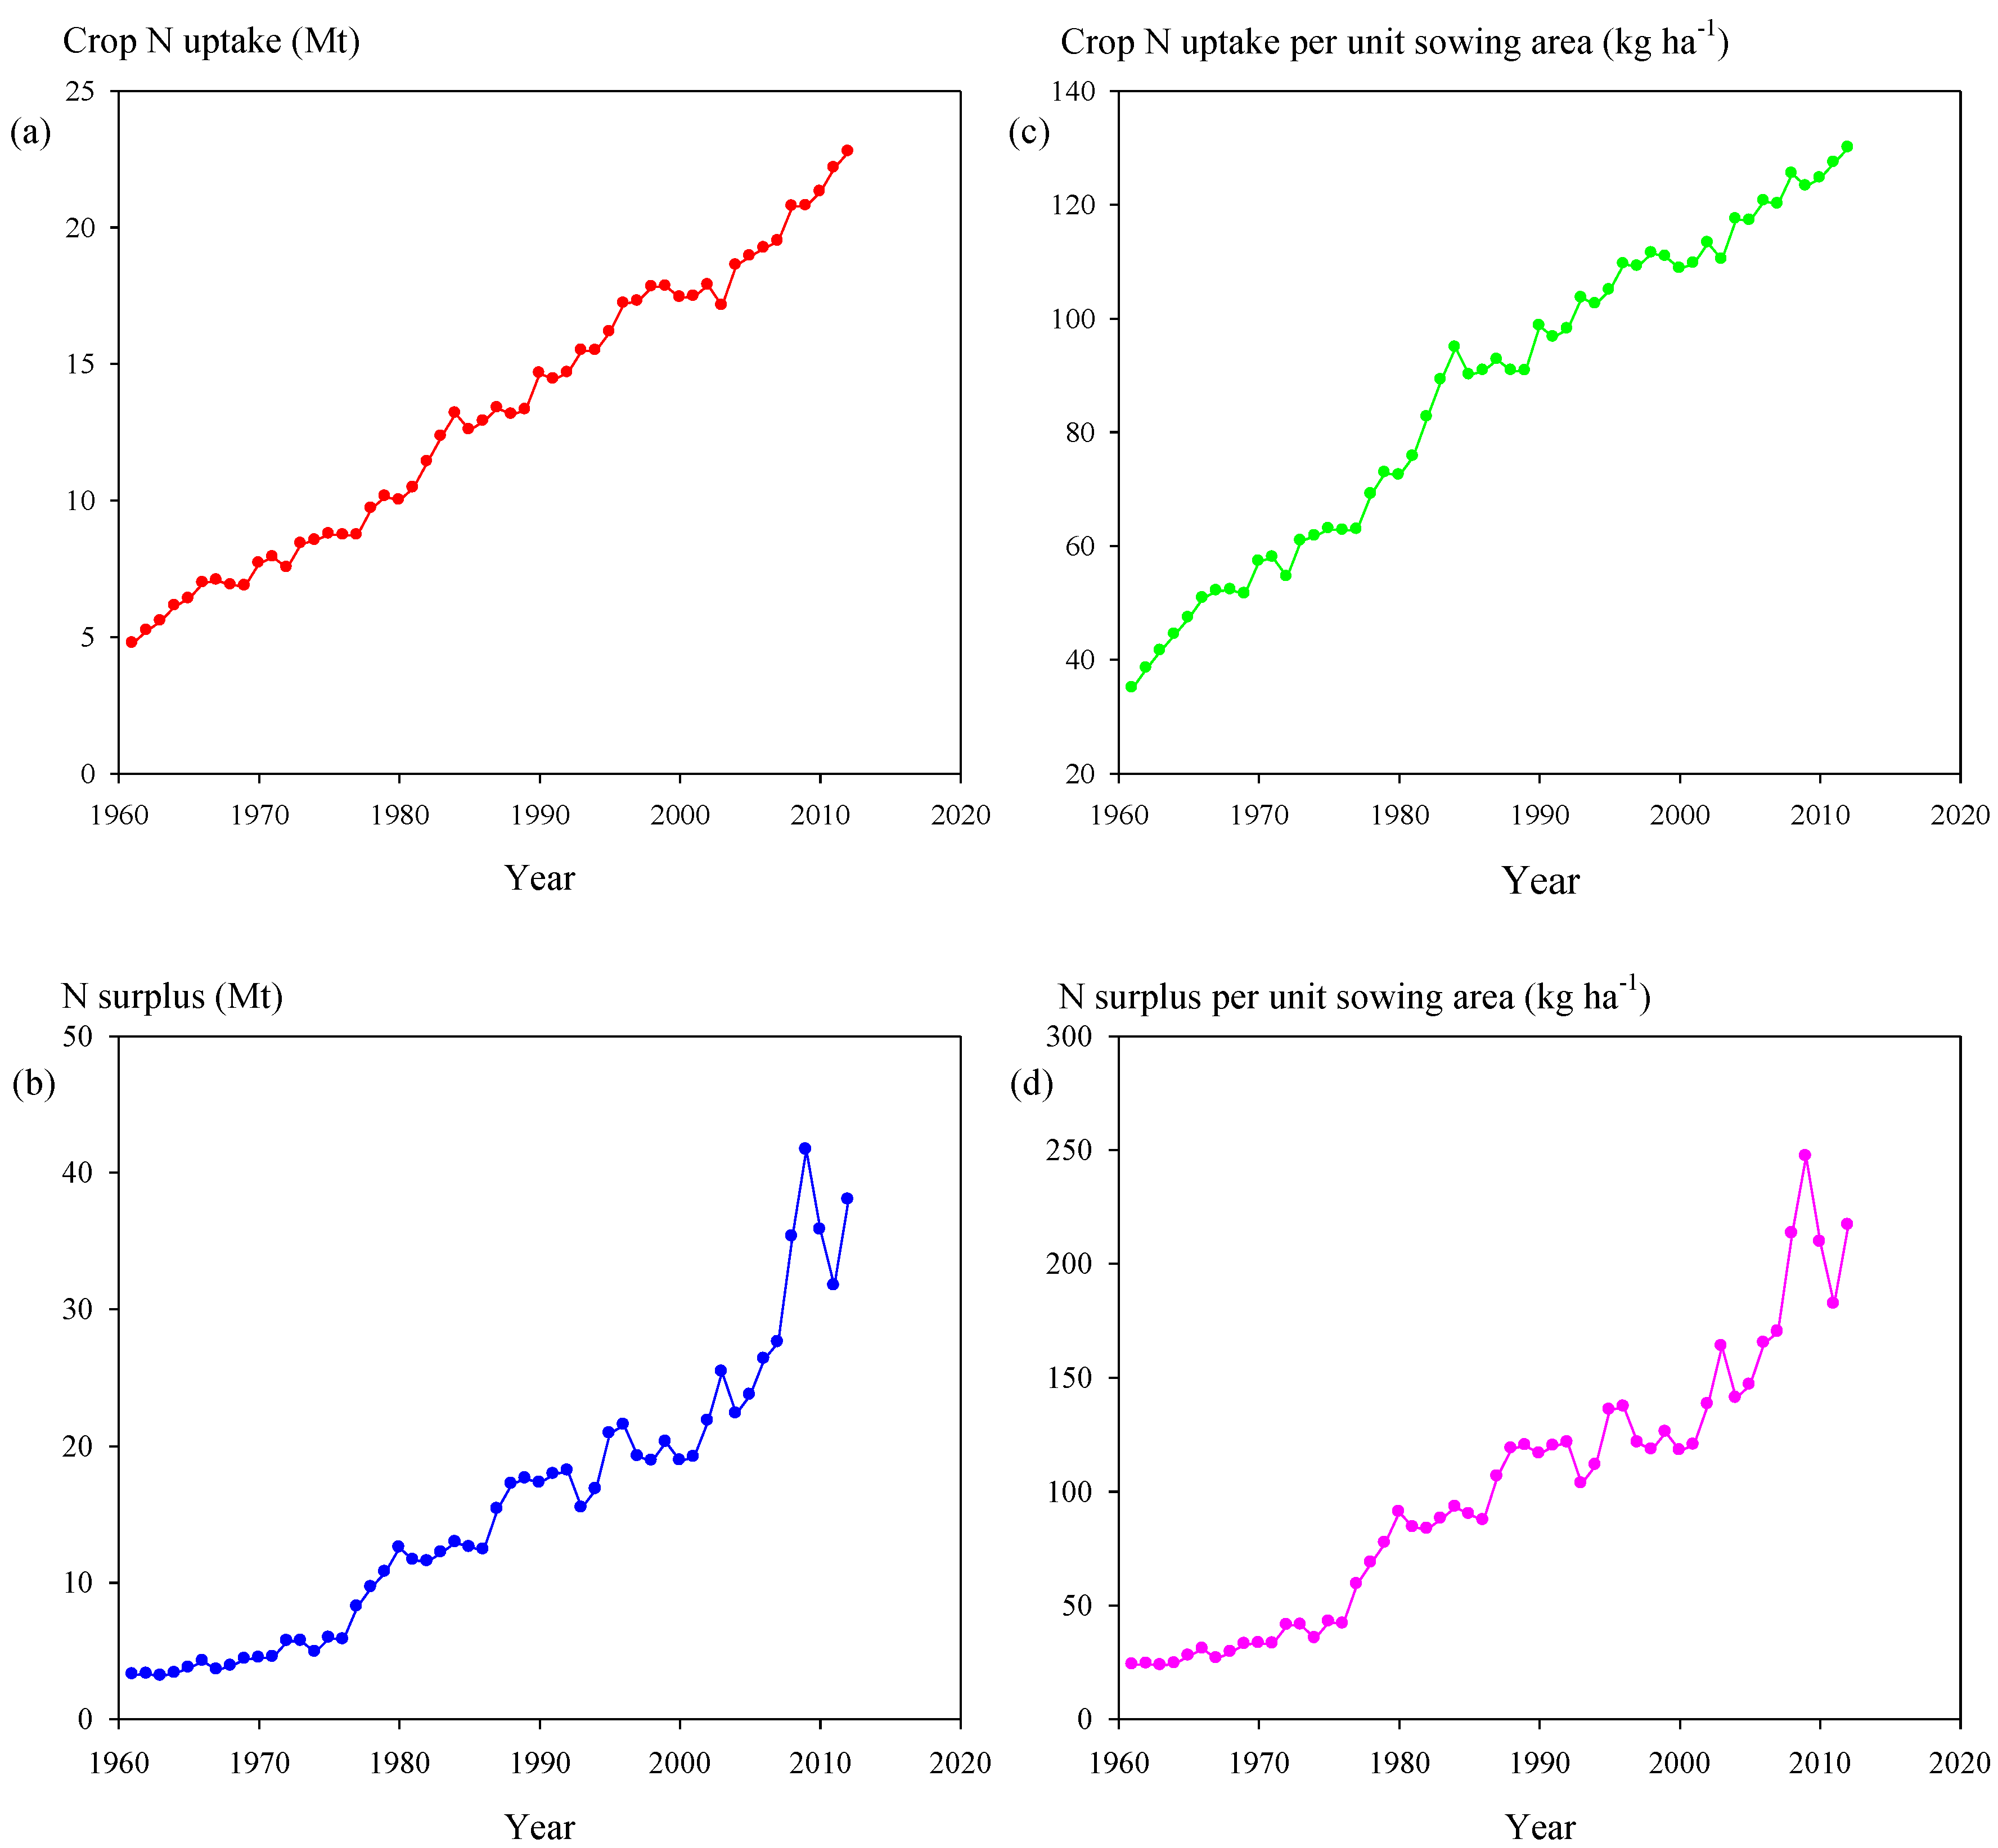
In this study, the total crop N uptake increased from 4.8 Mt in 1961 to 22.8 Mt in 2012, with an average annual growth rate of 3.1% (Figure 3a). The total crop N uptake estimated from this study was in the range of the values reported by Liu et al. [48]. The N surplus, estimated as the difference between total N input and the total crop N uptake, increased from 3.3 Mt in 1961 to 38.0 Mt in 2012, with an average annual increase of 4.9% (Figure 3b). From 1961 to 1975, the N surplus increased slowly with an average annual growth rate of 4.4%. Subsequently, it increased rapidly with an average annual growth rate of 6.2% in the period from 1976 to 2009. In addition, the ratio of N surplus to total crop N uptake increased from 0.7 to 1.7 during the study period. These results suggest an increasing trend in the reactive N released into the environment in China.
Total crop N uptake per unit sowing area and N surplus per unit sowing area followed similar trends in total crop N uptake and N surplus. The total crop N uptake per unit sowing area increased from 35.0 kg N ha−1 in 1961 to 130.0 kg N ha−1 in 2012, with an average annual growth rate of 2.6% (Figure 3c). From 1961 to 1975, the N surplus per unit sowing area increased from 23.9 kg ha−1 to 42.7 kg ha−1, and it was further increased to 247.1 kg ha−1 in 2009 (Figure 3d). The average annual growth rate in N surplus per unit sowing area was 4.2% from 1961 to 1975 and 5.5% from 1976 to 2009. Over the entire study period, the average annual growth rate in N surplus per unit sowing area was 4.4%.
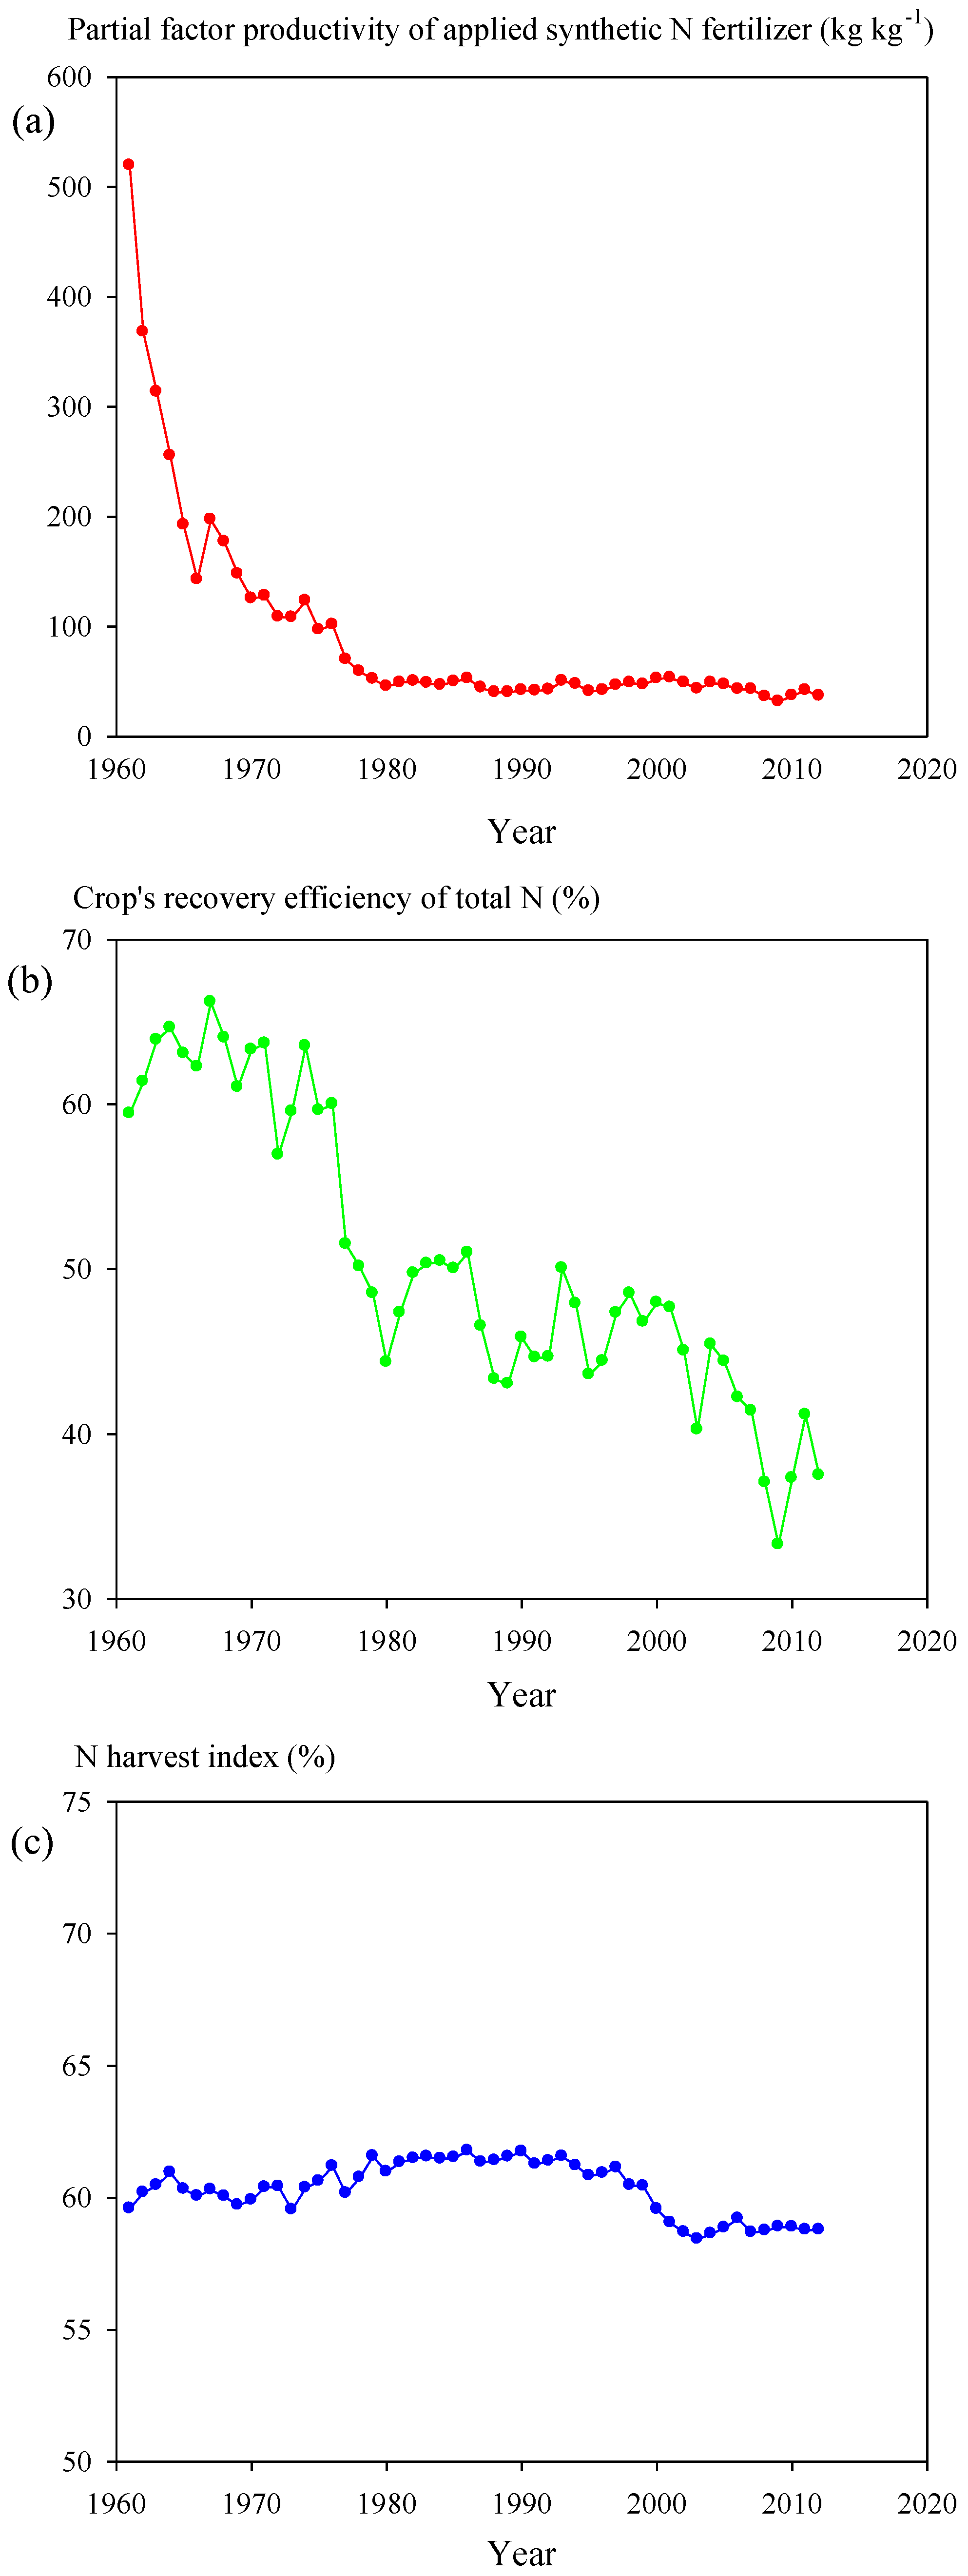
The partial factor productivity of applied synthetic N fertilizer (PFPN) declined from 519.1 kg kg−1 in 1961 to 36.6 kg kg−1 in 2012, with an average annual decrease rate of 5.1% (Figure 4a). From 1961 to 1980, PFPN declined rapidly at an average annual rate of 12.1%; thereafter, PFPN decreased more slowly and remained relatively stable. The decline in PFPN is largely attributed to the increased application rate of synthetic N fertilizer [2]. Similarly, crop’s recovery efficiency of total N input (REN) decreased from 59.4% in 1961 to 37.5% in 2012, with an average annual decrease rate of 0.9% (Figure 4b). From 1961 to 1980, REN declined rapidly at an average annual decrease rate of 1.5%. Subsequently, it decreased at an average rate of 0.8% per year during the period from 1981 to 2012. The N harvest index (NHI) remained relative stable over the entire study period (Figure 4c). However, a clear decline in NHI was observed during the period from 1997 to 2003.
In this study, REN was calculated as the ratio of total N uptake to total N input. Soil is the principal source of N and it can provide more than half of the total N requirement for the crop even when synthetic N fertilizer is applied at higher rates [6,49]. However, soil N supply was not included in the total N input in this study due to unavailability of soil N data. Therefore, actual REN could be substantially lower if soil N supply was included in the total N input. Nevertheless, the trend for REN in this study was similar to that of several other countries and regions [19]. Declining REN could be driven by the excessive external N input and a shift from dependence on mining soil mineral N to external N input [50]. In the case of China’s crop production, the declining REN was mainly attributed to the large increase in synthetic N fertilizer input [6]. The relatively low average REN of 37.5% also suggests that a large proportion of the total N input to the croplands might be lost into the surrounding ecosystems.
3.3. Sensitivity Analysis
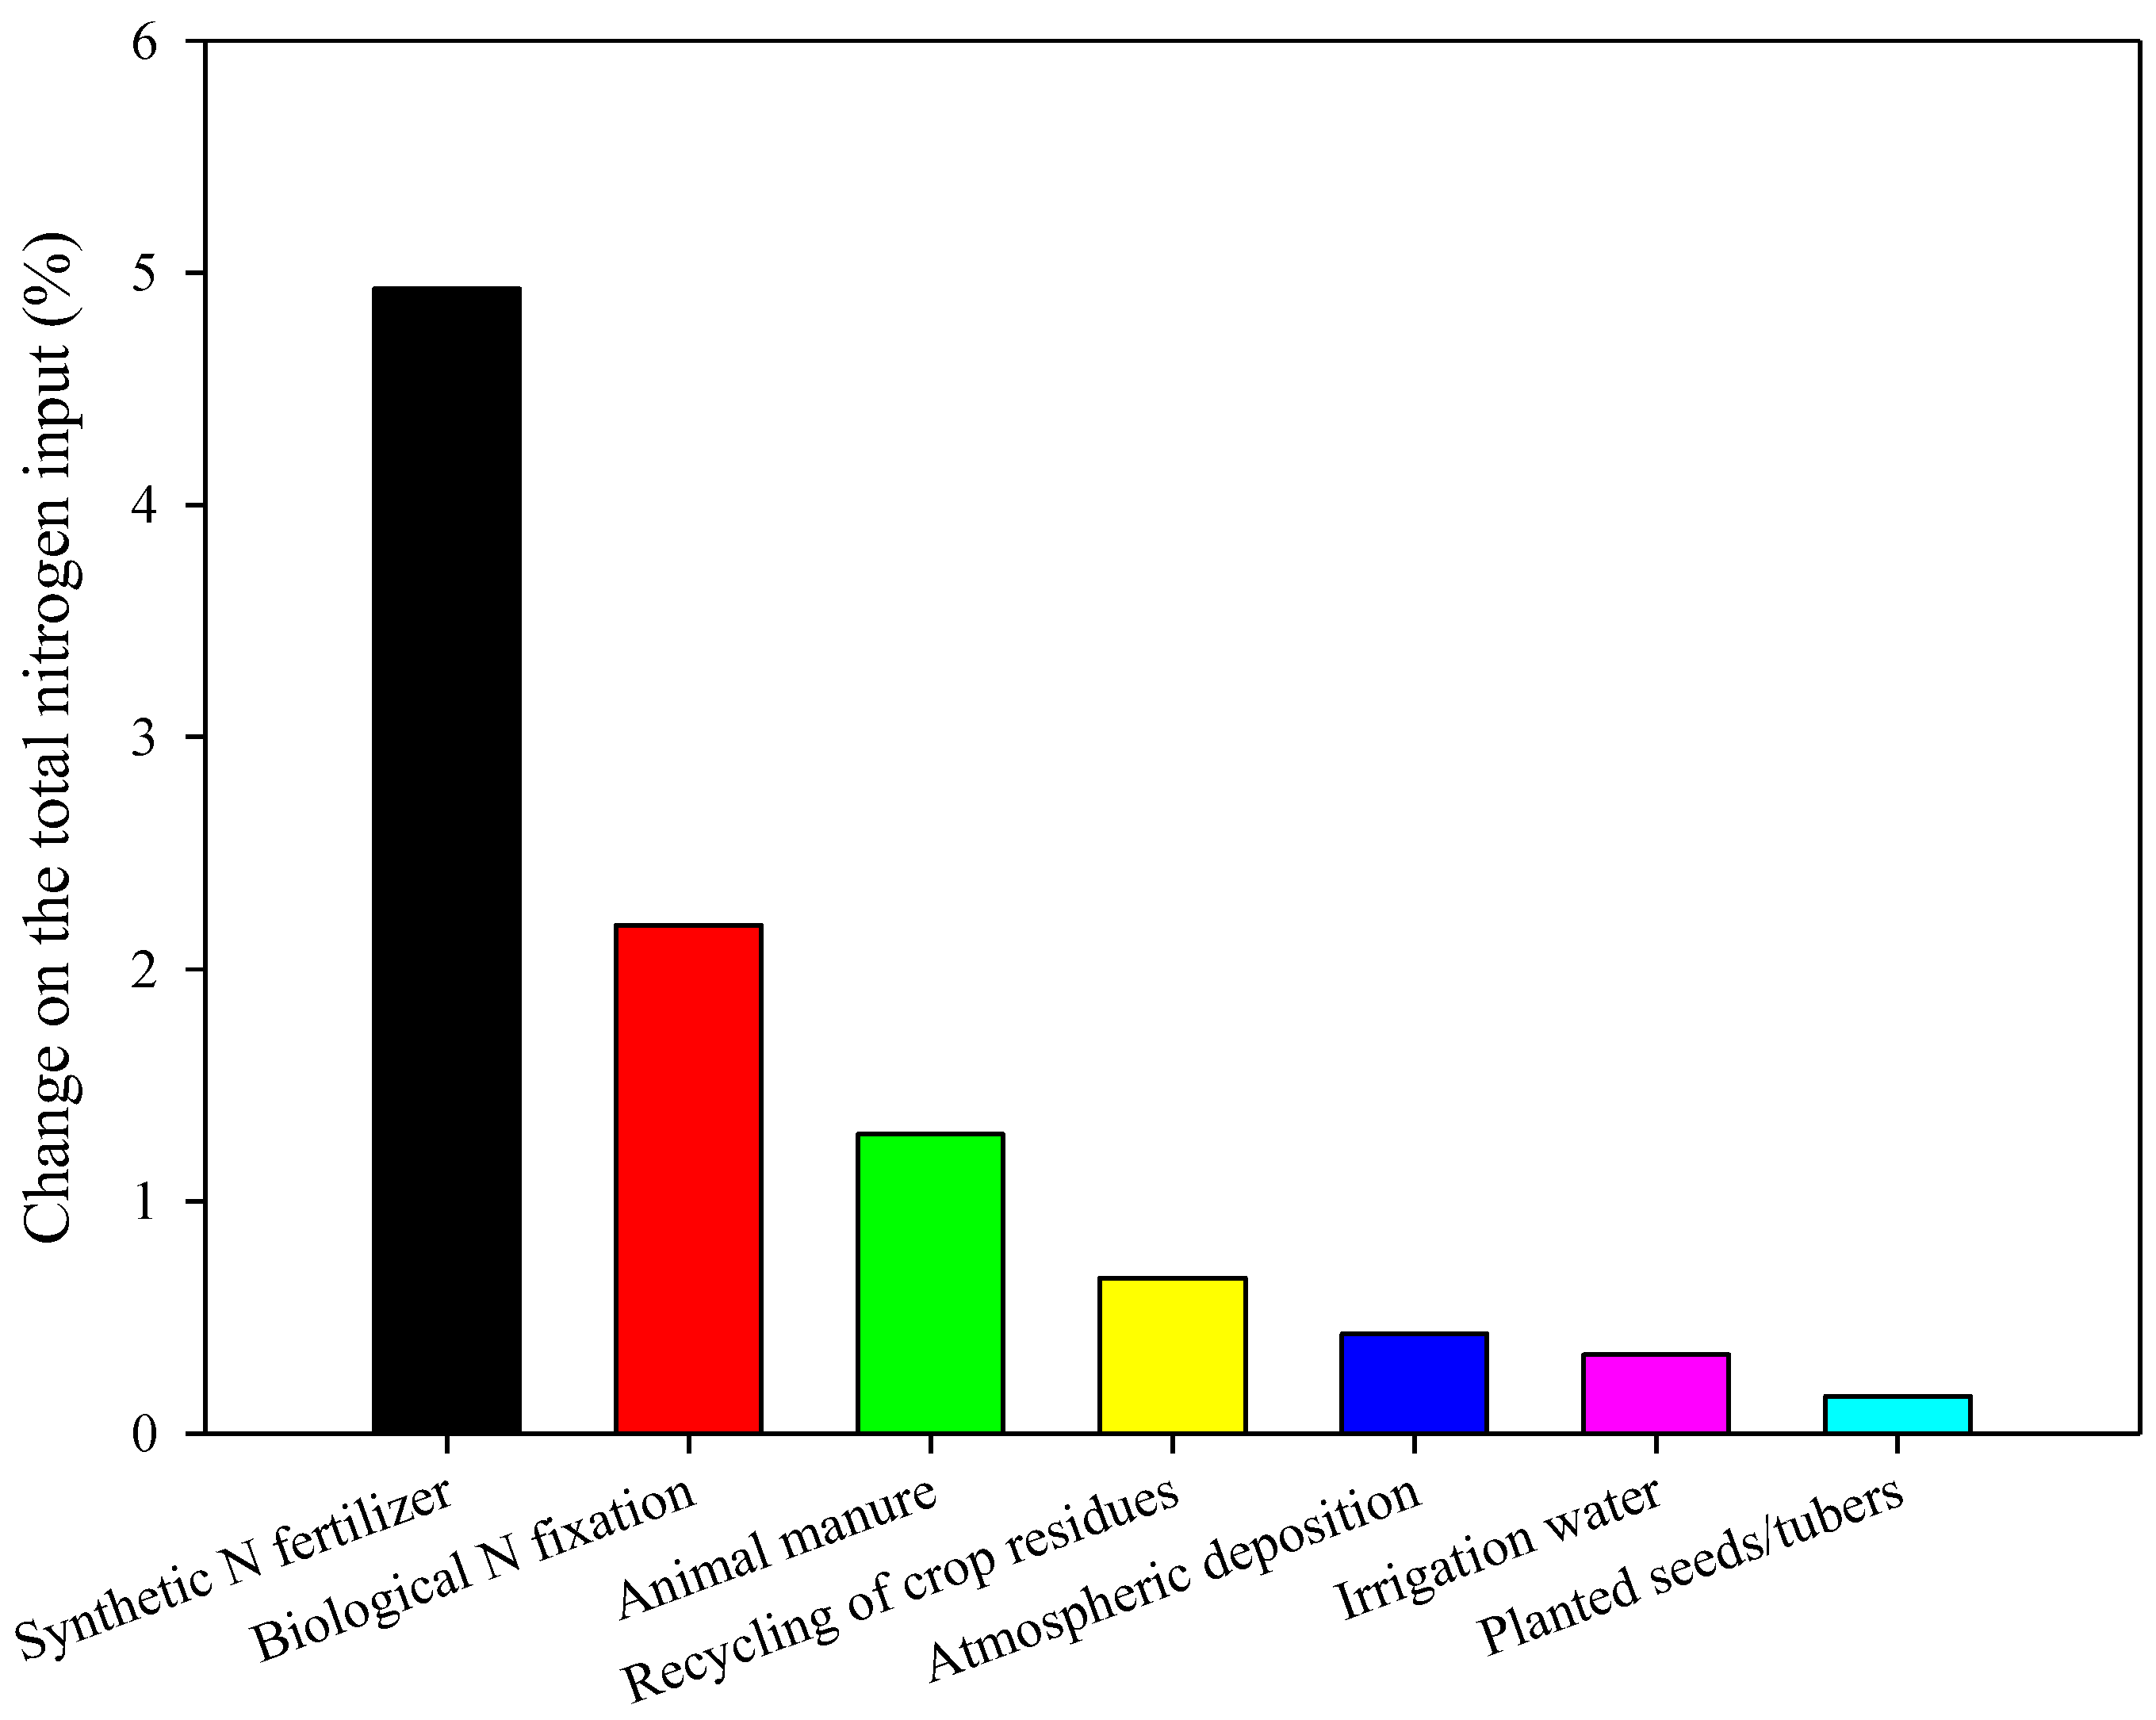
As described above, total N input to cropland was estimated as the sum of seven N input sources. Indeed, the various N input source data compiled in this study were collected from various government and non-government statistics and data sources. Inevitably, these data are subject to various degrees of uncertainty [51]. Consequently, a sensitivity analysis was performed to identify which N input source that was the most sensitive factor affecting the total N input (Figure 5). The sensitivity analysis indicated that the two most sensitive N input sources were the synthetic N fertilizer and biological N fixation. A 10% increase/decrease in the synthetic N fertilizer resulted in a 4.9% increase/decrease in the total N input. Figure 5 also shows a 2.2% increase in the total N input after a 10% increase in biological N fixation. A 10% increase/decrease in N inputs from animal manure, crop residues, atmospheric deposition, irrigation water, and planted seeds/tubers resulted in a 1.3%, 0.7%, 0.4%, 0.3%, and 0.2% increase/decrease in the total N input, respectively (Figure 5). Sensitivity analysis also indicates that changes in manure N production, fraction of manure added to croplands, and irrigation water N concentration had relatively minor effects on the total N input.
The accurate determination of the two most sensitive N input sources is critical to the estimation of the total N input. The synthetic N fertilizer data were obtained from the FAOSTAT database [23]. The quality of data has been improved significantly with the development of methodology and procedures governing statistical work [52]. The biological N fixation in recent years might be overestimated due to significant amount of synthetic N fertilizer applied [53]. In this study, the proportion of N input from biological N fixation to total N input decreased substantially over the years (Figure 2). Therefore, the uncertainty in total N input due to biological N fixation also declined. Precise biological N fixation estimation is important to the N budget at national or global scale, so more investigations on biological N fixation using different methods are needed. Notwithstanding the uncertainties, the methods used in this study could be transferable to similar areas in which various N inputs in agriculture occur.
3.4. Implications and the Way Forward
As suggested by Shen et al. [54], the historical path of Chinese agricultural development over the past half century has followed a clear progression. The present study indicated that China’s crop production has also experienced several different developmental stages between 1961 and 2012, in terms of the total N input, N loss, and NUE. The first stage was characterized by low N input, low yield and low N loss but high NUE, which was associated with traditional farming dominated by N input from animal manure and biological fixation between 1961 and 1972. The second stage was characterized by moderate level of N input, high yields, reasonably low N loss, and relatively high NUE, which was associated with the limited application of synthetic N fertilizer and increased crop production from 1973 to 1986. The third stage has the highest N input and N loss, higher yields, and the lowest NUE, which was associated with increased environmental risk due to the heavy use of synthetic N fertilizer between 1987 to the present.
It was found that both crop production [44] and total N input to croplands (Figure 1a) in China increased rapidly over time and that the increased rate of total N input was greater than that of crop production. Nitrogen plays a critical role in food production, and, at the same time, it can be an important pollutant with substantial effects on air and water quality, biological diversity, and human health [8,55]. High N inputs and high N losses can contribute to global warming [47] and soil acidification [10], with synthetic N fertilizer being the major contributor. In addition, there was an increasing trend in the proportion of total N input that is lost to terrestrial, aquatic, and atmospheric ecosystems due to the increase in N surplus and the decline in REN [11]. Therefore, the high total N input particularly synthetic N fertilizer to croplands may threaten the environment and the sustainable development of crop production system in China.
We have to admit that the increase in synthetic N fertilizer input has made a significant contribution to the improvement of crop yields in China [56]. Remarkably, the promotion of household contract responsibility system [57], declined synthetic N fertilizer cost [48], and scarcity in labor force in rural area [58] have resulted in an increase in the use of synthetic N fertilizer in crop production in China. Moreover, the new crop varieties with high yield potential released during the recent 20 years generally exhibited high yield using surplus N application [59], which indicated that farmers should apply a large amount of N fertilizer to produce the highest grain yield. Unfortunately, the increase in crop production has been associated with a large decline in NUE and with widespread environmental damage in recent decades [2]. Furthermore, it may not be possible to produce sufficient food in China with more synthetic N fertilizer, given diminishing returns of crop yields to N input [1,4]. In addition to over application of synthetic N fertilizer, inappropriate timing and methods of fertilizer application may also cause low NUE [6].
There are now various evidences that the application of synthetic N fertilizer could be reduced with no detrimental effect on crop yield [2,6]. Ladha et al. [60] reported that NUE can be increased significantly with improved fertilizer management and soil-crop management. Therefore, it is essential to reduce synthetic N fertilizer input and increase NUE to ensure the sustainability of crop production as well as human health and the environment protection [8,61]. In 2015, Ministry of Agriculture in China started to implement “two reductions” policy (i.e., reducing the inputs of fertilizers and pesticides) in agriculture [2]. The specific goal of Chinese central government is to reach zero percent increase in the use of fertilizers and pesticides by 2020 [62]. Moreover, China’s rural land system is in transition from the household contract responsibility to the rural land circulation [63]. The synthetic fertilizer application rate was reduced under rural land circulation compared with household farms [64]. It seems that the consumption of synthetic N fertilizer could be reduced during the next several decades. Overall, the goals of decreasing N input and increasing NUE can be achieved with the application and extension of existing agronomical technologies, development of integrated crop management practices, promotion of the rural land circulation, and genetic improvement in crop varieties that are less dependent on the heavy application of synthetic fertilizers.
5. Conclusions
This study provided the most comprehensive estimation of total N input to croplands in China by considering all seven major N sources, i.e., planted seeds/tubers, atmospheric deposition, irrigation water, crop residues, animal manure, biological N fixation, and synthetic N fertilizer, during the past five decades. Additionally, the trends of NUE-related parameters (i.e., PFPN, REN, and NHI) in China’s crop production were also examined. Total N input and N input per unit sowing area in China’s crop production showed rapid increases from 1961 to 2012. The total N input and N input per unit sowing area increased from 8.0 Mt and 58.8 kg ha−1 in 1961 to 60.8 Mt and 346.8 kg ha−1 in 2012, respectively, corresponding to respective 660.0% and 489.8% increases. The shift in the types of N input was observed from animal manure and biological fixation towards to synthetic N fertilizer. It was noted that the N input from synthetic N fertilizer contributed 6.8% to the total N input in 1961, and it increased to 74.0% in 2012. The N surplus estimated as the difference between total N input and the total crop N uptake increased from 3.3 Mt in 1961 to 38.0 Mt in 2012, with an average increase of 4.9% per year. In contrast, PFPN and REN substantially declined to 36.6 kg kg−1 and 37.5% in 2012, respectively. The initial values were 519.1 kg kg−1 and 59.4% in 1961, respectively. These results suggest an increasing trend in the reactive N released into the environment due to the over application of synthetic N fertilizer, which could potentially threaten human health, the environment and crop production system in China.
Therefore, it is essential to reduce N fertilizer input and increase NUE with improved crop management practices and N-efficient crop varieties to achieve the sustainability of crop production in China. Basically, N fertilizer use can be effectively reduced by optimizing crop management, and the current crop management practices in crop production could be further improved. Topdressing chemical N fertilizer into the flooded paddy field results in considerable N loss due to ammonia volatilization, and the deep placement of N fertilizer is an efficient alternative method to reduce N input. Compared with urea, the most common N fertilizer source, slow- or control-release N fertilizer supply the necessary amount N according to crop requirement, and can be used in crop production to reduce chemical N fertilizer input. More importantly, it is well demonstrated that the adoption of appropriate N management strategy can significantly increase NUE with reduced chemical N fertilizer. The real-time N management (RTNM), site-specific N management (SSNM), and three-control technology (TCT) developed to increase the NUE of irrigated rice have been successfully applied worldwide. Researchers and farmers should also pay attention to phosphorus (P) and potassium (K) fertilizer managements, because the balanced application of N fertilizer with P and K can improve NUE. Additionally, variation in NUE of different crop genotypes exists, so breeding crop varieties with improved NUE is a potential approach to decrease chemical N fertilizer application in crop production. For example, green super rice (GSR) varieties bred in China recently exhibit higher grain yield and NUE than other rice varieties under low nutrient input. Overall, these implications could be transferable to similar areas in which high N fertilizer in crop production occurs.
Supplementary Materials
The following are available online at www.mdpi.com/2071-1050/9/10/1905/s1, Table S1: Residue/yield ratio, residue N concentration, and recycling factor for each crop, Table S2: The area-based N fixation coefficients of 117 primary crops.
Acknowledgments
This work was funded by the National High Technology Research and Development Program of China (the 863 Project No. 2014AA10A605), the Programmer of Introducing Talents of Discipline to Universities in China (the 111 Project no. B14032), and the Special Fund for Agro-scientific Research in the Public Interest of China from the Ministry of Agriculture (No. 201203096).
Author Contributions
S.P. conceived and designed the experiments; and S.Y. and S.P. analyzed the data and wrote the paper.
Conflicts of Interest
The authors declare no conflict of interest.
References
- Tilman, D.; Cassman, K.G.; Matson, P.A.; Naylor, R.; Polasky, S. Agricultural sustainability and intensive production practices. Nature 2002, 418, 671–677. [Google Scholar] [CrossRef] [PubMed]
- Fan, M.; Shen, J.; Yuan, L.; Jiang, R.; Chen, X.; Davies, W.J.; Zhang, F. Improving crop productivity and resource use efficiency to ensure food security and environmental quality in China. J. Exp. Bot. 2012, 63, 13–24. [Google Scholar] [CrossRef] [PubMed]
- Food and Agriculture Organization of the United Nations. Crop Production. Available online: http://www.fao.org/faostat/en/#data/QC (accessed on 8 May 2017).
- Cassman, K.G. Ecological intensification of cereal production systems: Yield potential, soil quality, and precision agriculture. Proc. Natl. Acad. Sci. USA 1999, 96, 5952–5959. [Google Scholar] [CrossRef] [PubMed]
- Ibarrola, M.J.; Nonhebel, S. Variations in the Use of Resources for Food: Land, Nitrogen Fertilizer and Food Nexus. Sustainability 2016, 8, 1322. [Google Scholar] [CrossRef]
- Peng, S.; Buresh, R.J.; Huang, J.; Zhong, X.; Zou, Y.; Yang, J.; Wang, G.; Liu, Y.; Hu, R.; Tang, Q.; et al. Improving nitrogen fertilization in rice by site-specific N management. Agron. Sustain. Dev. 2010, 30, 649–656. [Google Scholar] [CrossRef]
- Lemaire, G.; Gastal, F. N Uptake and Distribution in Plant Canopies. In Diagnosis of the Nitrogen Status in Crops; Lemaire, G., Ed.; Springer Berlin Heidelberg: Berlin, Germany, 1997; pp. 3–43. [Google Scholar]
- Gu, B.; Ju, X.; Chang, J.; Ge, Y.; Vitousek, P.M. Integrated reactive nitrogen budgets and future trends in China. Proc. Natl. Acad. Sci. USA 2015, 112, 8792–8797. [Google Scholar] [CrossRef] [PubMed]
- Li, Y.; Huang, L.; Zhang, H.; Wang, M.; Liang, Z. Assessment of ammonia volatilization losses and nitrogen utilization during the rice growing season in alkaline salt-affected soils. Sustainability 2017, 9, 132. [Google Scholar] [CrossRef]
- Guo, J.; Liu, X.; Zhang, Y.; Shen, J.; Han, W.; Zhang, W.; Christie, P.; Goulding, K.; Vitousek, P.; Zhang, F. Significant acidification in major Chinese croplands. Science 2010, 327, 1008–1010. [Google Scholar] [CrossRef] [PubMed] [Green Version]
- Hirel, B.; Tétu, T.; Lea, J.P.; Dubois, F. Improving Nitrogen Use Efficiency in Crops for Sustainable Agriculture. Sustainability 2011, 3, 1452–1485. [Google Scholar] [CrossRef]
- Corbin, J.L.; Orlowski, J.M.; Harrell, D.L.; Golden, B.R.; Falconer, L.; Krutz, L.J.; Gore, J.; Cox, M.S.; Walker, T.W. Nitrogen strategy and seeding rate affect rice lodging, yield, and economic returns in the Midsouthern United States. Agron. J. 2016, 108, 1938–1943. [Google Scholar] [CrossRef]
- Shi, D.Y.; Li, Y.H.; Zhang, J.W.; Liu, P.; Zhao, B.; Dong, S.T. Effects of plant density and nitrogen rate on lodging-related stalk traits of summer maize. Plant Soil Environ. 2016, 62, 299–306. [Google Scholar]
- Ying, H.; Ye, Y.; Cui, Z.; Chen, X. Managing nitrogen for sustainable wheat production. J. Clean. Prod. 2017, 162, 1308–1316. [Google Scholar] [CrossRef]
- Gruber, N.; Galloway, J.N. An Earth-system perspective of the global nitrogen cycle. Nature 2008, 451, 293–296. [Google Scholar] [CrossRef] [PubMed]
- Ladha, J.K.; Tirol-Padre, A.; Reddy, C.K.; Cassman, K.G.; Verma, S.; Powlson, D.S.; Van Kessel, C.; Richter, D.D.; Chakraborty, D.; Pathak, H. Global nitrogen budgets in cereals: A 50-year assessment for maize, rice, and wheat production systems. Sci. Rep. 2016, 6, 19355. [Google Scholar] [CrossRef] [PubMed]
- Worrall, F.; Burt, T.P.; Howden, N.J.; Whelan, M.J. The UK’s total nitrogen budget from 1990 to 2020: A transition from source to sink? Biogeochemistry 2016, 129, 325–340. [Google Scholar] [CrossRef]
- Ti, C.; Pan, J.; Xia, Y.; Yan, X. A nitrogen budget of mainland China with spatial and temporal variation. Biogeochemistry 2012, 108, 381–394. [Google Scholar] [CrossRef]
- Conant, R.T.; Berdanier, A.B.; Grace, P.R. Patterns and trends in nitrogen use and nitrogen recovery efficiency in world agriculture. Glob. Biogeochem. Cycles 2013, 27, 558–566. [Google Scholar] [CrossRef]
- Lassaletta, L.; Billen, G.; Grizzetti, B.; Garnier, J.; Leach, A.M.; Galloway, J.N. Food and feed trade as a driver in the global nitrogen cycle: 50-year trends. Biogeochemistry 2014, 118, 225–241. [Google Scholar] [CrossRef]
- Yang, J.; Zhang, J. Crop management techniques to enhance harvest index in rice. J. Exp. Bot. 2010, 61, 3177–3189. [Google Scholar] [CrossRef] [PubMed]
- Fang, K.; Shen, H.; Shuang, Q.; Zhong, G.; Qiu, S.; Yu, J. Problem of fertilizer application increase in rice and countermeasures of ‘zero increase’. Chin. Agric. Sci. Bull. 2016, 32, 200–204, (In Chinese with English abstract). [Google Scholar]
- Food and Agriculture Organization of the United Nations. FAOSTAT Database. Available online: http://www.fao.org/faostat/en/#data (accessed on 8 May 2017).
- Food and Agriculture Organization of the United Nations. Food Balance Sheets. A Handbook, Italy. Available online: ftp://ftp.fao.org/docrep/fao/011/x9892e/x9892e00.pdf (accessed on 8 May 2017).
- Galloway, J.N.; Townsend, A.R.; Erisman, J.W.; Bekunda, M.; Cai, Z.; Freney, J.R.; Martinelli, L.A.; Seitzinger, S.P.; Sutton, M.A. Transformation of the nitrogen cycle: Recent trends, questions, and potential solutions. Science 2008, 320, 889–892. [Google Scholar] [CrossRef] [PubMed]
- Liu, X.; Zhang, Y.; Han, W.; Tang, A.; Shen, J.; Cui, Z.; Vitousek, P.; Erisman, J.W.; Goulding, K.; Christie, P.; et al. Enhanced nitrogen deposition over China. Nature 2013, 494, 459–462. [Google Scholar] [CrossRef] [PubMed]
- Regional Emission Inventory in Asia. Atmospheric Composition Research Program. Available online: http://www.jamstec.go.jp/frsgc/research/d4/reas_h_a.html (accessed on 8 May 2017).
- Xi, J.; Zhang, F.; You, X. Nitrogen balance of natural forest ecosystem in China. Acta Ecol. Sin. 2007, 27, 2367–3257. [Google Scholar]
- Smil, V. Nitrogen in crop production: An account of global flows. Glob. Biogeochem. Cycles 1999, 13, 647–662. [Google Scholar] [CrossRef]
- Postel, S.L.; Daily, G.C.; Ehrlich, P.R. Human appropriation of renewable fresh water. Science 1996, 271, 785–787. [Google Scholar] [CrossRef]
- Lal, R. The role of residues management in sustainable agricultural systems. J. Sustain. Agric. 1995, 5, 51–78. [Google Scholar] [CrossRef]
- EPA. Inventory of US Greenhouse Gas Emissions and Sinks: 1990–2000 Office of Atmospheric Programs, US. Available online: http://www.epa.gov/globalwarming/publications/emissions/us2002/ (accessed on 8 May 2017).
- Gupta, S.C.; Onstad, C.A.; Larson, W.E. Predicting the effects of tillage and crop residue management on soil erosion. J. Soil Water Conserv. 1979, 34, 77–79. [Google Scholar]
- IPCC. Greenhouse Gas Emission from Agricultural Soils. In Greenhouse Gas Inventory Reference Manual Revised 1996; IPCC Guidelines for National Greenhouse Gas Inventories; Intergovernmental Panel on Climate Change: Bracknell, UK, 1997. [Google Scholar]
- Stout, B.A. Energy Use and Management in Agriculture; Breton Publishers: North Scituate, MA, USA, 1984. [Google Scholar]
- Yan, X.; Akimoto, H.; Ohara, T. Estimation of nitrous oxide, nitric oxide and ammonia emissions from croplands in East, Southeast and South Asia. Glob. Chang. Biol. 2003, 9, 1080–1096. [Google Scholar] [CrossRef]
- Bouwman, A.; Lee, D.; Asman, W.; Dentener, F.; Van Der Hoek, K.; Olivier, J. Global high-resolution emission inventory for ammonia. Glob. Biogeochem. Cycles 1997, 11, 561–587. [Google Scholar] [CrossRef]
- Misra, R.V.; Hesse, P.R. Comparative Analyses of Organic Manures, 1st ed.; Food and Agricultural Organization of the United Nations: Rome, Italy, 1990. [Google Scholar]
- Mosier, A.R.; Duxbury, J.M.; Freney, J.R.; Heinemeyer, O.; Minami, K. Assessing and mitigating N2O emissions from agricultural soils. Clim. Chang. 1998, 40, 7–38. [Google Scholar] [CrossRef]
- Smil, V. Biomass Energies: Resources, Links, Constraints, 1st ed.; Institute for Amorphous Studies Series; Springer: New York, NY, USA, 1983. [Google Scholar]
- Wilcox, C.; Van Horn, H.; Harris, B., Jr.; Head, H.; Marshall, S.; Thatcher, W.; Wing, J. Large Dairy Herd Management; University Presses of Florida: Gainesville, FL, USA, 1978. [Google Scholar]
- Lassaletta, L.; Billen, G.; Grizzetti, B.; Anglade, J.; Garnier, J. 50 year trends in nitrogen use efficiency of world cropping systems: The relationship between yield and nitrogen input to cropland. Environ. Res. Lett. 2014, 9, 105011. [Google Scholar] [CrossRef]
- Food and Agriculture Organization of the United Nations. Fertilizer and Plant Nutrition Bulletin; Food and Agriculture Organization of the United Nations: Roma, Italy, 2006. [Google Scholar]
- National Bureau of Statistics of China. Population in China, 2015. Available online: http://www.stats.gov.cn/english/Statisticaldata/AnnualData/ (accessed on 8 May 2017).
- Peng, S.; Tang, Q.; Zou, Y. Current status and challenges of rice production in China. Plant Prod. Sci. 2009, 12, 1–6. [Google Scholar] [CrossRef]
- Li, H.; Zhang, W.; Zhang, F.; Du, F.; Li, L. Chemical fertilizer use and efficiency change of main grain crops in China. Plant Nutr. Fertil. Sci. 2010, 16, 1136–1143. [Google Scholar]
- Galloway, J.N.; Dentener, F.J.; Capone, D.G.; Boyer, E.W.; Howarth, R.W.; Seitzinger, S.P.; Asner, G.P.; Cleveland, C.C.; Green, P.A.; Holland, E.A.; et al. Nitrogen cycles: Past, present, and future. Biogeochemistry 2004, 70, 153–226. [Google Scholar] [CrossRef]
- Liu, X.; Duan, L.; Mo, J.; Du, E.; Shen, J.; Lu, X.; Zhang, Y.; Zhou, X.; He, C.; Zhang, F. Nitrogen deposition and its ecological impact in China: An overview. Environ. Pollut. 2011, 159, 2251–2264. [Google Scholar] [CrossRef] [PubMed]
- Kundu, D.K.; Ladha, J.K. Efficient management of soil and biologically fixed nitrogen in intensively cultivated rice fields. Soil Biol. Biochem. 1995, 27, 431–439. [Google Scholar] [CrossRef]
- Vitousek, P.M.; Naylor, R.; Crews, T.; David, M.B.; Drinkwater, L.E.; Holland, E.; Johnes, P.J.; Katzenberger, J.; Martinelli, L.A.; Matson, P.A.; et al. Nutrient imbalances in agricultural development. Science 2009, 324, 1519–1520. [Google Scholar] [CrossRef] [PubMed]
- Wu, H.; Yuan, Z.; Zhang, Y.; Gao, L.; Liu, S. Life-cycle phosphorus use efficiency of the farming system in Anhui province, central China. Resour. Conserv. Recycl. 2014, 83, 1–14. [Google Scholar] [CrossRef]
- Food and Agriculture Organization of the United Nations. Statistical Capacity Development, 2017. Available online: http://www.fao.org/statistics/statistical-capacity-development/en/ (accessed on 8 May 2017).
- Herridge, D.F.; Peoples, M.B.; Boddey, R.M. Global inputs of biological nitrogen fixation in agricultural systems. Plant Soil 2008, 311, 1–18. [Google Scholar] [CrossRef]
- Shen, J.; Cui, Z.; Miao, Y.; Mi, G.; Zhang, H.; Fan, M.; Zhang, C.; Jiang, R.; Zhang, W.; Li, H.; et al. Transforming agriculture in China: From solely high yield to both high yield and high resource use efficiency. Glob. Food Secur. 2013, 2, 1–8. [Google Scholar] [CrossRef]
- Whitmore, A.P.; Goulding, K.W.T.; Glendining, M.J.; Dailey, A.G.; Coleman, K.; Powlson, D.S. Nutrient Management in Support of Environmental and Agricultural Sustainability. Sustainability 2012, 4, 2513–2524. [Google Scholar] [CrossRef]
- Ren, J. The Effect of the Household Contract Responsibility System to Intensive Agricultural Scale Operation of Our Country. Adv. Soc. Sci. 2015, 4, 77–82, (In Chinese with English abstract). [Google Scholar]
- John, D.K. The Impact of Price on Chemical Fertilizer Demand in China. Asian Agric. Res. 2012, 7, 7–12. [Google Scholar]
- Yuan, S.; Nie, L.; Wang, F.; Huang, J.; Peng, S. Agronomic performance of inbred and hybrid rice cultivars under simplified and reduced-input practices. Field Crops Res. 2017, 210, 129–135. [Google Scholar] [CrossRef]
- Peng, S.; Huang, J.; Zhong, X.; Yang, J.; Wang, G.; Zou, Y.; Zhang, F.; Zhu, Q.; Roland, B.; Christian, W. Research strategy in improving fertilizer-nitrogen use efficiency of irrigated rice in China. Sci. Agric. Sin. 2002, 35, 1095–1103, (In Chinese with English abstract). [Google Scholar]
- Ladha, J.K.; Pathak, H.; Krupnik, T.J.; Six, J.; Kessel, C.V. Efficiency of fertilizer nitrogen in cereal production: Retrospects and prospects. Adv. Agron. 2005, 87, 85–156. [Google Scholar]
- Graham, R.; Wortman, S.; Pittelkow, C. Comparison of Organic and Integrated Nutrient Management Strategies for Reducing Soil N2O Emissions. Sustainability 2017, 9, 510. [Google Scholar] [CrossRef]
- Ministry of Agriculture of China. National Agricultural Sustainable Development Plan (2015–2030). Available online: http://www.moa.gov.cn/ztzl/mywrfz/gzgh/201509/t20150914_4827900.htm (accessed on 8 May 2017).
- Lu, J.; Su, Y. On willingness of rural land circulation and securitization in central regions of China. Asian Agric. Res. 2014, 6, 36–41. [Google Scholar]
- Song, Y. Differences and influence factors of fertilizing behavior under rural land circulation. Agric. Outlook 2016, 2, 27–30. (In Chinese) [Google Scholar]
Figure 1.
Trends in: (a) total nitrogen (N) input (the N returns to croplands in the forms of planted seeds/tubers, atmospheric deposition, irrigation water, recycling of crop residues, animal manure, biological N fixation, and synthetic N fertilizer, Mt); (b) different categories of N input (Mt); (c) total N input per unit sowing area (kg ha−1); and (d) different categories of N input per unit sowing area (kg ha−1) in China’s crop production from 1961 to 2012.

Figure 2.
Trends in the shares of nitrogen (N) input in the forms of planted seeds/tubers, atmospheric deposition, irrigation water, crop residues, animal manure, biological N fixation, and synthetic N fertilizer to total N input (%) in China’s crop production from 1961 to 2012.
Figure 2.
Trends in the shares of nitrogen (N) input in the forms of planted seeds/tubers, atmospheric deposition, irrigation water, crop residues, animal manure, biological N fixation, and synthetic N fertilizer to total N input (%) in China’s crop production from 1961 to 2012.

Figure 3.
Trends in: (a) total crop nitrogen (N) uptake (the sum of N in harvestable components and in crop residues, Mt); (b) N surplus (the difference between the total N input and the total crop N uptake, Mt); (c) total crop N uptake per unit sowing area (kg ha−1); and (d) N surplus per unit sowing area (kg ha−1) in China’s crop production from 1961 to 2012.

Figure 4.
Trends in: (a) partial factor productivity of applied synthetic nitrogen (N) fertilizer (the ratio of total harvestable products to the applied synthetic N fertilizer, kg kg−1); (b) crop’s recovery efficiency of total N input (the percent of total crop N uptake to total N input to croplands, %); and (c) N harvest index (the proportion of N in harvestable components to the total crop N uptake, %) in China’s crop production from 1961 to 2012.

Figure 5.
Sensitivity analysis of the impact of changes in each of N input source on total N input.


Table 1.
Average annual N production of main livestock and the fraction of animal manure production available for croplands application.
Table 1.
Average annual N production of main livestock and the fraction of animal manure production available for croplands application.
| Animal | Manure (kg N head−1) | Fraction (%) |
|---|---|---|
| Donkeys | 15.46 | 5 |
| Buffaloes | 27.00 | 31 |
| Cattle | 29.34 | 31 |
| Chickens | 0.37 | 55 |
| Goats | 4.50 | 5 |
| Horses | 36.00 | 5 |
| Mules | 36.00 | 5 |
| Pigs | 2.78 | 93 |
| Sheep | 4.81 | 17 |
© 2017 by the authors. Licensee MDPI, Basel, Switzerland. This article is an open access article distributed under the terms and conditions of the Creative Commons Attribution (CC BY) license (http://creativecommons.org/licenses/by/4.0/).
Share and Cite
MDPI and ACS Style
Yuan, S.; Peng, S. Exploring the Trends in Nitrogen Input and Nitrogen Use Efficiency for Agricultural Sustainability. Sustainability 2017, 9, 1905. https://doi.org/10.3390/su9101905
AMA Style
Yuan S, Peng S. Exploring the Trends in Nitrogen Input and Nitrogen Use Efficiency for Agricultural Sustainability. Sustainability. 2017; 9(10):1905. https://doi.org/10.3390/su9101905
Chicago/Turabian StyleYuan, Shen, and Shaobing Peng. 2017. "Exploring the Trends in Nitrogen Input and Nitrogen Use Efficiency for Agricultural Sustainability" Sustainability 9, no. 10: 1905. https://doi.org/10.3390/su9101905
Note that from the first issue of 2016, this journal uses article numbers instead of page numbers. See further details here.