Demystifying the Barriers to Transport Infrastructure Project Development in Fast Developing Regions: The Case of China


1
School of Construction Management and Real Estate, Chongqing University, Chongqing 400045, China
2
International Research Center for Sustainable Built Environment, Chongqing University, Chongqing 400045, China
*
Author to whom correspondence should be addressed.
Sustainability 2017, 9(10), 1915; https://doi.org/10.3390/su9101915
Submission received: 2 October 2017
/
Revised: 19 October 2017
/
Accepted: 20 October 2017
/
Published: 23 October 2017
(This article belongs to the Special Issue Sustainability in Civil Engineering: from Sustainable Materials to Sustainable Cities)
Abstract
:Transport infrastructure (TI) has become one of the primary drivers for sustainable economic growth and social progress. However, a wider take-up is currently inhibited in fast developing regions (FDRs) by many barriers, which have not been explored explicitly in previous studies. In this study, a three-dimensional framework (i.e., macro environment, local environment, and the construction process) is proposed to structure the barriers in a reasonable way. Professionals’ opinions on the importance of the barriers are collected through questionnaire survey. The survey results were analyzed by the ranking analysis technique. It is found that the top five barriers are “difficulty in survey and design during the construction process”, “weak support from economy”, “insufficient funding”, “harsh regional climate”, and “cost overrun”. Further analysis, based on a factor analysis, indicates that these critical barriers could be grouped into three clusters: “administration on transport infrastructure”, “construction technology and cost management”, and “geographical and economic conditions”. The research findings demonstrate the usefulness of the proposed framework, and the implication is that a barriers-based checklist favors stakeholders to improve the efficiency and sustainability of TI development in FDRs. Although the study is situated in China, it sheds light on the subject in other developing countries.
1. Introduction
Sustainability, mostly defined as the “development that meets the needs of current generations without compromising the ability of future generations to meet their own needs” [1], is a comprehensive concept that is used in different contexts. Since the emergence of the concept of sustainability, there has been an increasing awareness that the sustainability of cities and regions calls for the sustainability of infrastructure, and particularly of transport infrastructure (TI) [2,3]. Infrastructure deficit, which has often been claimed to be closely linked to equity and sustainability, is a common issue that many developing countries have confronted over the past decade [4,5,6]. A well-developed infrastructure, whether engineering facilities [7], municipal public works (e.g., roads, railways, airports, bridges), or public service facilities (e.g., sanitation, water supply, telecommunication, sewerage) is considered the foundation to maintain sustained and rapid development of economy [8,9,10]. Similarly, infrastructure development in the transportation sector functions as an economic driver [11,12] as well as an important instrument for alleviating unemployment and poverty [13,14]. A typical example goes to India where the fast growth of economy is fueled in part by its transport sector, and the sector contributes 6.4% of GDP [15,16]. In reality, urbanization and population growth yield enormous needs for transport infrastructure (TI) in developing countries [17,18]. To satisfy the needs, therefore, numerous TI projects were initiated in Russia, Malaysia and Philippines recently [19].
Previous studies demonstrated that coordinated transport infrastructure would offer balanced and stable regional development in terms of socio-economic development and environment [20,21,22]. However, compounded by technical complexity and involvement of stakeholders [23], the development of TI is subject to multidimensional obstacles [24]—economic, political, social, cultural, technological, and environmental [25,26,27]. The obstacles may give rise to some development problems such as time delay and cost overrun [28,29,30]. For instance, of 441 road projects owned by the National Highway Authority of India, 137 were delayed due to problems in land acquisition and environmental protection [31]. Researchers have pointed out that although these kinds of problems are widespread, they could be solved if rigorous risk assessment at the decision-making stage and efficient governance in the execution phase are conducted [32]. In addition, infrastructure in developing countries is vulnerable to low resilience and weak support of technical capability [33], and over-optimistic expectation and poor planning/management will aggregate the difficulty of the development process [34].
A fast developing region (FDR) refers to a smaller part of a developing country. While it has some features in common with the whole country, the embeddedness in culture, religion, economic foundation, and social structure makes it unique. Based on Vietnam, the work by Dang and Pheng revealed several key factors inhibiting the efficiency of public investment in TI [25]. Although the research findings shed light on the same issue in other developing countries, the situation in which relevant studies are fragmented has not been improved significantly. Furthermore, fewer efforts have been made to account for characteristics of fast developing regions (FDRs) in the examinations. To address this research gap, this study aims to propose a conceptual framework for structuring key obstacles to TI development in FDRs. The proposed framework is intended to elaborate the coherence of the obstacles and thereby lays a useful foundation for future studies. The results not only favor professionals to gain new insights into the barriers, but also imply some strategies for the implementation of TI projects.
2. Theoretical Framework: A Proposed U-Framework
Dang and Pheng found that the barriers to TI investment include capacity for estimation and monitoring, politicized decision-making, transparency and accountability, institutional weaknesses in planning, political commitment, and corruption in the construction sector [25]. Marques and Berg conducted a survey by using examples from water utilities and found that an appropriate allocation of risks in infrastructure contracts is a critical factor for successful contracts, thus it demonstrates that the risk management is essential in infrastructure projects [35]. Labadie examined low impact development of infrastructure, and complemented the barriers with lack of basic understanding of planning, insufficient economic incentive, inactive leadership, and insufficient technical information and assistance [29]. Likewise, Long et al. conducted a survey on large projects in Ho Chi Minh City Vietnam and classified 62 problems they identified into five categories, namely incompetent designers/contractors, poor estimation and change management, social and technological issues, site related issues, and improper techniques and tools [36]. Furthermore, some of these factors, for instance, delay in approval, unpredicted external events (e.g., currency fluctuation and trade recession), efficiency and productivity challenges, cost and time overrun, and inappropriate skills specifications were restressed in recent research [31,32,37,38].
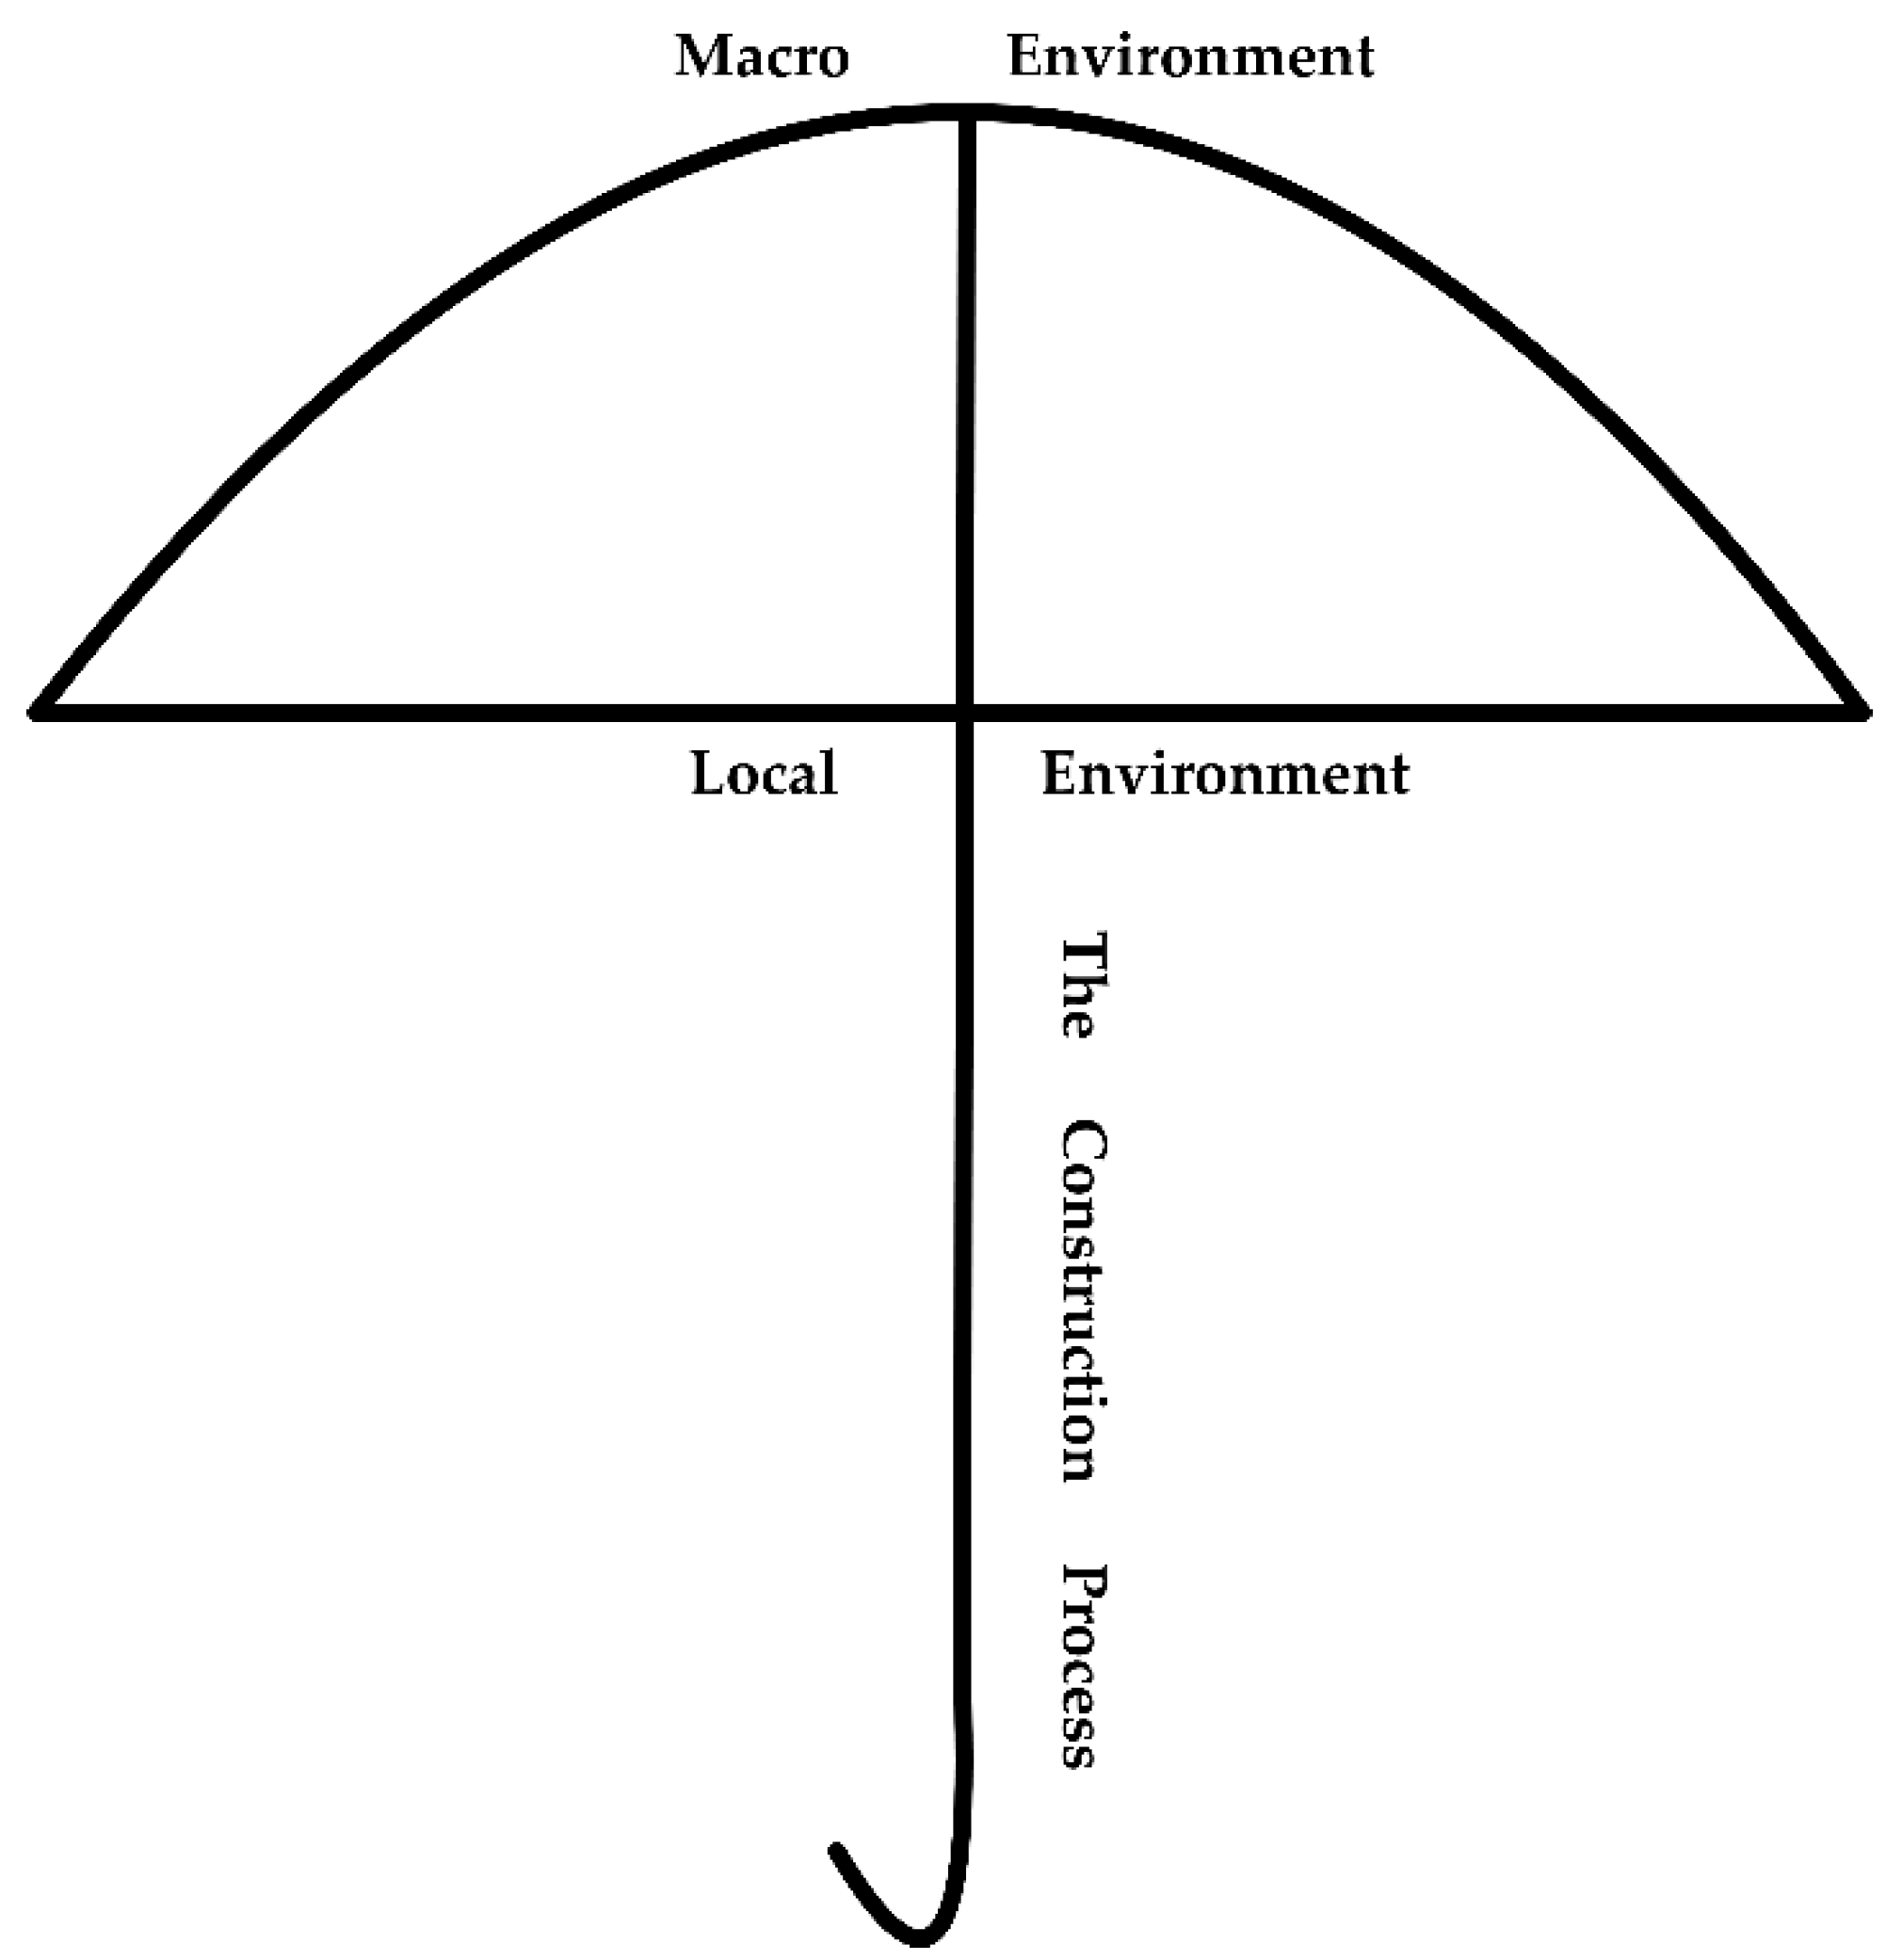
Basically, TI in developing countries is influenced by fragile ecological environment, high technical requirements caused by geography, shortage of financing, cultural heterogeneity, and backward facilities [36]. This gives the suggestion that potential barriers to TI development in FDRs span widely from one project to another, and structuring them in due ways is helpful to improve practitioners’ perception. By examining the inherent relationships, those barriers with reference to developing countries are regrouped into three dimensions: macro environment, local environment, and the construction process. As shown in Figure 1, these dimensions are in the shape of umbrella in practice, which is named after a U-framework.
The elements of the proposed framework are interdependent in addressing the barriers inhibiting the development of infrastructure. Specifically, the umbrella rib is composed of socio-economic factors (e.g., economic prosperity, inflation, and national planning) that generate all-pervading impacts on all types of TI projects. Factors in this dimension mainly highlight the non-differential and large-scale impacts at the national or regional level. Following this is the tube that represents a five-stage development process: inception, design, construction, operation, and demolition. This dimension relates to the barriers in terms of the planning and policymaking as well as the implementation and demolition that reflect the capacity of construction firm itself. The horizontal stretcher refers to extensive involvement of local sectors in the development process. Compared to the dimension of macro environment, factors under the last dimension put more emphasis on the local environmental influences around the projects, covering local cultures, geographical environment, locations of the projects, local regulations, etc. Arguably, factors such as incentives from local governments, capacity of manpower, market competition, and environmental protection can render much disturbance to the development of TI projects.
3. Materials and Methods
3.1. The Case of China
In recent years, the world economy has maintained a real GDP growth rate around 2.7%, along with heightened policy uncertainty, subdued investment and stagnant global trade. In this case, the emerging market and developing economies (EMDEs) are highly expected to lead the robust economic growth and serve as an important engine for global economic recovery. As illustrated in Table 1, the real GDP growth rate of EMDEs is almost twice that of the advanced economies or high-income countries, and it is estimated to increase to 4.7% in 2019 [19]. In effect, the EMDEs such as China, Brazil and India have played an increasingly vital role in the global economy.
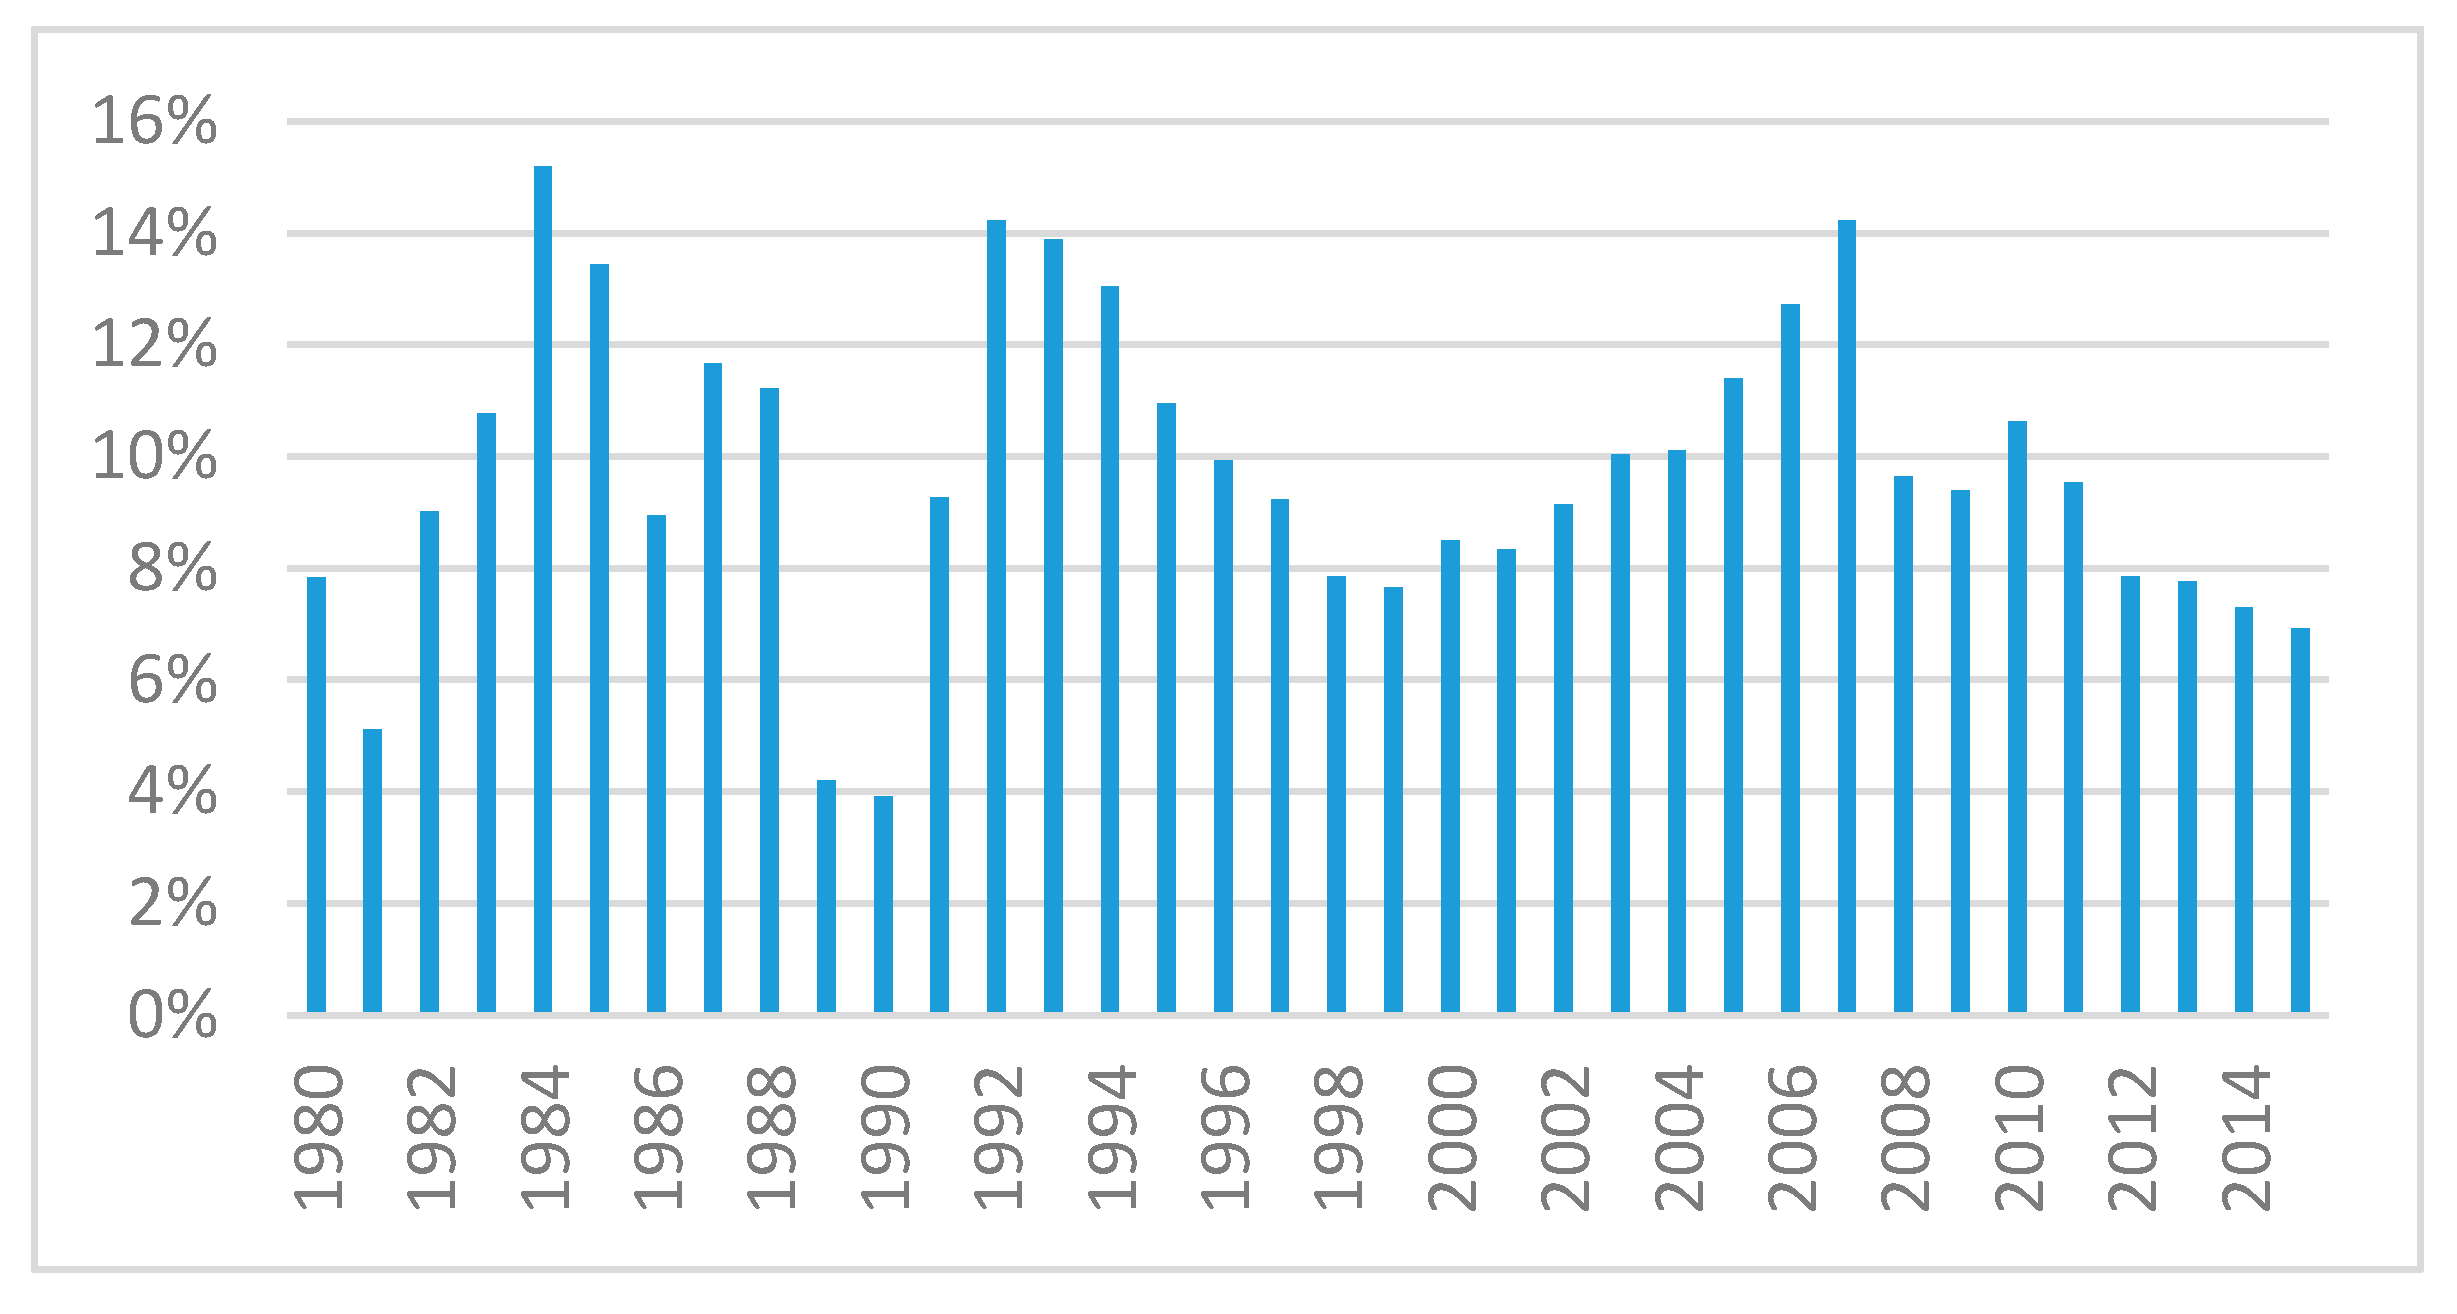
China, as a typical EMDE, has enjoyed rapid development since the reform in 1978. Benefiting from the opening-door policy, China maintained a growth rate approaching 10% in terms of gross domestic product (GDP) in the post-reform period (Figure 2) [39]. Despite the slight slowdown since 2012, such extraordinary growth performance has made China one of the world’s fastest-growing developing countries. However, due to the geographic environment and biased policies, the widening development gap between the remote western region and the coastal region also appeared to be one of the most severe challenges, which inhibited the sustained and stable development of China’s economy.
By the end of 2015, China’s total population had reached about 1.37 billion, of which urban population accounted for 56.10% (Table 2) [39]. Furthermore, China’s urban population is projected to be 827 million and the urbanization rate would be 57% by 2025 [40]. Such ambitious urbanization encourages enormous demands for infrastructure facilities, as pointed out by Hasan and Martin [41,42]. This trend is exemplified by highways, of which the network had doubled in size from 2004 to 2014, and high-speed rails boosting from 33% to 50% of the total length [19]. Notwithstanding the remarkable achievement, transport infrastructure in China is awaiting continuous development. As a response, many government initiatives such as the Belt and Road (B&R) place much emphasis on the development of transport projects. According to B&R strategies, an investment of US $157.10 billion is determined for the development of railways, roads and airports, with shares of 48%, 12% and 11% of the total, respectively, in the near future [19,43].
As one of the largest developing countries, China is made up of developing and developed regions. Massive development of TI projects has been increasing to match the pace of economy in developed regions, and it is now stretching over western China, which is a typical FDR for the time being. As illustrated in Table 3, transport infrastructure in western China has sustained rapid growth over the past decade; the density of railways in operation (DR) and density of highways (DH) amounted to 69.91 and 2690.37 km per 10,000 km2, respectively, by 2015 [39]. In addition, the population density (DP) of the western region increased to 540.70 thousand per 10,000 km2 at the end of 2015. In parallel with huge demand for new TIs in this FDR, a great deal of established infrastructure needs maintenance and improvement. Thus, western China is a hotspot where TI projects will prosper in the foreseeable future.
Compared with those developed provinces in the eastern region such as Beijing, Guangdong, and Shanghai (as depicted in Table 3), western China is sparsely populated and characterized by culture, ethnic minorities, religion, poor public services, and undeveloped economies [44]. In this sense, obstacles to TI development in this FDR must be covert and perplexing, and they appear in a different fashion. Some of them must be identical to those identified from the perspective of developing countries, and others may be obscure. Therefore, TI projects in western China are deemed to be a good case for examination in this study.
3.2. Methods
It is quite hard, if not impossible, to collect practical evidence to identify the spectrum of the barriers in FDRs. Questionnaire survey was thus considered a useful method. Bearing this in mind, a questionnaire was designed based on the literature and current practices in China to obtain information on the barriers known to practitioners and academicians. The main steps are presented as follows.
3.2.1. Formulation of Barriers
First, literature is reviewed extensively to extract those barriers recognized in previous studies. The publications reviewed contain textbooks, academic reports, journal articles and conference proceedings. For simplicity, a list of potential barriers resulted from the review is given in Table A1.
Second, a pilot was tested among five professionals, as described in Table 4, through in-depth interview. Two of the professionals were from TI construction enterprises, one from governmental authority in charge of infrastructure development, and two were scholars from universities. All of the participants had over ten years of related experience in this area.
The interview was directed to judge the rigorousness and comprehensiveness of the factors by considering TI development in western China. Comments of the professionals were used to improve the tentative factors.
Third, case study was adopted to complement the tentative factors. Consequently, a list of 37 barriers was derived as shown in Table A2 [6,23,25,26,27,28,29,30,31,36,40,45,46,47,48].
Lastly, questionnaire survey was conducted to collect professionals’ opinion on the established barriers. The questionnaire comprises three sections. The first section gives an introduction to the questionnaire and instructions for respondents. The necessity and importance of this research work, confidentiality of the survey, and contacts for respondents to use are also included. The second section aims to collect respondents’ profiles with respect to educational background, years of work, organizational types, and transport project types. In the last part, respondents are requested to mark an importance level per factor using the 5-point Likert scale, where 5 stands for important, 1 for unimportant, and 3 for neutral [49].
For convenience, the questionnaire was distributed using email and an online platform. The targeted respondents are line managers and senior managers from top ten Chinese TI construction firms, experts, governmental officers, and consulting companies. A snowball sampling technique was adopted to increase the response rate. Respondents were requested to invite more qualified professionals through their social networks to participate in this survey.
3.2.2. Respondents’ Profiles
A total of 458 questionnaires were sent out and 88 returned, giving a response rate of 19.21%. However, two questionnaires were found invalid due to incomplete answers. As shown in Figure 3, a vast majority of the respondents were line managers, senior managers, and academics. Of all participants, 40% held a PhD degree and 57% had more than six years of TI-related experience. They had participated in at least one type of TI project, of which road projects share was 81%. Since the distribution of respondents is extensive, the composition of respondents was considered useful to provide unbiased evaluation to the investigation.
3.3. Data Analysis
Data analysis was conducted using the Statistical Package for Social Sciences (SPSS). Preliminary examination was conducted to test whether the collected data are appropriate for detailed analysis, namely the reliability analysis. The reliability represents the consistency or stability of the results obtained from the questionnaire survey, and the commonly used methods of reliability test are Cronbach’s coefficient alpha, Split-half reliability and Kuder–Richardson reliability. According to Crocker and Algina, alpha coefficient is the lower bound for reliability estimation, thus the alpha coefficient is better than Split-half [50]. Additionally, the Kuder–Richardson reliability only applies to true–false item, i.e., test data of binary score. As a result, Cronbach’s coefficient alpha has the advantage of measuring internal consistency among factors and reliability of the five-point Likert scale used in opinion questionnaire [51]. Cronbach’s coefficient ranges between 0 (no consistency) and 1 (complete consistency). In this study, Cronbach’s coefficient is 0.970, indicating strong internal consistency and the reliability of the scale used. Thus, the sample is treated as a whole for conducting ranking analysis and factor analysis.
3.3.1. Ranking Analysis
The approach of ranking analysis based on mean scores was employed to develop a descending order list of importance level. As revealed in previous studies, this analytical approach is helpful to detect any barrier that was considered critical by respondents [52,53]. Given two items with same mean values, the item with a higher standard deviation (SD) deserves a lower ranking [54].
As shown in Table 5, there are 20 items with mean values larger than average (2.94); “harsh regional climate” (F14) and “cost overrun” (F04) have same mean values (3.02) in importance and different values in standard deviation (SD).
The proposed U-framework will be considered valid if all of the identified factors match the three dimensions strictly, i.e., macro environment, local environment, and the construction process. Therefore, the links between factors and the three dimensions entered into further examination and the results are listed in Table 6.
3.3.2. Factor Analysis
Factor analysis (FA) has been broadly used to detect any multivariate relationships between factors [55,56]. The main steps include analyzing the internal structure, detecting common underlying dimensions, and reducing variables into a more readable framework [56]. Preliminary examinations, including Kaiser–Meyer–Olkin (KMO) and Bartlett’s sphericity test, are essential to look at whether the sample is suitable for further factor analysis [57].
The value of KMO ranges from 0 to 1, where 1 means “complete correlation”, indicating that the variables are strongly linked and relatively compact [56]. In reverse, if the KMO value equals 0, it means no correlations between variables and inappropriateness for factor extraction. The Bartlett’s test of sphericity is built on the correlation matrix of variables as the starting point is to test whether it is an identity matrix or not. If the Bartlett’s sphericity statistic is relatively large and the corresponding probability value is less than the associated significance level, it means a correlation among the original variables, and the suitability of the correlation matrix for factor extraction [58,59].
As calculated, the value of Bartlett’s test of sphericity is 1462.77 with the significance at a 0.000 level, indicating an acceptable correlation level among the original variables. KMO statistic is 0.903, larger than the 0.5 threshold, implying that the sample meets the application requirements for FA. The results of KMO and Bartlett’s sphericity test suggest that the same underlying dimensions and specific structure exist among highly ranked factors [57].
Four steps were then taken in the study: principal component analysis, selecting factors with eigenvalues greater than 1, matrix rotation, and determining the number of factor. Twenty variables were involved in the principal component analysis. Three underlying grouped factors were extracted and retained with eigenvalues greater than 1 (Table 7), explaining 70.42% of variance in the survey data. In view of the correlation between variables, direct oblimin rotation of principal component analysis was adopted to interpret the variables. In line with this rotation method, oblique rotation can better reflect the real psychological phenomenon and provide more useful information than orthogonal rotation [60,61].
The three clusters obtained from the principal component analysis were further computed to derive their factor loadings to mirror the association between factors and variables. According to Hair et al., either the communality or factor loading below 0.5 is not acceptable [62]. Given the sample size of this study, any factor loading with the value below 0.55 should be excluded from analysis [57]. Thus, the variable “high pressure of debt repayment” (F11) and “lack of local R&D institutes and services” (F30) were removed eventually.
The derived cluster matrix for the remaining 18 barriers is shown in Table 8. As displayed in this table, Cluster 1 is composed of variables F04, F05, F02, F09, F07, F24, F12, F10, F25, and F13; Cluster 2 includes variables F23, F15, and F29; and Cluster 3 contains variables F32, F14, F08, F27, and F37. The variables under these three clusters spell out governmental administration of transport infrastructure and project management, construction technology and cost overrun, and geographical and economic conditions. Based on initial interpretation and inherent relationships, the three clusters are labeled as follows: administration on transport infrastructure (Cluster 1), construction technology and cost management (Cluster 2), and geographical and economic conditions (Cluster 3).
4. Findings and Discussion
4.1. Cluster 1: Administration on Transport Infrastructure
This cluster accounts for 55.148% of the total variance (Table 7), and it consists of “fragmentation of administrative system” (F04), “lack of sustainable and effective policies” (F05), and “excessive transport planning changes” (F02). While the factors included concur with previous studies on the close ties of government to TI development [34,63], the barrier “excessive transport planning changes” (F02), referring to frequent adjustment of planning in the policymaking process, is a new one that can be easily found in western China. In essence, government plays dual roles, namely the client and regulator, in this domain. These two roles are complementary and competing on many occasions. As a result, inconsistent decision-making from different governmental departments can surface, suggesting that they might not be able to serve as focal points for inter-ministerial and interagency coordination. Furthermore, the dual roles of client and regulator played by government in infrastructure projects, typically, are not positive. The reasons are two-fold: (1) as a regulator, the decentralized decision-making structure causing multiple management system leads to ineffective management and buck-passing among different departments; and (2) as a client, the administrative monopoly in the infrastructure industry results in the lack of competition, which may undermine the positivity of this role.
The lack of administrative system is embodied with ineffective political commitment, frequent changes of transport planning, and massive short-lived policies [25]. Moreover, other problems with governmental administration such as bureaucracy, institutional incompletion, lack of penal systems and non-transparency to the public in the planning and policy-making phase have exacerbated the influence of administration on TI development in the region. The remainder of factors under this cluster are concerned with governmental ability to manage a TI project. In developing countries, regulations are often formulated to impede the entrance of foreign construction business. Thereby, the interests of domestic firms can be secured [64]. Less participation of foreign competitors in the sector is unbeneficial to the advancement of innovation and professionalism. This in turn weakens the development potential of infrastructure in less developed countries [65]. The absence of opportunities to learn from foreign partners suggests that domestic firms would find it harder to improve project management, finance, labor, and construction technology by themselves [66].
4.2. Cluster 2: Construction Technology and Cost Management
This cluster shares 8.488% of the total variance (Table 7) with the focus on construction issues in the execution phase. Technology is one of the most indispensable production factors for TI projects, especially in an intricate socioeconomic context [36]. In comparison with monotonous plain topography in the coastal region, TI in western China requires more advanced technologies to mitigate geological and environmental restriction. However, due to limited access to new technologies and up-to-date information, construction firms in this region are accustomed to obsolete technologies. In addition, higher cost of innovation weakens the willingness of relevant firms to apply or to purchase technologies from overseas. Furthermore, even though some latest technologies are supplied via not-for-profit agencies and public sector clients, problems with technological application may still be encountered [67,68].
As found in previous studies, cost is a major barrier of infrastructure construction in developing countries [29,30]. Evidence suggests that nine out of ten megaprojects have suffered over budget [69]. This is real in western China. In effect, high requirements for technology, long distance of material transportation, and widening deficit for labor have raised the cost of TI development in the territory. Apart from frontline workers that are available from local sectors, most of construction professionals are recruited from the coastal region [70]. Due to insufficient public budget, governments in developing countries have to face an increasing monetary burden of TI projects [71]. In addition, inadequate capacity of cost management in terms of estimation, planning and control will result in frequent occurrence of cost overrun [28].
4.3. Cluster 3: Geographical and Economic Conditions
Cluster 3 account for 6.786% of the total variance (Table 7) in explaining the critical barriers. This cluster spells out geographical and economic interfaces between TI construction and FDR attributes. Geographical obstacles distribute widely in western China, especially in those remote regions with inclement geographical terrain. In effect, the so-called geography concerning topography, landform and climate have an impact on TI development. For instance, irregular geographical surroundings would not only impose the difficulty in conducting field survey and schematic design in the pre-phase of construction process, but also pose considerable challenges onto construction. In the meantime, organization of onsite construction activities ought to stay flexible in interpreting regional climatic characteristics to avoid cost overrun and time delay [72]. Hence, it is implied that a thorough evaluation of local situations should be conducted prior to the development of FDR’s TI project.
Due to the long development period of time, assumptions given to a TI project at an early stage might not happen as anticipated at the end. This is attributable to considerable changes on raw materials, labor, construction equipment, building materials and energy, and economic prosperity that can be encountered in a local socioeconomic context [73,74]. In addition, investment growth in China has slowed down sharply from 21% (2012) to 10% (2015), rebalancing towards more sustainable style, and the slowdown in investment growth mirrors deteriorating construction business confidence and weakening return prospects [19].
4.4. Implications of the Proposed U-Framework
The barriers discussed above fall into three groups, which coincide with the dimensions of the proposed U-framework. Specifically, the barriers in Cluster 1 refer to the macro-environment dimension; Cluster 2 is concerned with the construction process; and Cluster 3 is about local environment. Consequently, the proposed framework can be echoed using the case of western China. The result demonstrates the reliability of the U-framework, suggesting that it can be used as an approach to provide the process and framework for TI development in other developing countries.
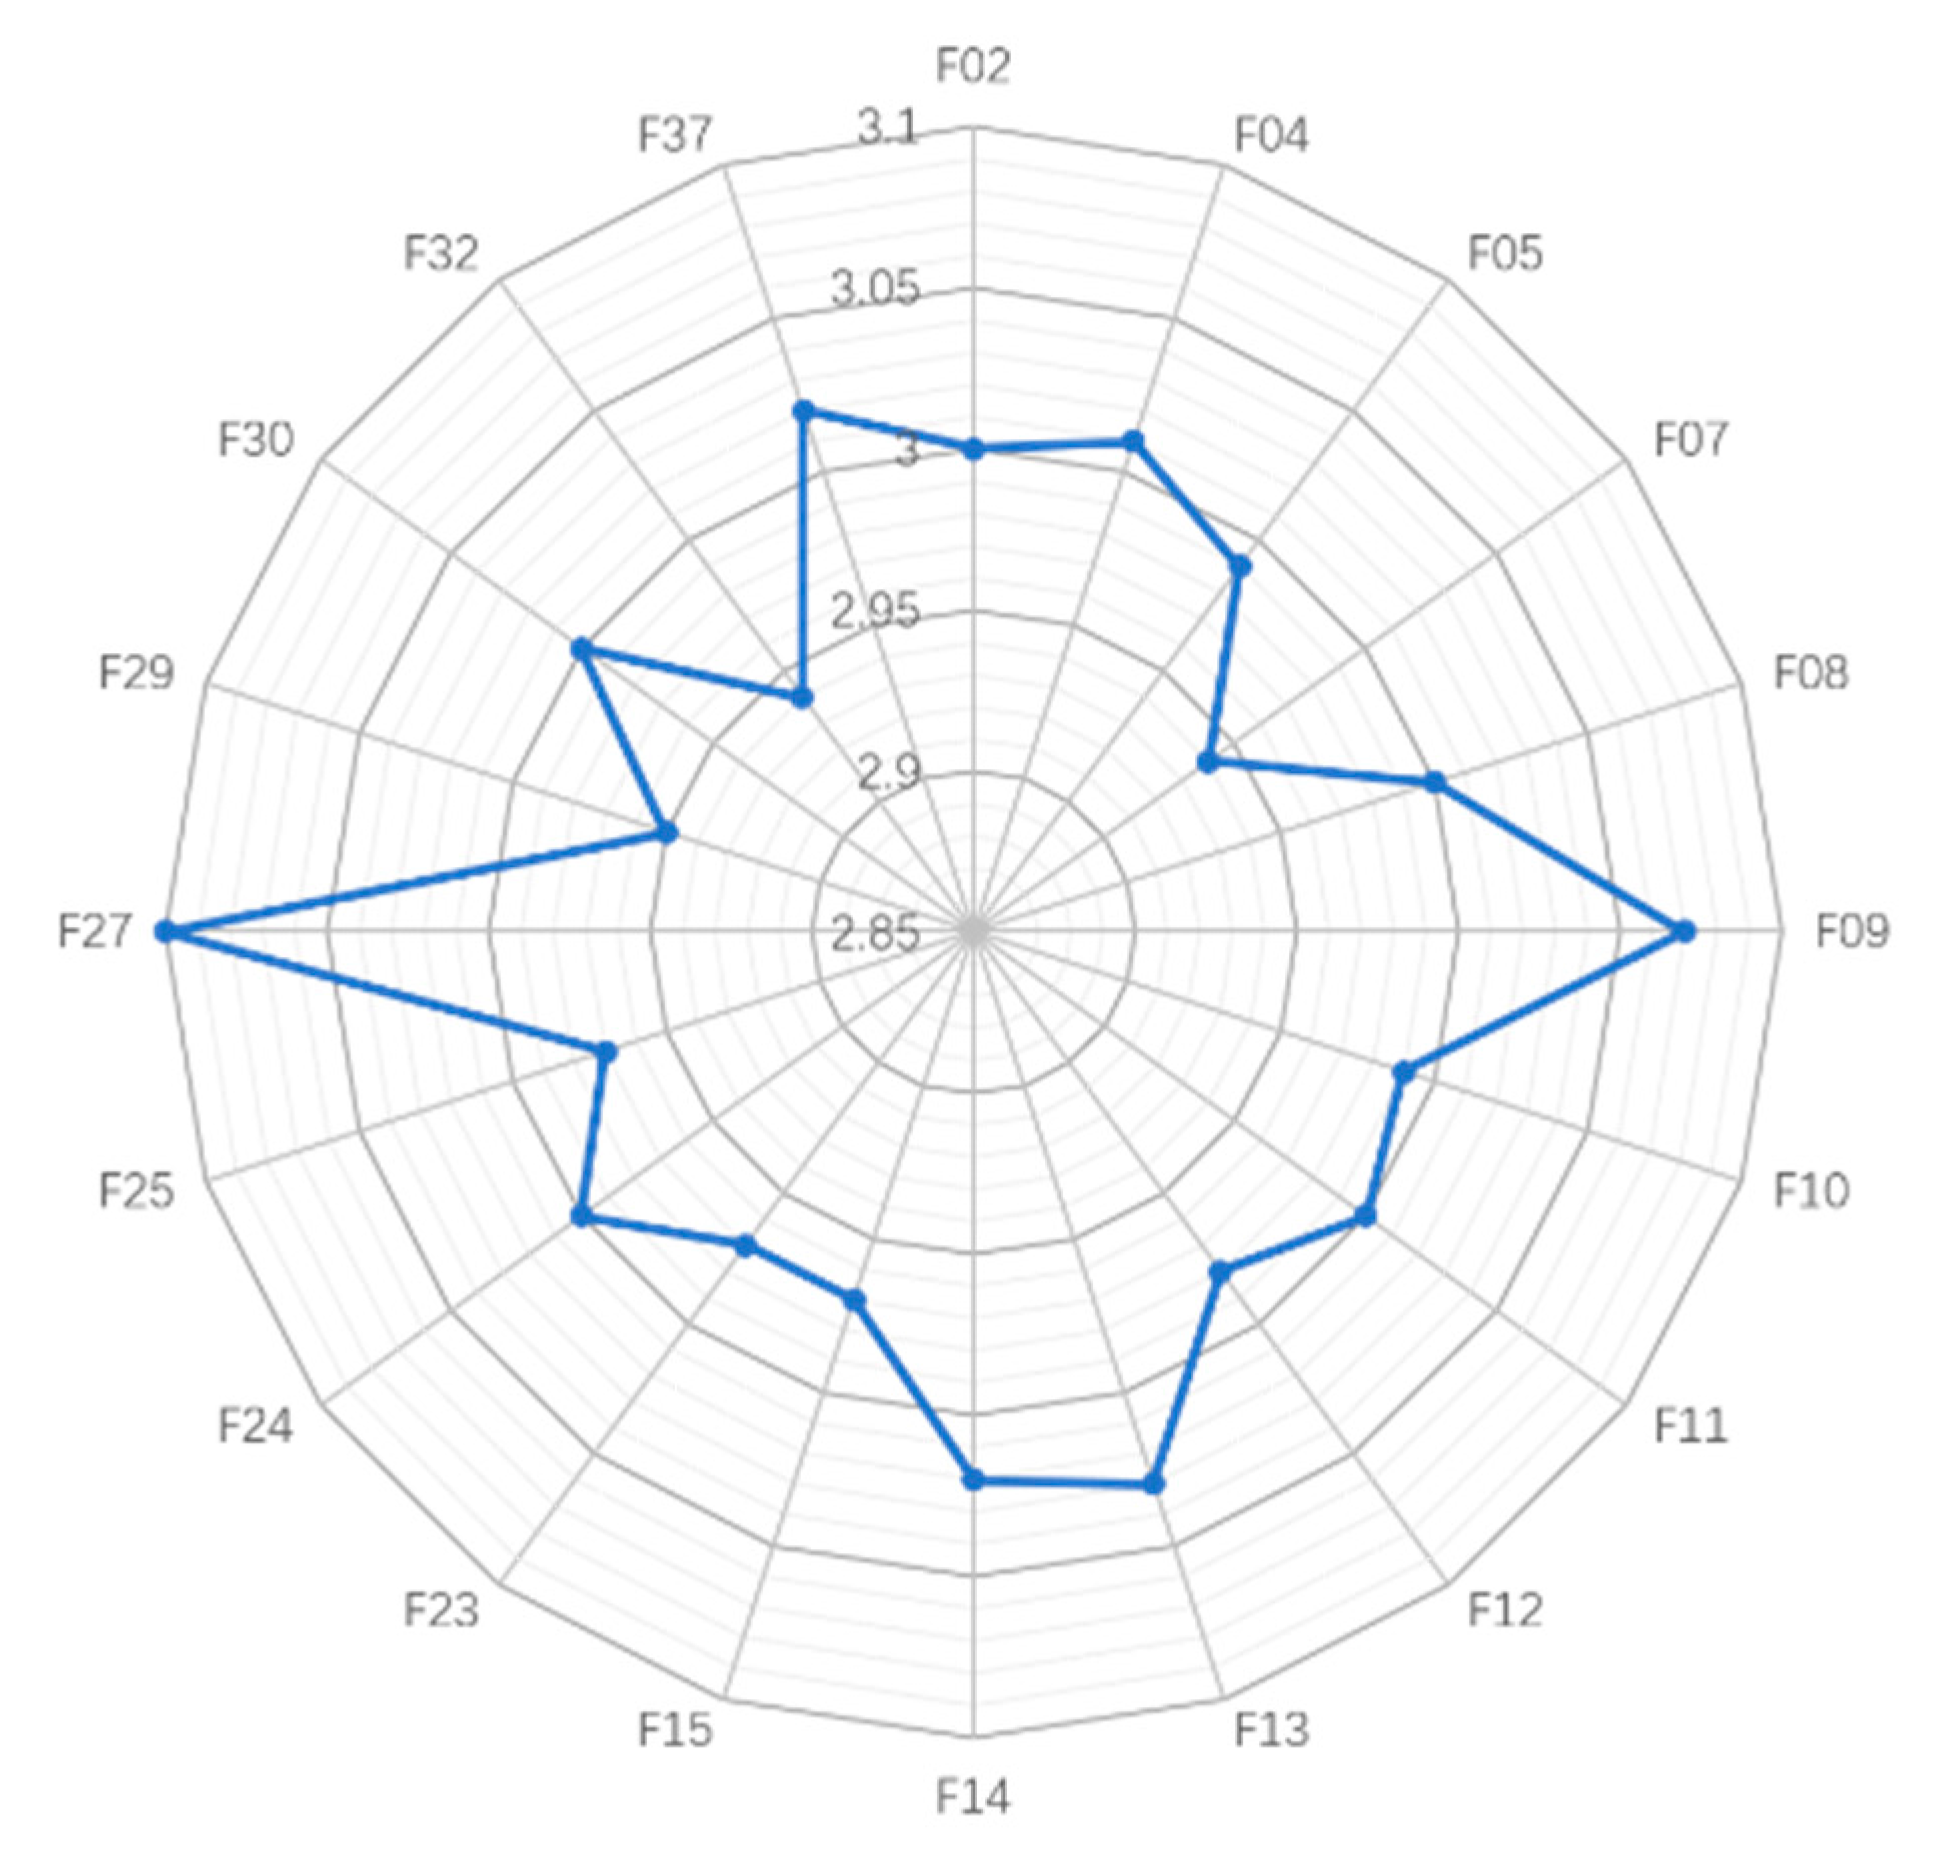
The U-framework is of usefulness to the management of TI development in FDRs. As shown in Figure 4, “difficulty in survey and design” (F27) is ranked first with the highest mean score. This can be verified by an infrastructure case in western China, namely the Sichuan-Tibet railway (Chengdu to Ya’an section started in December 2014). The railway line starts from an altitude of 500 m in the Chengdu Plain, and it spreads out all the way up to an altitude of over 4000 m of the Qinghai-Tibet Plateau. Unstable topography and geographic conditions have led it to be the most difficult project in survey and design [75]. Following this item are “weak support from economy” (F09) and “insufficient funding” (F13), ranked second and third, respectively. In recent years, the shortage of budgets has increasingly become a key factor impeding the development of transport infrastructure in western China [76]. In this context, the Chinese government has to enforce some national policies to favor social capitals to invest in TI projects. Although the research result is based on the Chinese empirical evidence, it shed light on the implementation of TI projects in other FDRs.
In previous studies, approaches to classifying the determinants of infrastructure development vary significantly from one study to another. Shen et al. divided the indicators of infrastructure project sustainability into three categories: economic, social, and environmental [77]. The work by Long et al. attributed the problems of large construction projects to be organizational, project attributes-related, coordination-related and environmental problems [36]. To improve the perception of infrastructure development, Park and Kwon decomposed infrastructure practices in Korea into five phases: planning and engineering, project budget, bid and contract, construction, and post-construction [53]. There appears to be no apparent agreements among researchers on theoretical construct for exploring the barriers, and this will definitely undermine the reasonableness of the results. Therefore, the proposed U-framework can not only elaborate the coherence of the obstacles from a different angle, but also contribute a new approach of structuring the barriers to the body of knowledge.
5. Conclusions
Transport infrastructure is known for its gigantic contributions to human well-being and sustainable development in terms of social welfare, economy and environment in the international arena. Nonetheless, the development of transport infrastructure projects in fast developing regions (FDRs) is subject to considerable barriers, and approaches to identifying the obstacles have not received adequate attention. This study was situated in the context of western China, and the key barriers identified are three-faceted, namely administration on transport infrastructure, construction technology and cost management, and geographical and economic conditions. These three dimensions spell out a U-framework for structuring the barriers in an effective way.
The top five barriers refer to difficulty in survey and design, weak support from economy, insufficient funding, harsh regional climate, and cost overrun. Whilst part of these factors were revealed in previous studies, it is implied that adequate capacity of local government, technology innovation, cost management efficiency, and ability to cope with geographical environment deserve much attention in FDRs. Moreover, the barriers-based checklist presented in this paper can not only help decision makers to prepare and implement TI projects in China as well as other developing countries, but also to revise and establish corresponding policies or guidelines on the planning, financing, construction, and management of infrastructure. The identification of strategic barriers therefore enables stakeholders to improve the efficiency and sustainability of infrastructure development.
This study probably offers the latest research on transport infrastructure development in a smaller part of a developing country. However, due to space limitations, this paper will not elaborate further on how the barriers are encountered in reality and how they are to be handled. While the proposed framework may be applied in developing countries and elsewhere, it is recommended to collect empirical evidence to attain more insights.
Acknowledgments
The authors are grateful to Chongqing University for financing this research project under the Fundamental Research Funds for the Central Universities, No. 106112016 CDJSK 03 XK 08. Gratitude is also due to the anonymous reviewers who put forward many meaningful suggestions.
Author Contributions
Kunhui Ye contributed to the conception of the study and helped perform the analysis with constructive discussions. Tianyi Nie contributed significantly to analysis and manuscript preparation, performed the data analyses, and wrote the manuscript.
Conflicts of Interest
The authors declare no conflict of interest.
Appendix A

Table A1.
Barriers impeding the development of infrastructure.
| References 1 | a | b | c | d | e | f | g | h | i | j | k | l | m | n | o | |
|---|---|---|---|---|---|---|---|---|---|---|---|---|---|---|---|---|
| Factors | ||||||||||||||||
| Financial condition | Economic return | √ | √ | √ | √ | |||||||||||
| Capital funding | √ | √ | √ | √ | √ | |||||||||||
| Perceived costs | √ | √ | √ | √ | ||||||||||||
| Changing markets | √ | √ | ||||||||||||||
| Governmental administration | Related policies | √ | √ | √ | √ | |||||||||||
| Politicized decision | √ | √ | √ | |||||||||||||
| Government approval | √ | |||||||||||||||
| Regulation and institution | √ | √ | √ | √ | ||||||||||||
| Corruption | √ | √ | ||||||||||||||
| Project management | √ | |||||||||||||||
| TI planning | Project planning | √ | ||||||||||||||
| Rapid urbanization | √ | |||||||||||||||
| Social and culture | Public support | √ | ||||||||||||||
| Social equity | √ | |||||||||||||||
| Land acquisition | √ | √ | ||||||||||||||
| Demographic pattern | √ | |||||||||||||||
| Construction technology | Information technology | √ | √ | √ | ||||||||||||
| Innovation and research | √ | √ | √ | |||||||||||||
| Design rework | √ | |||||||||||||||
| The choice of technology | √ | |||||||||||||||
| Natural environment | Climate variations | √ | √ | |||||||||||||
| Physiographic characteristics | √ | |||||||||||||||
| Environmental clearances | √ | |||||||||||||||
| Pollution | √ |
Table A2.
Barriers impeding the development of transport in western China.
| Code | Obstacle Factors | Sources | ||
|---|---|---|---|---|
| Literature | Interview | Case Study | ||
| F01 | Lack of integrity, strategic and forward-looking transport planning | B; C | Chongqing Jiangbei Airport | |
| F02 | Excessive transport planning changes | [25,30] | B | |
| F03 | Conflicts and coordination between regions | E | Dazhou-Chongqing High Speed Railway | |
| F04 | Fragmentation of administrative system | [25,36] | D | |
| F05 | Lack of sustainable and effective policies | [44,48] | D | Metro Line 1 of Guiyang |
| F06 | Slow government permit and approval | [31] | C | |
| F07 | Improper monitoring and control | [27,29] | ||
| F08 | Macroeconomic downturn | [30,36] | A | |
| F09 | Weak support from economy | E | Delingha Airport | |
| F10 | Poor financial environment | [6,26] | Guilin-Liuzhou Expressway | |
| F11 | High pressure of debt repayment | C | ||
| F12 | Heavy tax burden of construction firms | A | ||
| F13 | Insufficient funding | [36,40] | ||
| F14 | Cost overrun | [28,29] | A; B | Guiyang-Guangzhou High-speed Railway |
| F15 | Ineffective cost management | D | ||
| F16 | Cultural difference and conflicts | C | Delingha Airport | |
| F17 | Complex local social environment | [47] | Southern Xinjiang railway | |
| F18 | Ideas behind | B; E | ||
| F19 | Thinly populated area | Lanzhou-Xinjiang High-speed Railway | ||
| F20 | Difficulty in dealing with existing infrastructure | E | ||
| F21 | Weak infrastructure supporting | A | Chengdu Shuangliu International Airport | |
| F22 | Problems of land acquisition and resettlement | [25] | Nanning-Kunming Railway | |
| F23 | Obsolete technical standards | [36,46] | B | |
| F24 | Multiple technical problems | Lanzhou-Xinjiang High-speed Railway | ||
| F25 | Insufficient sharing and communication of technical experience | [29,30] | ||
| F26 | Lack of IT development and application | [30,36] | B | |
| F27 | Difficulty in survey and design | C;D | The Qinghai-Tibet Railway | |
| F28 | Inadequate capacity of project management | E | ||
| F29 | Lack of innovative application | [36,46] | B | |
| F30 | Lack of local R&D institutes and services | [46] | ||
| F31 | Lack of related composite talents | D; E | ||
| F32 | Complex topography and landform | [29] | A; B | Qinghai-Tibet Railway |
| F33 | Happening of natural disaster | C | Sichuan-Tibet Highway | |
| F34 | Land resource shortage | [30] | ||
| F35 | Fragile ecological environment | [29] | Nanning-Kunming Railway | |
| F36 | Complex geological structure | Shenfu Expressway | ||
| F37 | Harsh regional climate | [29,36] | A | Lajishan Tunnel |
References
- WCED. World Commission on Environment and Development: Our Common Future; Brundtland Report; Oxford University Press: New York, NY, USA, 1987. [Google Scholar]
- Marques, R.; Da Cruz, N.; Pires, J. Measuring the sustainability of urban water services. Environ. Sci. Policy 2015, 54, 142–151. [Google Scholar] [CrossRef]
- Bueno, P.C.; Vassallo, J.M.; Cheung, K. Sustainability assessment of transport infrastructure projects: A review of existing tools and methods. Transp. Rev. 2015, 35, 1–28. [Google Scholar] [CrossRef]
- Stiglitz, J.E. The Price of Inequality: How Today’s Divided Society Endangers Our Future; W.W. Norton & Company Publishing: New York, NY, USA, 2012. [Google Scholar]
- Hooper, E.; Peters, S.; Pintus, P. To What Extent Can Long-Term Investment in Infrastructure Reduce Inequality? Banque de France Working Paper No. 624. 2017. Available online: https://ssrn.com/abstract=2952365 (accessed on 17 August 2017).
- Badu, E.; Owusu-Manu, D.G.; Edwards, D.J.; Holt, G.D. Analysis of Strategic Issues Underpinning the Innovative Financing of Infrastructure within Developing Countries. J. Constr. Eng. Manag. 2013, 139, 726–737. [Google Scholar] [CrossRef]
- Faturechi, R.; Miller-Hooks, E. A Mathematical Framework for Quantifying and Optimizing Protective Actions for Civil Infrastructure Systems. Comput. Aided Civ. Infrastruct. Eng. 2014, 29, 572–589. [Google Scholar] [CrossRef]
- World Bank. World Development Report 1994: Infrastructure for Development; Oxford University Press: Oxford, UK, 1994; pp. 1–12. [Google Scholar]
- Ye, X.; Ma, L.; Ye, K.; Chen, J.; Xie, Q. Analysis of regional inequality from sectoral structure, spatial policy and economic development: A case study of Chongqing, China. Sustainability 2017, 9, 633. [Google Scholar] [CrossRef]
- Chen, J.; Chen, J.; Miao, Y.; Song, M.; Fan, Y. Unbalanced development of inter-provincial high-grade highway in China: Decomposing the Gini coefficient. Transp. Res. D 2016, 48, 499–510. [Google Scholar] [CrossRef]
- Lakshmanan, T.R. The Broader Economic Consequences of Transport Infrastructure Investments. J. Transp. Geogr. 2011, 19, 1–12. [Google Scholar] [CrossRef]
- Melo, P.C.; Graham, D.J.; Brage-Ardao, R. The Productivity of Transport Infrastructure Investment: A Meta-Analysis of Empirical Evidence. Reg. Sci. Urban Econ. 2013, 43, 695–706. [Google Scholar] [CrossRef]
- Duncan, T. Findings from Studies of Poverty Impacts of Road Projects; Asian Development Bank: Manila, Philippines, 2007. [Google Scholar]
- Pant, R.; Hall, J.W.; Blainey, S.P. Vulnerability assessment framework for interdependent critical infrastructures: Case-study for Great Britain’s rail network. Eur. J. Transp. Infrastruct. Res. 2016, 16, 174–194. [Google Scholar]
- Aritua, B. Unlocking the Potential of Freight Logistics in India; World Bank: Washington, DC, USA, 2016. [Google Scholar]
- Sahu, K.K. Trend, Growth, and Problems of Road Transport in India. In Handbook of Research on Economic, Financial, and Industrial Impacts on Infrastructure Development; Das, R.C., Ed.; IGI Global Publication: Hershey, PA, USA, 2017; pp. 201–223. [Google Scholar]
- Ellis, P.; Roberts, M. Leveraging Urbanization in South Asia: Managing Spatial Transformation for Prosperity and Livability; World Bank: Washington, DC, USA, 2016. [Google Scholar]
- Inderst, G. Infrastructure Investment, Private Finance, and Institutional Investors: Asia from a Global Perspective; Asian Development Bank Institute Working Paper No. 555. 2016. Available online: http://dx.doi.org/10.2139/ssrn.2721577 (accessed on 26 March 2017).
- World Bank. Global Economic Prospects, January 2017: Weak Investment in Uncertain Times; World Bank: Washington, DC, USA, 2017. [Google Scholar]
- Rana, I.A.; Bhatti, S.S.; Saqib, S.E. The spatial and temporal dynamics of infrastructure development disparity–from assessment to analyses. Cities 2017, 63, 20–32. [Google Scholar] [CrossRef]
- Mangone, G. Constructing hybrid infrastructure: Exploring the potential ecological, social, and economic benefits of integrating municipal infrastructure into constructed environments. Cities 2016, 55, 165–179. [Google Scholar] [CrossRef]
- Shen, L.; Jiang, S.; Yuan, H. Critical indicators for assessing the contribution of infrastructure projects to coordinated urban-rural development in china. Habitat Int. 2012, 36, 237–246. [Google Scholar] [CrossRef]
- Li, Y.; Taylor, T.R.B. Modeling the Impact of Design Rework on Transportation Infrastructure Construction Project Performance. J. Constr. Eng. Manag. 2014, 140, 04014044. [Google Scholar] [CrossRef]
- Chen, L.; Manley, K. Validation of an Instrument to Measure Governance and Performance on Collaborative Infrastructure Projects. J. Constr. Eng. Manag. 2014, 140, 04014006. [Google Scholar] [CrossRef] [Green Version]
- Dang, T.H.G.; Pheng, L.S. Critical Factors Affecting the Efficient Use of Public Investments in Infrastructure in Vietnam. J. Infrastruct. Syst. 2015, 21, 05014007. [Google Scholar]
- Khasnabis, S.; Dhingra, S.L.; Mishra, S.; Safi, C. Mechanisms for Transportation Infrastructure Investment in Developing Countries. J. Urban Plan D 2010, 136, 94–103. [Google Scholar] [CrossRef]
- Stough, R.R. Institutional Barriers to Port Infrastructure and Harbor Development. IATSS Res. 2005, 29, 30–40. [Google Scholar] [CrossRef]
- Flyvbjerg, B. Public Planning of Mega-Projects: Overestimation of Demand and Underestimation of Costs. In Decision-Making on Mega-Projects: Cost-Benefit Analysis, Planning and Innovation; Priemus, H., Flyvbjerg, B., Van Wee, B., Eds.; Edward Elgar Publishing: Cheltenham, UK, 2008; pp. 120–144. [Google Scholar]
- LaBadie, K. Identifying Barriers to Low Impact Development and Green Infrastructure in the Albuquerque Area. Master’s Thesis, The University of New Mexico, Albuquerque, New Mexico, May 2010. [Google Scholar]
- Priemus, H. Mega-projects: Dealing with Pitfalls. Eur. Plan. Stud. 2010, 18, 1023–1039. [Google Scholar] [CrossRef]
- Vilventhan, A.; Kalidindi, S.N. Approval Risks in Transportation Infrastructure Projects in India. In Proceedings of the Construction Research Congress 2012: Construction Challenges in a Flat World, Construction Research Congress, West Lafayette, IN, USA, 21–23 May 2012; American Society of Civil Engineers: Reston, VA, USA, 2013. [Google Scholar]
- Luke, R.; Savage, C.J.; Jenkins, A.K.; Fransman, L. The failure of transport megaprojects: Lessons from developed and developing countries. In Proceedings of the Pan-Pacific Conference XXXIV: Designing New Business Models in Developing Economies, Lima, Peru, 29–31 May 2017. [Google Scholar]
- Ansar, A.; Flyvbjerg, B.; Budzier, A.; Lunn, D. Should we build more large dams? The actual costs of hydropower megaproject development. Energy Policy 2014, 69, 43–56. [Google Scholar] [CrossRef] [Green Version]
- Savage, C.J.; Jenkins, A.K. Will developing a gateway port in a developing country lead to ethical benefits for the populous: A case study of Walvis-Bay. In Proceedings of the 21st LRN Annual Conference and PhD Workshop 2016 Doing the Right Thing—Ethical Issues in Logistics and Supply Chain, Hull, UK, 7–9 September 2016. [Google Scholar]
- Marques, R.; Berg, S. Risks, contracts and private sector participation in infrastructure. J. Constr. Eng. Manag. 2011, 137, 925–933. [Google Scholar] [CrossRef]
- Long, N.D.; Ogunlana, S.; Quang, T.; Lam, K.C. Large Construction Projects in Developing Countries: A Case Study from Vietnam. Int. J. Proj. Manag. 2004, 22, 553–561. [Google Scholar] [CrossRef]
- Cantarelli, C.C.; Wee, B.V.; Molin, E.J.E.; Flyvbjerg, B. Different Cost Performance: Different Determinants?: The Case of Cost Overruns in Dutch Transport Infrastructure Projects. Transp. Policy 2012, 22, 88–95. [Google Scholar] [CrossRef]
- Minchin, R.E.; Lewis, D.W.; Mcleod, L. Improving Productivity on a Troubled Bridge Project. J. Constr. Eng. Manag. 2011, 137, 364–371. [Google Scholar] [CrossRef]
- Chan, A.P.C.; Lam, P.T.I.; Chan, D.W.M.; Cheung, E.; Ke, Y. Critical Success Factors for PPPs in Infrastructure Developments: Chinese Perspective. J. Constr. Eng. Manag. 2010, 136, 484–494. [Google Scholar] [CrossRef]
- Hasan, M.S. The Long-run Relationship between Population and per capita Income Growth in China. J. Policy Model. 2010, 32, 355–372. [Google Scholar] [CrossRef]
- Jacques, M. When China Rules the World; Penguin Books: Oxford, UK, 2011. [Google Scholar]
- Guan, Q.; Zhang, Y.; Wu, Y. Trillion Infrastructure, “One Belt, One Road” Gradually Reach its Climax. China Sci. Technol. Fortune Mag. 2015, 4, 30–31. (In Chinese) [Google Scholar]
- National Bureau of Statistics of China. China Statistical Yearbook 2016; China Statistics Press: Beijing, China, 2016. (In Chinese) [Google Scholar]
- Liu, Y.; Shui, C.; Zhang, N. The Construction of Transport System in Western China in the New Period: Development Dilemma and Ideas. Reform. Strateg. 2011, 27, 125–127. (In Chinese) [Google Scholar]
- Schweikert, A.; Chinowsky, P. National Infrastructure Planning: A Holistic Approach to Policy Development in Developing Countries. In Proceedings of the Engineering Project Organizations Conference, Rheden, The Netherlands, 10–12 July 2012. [Google Scholar]
- Klevas, V.; Streimikiene, D.; Kleviene, A. Sustainability Assessment of the Energy Projects Implementation in Regional Scale. Renew. Sustain. Energy Rev. 2009, 13, 155–166. [Google Scholar] [CrossRef]
- Mostafa, M.A.; El-Gohary, N.M. Semantic System for Stakeholder-Conscious Infrastructure Project Planning and Design. J. Constr. Eng. Manag. 2015, 141, 04014075. [Google Scholar] [CrossRef]
- Hermawan, F.; Rachmawati, T.; Wahyono, H.L. Does Demographic Pattern Matter for Sustainable Infrastructure Policy? Procedia Eng. 2015, 125, 481–488. [Google Scholar] [CrossRef]
- Dillman, D.A. Mail and Internet Surveys: The Tailored Design Method. J. Contin Educ. Health 2000, 30, 206. [Google Scholar]
- Crocker, L.; Algina, J. Introduction to Classical and Modern Test Theory; Holt, Rinehart & Winston: New York, NY, USA, 1986. [Google Scholar]
- Norusis, M.J. SPSS for Windows: Professional Statistics, Release 6.0; SPSS Inc.: Chicago, IL, USA, 1993. [Google Scholar]
- Mao, C.; Shen, Q.; Pan, W.; Ye, K. Major Barriers to Off-Site Construction: The Developers’ Perspective in China. J. Manag. Eng. 2015, 31, 04014043. [Google Scholar] [CrossRef]
- Park, H.S.; Kwon, S. Factor Analysis of Construction Practices for Infrastructure Projects in Korea. KSCE J. Civ. Eng. 2011, 15, 439–445. [Google Scholar] [CrossRef]
- Shen, Q.; Liu, G. Critical Success Factors for Value Management Studies in Construction. J. Constr. Eng. Manag. 2003, 129, 485–491. [Google Scholar] [CrossRef]
- Akintoye, A. Analysis of Factors Influencing Project Cost Estimating Practice. Constr. Manag. Econ. 2000, 18, 77–89. [Google Scholar] [CrossRef]
- Norusis, M. SPSS Statistics 17.0 Guide to Data Analysis; Prentice Hall Press: Upper Saddle River, NJ, USA, 2008. [Google Scholar]
- Hair, J.F.; Black, W.C.; Babin, B.J.; Anderson, R.E.; Tatham, R.L. Multivariate Data Analysis: A Global Perspective, 7th ed.; Pearson Education: Upper Saddle River, NJ, USA, 2010. [Google Scholar]
- Field, A.P. Discovering Statistics Using SPSS for Windows: Advanced Techniques for Beginner; Sage Publications: London, UK, 2000. [Google Scholar]
- Norusis, M. SPSS 17.0 Advanced Statistical Procedures Companion; Prentice Hall Press: Upper Saddle River, NJ, USA, 2009. [Google Scholar]
- Finch, H. Comparison of the Performance of Varimax and Promax Rotations: Factor Structure Recovery for Dichotomous Items. J. Educ. Meas. 2006, 43, 39–52. [Google Scholar] [CrossRef]
- Nunnally, J.C.; Bernstein, I.H. Psychometric Theory, 3rd ed.; McGraw-Hill: New York, NY, USA, 1994. [Google Scholar]
- Hair, J.F.; Anderson, R.E.; Tatham, R.L.; Black, W.C. Multivariate Data Analysis, 5th ed.; Prentice Hall Press: Upper Saddle River, NJ, USA, 1998. [Google Scholar]
- Kenny, C. Transport Construction, Corruption and Developing Countries. Transp. Rev. 2009, 29, 21–41. [Google Scholar] [CrossRef]
- Ackah, C.; Morrissey, O.; Appleton, S. Who Gains from Trade Protection in Ghana: A Household-level Analysis? University of Nottingham: Centre for Research in Economic Development and International Trade Research Paper No. 07/02. 2017. Available online: https://publications.banque-france.fr/sites/default/files/medias/documents/wp_624.pdf (accessed on 15 October 2016).
- Dang, T.H.G.; Pheng, L.S. Role of Construction in Economic Development: Review of Key Concepts in the past 40 Years. Habitat Int. 2011, 35, 118–125. [Google Scholar]
- Ofori, G. New Perspectives on Construction in Developing Countries; Spon Press: London, UK, 2012. [Google Scholar]
- Carrillo, P. Technology Transfer: A Survey of International Construction Companies. Constr. Manag. Econ. 1994, 12, 45–51. [Google Scholar] [CrossRef]
- Ngowi, A. Challenges Facing Construction Industries in Developing Countries. Build. Res. Inf. 2002, 30, 149–151. [Google Scholar]
- Flyvbjerg, B. What you should know about megaprojects and why: An overview. Proj. Manag. J. 2014, 45, 6–19. [Google Scholar] [CrossRef]
- Pan, D. Research on the Construction of Innovative Talents in Chongqing Transportation System. Transp. Enterp. Manag. 2008, 23, 21–22. (In Chinese) [Google Scholar]
- Gwilliam, K. Africa’s Transport Infrastructure: Mainstreaming Maintenance and Management; World Bank: Washington, DC, USA, 2011. [Google Scholar]
- Odeh, A.M.; Battaineh, H.T. Causes of Construction Delay: Traditional Contracts. Int. J. Proj. Manag. 2002, 20, 67–73. [Google Scholar] [CrossRef]
- Hertogh, M.J.C.M.; Baker, S.; Staal-Ong, P.L.; Westerveld, E. Managing Large Infrastructure Projects: Research on Best Practices and Lessons Learnt in Large Infrastructure Projects in Europe; AT Osborne BV: Baarn, The Netherlands, 2008. [Google Scholar]
- Lim, C.S.; Mohamed, M.Z. An Exploratory Study into Recurring Construction Problems. Int. J. Proj. Manag. 2000, 18, 267–273. [Google Scholar] [CrossRef]
- Xinhua News Agency. The Survey and Design of Sichuan-Tibet Railway: The Birth of the Biggest Roller Coaster in the World with the Largest Technical Difficulty. Available online: http://www.gov.cn/xinwen/2015-08/11/content_2911116.htm (accessed on 16 June 2016). (In Chinese)
- China News. Local Version of Micro-Stimulus or More than 6 Trillion, Source of Funding Is the Biggest Challenge. Available online: http://www.chinanews.com/cj/2014/08-07/6467153.shtml (accessed on 26 August 2016). (In Chinese).
- Shen, L.; Wu, Y.; Zhang, X. Key assessment indicators for the sustainability of infrastructure projects. J. Constr. Eng. Manag. 2011, 137, 441–451. [Google Scholar] [CrossRef]
Figure 1.
A proposed framework schemes.

Figure 2.
GDP growth rate at constant prices (%).

Figure 3.
Respondents’ profiles.

Figure 4.
Score distribution of the critical barriers.

Table 1.
Global real GDP growth (%).
| Year | World | EMDEs | Advanced Economies | Developing Countries | High-Income Countries | |
|---|---|---|---|---|---|---|
| Actual growth | 2014 | 2.7 | 4.3 | 1.9 | 4.4 | 1.9 |
| 2015 | 2.7 | 3.5 | 2.1 | 3.6 | 2.2 | |
| Estimates | 2016 | 2.3 | 3.4 | 1.6 | 3.5 | 1.6 |
| Projections | 2017 | 2.7 | 4.2 | 1.8 | 4.4 | 1.8 |
| 2018 | 2.9 | 4.6 | 1.8 | 4.8 | 1.8 | |
| 2019 | 2.9 | 4.7 | 1.7 | 4.9 | 1.7 | |
Table 2.
China’s population and its composition.
| Year | Urban | Rural | Total Population | ||
|---|---|---|---|---|---|
| Population | Proportion | Population | Proportion | ||
| 1980 | 191.40 1 | 19.39 | 795.65 | 80.61 | 987.05 |
| 1985 | 250.94 | 23.71 | 807.57 | 76.29 | 1058.51 |
| 1990 | 301.95 | 26.41 | 841.38 | 73.59 | 1143.33 |
| 1995 | 351.74 | 29.04 | 859.47 | 70.96 | 1211.21 |
| 2000 | 459.06 | 36.22 | 808.37 | 63.78 | 1267.43 |
| 2005 | 562.12 | 42.99 | 745.44 | 57.01 | 1307.56 |
| 2010 | 669.78 | 49.95 | 671.13 | 50.05 | 1340.91 |
| 2015 | 771.16 | 56.10 | 603.46 | 43.90 | 1374.62 |
1 Unit: million person.
Table 3.
Regional density of railways, highways and population since 1980s.
| Year | Western Region | Middle Region | Eastern Region | ||||||
|---|---|---|---|---|---|---|---|---|---|
| DR | DH | DP | DR | DH | DP | DR | DH | DP | |
| 1982 | 26.89 1 | 524.25 | 421.89 2 | 105.51 | 2146.25 | 2790.18 | 100.29 | 2484.57 | 3748.03 |
| 1985 | 28.14 | 545.79 | 434.94 | 106.98 | 2164.71 | 2870.53 | 106.51 | 2590.48 | 3868.67 |
| 1990 | 28.53 | 596.05 | 472.80 | 111.76 | 2356.36 | 3171.21 | 112.11 | 2871.45 | 4251.09 |
| 1995 | 29.55 | 641.30 | 502.36 | 115.67 | 2541.80 | 3347.96 | 116.45 | 3621.77 | 4472.05 |
| 2000 | 32.20 | 806.57 | 518.93 | 128.43 | 3114.69 | 3422.67 | 123.36 | 4340.47 | 4858.30 |
| 2005 | 40.18 | 1136.36 | 523.04 | 169.82 | 4508.82 | 3424.32 | 185.57 | 5630.91 | 5101.31 |
| 2010 | 52.37 | 2283.93 | 525.25 | 202.08 | 10709.35 | 3472.37 | 222.17 | 10862.47 | 5531.11 |
| 2015 | 69.91 | 2690.37 | 540.75 | 264.23 | 11916.10 | 3549.51 | 313.79 | 12269.85 | 5733.52 |
1 Unit: kilometers per 10,000 km2; 2 Unit: thousand person per 10,000 km2.
Table 4.
Profiles of the interviewees.
| Interviewee | Position | Enterprise Name | Type | Work Experience |
|---|---|---|---|---|
| A | Associate professor | XX Jiaotong University 1 | Academic | 26 2 |
| B | Full professor | XX Tiedao University | Academic | 25 |
| C | Project manager | China Railway Construction Group Co.,Ltd. | Industry | 15 |
| D | Project manager | China Communications construction company Ltd. | Industry | 16 |
| E | Official director | XX Transport Commission | Government | 11 |
1 The names of the interviewees are hidden for privacy; 2 Unit: year.
Table 5.
Ranking of the critical barriers in western China.
| Code | Mean | Standard Deviation | Rank | Code | Mean | Standard Deviation | Rank |
|---|---|---|---|---|---|---|---|
| F27 | 3.10 | 1.1105 | 1 | F32 | 2.94 | 1.3061 | 20 |
| F09 | 3.07 | 1.5157 | 2 | F26 | 2.93 | 1.1185 | 21 |
| F13 | 3.03 | 1.4820 | 3 | F06 | 2.92 | 1.2409 | 22 |
| F37 | 3.02 | 1.1204 | 4 | F31 | 2.92 | 1.2503 | 23 |
| F14 | 3.02 | 1.2757 | 5 | F20 | 2.91 | 0.9957 | 24 |
| F04 | 3.01 | 1.2152 | 6 | F28 | 2.91 | 1.0524 | 25 |
| F24 | 3.00 | 1.1310 | 7 | F33 | 2.91 | 1.2354 | 26 |
| F30 | 3.00 | 1.2759 | 8 | F19 | 2.90 | 1.1815 | 27 |
| F02 | 3.00 | 1.2940 | 9 | F35 | 2.90 | 1.2762 | 28 |
| F08 | 3.00 | 1.2940 | 10 | F01 | 2.88 | 1.6804 | 29 |
| F11 | 3.00 | 1.2940 | 11 | F03 | 2.87 | 1.2831 | 30 |
| F05 | 2.99 | 1.3767 | 12 | F18 | 2.86 | 1.1326 | 31 |
| F10 | 2.99 | 1.4587 | 13 | F16 | 2.85 | 1.0622 | 32 |
| F12 | 2.98 | 1.1511 | 14 | F34 | 2.85 | 1.1260 | 33 |
| F25 | 2.97 | 1.0052 | 15 | F36 | 2.85 | 1.2249 | 34 |
| F23 | 2.97 | 1.0167 | 16 | F17 | 2.84 | 1.1700 | 35 |
| F15 | 2.97 | 1.1149 | 17 | F21 | 2.80 | 1.1495 | 36 |
| F29 | 2.95 | 1.0773 | 18 | F22 | 2.73 | 1.0391 | 37 |
| F07 | 2.94 | 1.1847 | 19 |
Table 6.
A framework for restructuring the barriers.
| Category | Code | Barriers |
|---|---|---|
| Macro environment | F02 | Excessive transport planning changes |
| F04 | Fragmentation of administrative system | |
| F05 | Lack of sustainable and effective policies | |
| F08 | Macroeconomic downturn | |
| F10 | Poor financial environment | |
| F13 | Insufficient funding | |
| Local environment | F09 | Weak support from economy |
| F11 | High pressure of debt repayment | |
| F12 | Heavy tax burden of construction firms | |
| F30 | Lack of local R&D institutes and services | |
| F32 | Complex topography and landform | |
| F37 | Harsh regional climate | |
| The construction process | F07 | Improper monitoring and control |
| F14 | Cost overrun | |
| F15 | Ineffective cost management | |
| F23 | Obsolete technical standards | |
| F24 | Multiple technical problems | |
| F25 | Insufficient sharing and communication of technical experience | |
| F27 | Difficulty in survey and design | |
| F29 | Lack of innovative application |
Table 7.
Total variance explained for critical factors.
| Cluster | Initial Eigenvalues 1 | ||
|---|---|---|---|
| Total | Percent of Variance | Cumulative % | |
| 1 | 11.030 | 55.148 | 55.148 |
| 2 | 1.698 | 8.488 | 63.636 |
| 3 | 1.357 | 6.786 | 70.422 |
1 Extraction method was principal component analysis.
Table 8.
Cluster matrix after direct oblimin rotation.
| Code | Factors | Cluster 1 1 | Cluster 2 | Cluster 3 |
|---|---|---|---|---|
| F04 | Fragmentation of administrative system | 0.911 | - | - |
| F05 | Lack of sustainable and effective policies | 0.812 | - | - |
| F02 | Excessive transport planning changes | 0.790 | - | - |
| F09 | Weak support from economy | 0.717 | - | - |
| F07 | Improper monitoring and control | 0.685 | - | - |
| F24 | Multiple technical problems | 0.684 | - | - |
| F12 | Heavy tax burden of construction firms | 0.674 | - | - |
| F10 | Poor financial environment | 0.659 | - | - |
| F25 | Insufficient sharing and communication of technical experience | 0.637 | - | - |
| F13 | Insufficient funding | 0.628 | - | - |
| F23 | Obsolete technical standards | - | 0.822 | - |
| F15 | Ineffective cost management | - | 0.775 | - |
| F29 | Lack of innovative application | - | 0.688 | - |
| F32 | Complex topography and landform | - | - | 0.926 |
| F14 | Cost overrun | - | - | 0.738 |
| F08 | Macroeconomic downturn | - | - | 0.650 |
| F27 | Difficulty in survey and design | - | - | 0.635 |
| F37 | Harsh regional climate | - | - | 0.563 |
1 Rotation method is Oblimin with Kaiser Normalization.
© 2017 by the authors. Licensee MDPI, Basel, Switzerland. This article is an open access article distributed under the terms and conditions of the Creative Commons Attribution (CC BY) license (http://creativecommons.org/licenses/by/4.0/).
Share and Cite
MDPI and ACS Style
Nie, T.; Ye, K. Demystifying the Barriers to Transport Infrastructure Project Development in Fast Developing Regions: The Case of China. Sustainability 2017, 9, 1915. https://doi.org/10.3390/su9101915
AMA Style
Nie T, Ye K. Demystifying the Barriers to Transport Infrastructure Project Development in Fast Developing Regions: The Case of China. Sustainability. 2017; 9(10):1915. https://doi.org/10.3390/su9101915
Chicago/Turabian StyleNie, Tianyi, and Kunhui Ye. 2017. "Demystifying the Barriers to Transport Infrastructure Project Development in Fast Developing Regions: The Case of China" Sustainability 9, no. 10: 1915. https://doi.org/10.3390/su9101915
Note that from the first issue of 2016, this journal uses article numbers instead of page numbers. See further details here.