Article

Analysis of Economical and Environmental Costs for the Selection of Municipal Solid Waste Treatment and Disposal Scenarios through Multicriteria Analysis (ELECTRE Method)

by
Lorena De Medina-Salas
1,*,
Eduardo Castillo-González
2,
Mario Rafael Giraldi-Díaz
1 and
Víctor Guzmán-González
1
1
Facultad de Ciencias Químicas, Universidad Veracruzana, Circuito Gonzalo Aguirre Beltrán s/n, Zona Universitaria, 91040 Xalapa, Veracruz, Mexico
2
Facultad de Ingeniería Civil, Universidad Veracruzana, Circuito Gonzalo Aguirre Beltrán s/n, Zona Universitaria, 91040 Xalapa, Veracruz, Mexico
*
Author to whom correspondence should be addressed.
Sustainability 2017, 9(11), 1758; https://doi.org/10.3390/su9111758
Submission received: 31 August 2017 / Revised: 22 September 2017 / Accepted: 26 September 2017 / Published: 30 October 2017
(This article belongs to the Section Sustainable Engineering and Science)

Abstract

:
Decision-making for the selection of treatment alternatives and landfilling of municipal solid waste (MSW) is based on the experience and judgment of those management responsible, without considering multicriteria analysis. Therefore, the purpose of this research was to determine the treatment scenario and landfilling of MSW with the lowest environmental and economic costs in a medium-sized city. The methodology included the definition and data processing of the project (population, generation, and composition of MSW), for 16 years. In the design of scenarios, recycling, composting, incineration with energy recovery, and landfilling treatments were proposed; later, the combinations of treatments for each type of residue were generated. The results showed 36 scenarios, then the ELECTRE method was applied to the five with the lowest economical and environmental costs. Finally from the latter, one dominant scenario was determined: organic waste in composting; plastic, paper, and glass in recycling; and ‘others’ in landfilling. It is concluded that the final decision on the scenario is adapted to the particular conditions of the locality.

1. Introduction

The management of MSW is one of the most important environmental problems that governments must take on. The increase of MSW is a serious concern for several countries [1]. It implies that strategic planning must be carried out at all stages to ensure a management that minimizes environmental impact. This is especially true since an inadequate decision could have adverse effects on economic, social, legal, and environmental aspects. Therefore, government decisions should consider social demands in order to generate an “intelligent management model” that identifies, compares, and selects alternatives that are effectively adapted to specific conditions and flexibility for decision making in both short and medium terms [2]. The stakeholders should then establish alternative options and weights to apply to criteria [3].
Selection of the different physical, chemical, biological, or thermal treatments along with landfilling depend directly on the MSW streams’ characteristics. Generally, the selection of MSW treatment and landfilling are based on the knowledge, experience, and judgment of the decision-makers [4]. However, due to its complexity, this decision has to have basis in the resolution of models that allow the acquisition of the best management option.
A useful tool for this type of assessment is multicriteria analysis; it can be used for environmental planning and MSW management. The ELECTRE method was used for this research which sequentially reduces the number of alternatives from a set of possibilities [5,6].
This method consists of two general phases: aggregation and exploitation. In the aggregation phase, the concordance and non-discordance concepts are used to make pair comparisons of the alternatives. It is useful for presenting the results that are expected for the given problem [7].
Due to the chemical makeup and physical characterization of MSW components, the treatments of each waste stream can generate different combinations. This in turn, can lead to several alternatives that have to be considered and assessed in terms of different criteria, with a large amount of data to be managed, which complicates the decision process.
Therefore, it is necessary to establish a methodology that is reliable enough to be applied through numerically valued criteria; and to obtain a smaller set of possible options of MSW treatments through which a final decision can be made [6].
The different methods of MSW treatment that are currently used should be assessed according to the objectives to be achieved. In addition to the above described, it is necessary to know the parameters of generation and composition of MSW, including aspects such as population density, urbanization, and technical characteristics for the operation of the suggested technology, as well as available land for installation and the environmental impact associated with its implementation [8].
In addition to the technical aspects, it is very important to include the criteria of costs and financing, technological ease, social acceptance, and environmental damage into any final decision-making [9].
Several studies have reported the application of multicriteria analysis tools [8,10,11,12]; and in that same vein, the purpose of this research is to determine the MSW treatment scenario that has the lowest environmental and economic costs in a medium-sized city with limited resources through the following multicriteria analysis method “Elimination and Choice Expressing Reality” (ELECTRE) [13].

2. Methodology

The methodology for this project was divided into three phases: basic data; scenario design; and scenario selection.

2.1. Basic Data

The basic data used took into consideration the quantification of MSW generation and composition. The projection of the population selected was calculated for a 16-year timeframe as per the methods established by the pertinent government agency [14]. Using these data, the quantity of each type of waste generated was expressed in tons. To calculate per capita generation, an annual increase of 1% [15] was taken into account, while composition percentages remained constant during the project’s scope.
The project data used for this study was a population of 86,696 inhabitants [16], per capita generation of 0.504 kg/hab-d and composition: organic waste (55.83%), plastics (11.58%), paper (7.33%), glass (2.57%), and others (22.69%) [17].

2.2. Scenario Design

Treatments were defined according to physical, chemical, and biological characteristics of MSW. Each type of waste was identified from 1 to 5, as shown in Table 1. While the selection of the types of treatment and landfilling of MSW were tailored to the social, environmental, legal, economic, and political conditions of the selected population’s context. The symbol “X” represents the MSW treatment corresponding to each waste stream.
Once each waste type was defined, a numerical order was assigned to the treatment options: 1 = recycling, 2 = composting, 3 = incineration, and 4 = landfilling. To be able to determine all possible scenarios, combinations with residue streams (in the following order: organic matter, plastic, paper, glass and ‘others’) were generated with each different type of treatment.
The code for the first scenario is composed of the numbers 21114 which considers that organic matter must be composted hence first digit of the code for this scenario is 2; plastic must be recycled indicated by the digit 1; paper must be recycled indicated by the digit 1; glass must be recycled too and it is also assigned the digit 1; and finally ‘others’ were assigned the digit 4 and must be landfilled.
The total generation of each waste stream during the project’s scope was expressed in tons and then multiplied by the values reported by Peñuelas, Gómez-Limón, and Berbel [10]. The unit cost per ton of treated waste was reported in both USD as well as per ton of carbon dioxide (CO2) emissions processed by the type of treatment selected. Therefore the economic costs (EC) and the environmental costs (ENC) of each stream of waste were obtained. The values of EC and ENC were added for all possible combinations of each scenario. The associated costs for this study are shown in Table 2 and Table 3.
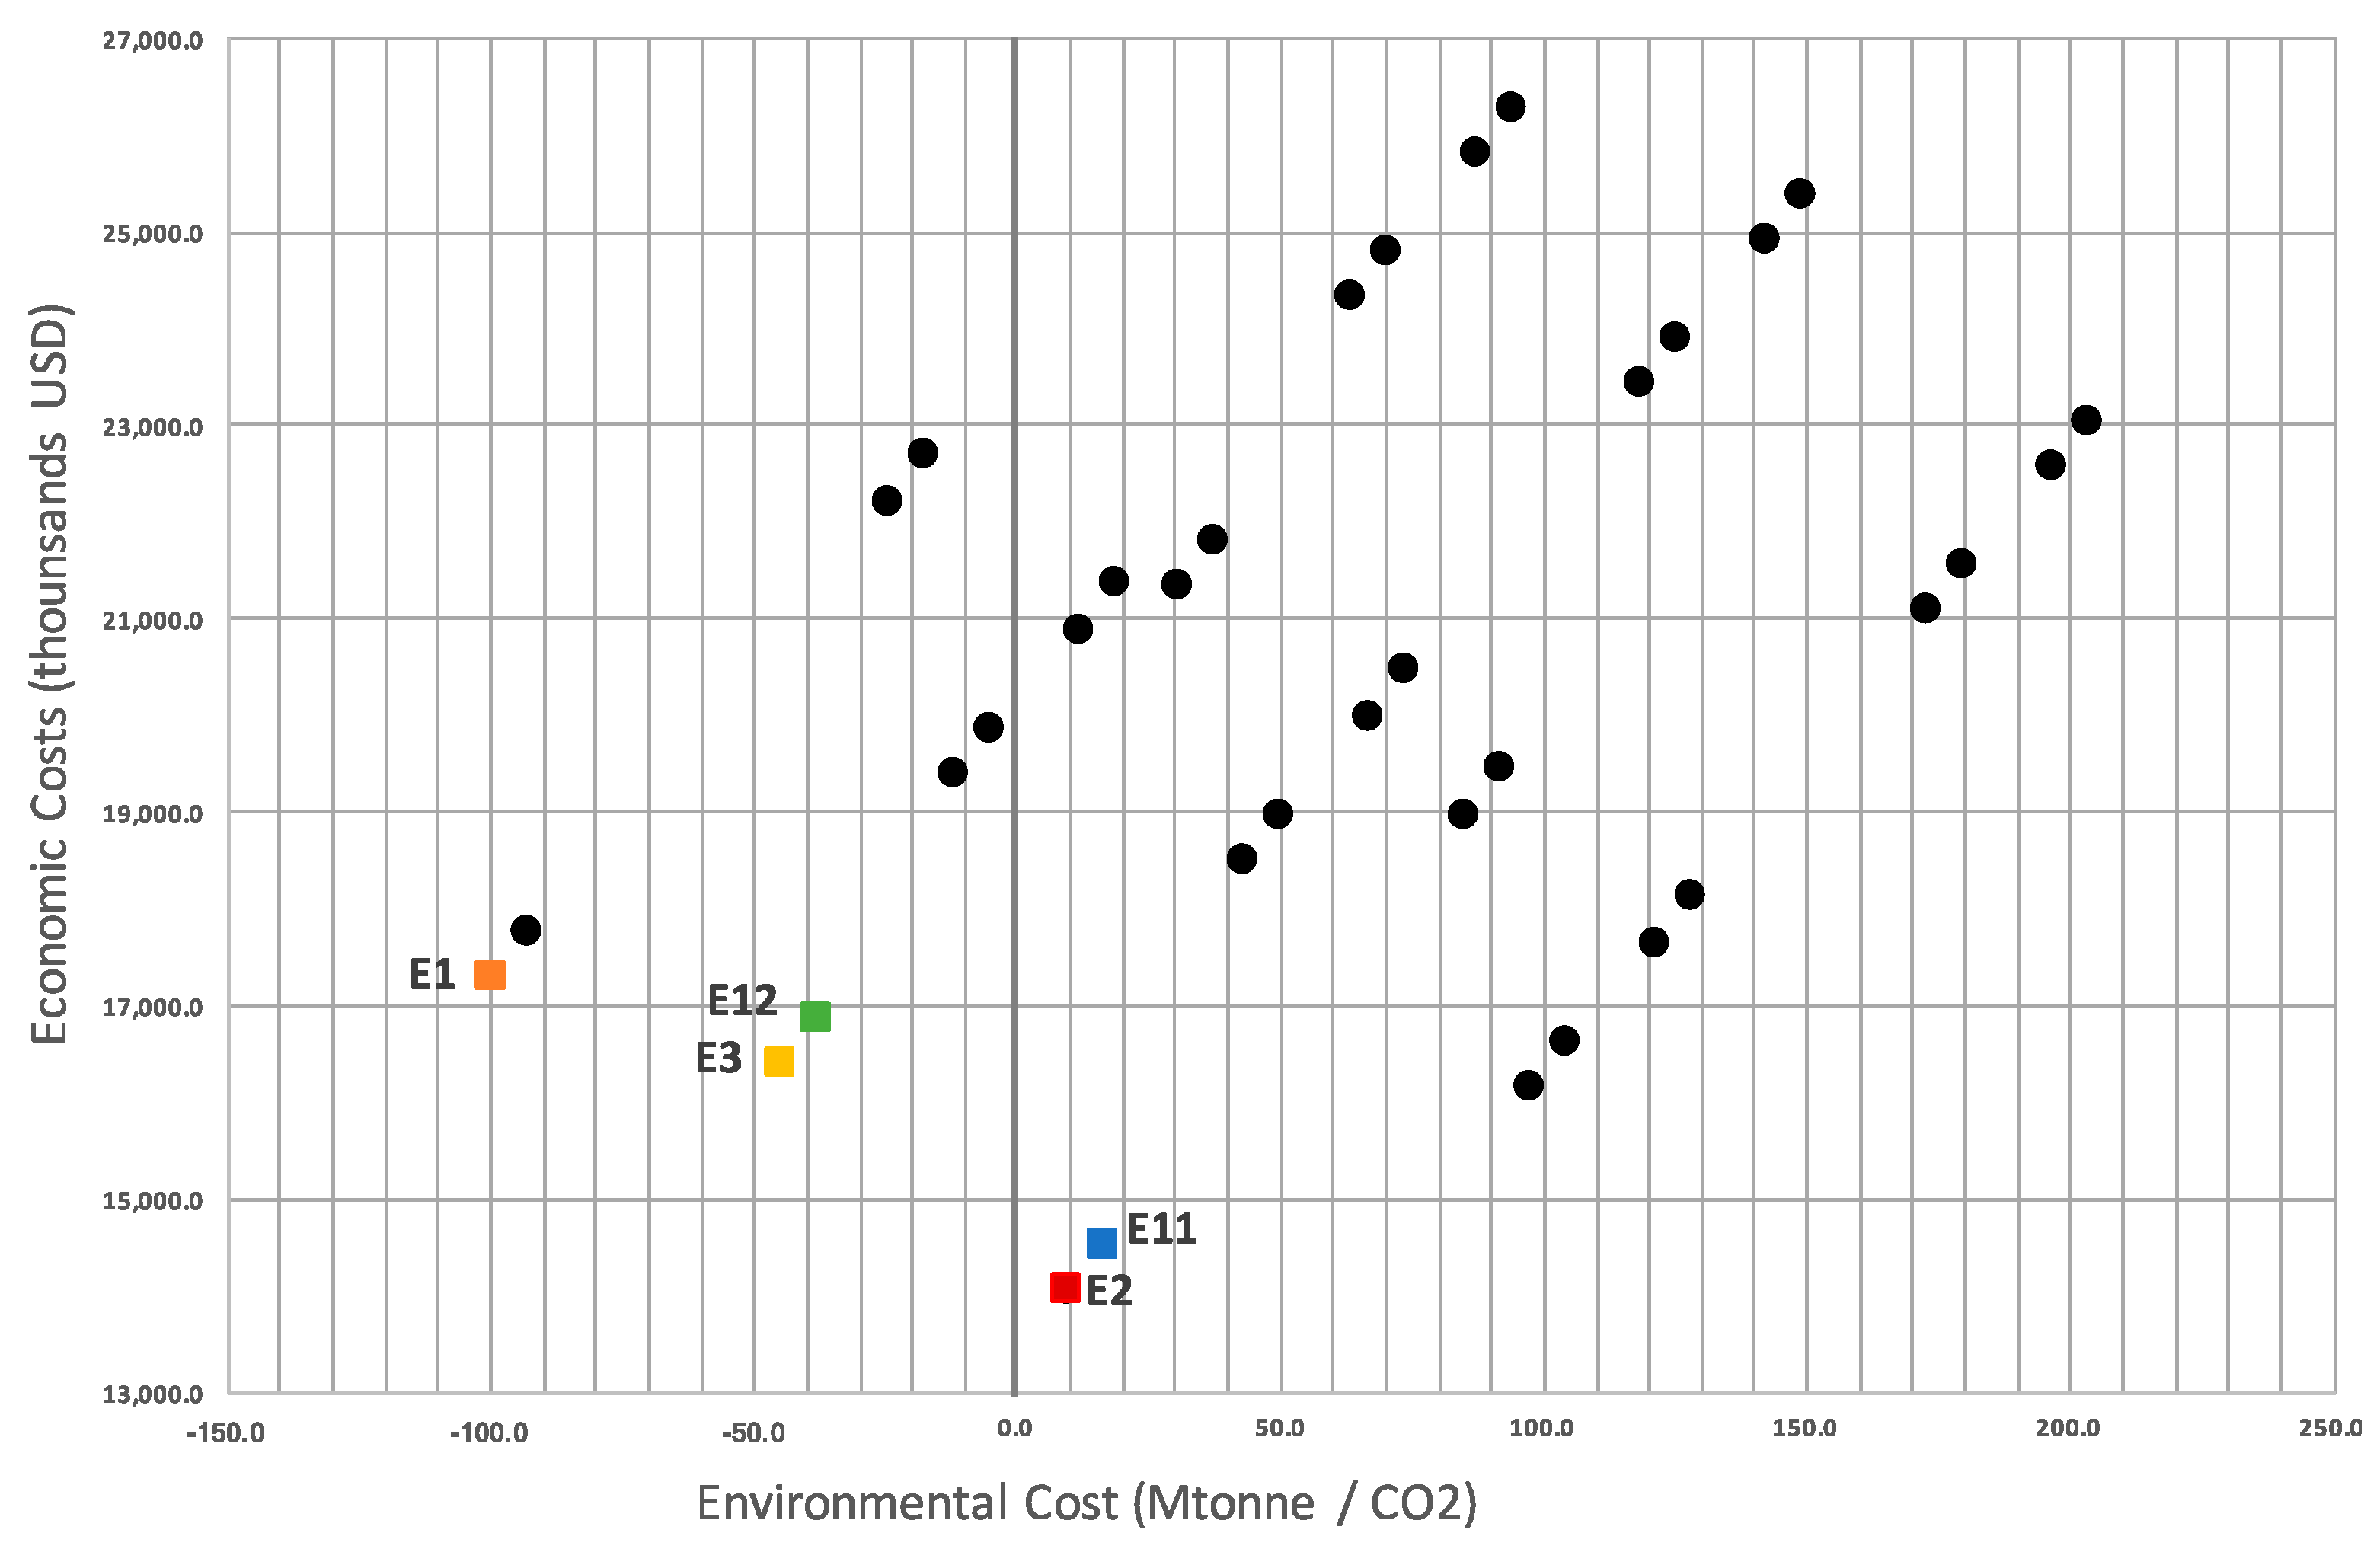
Every scenario contained two values, so they were placed in a Cartesian coordinate system: the “x” axis corresponded to the ENC; and the axis “y” to the EC.

2.3. Scenario Selection

After analyzing graphical representation, scenarios with lower economic and environmental costs were selected to form the initial decision matrix [25]. The first column in the matrix contained values obtained from the EC and the second column contained ENC values.
Because of the environmental and the economic costs considered for this research, it was necessary to subjectively assign a weight or preferred weight vector (W) for data processing. The ELECTRE algorithmic structure was applied to this matrix and W was defined for the EC and ENC giving a weight of 50% for each one. However, W values may vary depending on the decision maker’s or experts on MSW criteria [26].
W = (w1 = 0.5, w2 = 0.5)
The vector W was defined and using the initial decision matrix, the matrix of concordance index was calculated. This led to the selection of the ‘ideal’ and ‘anti-ideal’ points for the EC and ENC. The ideal point was where the EC and ENC reached a maximum level, whereas the anti-ideal point was the one that contained the minimum level.
The application of the ELECTRE method included [25]: (1) Standardization of the elements of the initial decision matrix; (2) standardized and weighted decision matrix; (3) matrices of concordance and discordance; (4) discordance index; (5) thresholds of concordance and discordance; (6) matrix of concordant and discordant dominance; and (7) matrix of aggregate dominance.
A graphical representation was created from the matrix of aggregate dominance. Each alternative represented one of the graph’s vertexes, allowing the comparison of each alternative to one another and draw corresponding lines. As a result, the ELECTRE graph was generated composed of alternatives that did not dominate one another, those that were not a part of the core were removed from the selection process.

3. Results and Discussion

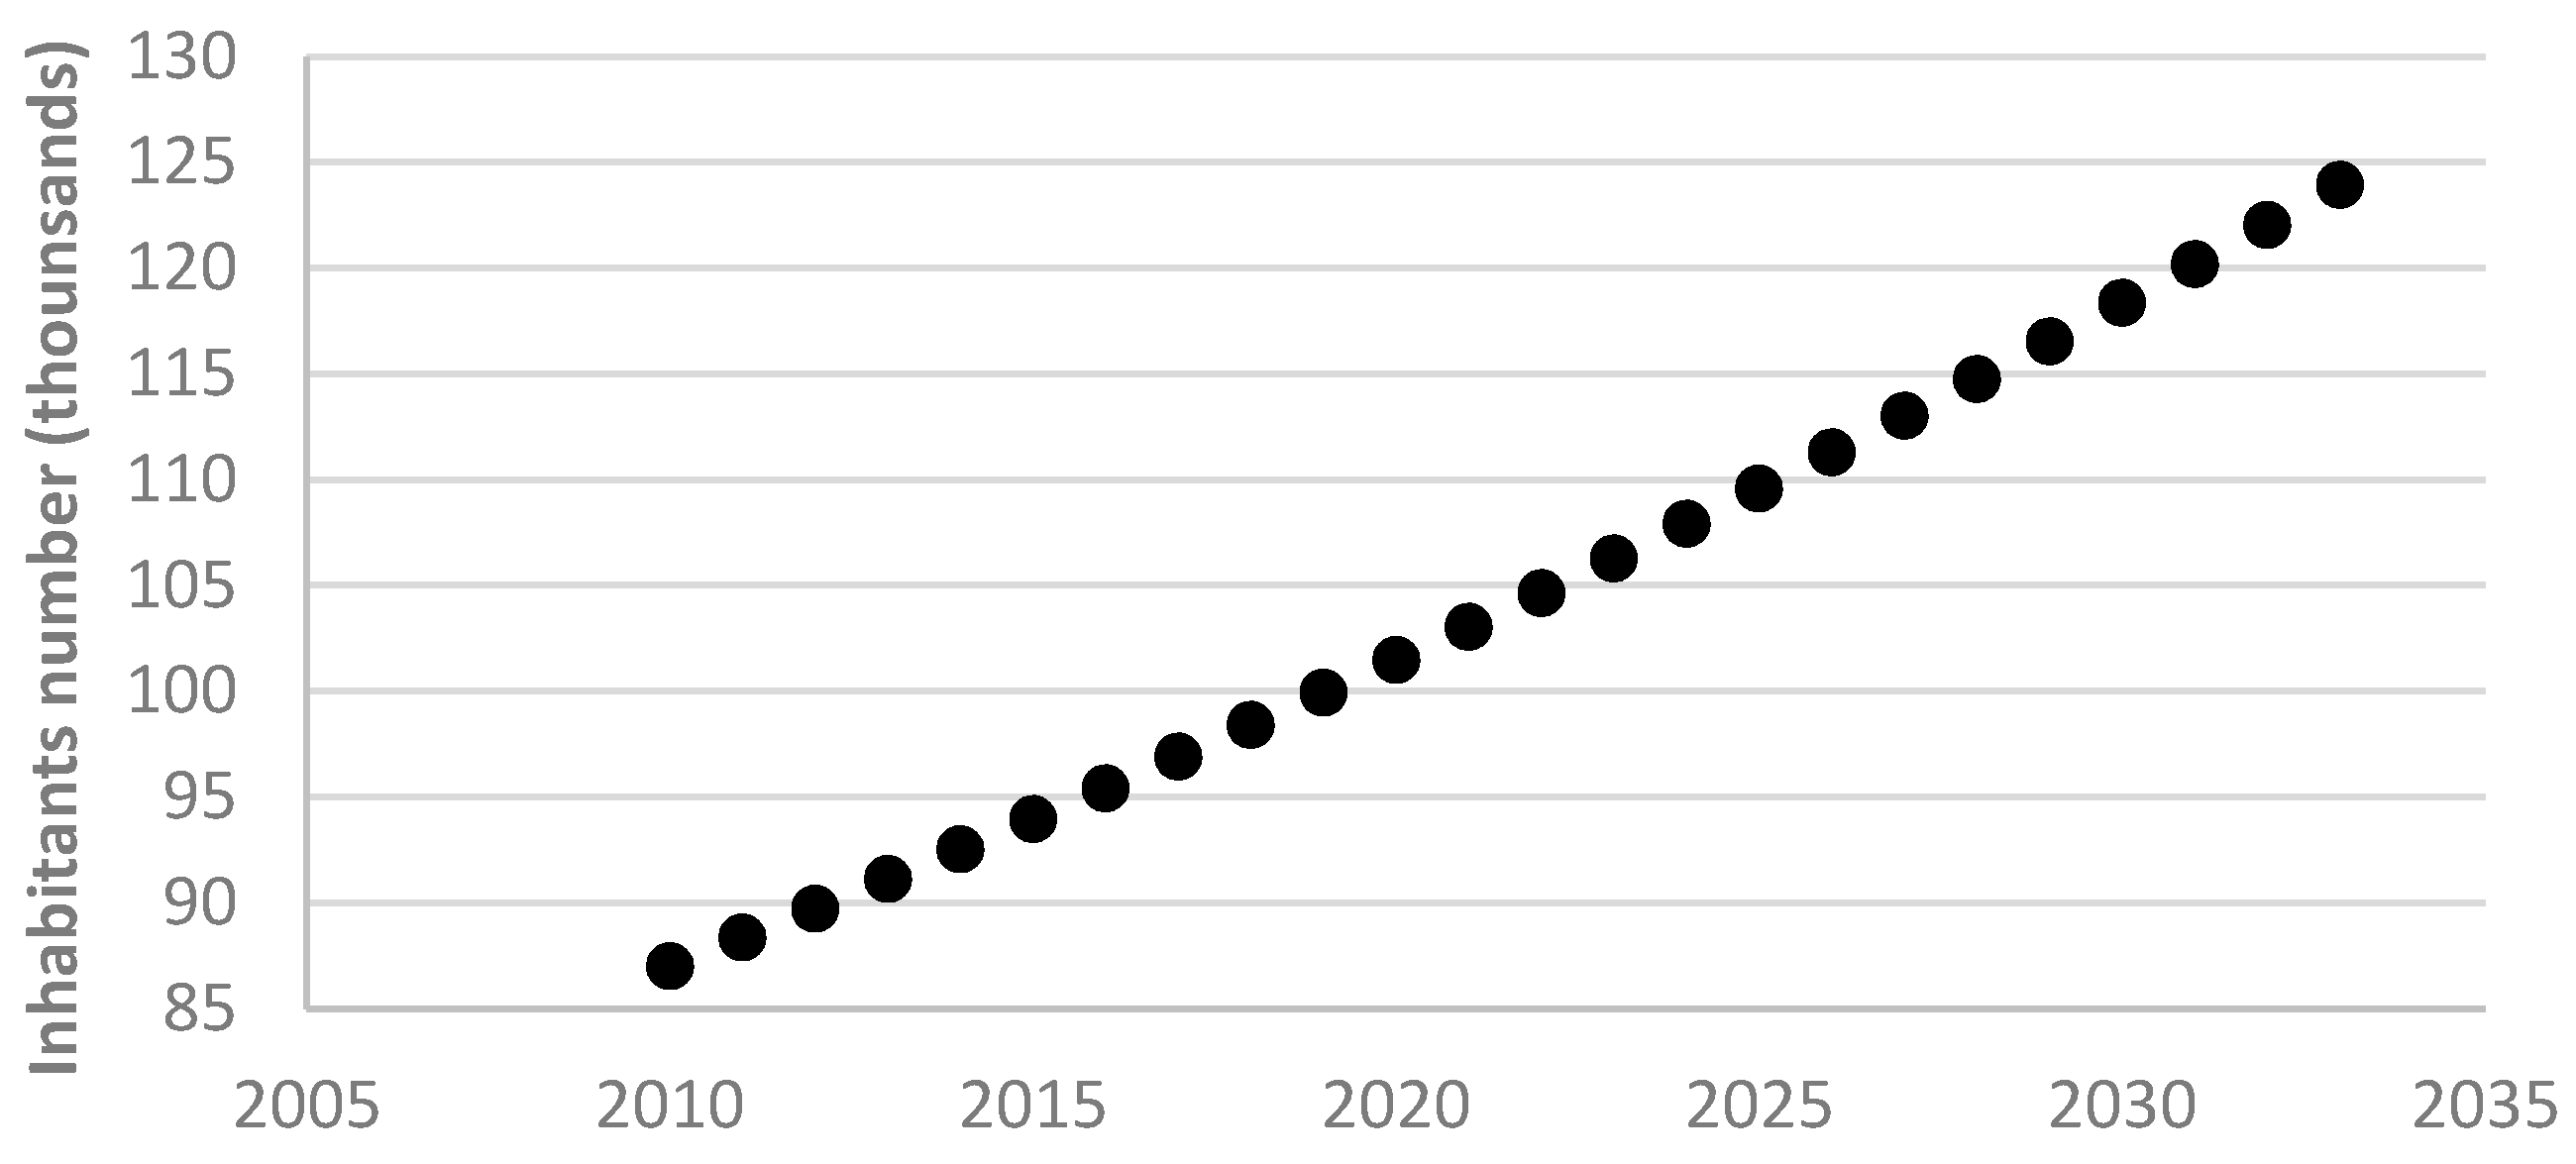
According to the population projected for the study area (Figure 1), there is a trend toward population increase, leading to 123,919 inhabitants in the year 2033. The total generation of MSW for the project horizon is shown in Table 4.
A total of 36 scenarios of treatment and landfilling were obtained (Table 5) for the design of the scenarios after making all combinations possible of each of the waste streams by type of treatment, with the assignment of the numerical order mentioned in the methodology.
When applying the unit costs to each of the scenarios, the EC and ENC costs were obtained as shown in Figure 2.
The five scenarios selected from Figure 2 with the lowest EC and ENC are shown in Table 6. This shows the alternatives with lowest EC are C, D, and E, while those with lower environmental costs are A and B.
The most favorable point (ideal point) would be to reach an ENC of −100,144.62 tons of CO2 emissions to the atmosphere (which corresponds to scenario A) and with an EC of $14,061,931.17 USD (scenario E). The anti-ideal point is an ENC of 16,111.00 tons of CO2 emissions to the atmosphere (scenario D) and EC of $17,303,523.74 USD (scenario A).
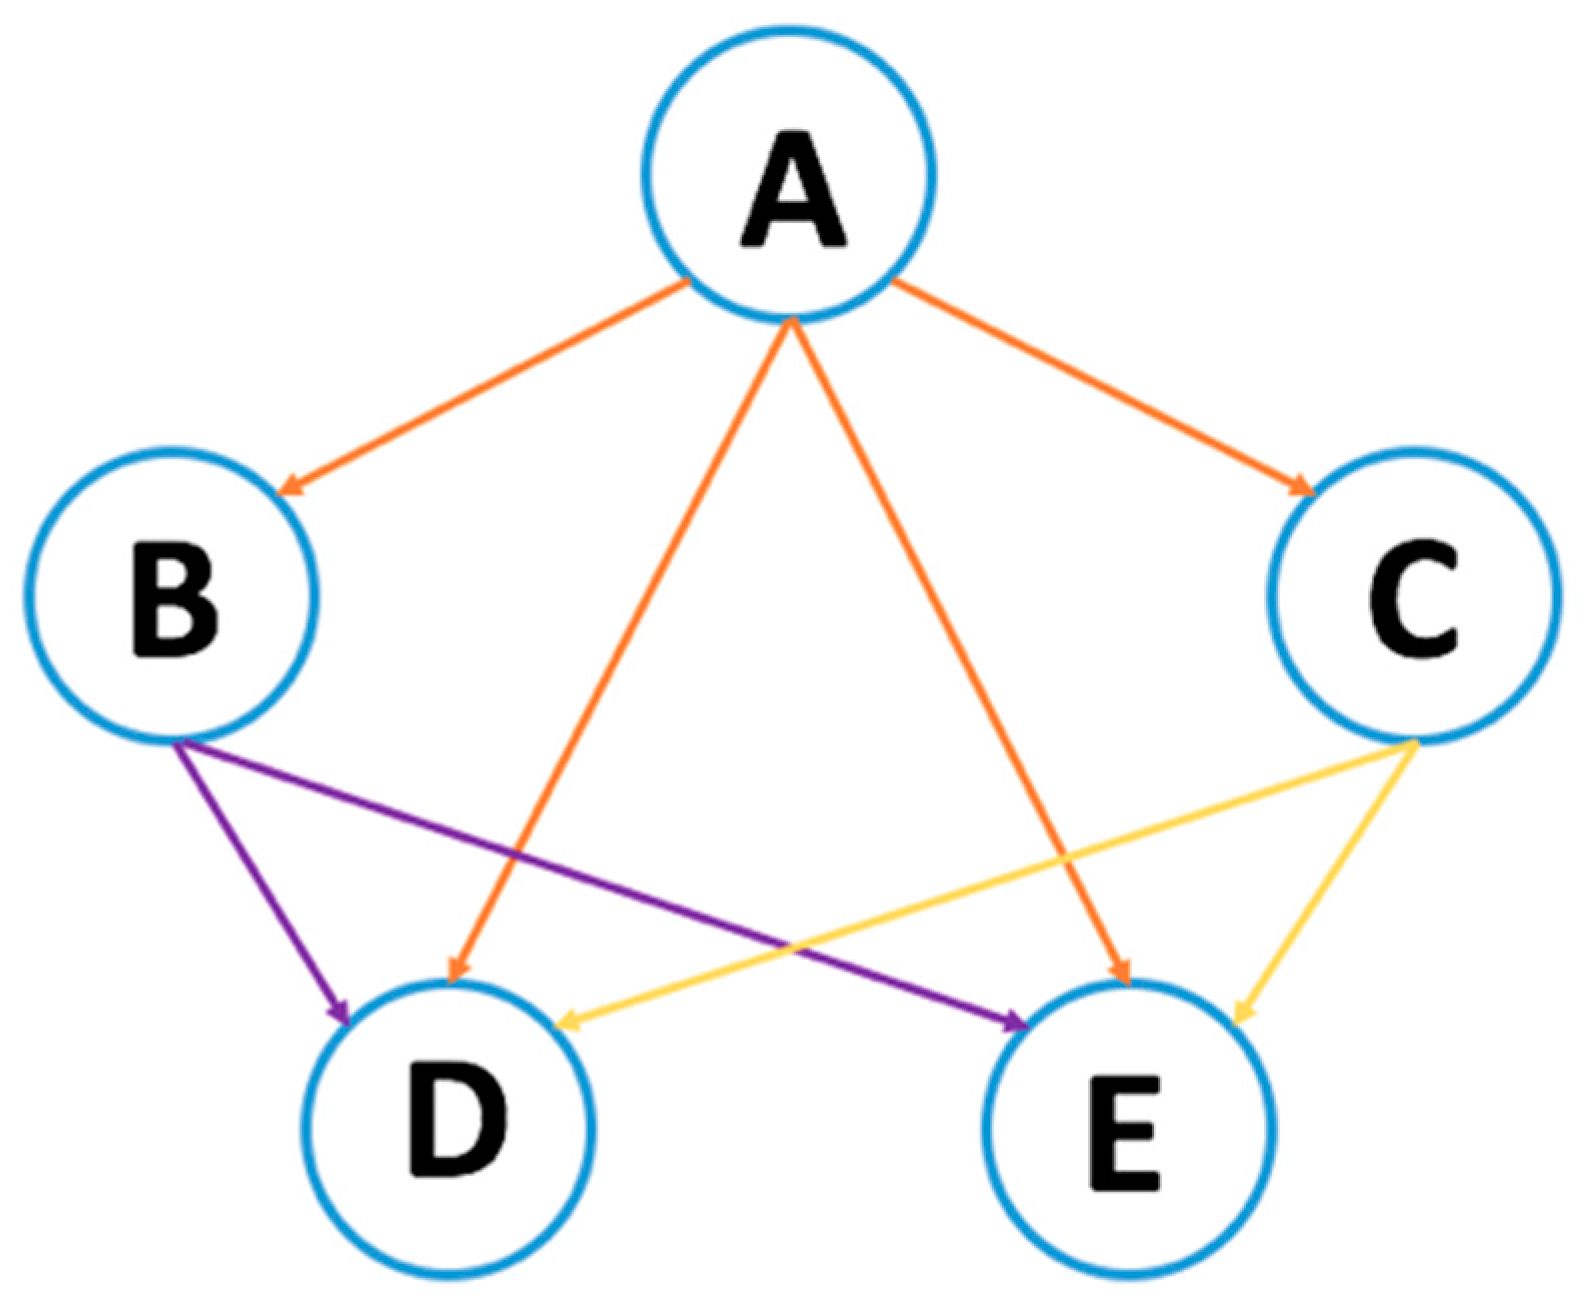
The diagram obtained from the ELECTRE aggregate dominance matrix is shown in Figure 3. The core is formed by scenario A which is the most favorable option of the five considered. The focus should be on scenario A for the selection of treatment and landfilling for the 16-year scope of the project. The applied analysis resulted in D and E scenarios with the lowest dominance degree.
Scenario A shows that organic waste must be subjected to composting treatment [26,27], whereas plastic, paper, and glass must be recycled; ‘others’ must be sent to landfills. The EC and ENC cost for this scenario is $17,303,523.74 USD and −100,144.62 tons of CO2 emissions, respectively.
Scenario D suggests that organic waste should composted, while the ‘others’ stream should be sent to landfills paper and glass would be recycled, while plastics must be incinerated. The EC and ENC for this scenario is $14,532,238.02 USD and 16,111.00 tons of CO2 emissions.
Both alternatives coincide in the recycling of paper and glass as an option for the treatment of those waste streams. This is mainly due to economic potential and the existence of a recyclable materials market with exponential growth [28,29]. The competitive advantage of recycling in comparison to the other types of treatment is the reduction of environmental costs associated with the management process and the depletion of resources through the integration of byproducts into the supply chain, thus reducing CO2 emissions [30].
In regards to the organic waste fraction, the composting treatment is considered in scenario A due to the environmental benefits for the community such as the improvement of the soils by incorporation of nutrients of the compost [31]. This may have positive effects on the flow of greenhouse gases as well as the potential to be an economic option for marketing [32]; meanwhile, scenario E shows that landfilling is the option with the least value for waste.
In addition to that, literature shows that organic waste incineration is a viable scenario [11,12]. However, for this research, organic waste incineration was not considered due to the high content of humidity for this waste fraction and its operation cost [17,33].
In the case of scenarios D and E, treatment by incineration of plastic is considered due to its high calorific value (above 11 MJ/kg average of calorific content [10]). This treatment contributes to a reduction in CO2 emissions [34]. For scenario A corresponding to plastic, lower EC and ENC associated were obtained.

4. Conclusions

Of the 36 scenarios obtained in this research, the five that presented the lowest EC and ENC were selected. The ELECTRE method was used to identify the scenario with the highest degree of dominance. This scenario considers composting for organic waste, recycling for paper, plastic and glass, and landfilling for the ‘others’ category.
The ELECTRE method suggests that the people with the decision-making power should select the scenario that best considers the area’s particular conditions including population size, socioeconomic situation, and public policies. In this research, scenario A meets these requirements.

Author Contributions

Lorena De Medina-Salas, Eduardo Castillo-González and Mario Rafael Giraldi-Díaz conceived and designed the experiment; Mario Rafael Giraldi-Díaz and Victor Guzmán-González performed the experiment; Eduardo Castillo-González and Lorena De Medina-Salas analyzed the data; the four authors wrote the paper.

Conflicts of Interest

The authors declare no conflict of interest.

Abbreviations

MSWMunicipal Solid Waste
ELECTREElimination and Choice Expressing Reality
ECEconomical Cost
ENCEnvironmental Cost

References

  1. De Souza, M.A.V.; Montenegro, G.S.; Faceli, K.; Casadei, V. Technologies and decision support systems to aid solid-wate management: A systematic review. Waste Manag. 2017, 59, 567–584. [Google Scholar]
  2. Pérez, B.J.R.; Cerdán, P.A. Aplicación de las TIG para la Optimización de los Servicios de Recogida y Gestión de los Residuos Sólidos Urbanos del Municipio de Aspe (Alicante); Asociación de Geógrafos Españoles: Madrid, Spain, 2014. [Google Scholar]
  3. Soltani, A.; Hewage, K.; Reza, B.; Sadiq, R. Multiple stakeholders in multi-criteria decision-making in the context of Municipal Solid Waste Management: A review. Waste Manag. 2015, 35, 318–328. [Google Scholar] [CrossRef] [PubMed]
  4. Duran, B.P. Método de Discriminación Entre Distintas Soluciones de Pilares Mediante Criterios de Sostenibilidad. 2011. Available online: https://upcommons.upc.edu/bitstream/handle/2099.1/12527/706-TES-CA-4883_Pere_Duran_Bertran.pdf (accessed on 9 July 2017).
  5. Contreras, F.; Hanaki, K.; Aramaki, T.; Connors, S. Application of analytical hierarchy process to analyze stakeholders preferences for municipal solid waste management plans, Boston, USA. Resour. Conserv. Recycl. 2008, 52, 979–991. [Google Scholar] [CrossRef]
  6. Fatta, D.; Moll, S.; Tsotsos, D. Assessment of Information Related to Waste and Material Flows; European Environmental Agency: Copenhagen, Denmark, 2003. [Google Scholar]
  7. Govindan, K.; Brandt, J.M. ELECTRE: A comprehensive literature review on methodologies and applications. Eur. J. Oper. Res. 2016, 250, 1–29. [Google Scholar] [CrossRef]
  8. Orta, D.V.M.T.; Yañez, N.I.; Monje, R.I.; Rojas, V.M.N.; Toscano, V.L.; Rentería, M.J.; Velázquez, P.K.; García, S.E.I.; Hernández, R.N.M.; Hernández, R.L. Estudio de Evaluación de Evaluación de Tecnologías Alternativas o Complementarias para el Tratamiento o Disposición Final de Residuos Sólidos Urbanos. Informe Final. 2009. Available online: http://www.cmic.org.mx/comisiones/Sectoriales/infraestructurahidraulica/publicaciones_conagua/RESIDUOS%20PELIGROSOS/EST-EVA2009.pdf (accessed on 9 July 2017).
  9. Camacho-Rea, I.; Aguirre, R. Análisis Multicriterio y Evaluación del Beneficio Ambiental de la Incineración de Residuos Sólidos Municipales en la Ciudad de México. Biblioteca Virtual de Desarrollo Sostenible y Salud Ambiental BVSDE, 2005. Available online: http://www.bvsde.paho.org/bvsaidis/mexico2005/camacho.pdf (accessed on 8 July 2017).
  10. Peñuelas, M.J.M.; Gómez-Limón, R.J.A.; Berbel, V.J. Análisis de los planes de gestión de residuos urbanos: Aplicación al caso andaluz. Rev. Estudios Reg. 2002, 62, 15–50. [Google Scholar]
  11. Ionescu, G.; Rada, E.C.; Ragazzi, M.; Mărlescu, C.; Badea, A.; Apostol, T. Integrated municipal solid waste scenario model using advanced pretreatment and waste to energy processes. Energy Convers. Manag. 2013, 76, 1083–1092. [Google Scholar] [CrossRef]
  12. Oyoo, R.; Leemans, R.; Mol, A.P.J. Comparison of environmental performance for different waste management scenarios in East Africa: The case of Kampala City, Uganda. Habitat Int. 2014, 44, 349–357. [Google Scholar] [CrossRef]
  13. Botti, L.; Peypoch, N. Multi-criteria ELECTRE method and destination competitiveness. Tour. Manag. Perspect. 2013, 6, 108–113. [Google Scholar] [CrossRef]
  14. National Water Comission. Methods of Population Projection; Technical Standard NT-011-CNA-2001. 2001. Available online: http://info.ceajalisco.gob.mx/transparencia/pdf/ley/nom/cna/nt-011-cna-2001.pdf (accessed on 9 July 2017).
  15. Secretaría de Medio Ambiente y Recursos Naturales (SEMARNAT). Guía para la Gestión Integral de los Residuos Sólidos Municipales; Subsecretaria de Gestión para la Protección Ambiental: Mexico City, Mexico, 2008; Available online: http://www.sustenta.org.mx/3/wp-content/files/GUIA_GIRSM_SEMARNAT_2001.pdf (accessed on 9 July 2017).
  16. Instituto Nacional de Estadística y Geografía (INEGI). 2010. Available online: http://www.beta.inegi.org.mx/proyectos/ccpv/2010/ (accessed on 9 July 2017).
  17. Consejo Nacional de Ciencia y Tecnología (CONACYT). Responsible for the Project: Diego Corcho Sánchez, Eduardo Castillo González and Lorena De Medina Salas. Desarrollo de un Sistema de Información para la Gestión Integral de los Residuos Sólidos Urbanos Que Actualmente se Disponen en el Relleno Sanitario Regional de Pinoltepec Ubicado en el Municipio de Emiliano Zapata, Veracruz; Clave VER-2007-C01-31766; CONACYT: Mexico City, Mexico, 2010; Available online: http://webcache.googleusercontent.com/search?q=cache:jVVs_VkfMwAJ:2006-2012.conacyt.gob.mx/fondos/FondosMixtos/Documents/FOMIX-Veracruz_Sep_2012.pdf+&cd=4&hl=es&ct=clnk&gl=mx (accessed on 9 July 2017).
  18. Maalouf, A.; El-Fadel, M. Effect of a food waste disposer policy on solid waste and wastewater management with economic implications of environmental externalities. Waste Manag. 2017. [Google Scholar] [CrossRef] [PubMed]
  19. Menikpura, S.N.M.; Gheewala, S.H.; Bonnet, S.; Chiemchaisri, C. Evaluation of the effect of recycling on sustainability of municipal solid waste management in Thailand. Waste Biomass Valoriz. 2013, 4, 237–257. [Google Scholar] [CrossRef]
  20. Castrejón-Godínez, M.L.; Sánchez-Salinas, E.; Rodríguez, A.; Ortiz-Hernández, M.L. Analysis of Solid Waste Management and Greenhouse Gas Emissions in México: A Study Case in the Central Region. J. Environ. Prot. 2015, 6, 146. [Google Scholar] [CrossRef]
  21. Environmental Protection Agency Office (EPA). Documentation for Greenhouse Gas Emission and Energy Factors Used in the Waste Reduction Model (WARM); U.S. Environmental Protection Agency Office (EPA): Washington, DC, USA, 2015. Available online: https://www3.epa.gov/warm/pdfs/WARM_Documentation.pdf (accessed on 18 September 2017).
  22. Friedrich, E.; Trois, C. Quantification of greenhouse gas emissions from waste management processes for municipalities–A comparative review focusing on Africa. Waste Manag. 2011, 31, 1585–1596. [Google Scholar] [CrossRef] [PubMed]
  23. Morris, J.; Matthews, H.S.; Morawski, C. Review and meta-analysis of 82 studies on end-of-life management methods for source separated organics. Waste Manag. 2013, 33, 545–551. [Google Scholar] [CrossRef] [PubMed]
  24. Zhou, C.; Jiang, D.; Zhao, Z. Quantification of Greenhouse Gas Emissions from the Predisposal Stage of Municipal Solid Waste Management. Environ. Sci. Technol. 2016, 51, 320–327. [Google Scholar] [CrossRef] [PubMed]
  25. Comaniţă, E.-D.; Ghinea, C.; Hlihor, R.M.; Simion, I.M.; Smaranda, C.; Favier, L.; Roşca, M.; Gostin, I.; Gavrilescu, M. Challenges and opportunities in green plastics: An assessment using the ELECTRE decision-aid method. Environ. Eng. Manag. J. 2015, 14, 689–702. [Google Scholar]
  26. Liu, Y.; Xing, P.; Liu, J. Environmental performance evaluation of different municipal solid waste management scenarios in China. Resour. Conserv. Recycl. 2017, 125, 98–106. [Google Scholar] [CrossRef]
  27. Põldnurk, J. Optimisation of the economic, environmental and administrative efficiency of the municipal waste management model in rural areas. Resour. Conserv. Recycl. 2015, 97, 55–65. [Google Scholar] [CrossRef]
  28. United Nations Human Settlements Programme (UN-Habitat). Solid Waste Management in the World’s Cities: Water and Sanitation in the World’s Cities 2010; UN-HABITAT/Earthscan, Ed.; UN-HABITAT: London, UK; Washington, DC, USA, 2010. [Google Scholar]
  29. Nandy, B.; Sharma, G.; Kumari, S.; George, T.; Sunanda, Y.; Sinha, B. Recovery of consumer waste in India—A mass flow analysis for paper, plastic and glass and the contribution of households and the informal sector. Resour. Conserv. Recycl. 2015, 101, 167–181. [Google Scholar] [CrossRef]
  30. PNUMA. Guía para la Elaboración de Estrategias Nacionales de Gestión de Residuos (Avanzar Desde los Desafíos Hacia las Oportunidades). 2013. Available online: http://cwm.unitar.org/publications/publications/cw/wm/UNEP_UNITAR_NWMS_Spanish.pdf (accessed on 10 July 2017).
  31. Shams, S.; Sahu, J.N.; Rahman, S.S.M.; Ahsan, A. Sustainable waste management policy in Bangladesh for reduction of greenhouse gases. Sustain. Cities Soc. 2017, 33, 18–26. [Google Scholar] [CrossRef]
  32. Smith, A.; Keith, B.; Ogilvie, S.; Rushton, K.; Bates, J. Waste Management Options and Climate Change. Final Report to the European Commission, DG Environment. 2001. Available online: http://ec.europa.eu/environment/waste/studies/pdf/climate_change.pdf (accessed on 9 July 2017).
  33. Li, Y.; Zhao, X.; Li, Y.; Li, X. Waste incineration industry and development policies in China. Waste Manag. 2015, 46, 234–241. [Google Scholar] [CrossRef] [PubMed]
  34. Gradus, R.H.J.M.; Nillesen, P.H.L.; Dijkgraaf, E.; Van Koppen, R.J. A Cost-effectiveness Analysis for Incineration or Recycling of Dutch Household Plastic Waste. Ecol. Econ. 2017, 135, 22–28. [Google Scholar] [CrossRef]
Figure 1. Population projection for the locality under study 2010–2033.
Sustainability 09 01758 g001
Figure 2. Graphical representation of the EC and the ENC of the scenarios.
Sustainability 09 01758 g002
Figure 3. Graphic diagram of the dominance matrix.
Sustainability 09 01758 g003
Table 1. Types of treatment selected by waste stream.
TreatmentOrganic Waste: Food and Garden WastePlastic: Rigid and FilmPaperGlassOthers: Diapers, Paperboard, Tetrapack, Non-Ferrous Metal
(1) Recycling XXX
(2) CompostingX
(3) Incineration with energy recovery XX
(4) LandfillingXXXXX
Table 2. Economic costs of treatment options by waste stream ($/t).
Organic WastePlasticPaperGlassOthers
Recycling (1)-93.89−6720.12-
Composting (2)47----
Incineration (3)-14.5314.53--
Landfilling (4)7272727272
Source: Adapted from [10,18,19].
Table 3. Environmental costs of treatment options and landfilling of waste stream (CO2/t).
Organic WastePlasticPaperGlassOthers
Recycling (1)-−1.30−3.89−0.31-
Composting (2)0.09----
Incineration (3)-1.38−0.49--
Landfilling (4)0.470.040.440.440.48
Source: Adapted from [12,20,21,22,23,24].
Table 4. Total generation by waste stream (tons).
Total Generation in the Horizon of the ProjectOrganic WastePlasticPaperGlassOthers
352,734.72196,931.7940,846.6825,855.459065.2880,035.51
Table 5. Scenarios generated and their coding.
ScenarioCodingScenarioCodingScenarioCoding
E121114E1321344E2541414
E223114E1423344E2643414
E324114E1524344E2744414
E421314E1621444E2841144
E523314E1723444E2943144
E624314E1824444E3044144
E721414E1941114E3141344
E823414E2043114E3243344
E924414E2144114E3344344
E1021144E2241314E3441444
E1123144E2343314E3543444
E1224144E2444314E3644444
Table 6. Initial decision matrix.
ScenarioEC (US$)ENC (t/CO2)
A (21114)17,303,523.74−100,144.62
B (24144)16,879,696.75−38,370.15
C (24114)16,409,389.90−45,165.23
D (23144)14,532,238.0216,111.00
E (23114)14,061,931.179315.92

