Design, Prototyping, and Assessment of a Wastewater Closed-Loop Recovery and Purification System


Department of Industrial Engineering, Alma Mater Studiorum—University of Bologna, Viale del Risorgimento, 2, Bologna 40136, Italy
*
Author to whom correspondence should be addressed.
Sustainability 2017, 9(11), 1938; https://doi.org/10.3390/su9111938
Submission received: 2 October 2017
/
Revised: 20 October 2017
/
Accepted: 22 October 2017
/
Published: 25 October 2017
(This article belongs to the Special Issue Sustainability in Food Supply Chain and Food Industry)
Abstract
:Efforts to decrease the water use within industry are mandatory to pursue product and process sustainability. Particularly, the European Union (EU) is at the top level for water consumption in industry, while some sectors, such as the food and beverage (F&B), are highly water-intensive with hundreds of liters per hour of consumed and, then, drained water. This article provides a systematic overview of the most innovative insights coming from an EU Eco-Innovation project dealing with greening the F&B industry through the design, prototyping, technical, economic, and environmental assessment of a wastewater closed-loop recovery and purification system. The system, tailored for a standard mid-size F&B company using 2–3 billion L/year of raw water, collects, purifies and recirculates the key produced wastewater streams with an overall recovery efficiency of about 56%. The proposed purification technology comes from the most efficient combination of membrane-based filtration methods, reverse osmosis (RO), and ultraviolet modules. Evidence from the technical design, full-scale on-site technology prototyping, net-present-value (NPV) analysis and system life-cycle-assessment (LCA) are presented concluding about the convenience of adopting the proposed solution to reduce costs and impacts on the environment.
1. Introduction and Background
Nowadays, the urgency in decreasing the natural resource depletion makes necessary to invest in innovative and sustainable process plants and technologies. According to the United Nations sixth sustainable development goal, pure water requires specific efforts because of its key role for the equal growth of communities, feeding the most of the anthropic activities [1]. In this context, the FAO Aquastat database provides wide information about the origin, use and disposal of this basic resource [2], while rising attention from institutions, industry and the public opinion is toward solutions for the water intensity decrease and wastewater recovery, purification and reuse. Focusing on the European Union (EU), industry is responsible of the most of the water consumption, while the food and beverage (F&B) sector is very water intensive, i.e., ~100.000 L/h of input raw water generating thousands of liters of wastewater every day. Sustainable innovations in F&B, leading to the reduction of the required primary water, are desirable and encouraged [3,4]. Technologies focusing on wastewater recovery, purification according to the top standards [5,6] and local reuse create virtuous closed-loops [7].
The current literature trend outlines multiple technologies for water purification. The authors, in [8], present a systematic review and classification on the topic outlining that solutions based on mechanical filtration and/or reverse osmosis (RO) potentially match the constraints of the F&B industry, i.e., high flow rate and high water quality standards. Examples and solution feasibility studies and prototypes are in [9,10,11,12,13]. Nevertheless, full-scale systems targeted and validated on the F&B industry needs are still missing and, most importantly, rarely adopted in practice with the final effect of an exponential increase of the water consumption and draining. Efforts to overcome these limits are mandatory.
This paper contributes to address the introduced lacks presenting the scientific evidences of an EU Eco-Innovation Project aiming at the design, full-scale prototyping, and assessment of an innovative system for the F&B industry wastewater closed-loop recovery and purification. The system combines advanced purification technologies allowing reducing the necessary input raw water and decreasing the overall system water footprint. According to this purpose, Section 2 presents the system design and prototyping, Section 3 proposes the full-scale prototype field-test and technical validation within an Italian mid-size F&B company, Section 4 presents the system economic assessment, while Section 5 summarizes the system life-cycle-assessment (LCA). The paper conclusions and research next steps are provided in Section 6.
2. System Design and Prototyping
The first mandatory step deals with the definition of the purification technology to adopt in relation to the plant capacity, in m3 per hour of entry wastewater, and the wastewater quality. To this purpose, an industrial survey over a significant set of mid-size F&B industries allows getting the main drained wastewater streams together with the continuity of the flow and the pollutant categories. Table 1 summarizes the survey outcomes.
The survey reveals that the contaminants are different in nature and concentration, e.g., organic compounds (fruit juices, sugar, ascorbic and citric acids), chemicals from washing and disinfecting of the equipment (caustic soda, nitric acid, peroxides, and chlorine), salts, and metals at high concentration from the RO retentate, etc.
Starting from these data and with the aim of designing a continuous process addressing the most quantitatively relevant water flows, the target recovery and purification plant flow rate is set to 45 m3/h so that the RO retentate and the filler drained wastewater can be fully processed. Nevertheless, in terms of pollutants, these two water flows do not represent a significant F&B sample because of the presence of the other organic and chemical compounds. For this reason, the chosen purification technology is designed to be able to process all five water sources and specific field tests verify such condition by artificially creating different types of wastewater dosing concentrates of production wastes. In this way, no lack of generality occurs guaranteeing the system flexibility to multiple operative contexts.
2.1. System Functional Design
The system functional design is highly dependent on the chosen combination of purification technologies allowing the output water to have the physical, chemical, and microbiological conditions fitting to the F&B industry safe use, according to the regulations in force. To this purpose, the authors develop a review, covering the last three decades, of the existing water purification technologies applied to the F&B industry outlining strengths and weaknesses and presenting an original matrix analysis to identify trends and the technology readiness level (TRL) of each of them. The full discussion of such study is out of this paper boundaries and it is available in [8].
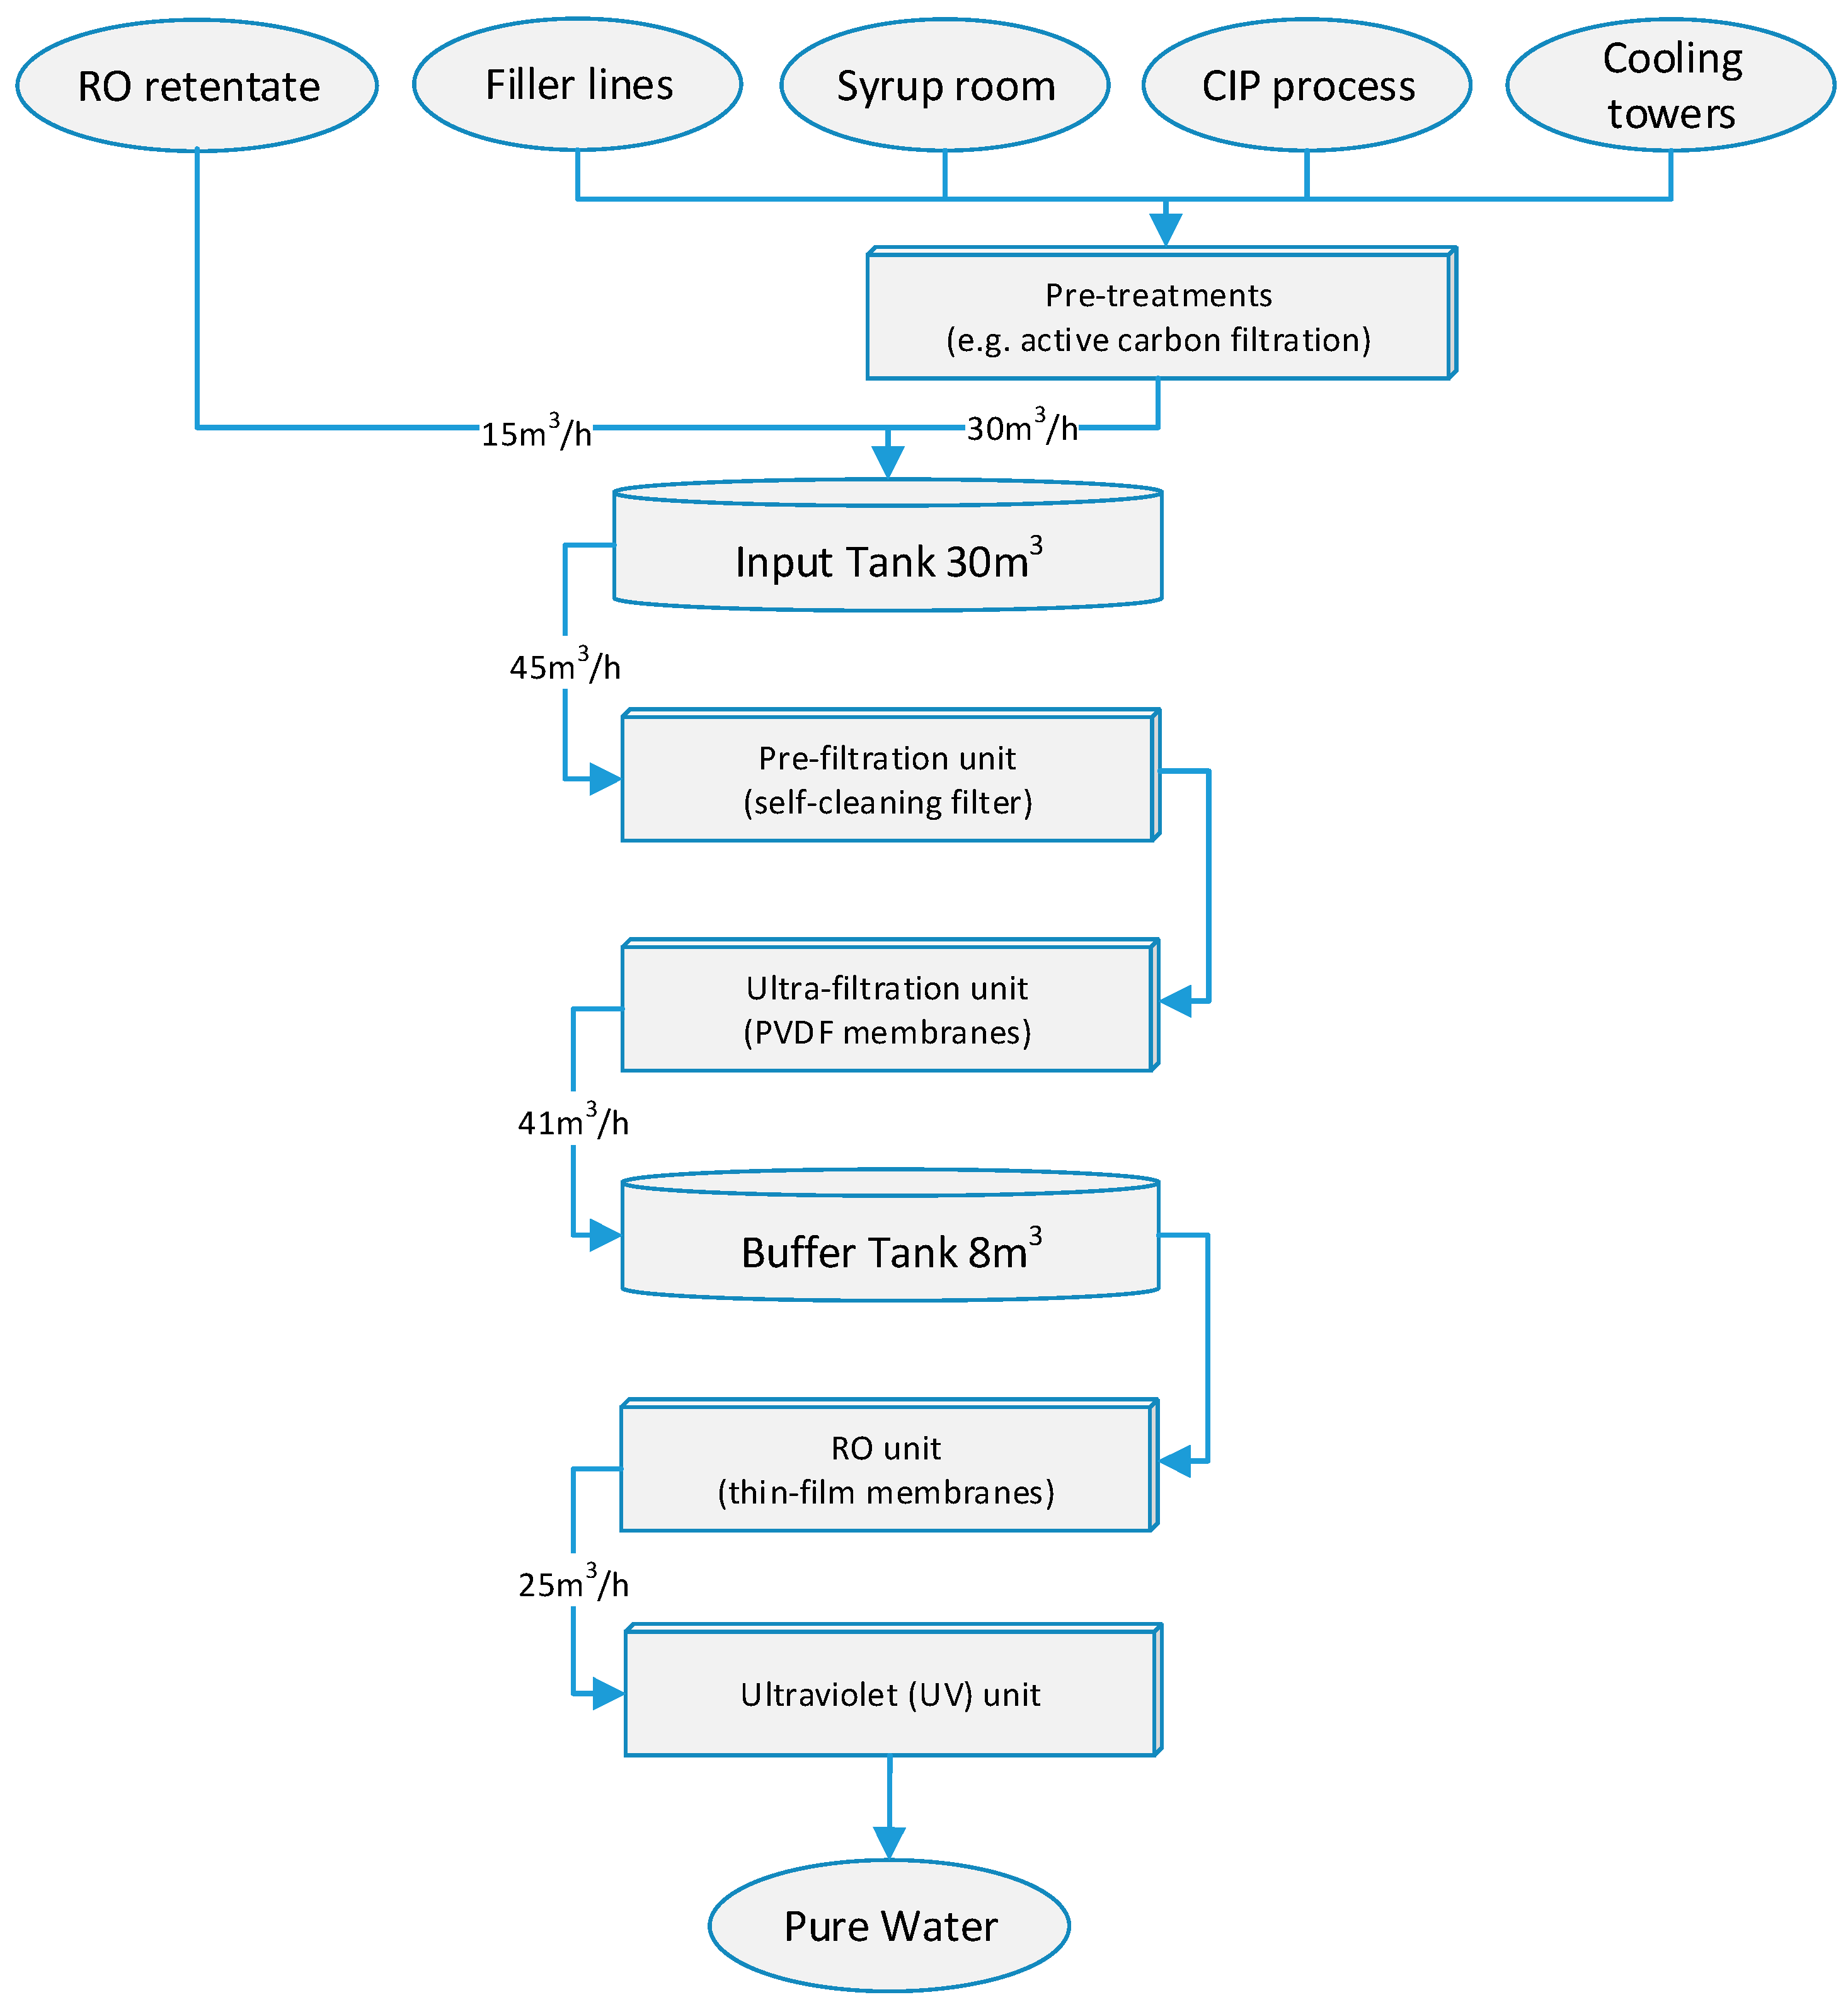
Merging the survey on the wastewater sources from the F&B industry and the review on the available technologies for water purification, the overall rationale of the prototypal system is outlined in the schematic in Figure 1.
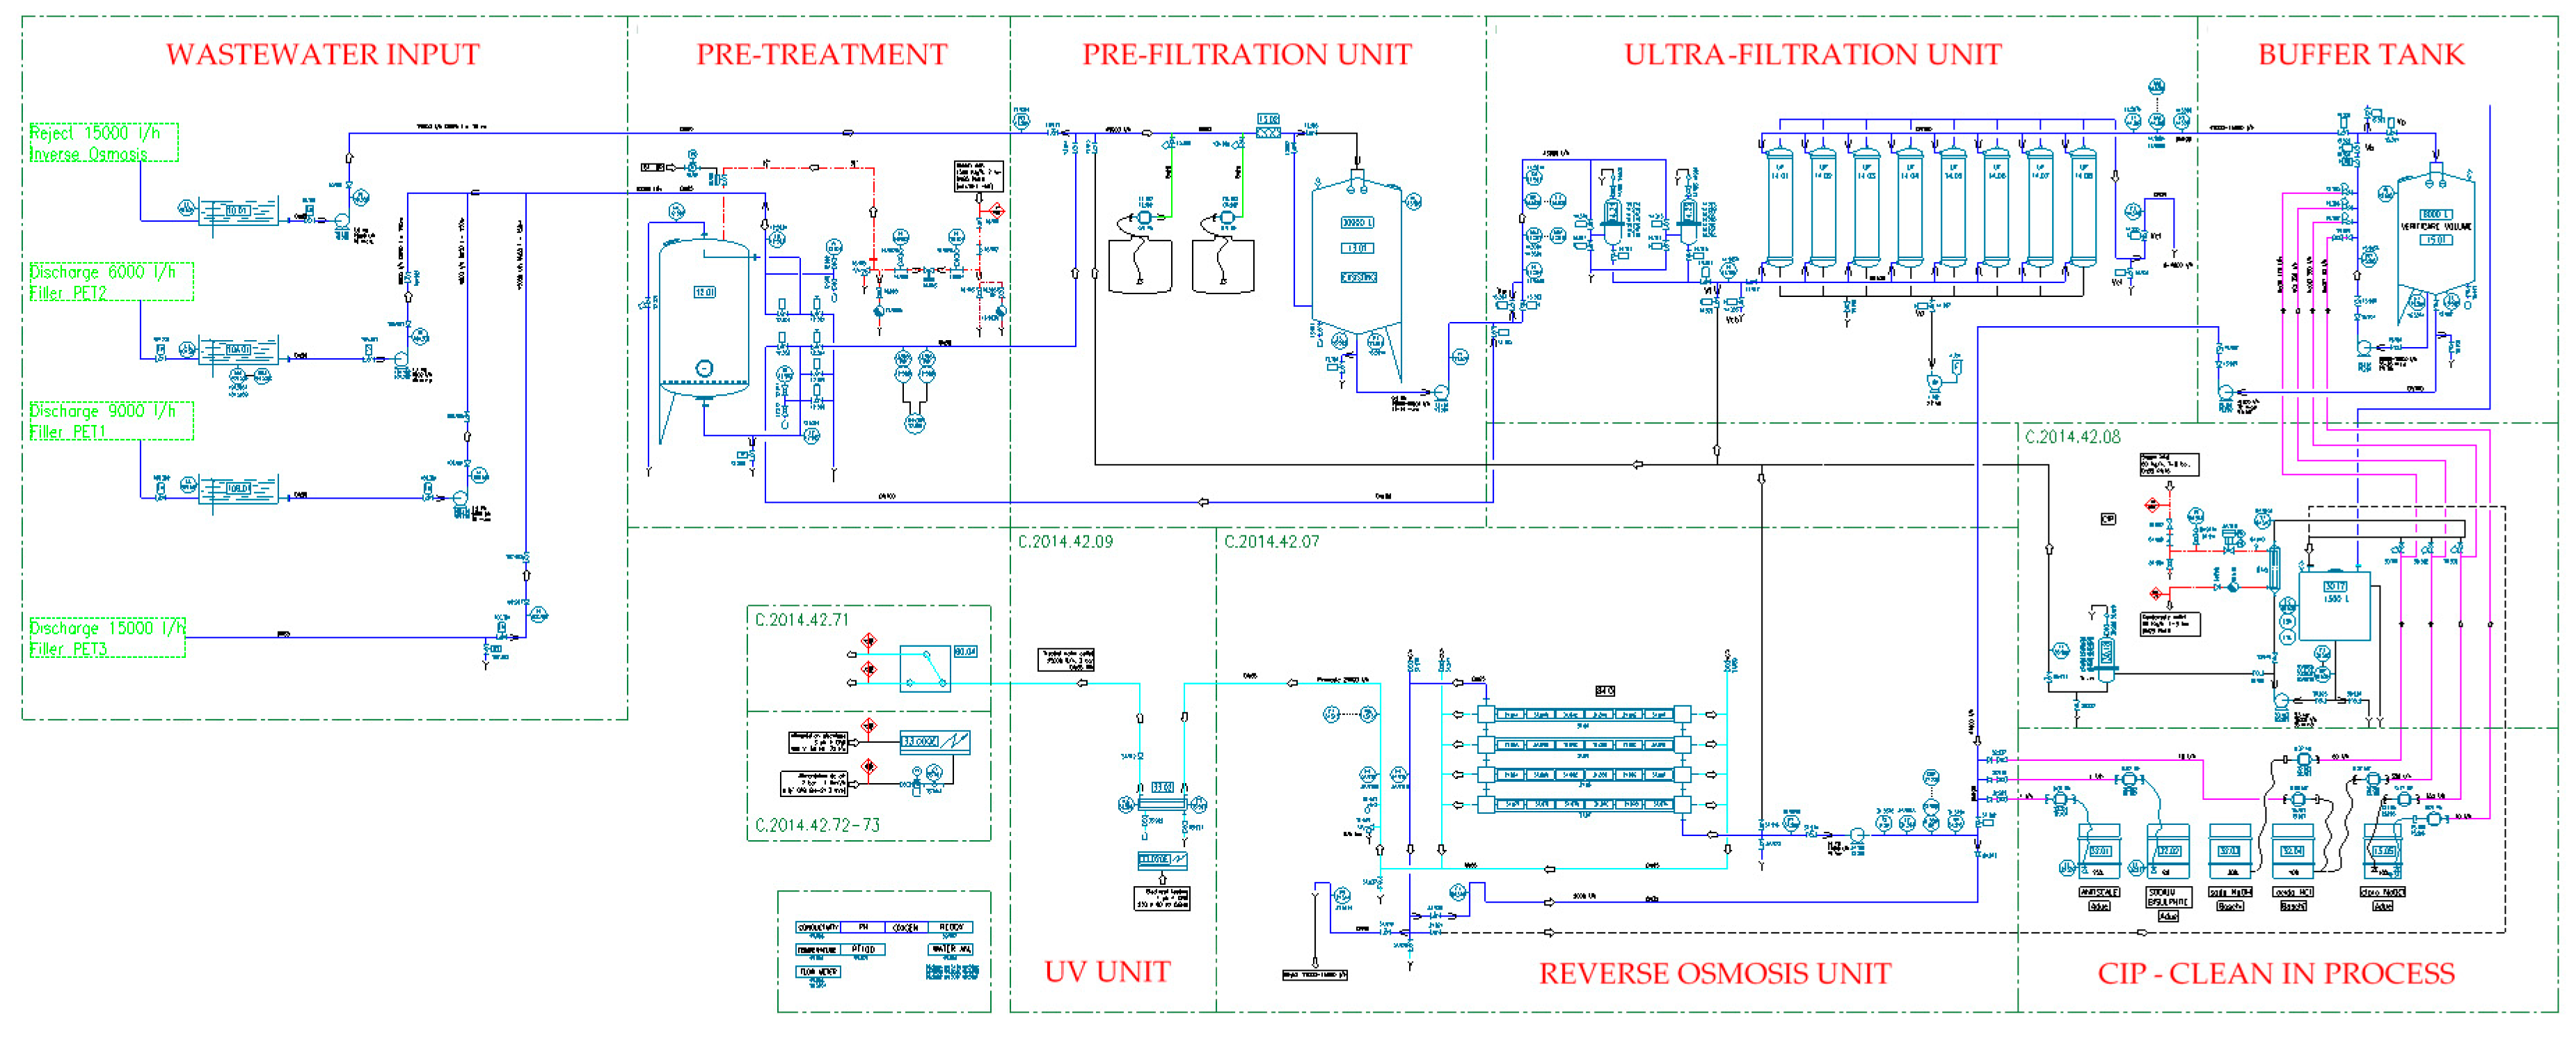
An input buffer tank of 30 m3 allows collecting the water to treat. This tank is filled by the different streams of wastewater, RO retentate, and filler cleaning water, mainly. In addition, in the case some preliminary treatments are necessary, due to specific water pollutants that must be cut off immediately, the correspondent module is added. For example, water from the fillers has peracetic acid contamination to neutralize adopting an activated carbon filter before feeding the main purification treatment. The input buffer tank feeds the pre-filtration and, then, ultrafiltration units aimed at removing the suspended solid compounds from the water stream. Such units are sized for 45 m3/h of entry water to treat. Particularly, the pre-filtration unit is to tackle the largest particulate matter, up to 50 µm, including suspended organics, protecting the ultrafiltration module from the excessive fouling and forthcoming stops for cleanings. Such a latter module is a parallel of multiple sub-units matching the target flow rate and able to guarantee a filtration capacity up to 75 nm. The core of the ultrafiltration module are the PVDF membranes able to work both in cross-flow and dead-end mode and reducing the suspended solids up to 0.1 mg/L (0.1 NTU) with an average efficiency of about 90% [14,15]. No action is on the dissolved solids. To this purpose, the output water flow entries the RO module targeted for the separation of the dissolved solids, e.g., dissolved salts [16]. The polyamide thin-film composite RO membranes are set in a parallel of multiple modules matching the required flow rate with a nominal filtration efficiency of about 60%. Finally, to guarantee the microbiological charge is under control a standard UV unit (wavelength 253 nm and irradiation 40 mJ/cm2) is added as the last stage of the purification chain. The clean in process unit to wash the purification membranes when the pressure drop rises over the nominal limit set by the manufacturers completes the plant hardware together with an 8 m3 buffer tank to decouple the ultrafiltration and the RO units. The plant P and ID is shown in Figure 2.
2.2. System Supervising and Control
The supervising system allows the autonomous run of the plant, managing both the up time and the periodic clean in process cycles. The local custom PLC acquires the signals from the field, manages the plant, and collects the run data to store and communicate via Ethernet. To this purpose, the key nodes of the plant are equipped with sensors getting real-time the flow rate, temperature, pH, redox, pressure drop, and turbidity (Figure 3). Further details on the system structure, i.e., process and control modules, are available in [17].
3. Field-Test and Technical Validation
A full-scale prototype of the proposed recovery and purification system is installed at an Italian mid-size F&B company processing soft drinks, sauces, juices, and colas. The company actually obtains the required process water from different on-site wells and drains the wastewater immediately after use with no recovery, i.e., an open-loop cycle. Such a condition is frequent within the F&B industry. The average water requirement to feed the production lines is of about 2.5 billion liters of pure water per year.
At the end of the mandatory setup and plant tuning, a field-campaign allows validating the system technical performances and collecting data for the forthcoming economic and environment assessments. Two sets of plant field-tests are done. The former is made of multiple short runs; each of them is by feeding the system with a specific polluted wastewater, covering a wide range of the spectrum of possible plant input. The latter is an extensive plant run, useful to measure the average working conditions and collecting the data to obtain the plant overall efficiency. Results from both sets of tests are in the following.
3.1. Field-Tests with Different Contaminants
The proposed system must be able to purify multiple wastewater streams, corresponding to the most common contaminated water flows generally drained by the F&B industry. To field-test the potential and flexibility of the proposed plant, a major set of short runs with wastewater contaminated with specific pollutants is done. The following Table 2 shows the investigated contaminants, presenting the eight developed short runs.
Run #1 and #2 process wastewater representative of the most significant quantitative flows, while the other runs include a specific contaminant coming from the process. In runs #3 to #8, the contaminated wastewater is mixed with fillers and/or RO retentate to guarantee acceptable flow rates. The following Table 3 summarizes the field-test results comparing, for each run, the input and output water quality. It further shows the target to reach to make the output water potentially available for bottling reuse [5,6]. The input and output sample analyses are by an independent physical and chemical laboratory. The complete dataset about all the analyzed physical, chemical, and microbiological categories are available upon request to the authors.
Results confirm the possibility to reach good quality of the purified water starting from a wide range of input water contaminants. Improvements and further investigations are necessary in the future for the clean in process wastewater, i.e., Run #3 and #4, because of the borderline pH and alkalinity levels and for the sugar syrup contaminated wastewater, i.e., Run #5, because of the high turbidity of the output water. Nevertheless, such pollution categories are not far from being acceptable and the correspondent wastewater flow rate is limited.
3.2. Extensive System Field-Test
With the aim of testing the system performances over a long working time and a mix of input wastewater flows, a 250 days extensive field-test is done. During the test period the system operated for 4064 working hours with and average flow rate of about 15.3 m3/h. The input wastewater comes from RO retentate (41%), fillers (55%) and other minor discontinuous sources (4%). Such data are representative of the working plans of the F&B company hosting the system, while the lower flow rate with respect to the plant capacity is due to external production constraints not affecting the results, directly.
3.2.1. Plant Performances and Reference Index Calculation
Globally, during the field-test, 62,179.3 m3 of wastewater are processed (input), generating 35,271.3 m3 of pure water (output). The overall system efficiency, in mass, is of about 57% matching the nominal design value. The physical, chemical, and microbiological quality target limits are fully respected. The water independent analyses are available upon request to the authors and they are done on multiple water samples collected during the field-test, periodically.
In addition, thanks to the system supervising and control unit, the aggregate data about energy need and use of chemicals are collected allowing the calculation of reference indices useful to develop the economic and environmental system assessments. The following Table 4 presents such data.
3.2.2. Ultrafiltration and RO Unit Performances
Due to their crucial role within the developed recovery and purification system, the ultrafiltration and RO functional unit performances are investigated, separately, to outline their contribution to the global system efficiency. Particularly, the ultrafiltration unit reaches a global efficiency of 92.3%, while the key water losses are due to backwashes, chemical cleanings, and water cycle fluxes. In addition, the specific electric power need is of about 0.1890 kWh/m3 of processed wastewater. Concerning the RO unit, operating in cross-flow mode, the overall efficiency is of about 61.5% with water drains due to process retentate and water cycle fluxes. Due to the pumps to guarantee the working pressure, the module energy intensity is relevant with an average requirement of about 0.8054 kWh/m3 of processed wastewater.
4. Economic Assessment
The economic performance assessment aims at validating the proposed system against economic metrics expressing the overall long-term sustainability of investing in the proposed plant for the wastewater recovery and purification. According to the standard practice, the present economic analysis starts from the evidences and reference indices presented in Section 3 within the system technical validation and refers to the investments and rising costs, including the opportunity costs due to savings in raw water consumption, occurring during the plant lifetime. A standard reference year is considered and the analysis adopts the net-present-value (NPV) and payback-time economic assessment methods. To develop the economic assessment, a 15 years lifetime horizon is used with 6400 working hours per year. Furthermore, a realistic utilization factor of 90% is assumed according to the fluctuations of the production plans of F&B industry, presenting a seasonal component. In addition, the cost of raw water and of the electric energy are 2.12 €/m3 and 0.2 €/kWh according to the Italian tariffs. Furthermore, the plant investment, i.e., turnkey—all included, is of about 355,000 € and the yearly O and M cost is estimated as the 4% of the initial investment. Finally, a fair share of the general costs are included. Starting from such data, coming from industry and the good practice, and other relevant drivers of cost, Table 5 shows the annual differential cash flow analysis with and without the adoption of the proposed system.
A yearly positive contribution margin of 194,106.12 €/year rises due to the minor cost of raw water because of the closed-loop cycle introduced by the proposed system. Starting from this evidence and extending the analysis over the plant lifetime with a weighted average cost of capital of about 5%, representative of the investment risk, the NPV graph of Figure 4 follows. The NPV analysis includes extra investments, i.e., membrane replacement, of 26,000 € every five years.
The investment in the proposed recovery and purification system generates a positive NPV of about 1.6 M€ over the 15 years lifetime, while the initial investment payback-time is of about two years (without any accelerated amortization policy). Differences in the obtained results may occur mainly because of the raw water cost fluctuations, the system effective utilization factor, the cost of grid energy and minor auxiliaries cost changes. Nevertheless, the highly-positive results allow concluding about the potential economic relevance of investing in the proposed closed-loop wastewater recovery and purification system.
5. Life-Cycle-Assessment (LCA)
LCA is a powerful methodology to evaluate the environmental impact of a system over its life cycle. According to ISO 14040:2006 (E), the LCA framework includes four steps, i.e., goal and scope definition, inventory analysis, impact assessment, and result interpretation [18,19,20,21]. A cradle-to-grave perspective and SimaPro 7.3.3 by PRé Consultants software (Amersfoort, The Netherlands) are used. Furthermore, the impact assessment step compares Eco-indicator 99 Hierarchical version (EI99H) and IPCC 2007 Global Warming Potential (GWP) methods.
5.1. Goal and Scope Definition
The focused functional unit is the assembly, use, and disposal of the introduced wastewater closed-loop recovery and purification system described in Section 2. The confines of the system are from cradle-to-grave. Deep attention is on the water and energy consumption.
5.2. Inventory Analysis (LCI)
The inventory analysis considers raw material extraction processes, module manufacturing and assembly, shipments, water and energy use and saving, maintenance activities, recycling, and final disposal. Process data, material, and energy consumption are from field measurements and reliable assumptions, while unitary emissions and waste generation are from the Ecoinvent databank. Within the analysis, an important positive contribution is the avoided output because of the closed-loop due to the water recovery and local reuse.
Concerning manufacturing and assembly, the LCI focuses on each functional module, starting from its bill of materials. Low influence elements such as gaskets, heat exchangers, aspiration spears, PVC reductions and minor electronic components are neglected. The key materials are steel (S), aluminum (AISI 304L), polypropylene (PP), polyamide (PA), polyester, polycarbonate, and polyvinyl fluoride film (PVDF). All the processes necessary to the extraction and transformation of such raw materials and to manufacture and assembly the system are computed. The main manufacturing processes include welding, folding, cold impact extrusion, drawing of pipes, thermoforming, sheet rolling, wire drawing, and injection molding. Finally, the shipment phase is considered for all the components and materials.
The system use phase is 15 years long and it includes, as input, the water, energy, and chemical consumption and draining, together with the membrane replacement every five years. Raw water savings are included as avoided output.
Finally, the “waste scenario/US” from the SimaPro database is the base disposal scenario. Changes are according to the EU recovery and recycling goals and policy constraints including, for example, 85% and 55% of steel and plastic materials to recycle, respectively.
5.3. Impact Assessment (LCIA)
Table 6 shows the impact assessment of the proposed system according to EI99H for the assembly, operating and disposal life-cycle phases. Results highlight the operating and disposal phases as less environmentally sustainable, while the RO module use is responsible for about 45% of the total environmental burden, mainly due to fossil fuel use. Such results are confirmed by developing the environmental analysis according to the GWP method. Table 7 shows a system GWP close to 9,000 tonnes of CO2-eq. RO module use contributes for 50.47% and disposal contributes for 35.42% of the total equivalent carbon dioxide emissions.
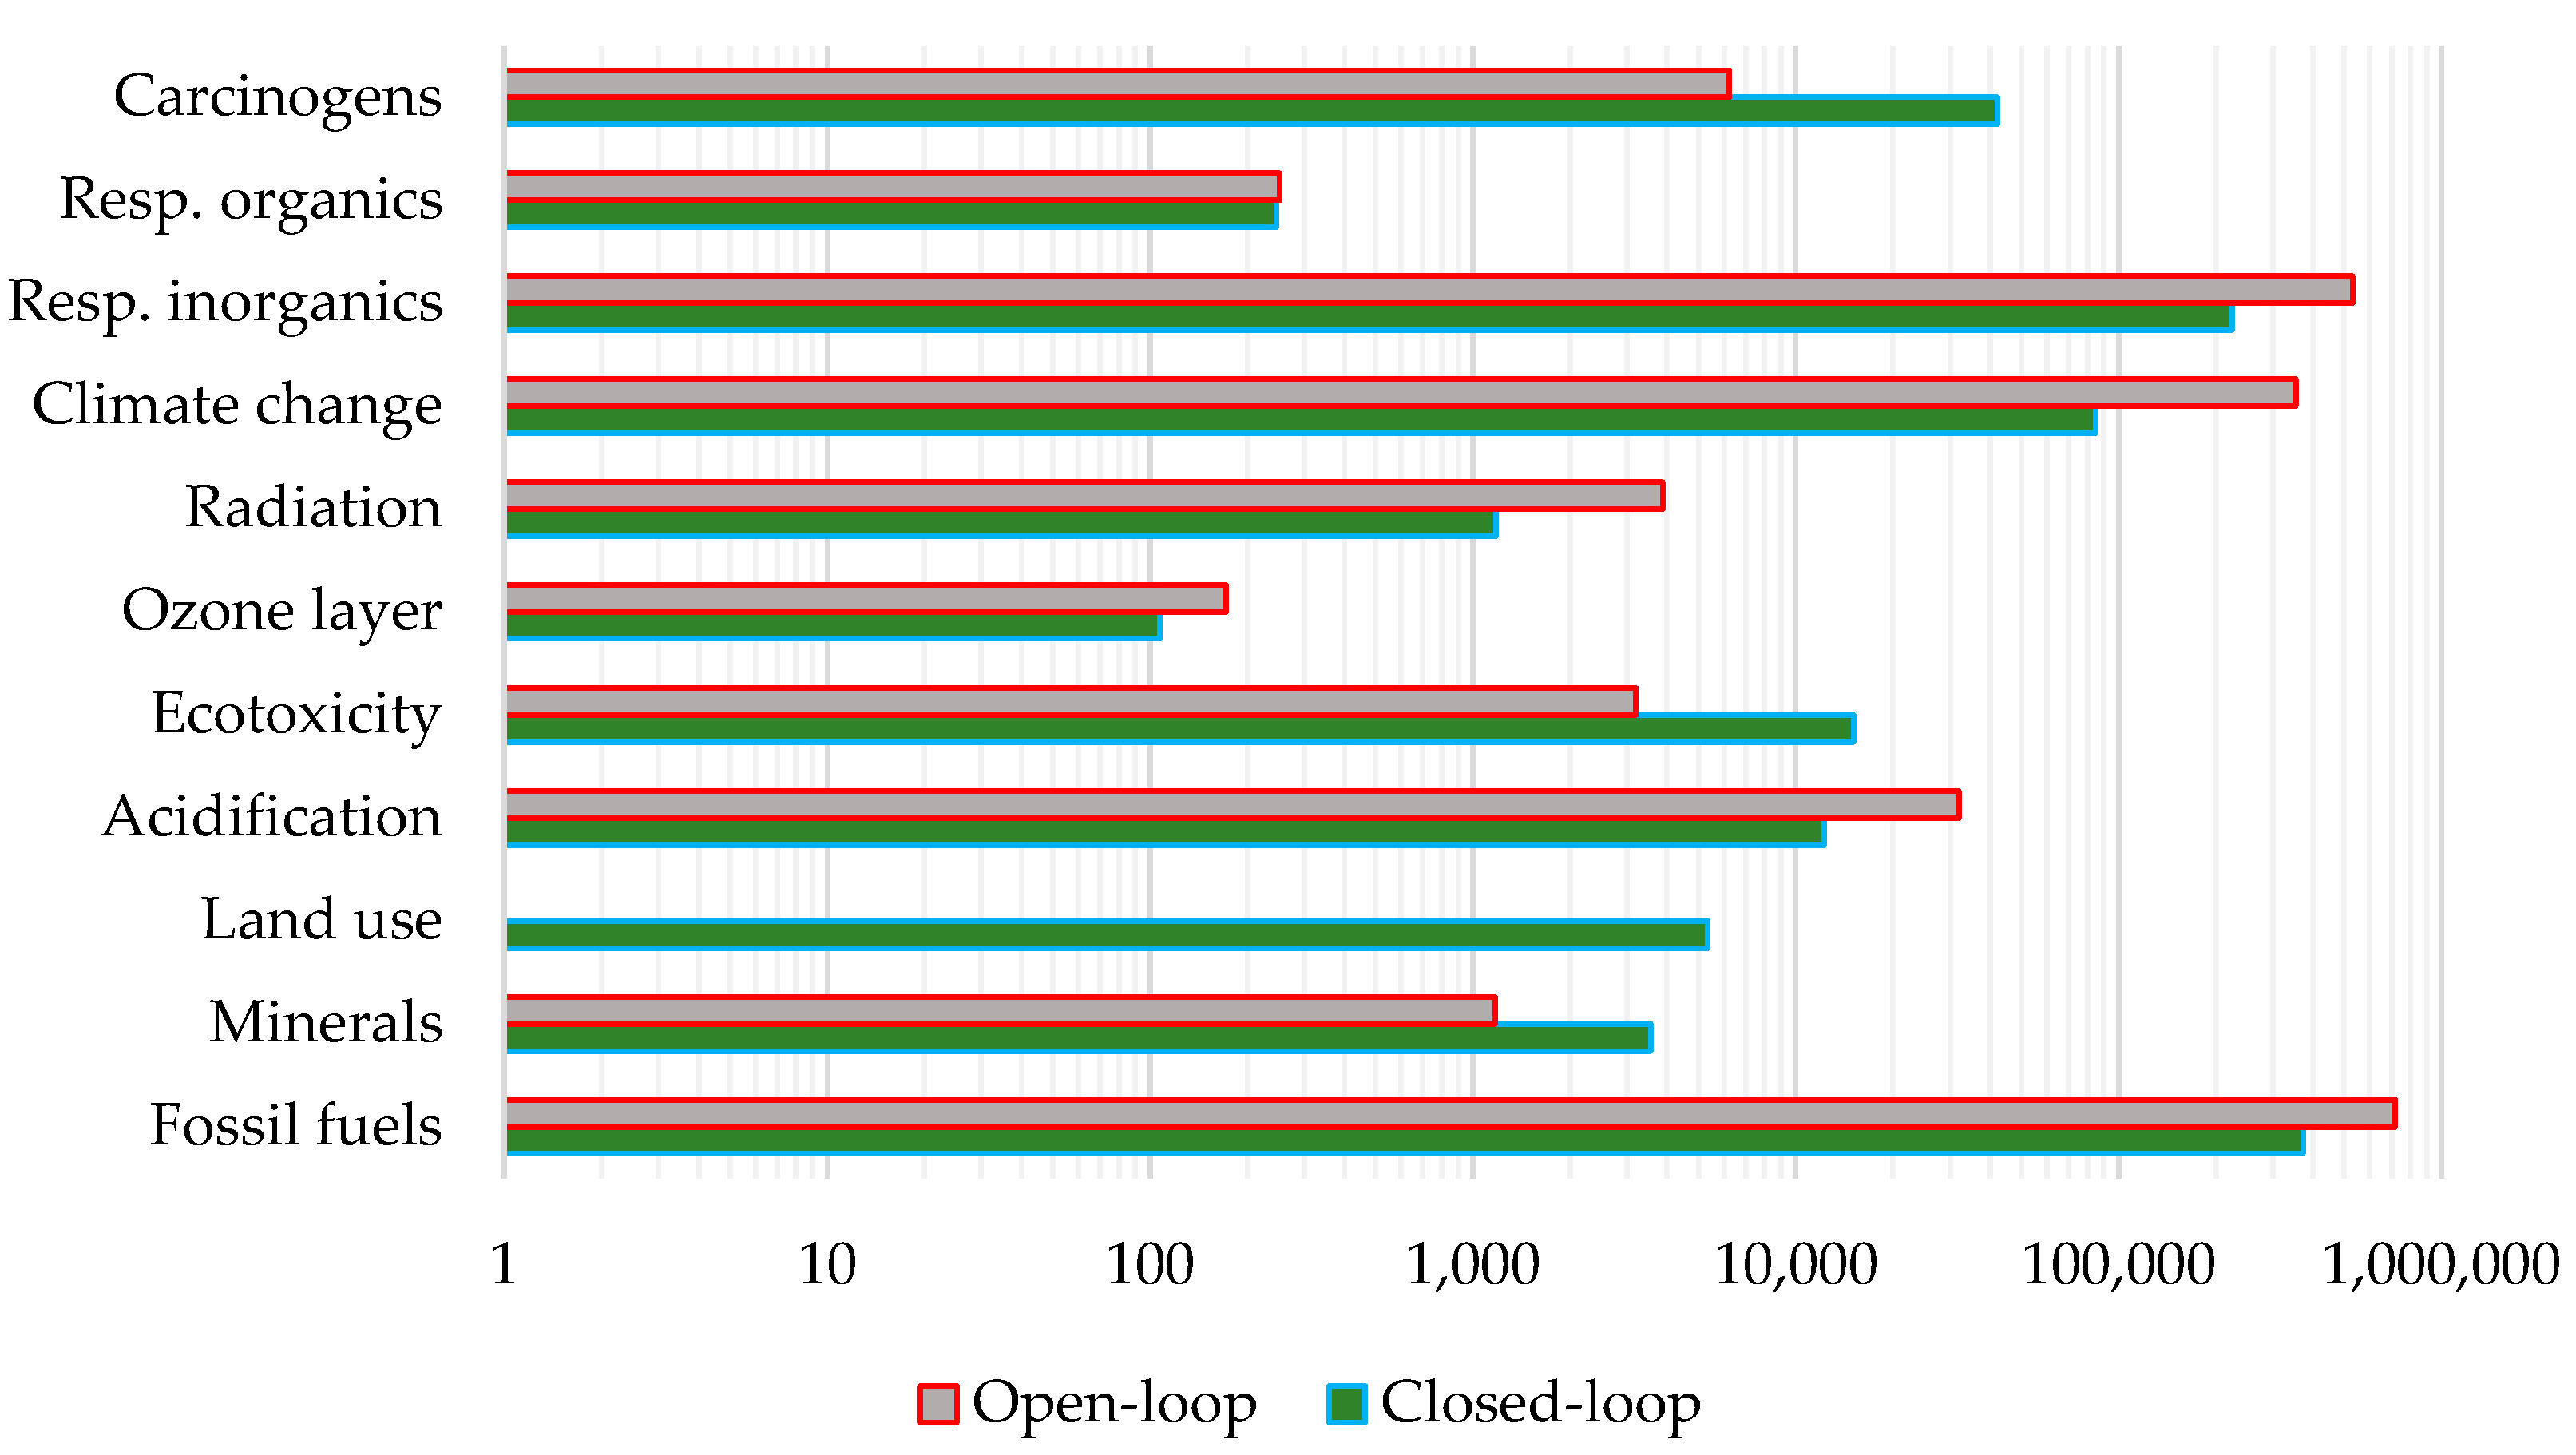
Finally, following the same differential approach adopted for the system economical assessment, the graph of Figure 5 compares the EI99H impact categories of the most frequently adopted open-loop water management, i.e., wastewater drain, toward the closed-loop water management, using the proposed system.
Despite the increase of some of the impact categories, the global environmental impact reduction is of 887,525.4 Pt (−53.8%) corresponding to a GWP saving of 28,122.4 tonnes of CO2-eq. not emitted over the plant lifetime (−75.9%).
5.4. Result Interpretation
The LCA analysis demonstrates that the assembly, use and disposal of the proposed closed-loop recovery and purification system allows getting a lower environmental impact respect to the standard practice of draining the F&B line wastewater. Globally, the environmental assessment allows concluding about the system sustainability and environmental convenience.
The LCIA outlines that the functional module with a major impact is the RO. This is particularly true during the system use phase. The RO module allows removing the dissolved solutes, e.g., salts, and it is responsible of 50.47% of the emitted CO2-eq. and of 44.61% of the damage points according to EI99H. The reasons for such an environmental burden are due to RO principle requiring high osmotic pressures, provided by pumps, to force the flow through the semipermeable membrane. Efforts to improve or replace RO are a research next step.
6. Conclusions and Next Steps
This paper presents a systematic description of the design, prototyping, and assessment activities developed within a European Union (EU) Eco-Innovation Project aiming at reducing the food and beverage (F&B) water footprint by introducing a wastewater local recovery and purification system. The system includes a wastewater collection unit and a combination of filtration technologies allowing getting pure water potentially usable within the F&B plant. The overall nominal system efficiency, field-tested through a full-scale prototype installed at an F&B Italian company, is of about 56% in quantity, while the water quality fits the target limits in force for advanced industrial uses in this sector. Furthermore, the economic and life-cycle assessments confirm the long term sustainability of the system, i.e., payback time of about two years, and a net CO2-eq. reduction of about 28,122.4 tonnes (−75.9%).
Next research steps deal with refinements in the system to validate and enlarge the spectrum of the processable wastewater thanks to the screening of parallel suitable technologies, actually at a lower technology readiness level (TRL), to spread the closed-loop water chain concept to a broader company set. Finally, the performance assessment based on extensive data from years of plant operation are of strong interest to confirm the promising results coming from the full-scale prototype field-test.
Acknowledgments
This work is developed within the CIP Eco-innovation Project No. Eco/13/630314/LESS-WATER BEV.TECH, co-funded by the Eco-innovation Initiative of the European Union, in partnership with A DUE S.p.A. and CVAR Ltd.
Author Contributions
Marco Bortolini and Mauro Gamberi supported the industrial partners in the design and system prototyping; Marco Bortolini and Francesco Pilati developed the field-tests and technical assessment; Marco Bortolini and Alberto Regattieri developed the economic assessment; Cristina Mora developed the environmental assessment; and Marco Bortolini and Cristina Mora wrote the paper.
Conflicts of Interest
The authors declare no conflict of interest.
References
- United Nations. 17 Goals to Transform Our World. Available online: http://www.un.org/sustainabledevelopment/sustainable-development-goals/ (accessed on 15 September 2017).
- Food and Agriculture Organization of the United Nations (FAO). Aquastat Database. Available online: http://www.fao.org/nr/water/aquastat/data (accessed on 10 September 2017).
- Leat, P.; Revoredo-Giha, C.; Lamprinopoulou, C. Scotland’s food and drink policy discussion: Sustainability issues in the food supply chain. Sustainability 2011, 3, 605–631. [Google Scholar] [CrossRef]
- Fitzgerald, J.B.; Auerbach, D. The political economy of the water footprint: A cross-national analysis of ecologically unequal exchange. Sustainability 2016, 8, 1263. [Google Scholar] [CrossRef]
- Council of the European Communities. Council Directive 80/778/EEC of 15 July 1980 Relating to the Quality of Water Intended for Human Consumption; Council of the European Communities: Brussels, Belgium, 1980. [Google Scholar]
- Council of the European Union. Council Directive 98/83/EC of 3 November 1998 on the Quality of Water Intended for Human Consumption; Council of the European Communities: Brussels, Belgium, 1998. [Google Scholar]
- Strategic Implementation Plan of the European Innovation Partnership on Water. Available online: http://ec.europa.eu/environment/water/reuse.htm (accessed on 1 September 2017).
- Accorsi, R.; Bortolini, M.; Ferrari, E.; Pilati, F. A review of technologies and applications for water purification in the food & beverage industry. In Proceedings of the XXII Summer School “Francesco Turco”—Industrial Systems Engineering, Palermo, Italy, 13–15 September 2017. in press. [Google Scholar]
- Rektor, A.; Kozak, A.; Vatai, G.; Bekassy-Molnar, E. Pilot plant RO-filtration of grape juice. Sep. Purif. Technol. 2007, 57, 473–475. [Google Scholar] [CrossRef]
- Vourch, M.; Balannec, B.; Chaufer, B.; Dorange, G. Treatment of dairy industry wastewater by reverse osmosis for water reuse. Desalination 2008, 219, 190–202. [Google Scholar] [CrossRef]
- Echavarría, A.P.; Torras, C.; Pagán, J.; Ibarz, A. Fruit juice processing and membrane technology application. Food Eng. Rev. 2011, 3, 136–158. [Google Scholar] [CrossRef]
- Habibi, A.; Aroujalian, A.; Raisi, A.; Zokaee, F. Influence of operating parameters on clarification of carrot juice by microfiltration process. J. Food Process Eng. 2011, 34, 860–877. [Google Scholar] [CrossRef]
- Meneses, Y.E.; Flores, R.A. Feasibility, safety and economic implications of whey-recovered water in cleaning-in-place systems: A case study on water conservation for the dairy industry. J. Dairy Sci. 2016, 9, 3396–3407. [Google Scholar] [CrossRef] [PubMed]
- Dead End membrane filtration. Laboratory Feasibility Studies in Environmental Engineering. Available online: http://www.egr.msu.edu/~hashsham/courses/ene806/docs/Membrane%20Filtration.pdf (accessed on 5 September 2017).
- Macedonio, F.; Drioli, E.; Gusev, A.A.; Bardow, A.; Semiat, R.; Kurihara, M. Efficient technologies for worldwide clean water supply. Chem. Eng. Process. Process Intensif. 2012, 51, 2–17. [Google Scholar] [CrossRef]
- Wenten, I.G. Khoiruddin Reverse osmosis applications: Prospect and challenges. Desalination 2016, 391, 112–125. [Google Scholar] [CrossRef]
- Bortolini, M.; Gamberi, M.; Pilati, F.; Regattieri, A.; Accorsi, R. Design of an innovative plant for the wastewater recovery and purification in the food & beverage industry. Smart Innov. Syst. Technol. 2017, 68, 691–700. [Google Scholar] [CrossRef]
- Environmental Management—Life Cycle Assessment—Principles and Framework; ISO UNI EN 14040:2006; International Organization for Standardization: Geneva, Switzerland, 2006.
- Environmental Management—Life Cycle Assessment—Goal and Scope Definition and Life Cycle Inventory Analysis; ISO UNI EN 14041:2004; International Organization for Standardization: Geneva, Switzerland, 2004.
- Environmental Management—Life Cycle Assessment—A Standard on Life Cycle Impact Assessment; ISO UNI EN 14042:2001; International Organization for Standardization: Geneva, Switzerland, 2001.
- Environmental Management—Life Cycle Assessment—A Standard on Life Cycle Interpretation; ISO UNI EN 14043:2001; International Organization for Standardization: Geneva, Switzerland, 2001.
Figure 1.
Recovery and purification system block diagram.

Figure 2.
Recovery and purification system executive P and ID.

Figure 3.
Sketch of the system supervising and control panel.
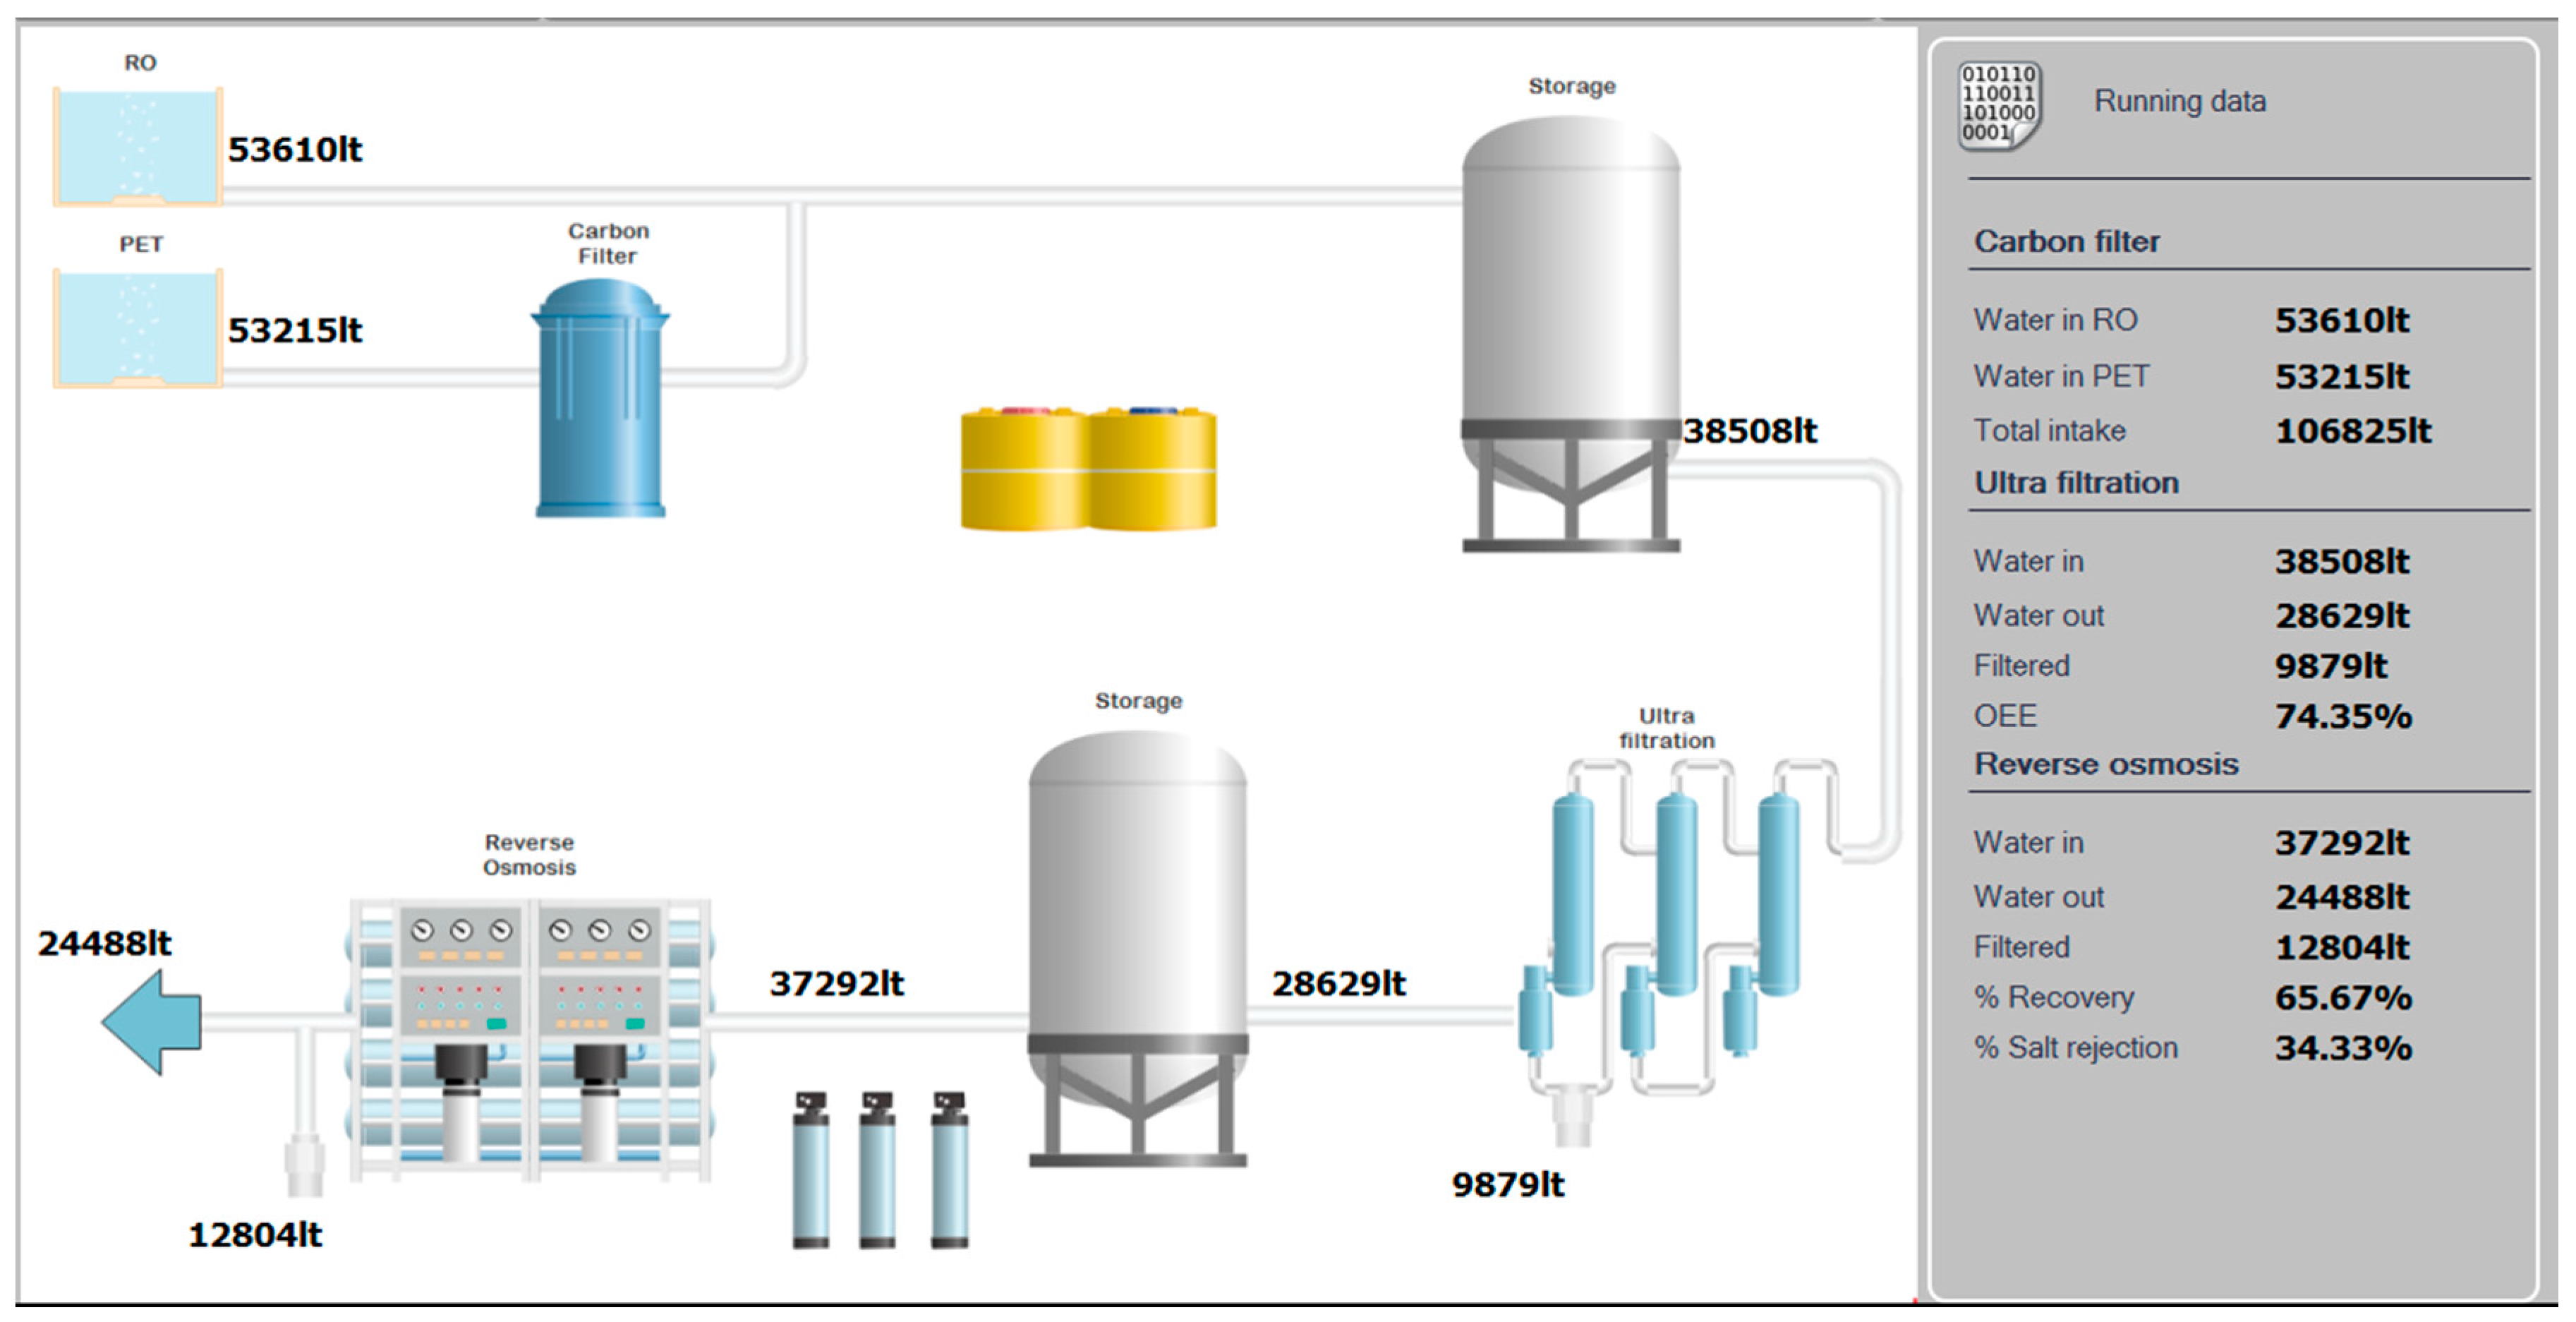
Figure 4.
Cash flow trend over the system lifetime.
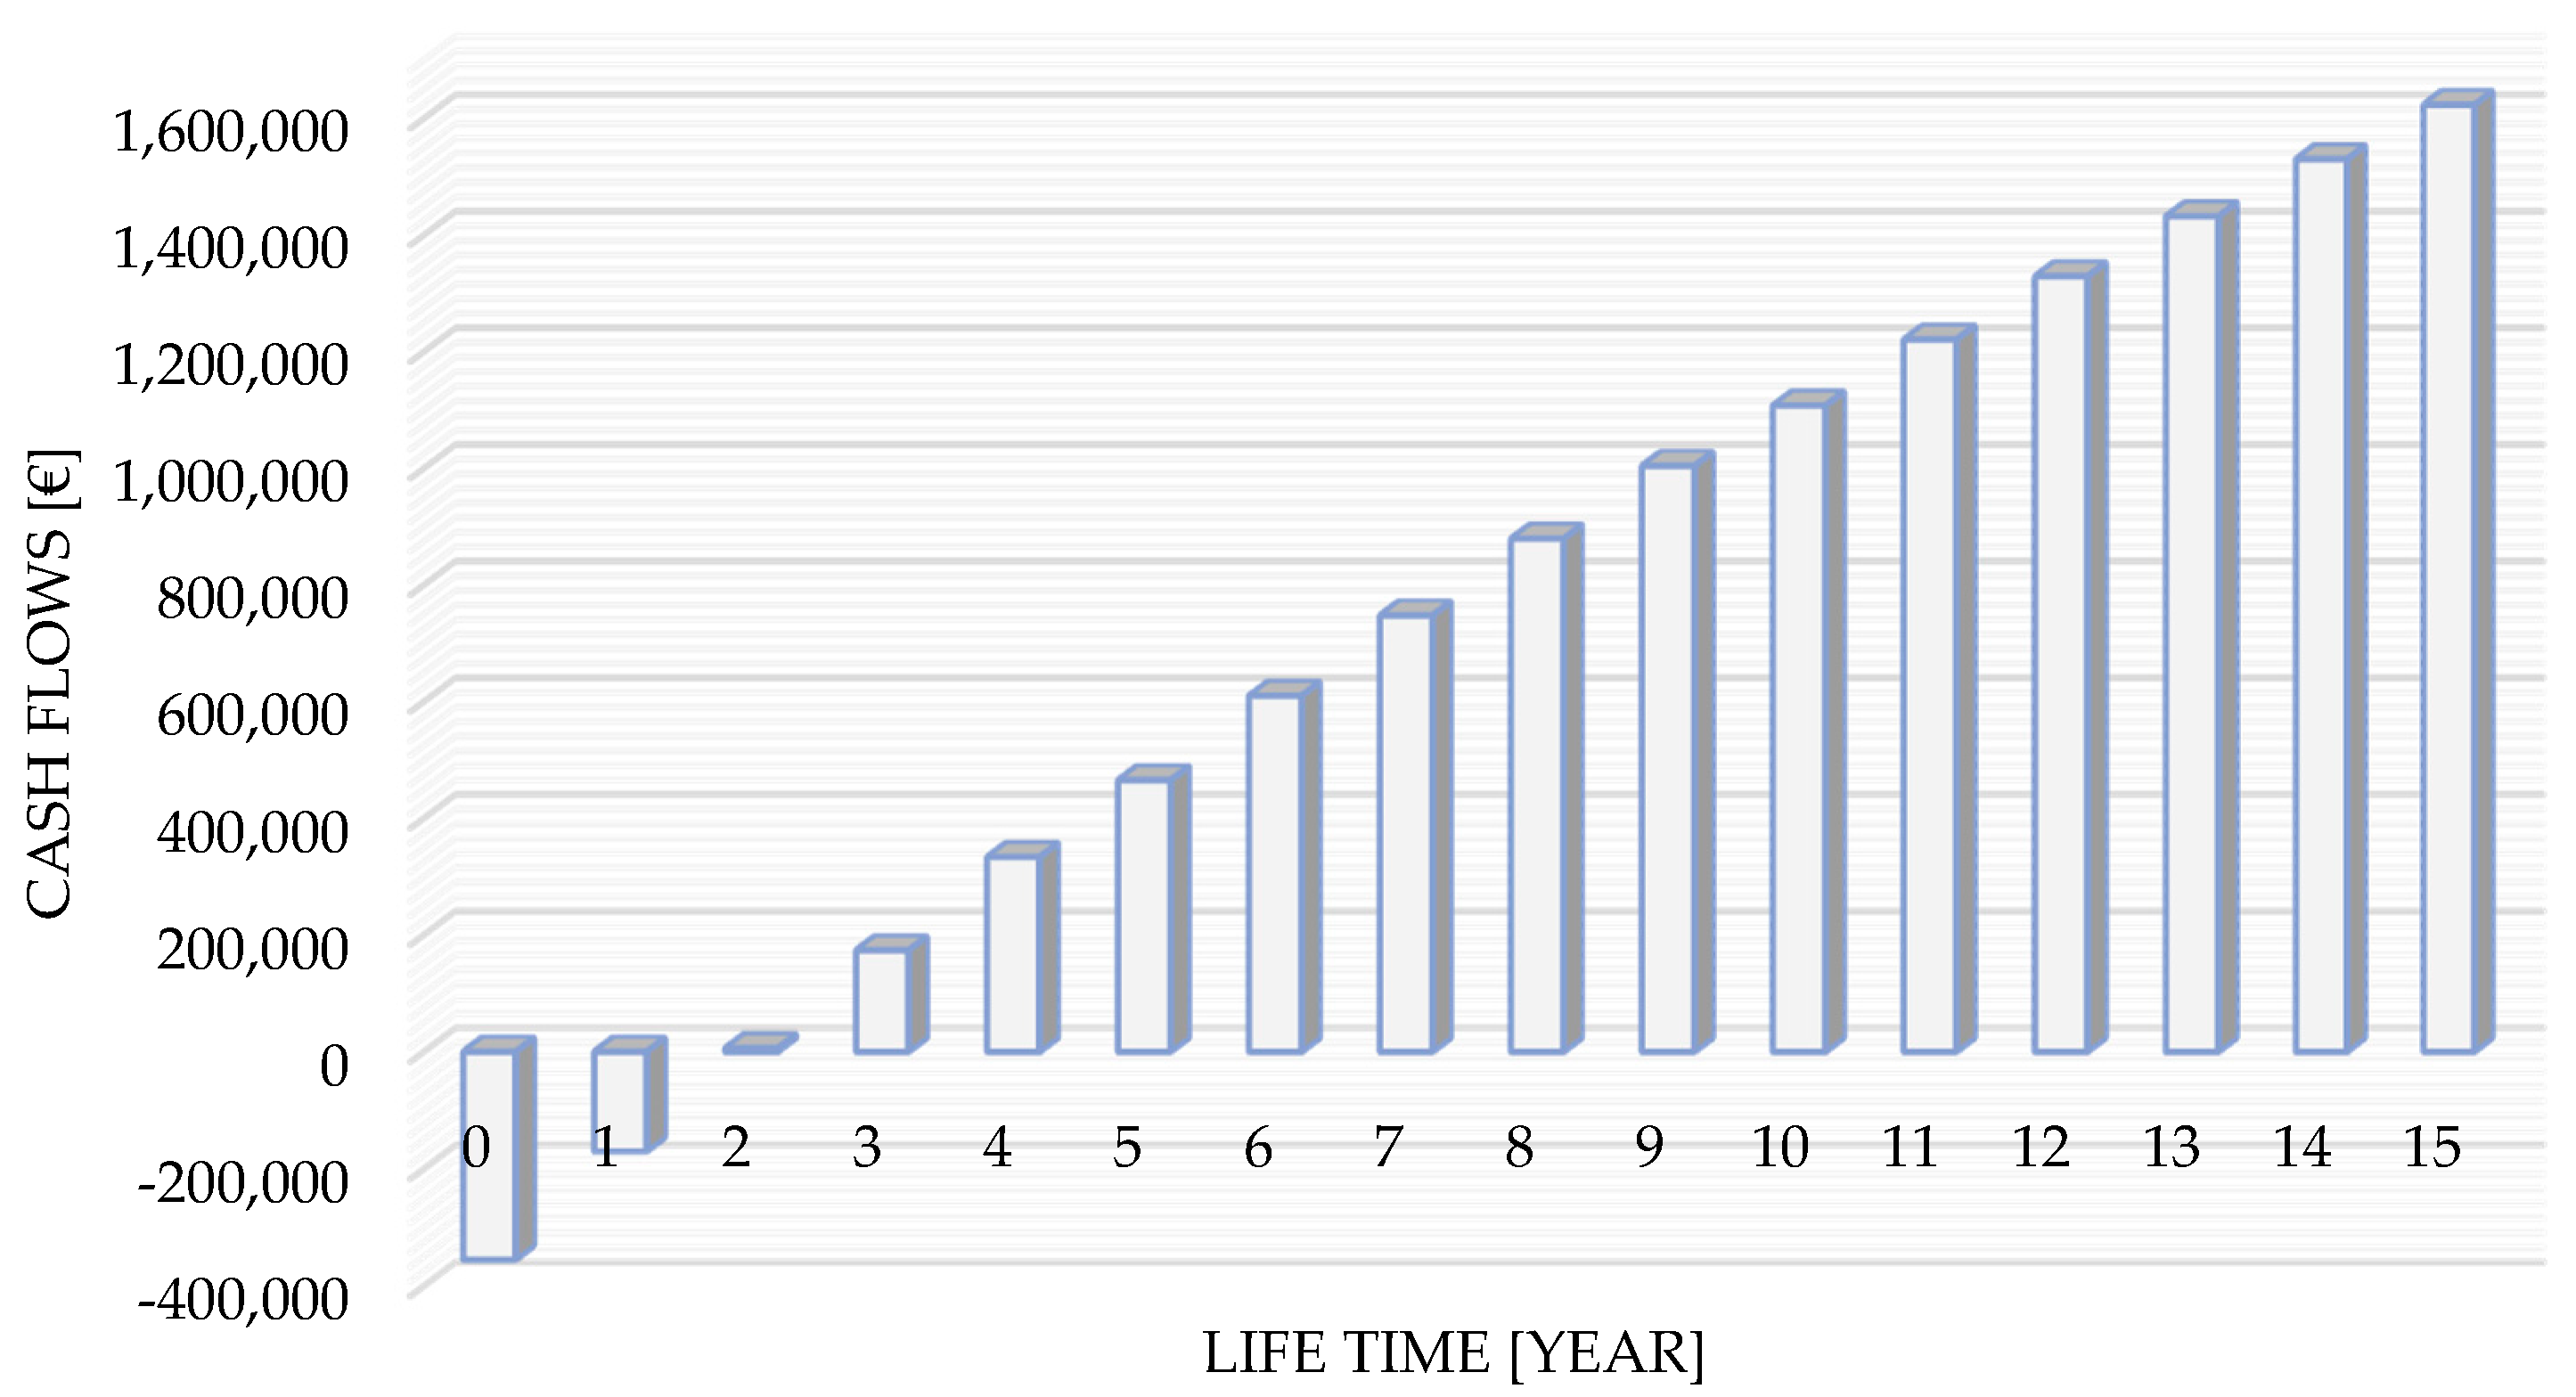
Figure 5.
Comparison between open-loop and closed-loop water management, EI99H single point (logarithmic scale).
Figure 5.
Comparison between open-loop and closed-loop water management, EI99H single point (logarithmic scale).

Table 1.
Wastewater sources and features for F&B companies.
| Category | RO Retentate | Fillers | Clean in Process | Syrup Room | Cooling Towers |
|---|---|---|---|---|---|
| Avg flow rate [m3/h] | 15 | 30 | 4 | 1 | 2 |
| Continuous flow | Yes | Yes | No | No | Yes |
| Total hardness [mg/L] | 1240 | 78 | 728 | 767 | 841 |
| Oxidability (Kubel) [mg/L] | <0.5 | <0.5 | 0.9 | 3530 | <0.5 |
| Conductivity [µS/cm] | 3080 | 158 | 2810 | 1625 | 841 |
| pH | 7.7 | 3.7 | 11.5 | 4.1 | 7.8 |
| Redox potential [mV] | 238 | 509 | 54 | 201 | - |
| Suspended solids [mg/L] | 1.5 | 5.5 | 1120 | 1280 | <1.0 |
| Turbidity [NTU] | <0.4 | <0.4 | 745 | 134 | 1 |
| Total alkalinity [mg/L] | 978 | 32 | 865 | 281 | 82 |
Table 2.
Short-test description, wastewater origin, and main contaminants.
| Run Id. | Wastewater Origin | Main Contaminants |
|---|---|---|
| #1 | RO retentate | Dissolved salts |
| #2 | Fillers | Peracetic acid |
| #3 | Clean in process (a) | Caustic soda + dissolved salts |
| #4 | Clean in process (b) | HCl + dissolved salts |
| #5 | Syrup room—sugar | Sugar syrup (0.1% avg conc.) |
| #6 | Syrup room—pear and peach | Organic matter: pear and peach puree (0.6% avg conc.) |
| #7 | Syrup room—tomato | Organic matter: tomato puree (0.3% avg conc.) |
| #8 | Syrup room—orange | Organic matter: orange puree (0.1% avg conc.) |
Table 3.
Field-tests with different contaminants and water quality results.
| Category | Target Limits | Run #1 | Run #2 | Run #3 | Run #4 | ||||
| Input | Output | Input | Output | Input | Output | Input | Output | ||
| Total hardness [mg/L] | <250 | 1240 | 66 | 78 | 34 | 728 | 2 | 837 | 3.8 |
| Oxidability (Kubel) [mg/L] | <5 | <0.5 | <0.5 | <0.5 | <0.5 | 0.9 | 0.5 | 1.6 | <0.5 |
| Conductivity [µS/cm] | <2500 | 3080 | 30.7 | 158 | <20 | 2810 | 274 | 3510 | 67 |
| pH | >4.9 | 7.7 | 7.8 | 3.7 | 7.2 | 11.5 | 10.9 | 2.6 | 4.8 |
| Redox potential [mV] | - | 238 | 294 | 509 | 327 | 54 | 5 | 293 | 101 |
| Suspended solids [mg/L] | <500 | 1.5 | 0.5 | 5.5 | 0.5 | 1120 | 7.6 | 5.4 | 2.4 |
| Turbidity [NTU] | <0.5 | <0.4 | <0.4 | <0.4 | <0.4 | 745 | 0.4 | 1.8 | <0.4 |
| Total alkalinity [mg/L] | <85 | 978 | 29.1 | 32 | 17 | 865 | 84.9 | <5 | <5 |
| Category | Target Limits | Run #5 | Run #6 | Run #7 | Run #8 | ||||
| Input | Output | Input | Output | Input | Output | Input | Output | ||
| Total hardness [mg/L] | <250 | 767 | <2 | 1130 | 26 | 452 | 28 | 222 | 10 |
| Oxidability (Kubel) [mg/L] | <5 | 3530 | 2.1 | 31.1 | 1.9 | 111 | <0.5 | 2900 | <0.5 |
| Conductivity [µS/cm] | <2500 | 1625 | 20 | 2450 | 29.2 | 1098 | 26.2 | 414 | 24 |
| pH | >4.9 | 4.1 | 5.9 | 6.6 | 5.4 | 6.2 | 5.7 | 5.9 | 5.5 |
| Redox potential [mV] | - | 201 | 404 | 239 | 160 | 266 | 131 | 183 | 184 |
| Suspended solids [mg/L] | <500 | 1280 | 20 | 570 | <5 | 230 | <5 | 83 | <5 |
| Turbidity [NTU] | <0.5 | 135 | 0.6 | 69.2 | <0.4 | 32.6 | <0.4 | 18 | <0.4 |
| Total alkalinity [mg/L] | <85 | 281 | 18.7 | 639 | 23 | 270 | 5.3 | 48 | 4.2 |
Table 4.
Use of chemicals and electric power, reference indices.
| Consumption | Reference Index | |
|---|---|---|
| Chemicals | ||
| Antiscalant | 344 L | 0.00537 L/m3 |
| Na2S2O5 25% | 688 L | 0.01074 L/m3 |
| HCl 30% | 77,800 L | 0.12544 L/m3 |
| HClO 15% | 273 L | 0.00439 L/m3 |
| Soda 30% | 236 L | 0.00380 L/m3 |
| Steam | 15,240 kg | 0.14510 kg/m3 |
| Electric Power | 71,099 kWh | 1.14345 kWh/m3 |
Table 5.
Annual cash flow differential analysis.
| Driver | Unitary Cost | Cash Flow | ||
|---|---|---|---|---|
| Initial extra-investment (turnkey, all included) | 355,000 | € | ||
| O&M (incidence on investment) | 4 | % | 14,200.00 | €/year |
| Grid electric power (industry) | 0.2 | €/kWh | 59,279.04 | €/year |
| Power factor (includes all needs & auxiliaries) | 1.14345 | kWh/m3 | ||
| Chemicals | ||||
| NaClO 15% | 0.2160 | €/L | 245.73 | €/year |
| Soda 30% | 0.2660 | €/L | 261.35 | €/year |
| HCl 30% | 0.9525 | €/L | 30,916.43 | €/year |
| Antiscalant 100% | 4.2000 | €/L | 6013.93 | €/year |
| Na2S2O5 25% | 0.3935 | €/L | 1126.90 | €/year |
| General plant differential costs | 5000.00 | €/year | ||
| Raw water saving (opportunity cost) | 0.00212 | €/L | (311,149.50) | €/year |
| Operative contribution margin | 194,106.12 | €/year | ||
Table 6.
Damage assessment of the system life-cycle, according to EI99H, in single points.
| Impact Category | Assembly | Operating | Disposal | Total | ||
|---|---|---|---|---|---|---|
| Filtration | RO | Others | ||||
| Carcinogens | 2922.3 | 678.0 | 26,127.1 | 295.2 | 12,087.8 | 42,110.4 |
| Resp. organics | 2.2 | 5.0 | 48.6 | 5.4 | 184.2 | 245.5 |
| Resp. inorganics | 5380.5 | 11,229.7 | 96,173.7 | 11,490.5 | 99,838.1 | 224,112.6 |
| Climate change | 925.4 | 5479.2 | 42,815.4 | 5590.0 | 30,181.9 | 84,991.9 |
| Radiation | 13.1 | 48.0 | 748.9 | 36.1 | 330.1 | 1176.2 |
| Ozone layer | 0.2 | 2.3 | 79.8 | 1.5 | 23.6 | 107.5 |
| Ecotoxicity | 809.1 | 278.7 | 5721.8 | 373.4 | 7950.2 | 15,133.2 |
| Acidification | 179.0 | 578.3 | 4440.2 | 565.9 | 6528.2 | 12,291.6 |
| Land use | 349.5 | −2.8 | 772.2 | 0.0 | 4222.2 | 5341.1 |
| Minerals | 305.2 | −128.1 | 2227.7 | 2.2 | 1152.4 | 3559.4 |
| Fossil fuels | 2570.5 | 21,604.4 | 160,339.8 | 22,206.6 | 165,289.2 | 372,010.5 |
| Total | 13,457.1 | 39,772.7 | 339,495.1 | 40,566.8 | 327,788.1 | 761,079.8 |
| 1.77% | 5.23% | 44.61% | 5.33% | 43.07% | ||
Table 7.
Damage assessment of the system life-cycle, according to GWP.
| Assembly | Operating | Disposal | Total | |||
|---|---|---|---|---|---|---|
| Filtration | RO | Others | ||||
| GWP [kg CO2-eq.] | 95,596.3 | 575,874.0 | 4,500,555.6 | 587,338.8 | 3,158,389.9 | 8,917,754.6 |
| 1.07% | 6.46% | 50.47% | 6.59% | 35.42% | ||
© 2017 by the authors. Licensee MDPI, Basel, Switzerland. This article is an open access article distributed under the terms and conditions of the Creative Commons Attribution (CC BY) license (http://creativecommons.org/licenses/by/4.0/).
Share and Cite
MDPI and ACS Style
Bortolini, M.; Gamberi, M.; Mora, C.; Pilati, F.; Regattieri, A. Design, Prototyping, and Assessment of a Wastewater Closed-Loop Recovery and Purification System. Sustainability 2017, 9, 1938. https://doi.org/10.3390/su9111938
AMA Style
Bortolini M, Gamberi M, Mora C, Pilati F, Regattieri A. Design, Prototyping, and Assessment of a Wastewater Closed-Loop Recovery and Purification System. Sustainability. 2017; 9(11):1938. https://doi.org/10.3390/su9111938
Chicago/Turabian StyleBortolini, Marco, Mauro Gamberi, Cristina Mora, Francesco Pilati, and Alberto Regattieri. 2017. "Design, Prototyping, and Assessment of a Wastewater Closed-Loop Recovery and Purification System" Sustainability 9, no. 11: 1938. https://doi.org/10.3390/su9111938
Note that from the first issue of 2016, this journal uses article numbers instead of page numbers. See further details here.