Self-Sufficiency versus Security: How Trade Protectionism Challenges the Sustainability of the Food Supply in Russia


School of Economics and Management, Harbin Engineering University, Harbin 150001, China
Sustainability 2017, 9(11), 1939; https://doi.org/10.3390/su9111939
Submission received: 4 October 2017
/
Revised: 21 October 2017
/
Accepted: 23 October 2017
/
Published: 25 October 2017
Abstract
:Food security is increasingly influenced by multilateral trade systems and foreign trade policies implemented by national governments. Many of them are now concerned about the sustainability of food supply and the vulnerability of domestic food markets to price volatility, and seek to support domestic producers and protect themselves from increasing food imports. Such restrictions improve food self-sufficiency, but decrease food security. It is important to understand any changes that may have occurred in the food consumption pattern due to trade protectionism and to observe any nutritional implications of these changes. This paper employs the rational food security (RFS) assessment approach, which differentiates sources of food supply on the domestic market, assesses the influence of agricultural and trade frameworks on food consumption patterns, and complies consumption with the appropriate food intake threshold. In the case of Russia, the study demonstrates that the conventional consumption approach to self-sufficiency (FSCA) underestimates the food insecurity level by not accounting for nutrition factors. In addition, the gap between the FSCA and the RFS increases in times of protectionist trade policy and decreases when the agricultural and trade policy framework turns to liberalization. The paper concludes that trade protectionism challenges the sustainability of food supply by decreasing food availability and quality of food products, causes dietary changes, and threatens the food security of the country.
1. Introduction
Sufficient food is the major human need and a guarantee of a right to life. In a context of globalization, each country seeks to secure its food security and ensure the well-being of its people. Both global and national dimensions of food security are developed under the influence of multilateral trade systems with food security deeply integrated into the rules of the trade regime [1]. With a trend towards liberalization of trade facilitated in the framework of the World Trade Organization (WTO), inter-state trading regulations have covered a wide range of agriculture and food security policies and made the WTO rules highly consequential for domestic and international food security policymaking [1]. In the course of the WTO rounds of trade negotiations, an increasing number of developing countries have transitioned from net food exporters to net food importers [2]. Those countries are now concerned about the sustainability of their food supply and their vulnerability to food price volatility. As a counter to liberalization, they are now re-examining their strategies for dealing with domestic agricultural production and food security concerns and seeking measures to improve the sustainability of food supplies while also protecting their domestic food markets from increasing imports. One of the most demonstrative examples of this type of policy is Russia, which alternated between the import-oriented model of food security and the import-substitution model of food self-sufficiency several times during 1991–2015 [3].
According to the Food and Agriculture Organization of the United Nations (FAO), the concept of food self-sufficiency means the extent to which a country can satisfy its food needs from its domestic production [4]. The practical application of this concept is that food self-sufficiency means that a country produces a proportion of its food needs that approaches or exceeds 100% of its food consumption [5]. Ritson understood food self-sufficiency as a proportion of imported food consumption [6]. Regarding security, Ritson suggested that an efficient system for the international trading of food was a vital component of world food security and that absolute self-sufficiency was not commensurate with this [6]. Luan, Cui, and Ferrat defined food self-sufficiency as the ability of a region to sustain its requirement for food [7].
While food self-sufficiency is mainly focused on the provision of the optimum balance between domestic food production and imports [8], food security is a wider concept. Food security is usually categorized as a non-trade concern within trade policy as it incorporates factors other than those directly relevant to the operation of an international market system. The FAO defines food security as physical, social, and economic access by all people at all times to sufficient, safe, and nutritious food which meets their dietary needs and food preferences for an active and healthy life [9]. Food insecurity happens due to the unavailability of food or insufficient purchasing power [9]. The FAO’s approach to food security is based on four pillars (food availability, access, utilization, and stability). Anderson focused on availability and access, and defined food security as an availability of nutritionally adequate and safe foods and an assured ability to acquire acceptable foods in socially acceptable ways [10]. The implication of such an approach is that food insecurity means uncertain (market environment) or limited (administrative regulations) availability of food on the domestic market, or ability to acquire acceptable foods using domestic production or import.
The liberalization of international trade has become a significant source of tension in contemporary agricultural change with the incorporation of agriculture into the world trading system [11]. Globalization has refocused attention from trade-based food self-sufficiency to availability-based food security. In the conditions of the liberalization of food trade and the reduction of administrative protection for food producers in accordance with the rules of the WTO, many countries have lost a part of their sovereignty over food policies [12]. WTO officials argue that to achieve food security, nations should encourage international trade in food [11]. Trade liberalization can affect the availability of certain foods by the removal of barriers to imports, but also to foreign investments in the development of domestic production. Thow and Hawkes found that the availability of processed food has risen in developing countries after foreign direct investment by multinational food companies [13]. Dorosh found a positive contribution of trade liberalization to food security and the stabilization of supply and the food market in the case of Bangladesh [14]. He concluded that food self-sufficiency was not a prerequisite for food security in the country.
Protection policies, including governmental restrictions on food imports intended to increase the food self-sufficiency of the country, on the contrary, may cause unnecessary social costs and place food self-sufficiency into conflict with the goals of food security and poverty reduction. Warr studied the effects of an import ban on rice introduced in Indonesia and concluded that the policy achieved the required level of food self-sufficiency, but only at the expense of reducing the food security of the most vulnerable people—the poorest net consumers [15].
Food security can be severely decreased not only by administrative regulations, but by high food costs, the reduced availability of healthy food, and the low purchasing power of a population [16]. Samaratunga studied food security issues in the case of Sri Lanka and concluded that the problem of food security in developing countries rested on many parameters apart from domestic production and import, such as the growth and distribution of income, population growth, and food consumption patterns [17]. Power [18], Sonnino, Faus, and Maggio [19], Kalugina [20], and Erokhin, Ivolga, and Heijman [21] support that food insecurity is directly related to low income, not to dependence on imports of foodstuffs.
From the above reasoning, for the purpose of this paper, we consider two of the FAO’s pillars of food security, i.e., food availability (domestic production plus import) and economic access to adequate supply by all people (purchasing power, food inflation, and distribution). According to this line of argumentation, food self-sufficiency is a part of food security, specifically, physical availability, since it is directly related to a balance between domestic production and imports, not to economic access to supply. However, reflecting the more or less unified understanding of food security and food self-sufficiency within the international community of researchers, practical approaches to those issues in particular countries vary. In Russia, the Food Security Doctrine defines food self-sufficiency as the sustainable domestic production of foodstuffs in quantities no less than the established thresholds of their share in important domestic commodities [22]. The criteria of food security set by the Doctrine are the threshold ratios of domestically-produced food products on the domestic food market and specific amounts of certain goods that Russia should be producing on its own by 2020 [23]. According to Wegren, Nikulin, and Trotsuk, the Russian variant of food security differs from common international usage [24]. In Russia, the terms food security and self-sufficiency are used synonymously, but actually Russia’s food policy is closer to self-sufficiency [24]. The divergent application of the term food security is seen by the shifts to import substitution policy framework each time Russia reinforces an orientation toward protectionism. Within the Russian model of food policy, which places emphasis on national vulnerability from foreign sources [25], food security is achieved by minimizing foreign imports more so than ensuring access to sufficient food [24]. The problem with Russia’s approach is that the food security criteria may be met in a technical way (FAO’s food availability pillar), but not in a qualitative one (FAO’s access pillar). The central question is whether the disconnect between the nationalist rhetoric over food security and actual food situation in the country will grow as the government increasingly focuses on protectionist policies. The rest of this paper focuses on the extent to which the food consumption patterns of the population and the sustainability of the food supply have been influenced by the transformation of Russia’s foreign trade policies from liberalization in the 1990s to the contemporary protectionism.
2. Materials and Methods
In recent years, various attempts have been made to build composite food security measures and to capture overlapping dimensions of food security. An extensive number of indicators are available, but they are distributed across various characteristics of food security [26].
The dimensions of availability and utilization are covered by the Global Hunger Index (GHI) produced by the International Food Policy Research Institute (IFPRI). The GHI measures hunger by combining undernourishment, child wasting, child stunting, and child mortality, and thus can be classified as an output index, in the sense that it assesses the state and evolution of hunger as a proxy for food insecurity. The GHI is found to be unsatisfactory as a composite measure of food security in two ways. First, the elements of hunger are correlated, which causes double counting [27]. Second, while considering availability and utilization, the GHI omits the other two dimensions of food security, i.e., access to food and stability.
The Global Food Security Index (GFSI) from the Economist Intelligence Unit (EIU) assesses food security across three dimensions: affordability (similar to access under the FAO pillars), availability, and utilization. Contrary to the GHI, the GFSI is an input index, in the sense that it measures the state and evolution of variables that contribute to, or are considered drivers for, food security across countries [28]. Being output and input indexes, the GHI and the GFSI, respectively, have a consequently high negative correlation between each other. Among the weaknesses of the GFSI is that a given score does not provide a clear understanding of the factors which led to that score [26]. In particular, within the affordability part, the GFSI employs agricultural import tariffs as one of the parameters, but it is not possible to track the particular relationship between liberalization/protectionism and access to food. Moreover, the GFSI measures the average applied most-favored nation rate on all agricultural imports, but not the volume of food imports of particular agricultural commodities.
Many alternative approaches have been developed to address the effects of international trade on food security. Benuzeh and Yiheyis measured food availability by the impact of trade liberalization on food security and estimated a model that distinguished between contemporaneous and delayed effects of liberalization with the five control variables: GDP per capita, irrigated land as a percentage of crop land, the price of imported foods, foreign reserves in months of imports, and political instability [29]. However, while measuring the difference in food availability before and after accession to the WTO, they did not consider the values of import and export. Herath developed the food security index to capture trade effects on food security [30]. He measured trade liberalization by total trade as a percentage of GDP but also failed to distinguish the effects of imports and exports on food security. Shagaida and Uzun succeeded in constructing their overall food security (OFS) index based on the values of food exports and imports and food expenses of the population [31]. However, the problem with this approach is that the OFS characterizes food security from a foreign trade balance perspective only, and does not differentiate between domestically produced and imported food products in domestic consumption.
For the purpose of this study, the volume of domestic output available for domestic consumption is accepted as a difference between the total domestic output of an agricultural commodity and exports, losses, and stocks:
where:
- Vdi—domestic output of a commodity i available for domestic consumption, tons;
- i—agricultural commodity;
- Oi—domestic output of a commodity i, tons;
- Ei—export of a commodity i, tons;
- Li—losses of a commodity i, tons;
- S1i—opening stock of a commodity i, tons;
- S2i—closing stock of a commodity i, tons;
Further, the food self-sufficiency level is dovetailed with the consumption of domestically produced food:
where:
- FSCAi—food self-sufficiency (consumption approach), percentage;
- i—agricultural commodity;
- Vdi—domestic output of a commodity i available for domestic consumption, tons;
- CPi—volume of personal consumption a commodity i, tons;
- CIi—volume of industrial consumption a commodity i, tons.
Import is excluded from the FSCA to differentiate between domestic and external supply, reflect the share of domestic output in consumption, and measure the extent to which domestic demand for food is met by domestic supply. The higher the FSCA the bigger portion of personal and industrial consumption on the domestic market is secured by means of domestic production, and the lower the dependence of a country on food imports (100 – FSCA). The FSCA is a qualitative parameter, which reflects food self-sufficiency, i.e., the physical level of food security, and measures the physical dependence on food imports. Consequently, the increase in the FSCA is caused by either the growth in domestic output (Vd) or decline in domestic consumption (CP + CI). Moreover, the FSCA does not reflect the responsiveness of consumption to changes in the physical availability of food on the market. Improvement in availability (and an increase in FSCA) does not always mean an increase in the volume of food and agricultural products consumed by industries and people. Using the FSCA index, one can only measure the relationship between domestic output and consumption, not qualitative changes in food consumption, i.e., dynamics of nutrient intakes.
To reflect qualitative changes in food consumption, some studies construct specific food security indexes based on caloric requirements. The FAO measures the minimum amount of calories necessary for good health with its indicator of undernourishment (FAOIU). It comprises three parameters, namely the mean quantity of calories available for human consumption, the inequality in access to those calories among the population, and the mean minimum amount of calories required by the population [32]. Mahadevan and Hoang developed a composite food security index which measures food access using calorie intake per capita [33]. Kuwornu, Suleyman, and Amegashie constructed their food security index based on the relationship between the actual and recommended daily calorie intakes [34]. Calorie data, however, is subject to systematic measurement error [35] because the definition of the appropriate food intake threshold is complicated by variations in nutrient requirements based on genetics and health status [36]. Since calorie availability is a poor predictor of nutritional development [26], this study employs the quantitative criteria of adequate food consumption set by the World Health Organization (WHO). The WHO defines the minimum threshold level of healthy nutrition in terms of consumption patterns, while the indexes based on calorie intake usually omit the amount of food available in the market for consumption, as well as the access and availability dimensions of food security.
Assessing the existing food security indexes and their methodological problems, this study aims at extending the pool of food security indicators by taking into account dimensions that have been ignored or undervalued. In particular, the paper employs an approach which differentiates domestic and external sources of food supply (as opposed to the GHI and the OFS), measures their portions in domestic food consumption, evaluates the compliance of consumption supplied by domestic sources with the appropriate food intake threshold, and avoids variations of the calorie intake approach (as opposed to the FAOIU). The idea is to differentiate between the actual and recommended food intakes, compare the volume of domestic food output available for domestic consumption (Vdi) with the threshold level of healthy nutrition, and find the percent of caloric needs answered by domestic production (rational food security, or RFS):
where:
- RFSi—rational food security, percentage;
- i—agricultural commodity;
- Vdi—domestic output of a commodity i consumed domestically, kg;
- P—population of a country, people;
- RWHOi—recommended annual reference nutrient intake of a commodity i, kg/person;
RFS shows how much of the recommended daily needs in food is being met by domestic production. The higher the RFS, the narrower the gap between actual food consumption (FSCA) and recommended food consumption patterns. When RFSi > 100%, a country is secure in an agricultural commodity i by means of domestic production only. There is a direct relationship between the RFS index and the FSCA index: an increase in the food consumption sourced by domestic production drives up the rational food security of a country. Conversely, a decrease in domestic output Vdi brings the RFS down. When RFSi < 100%, a country experiences a shortage of a commodity i in terms of recommended nutrient intake, and should import it to bridge the deficit. Consequently, the lower the RFS, the higher the dependence of the domestic market on food imports (100 – RFSi). However, while (100 – FSCAi) shows the physical dependence on the import of a commodity i, (100 – RFSi) measures the dependence on imports considering the nutrient contents.
The index reflecting nutrients is useful for explaining the trade system. According to Soon, neither availability, nor accessibility necessarily guarantees the nutritional quality of food [37]. Abundant food stocks in some countries coexist with shortages in some others, aggravating nutritional inequalities in available and accessible food supply and threatening food security. International trade plays a vital role in stabilizing food supplies and demands between the countries [38], however, trade liberalization drives dietary pattern changes [37] and poses many threats to a sufficient response by the supply side to meet the growing demand in terms of adequate and healthy nutrition [39]. RFS, as opposed to the GFSI, links rational food security with agricultural and foreign trade frameworks and reflects the volume of food production and imports in terms of recommended food consumption patterns, not only agricultural import tariffs. It could be used to calculate not only the immediate impacts of foreign trade policies implemented by national governments on food consumption patterns, but also contribute to understanding demand and supply responsiveness to such measures, the impact of globalization on domestic food production and on rational food security and self-sufficiency in particular countries.
To test the relationship between food security and foreign trade policies in the case of Russia, this study employs an approach to the agricultural policy frameworks (APFs) defined by Serova and Shick [40]. Six periods during which Russia alternated between liberalization and protectionism have been considered in terms of the changes in the FSCA and the RFS levels.
The study concludes with a comparison between the consumption approach to measuring food self-sufficiency as the percentage of domestically-produced food in domestic consumption and the rational food security approach. In the case of Russia, the FSCA and RFS levels are compared to assess the actual rational food security of the country on ten selected agricultural commodities (Table 1).
The data were obtained from the United Nations Conference on Trade and Development, the Food and Agriculture Organization of the United Nations, the World Bank, the Ministry of Health of the Russian Federation, and the Federal Service of State Statistics of the Russian Federation, as well as from the author’s calculations.
3. Results
Food Security Doctrine of the Russian Federation identifies the following groups of agricultural commodities as staple foods: grain, sugar, vegetable oil, meat and meat products (on meat basis), milk and dairy products (on milk basis), fish products, and potatoes. The author also considers as staple foods three groups of food products recommended by the WHO, i.e., vegetables, fruit and berries, and eggs. The Formula (2) is used to evaluate the level of food self-sufficiency on ten staple agricultural commodities and calculate the share of domestic output in total domestic consumption (Table 2).
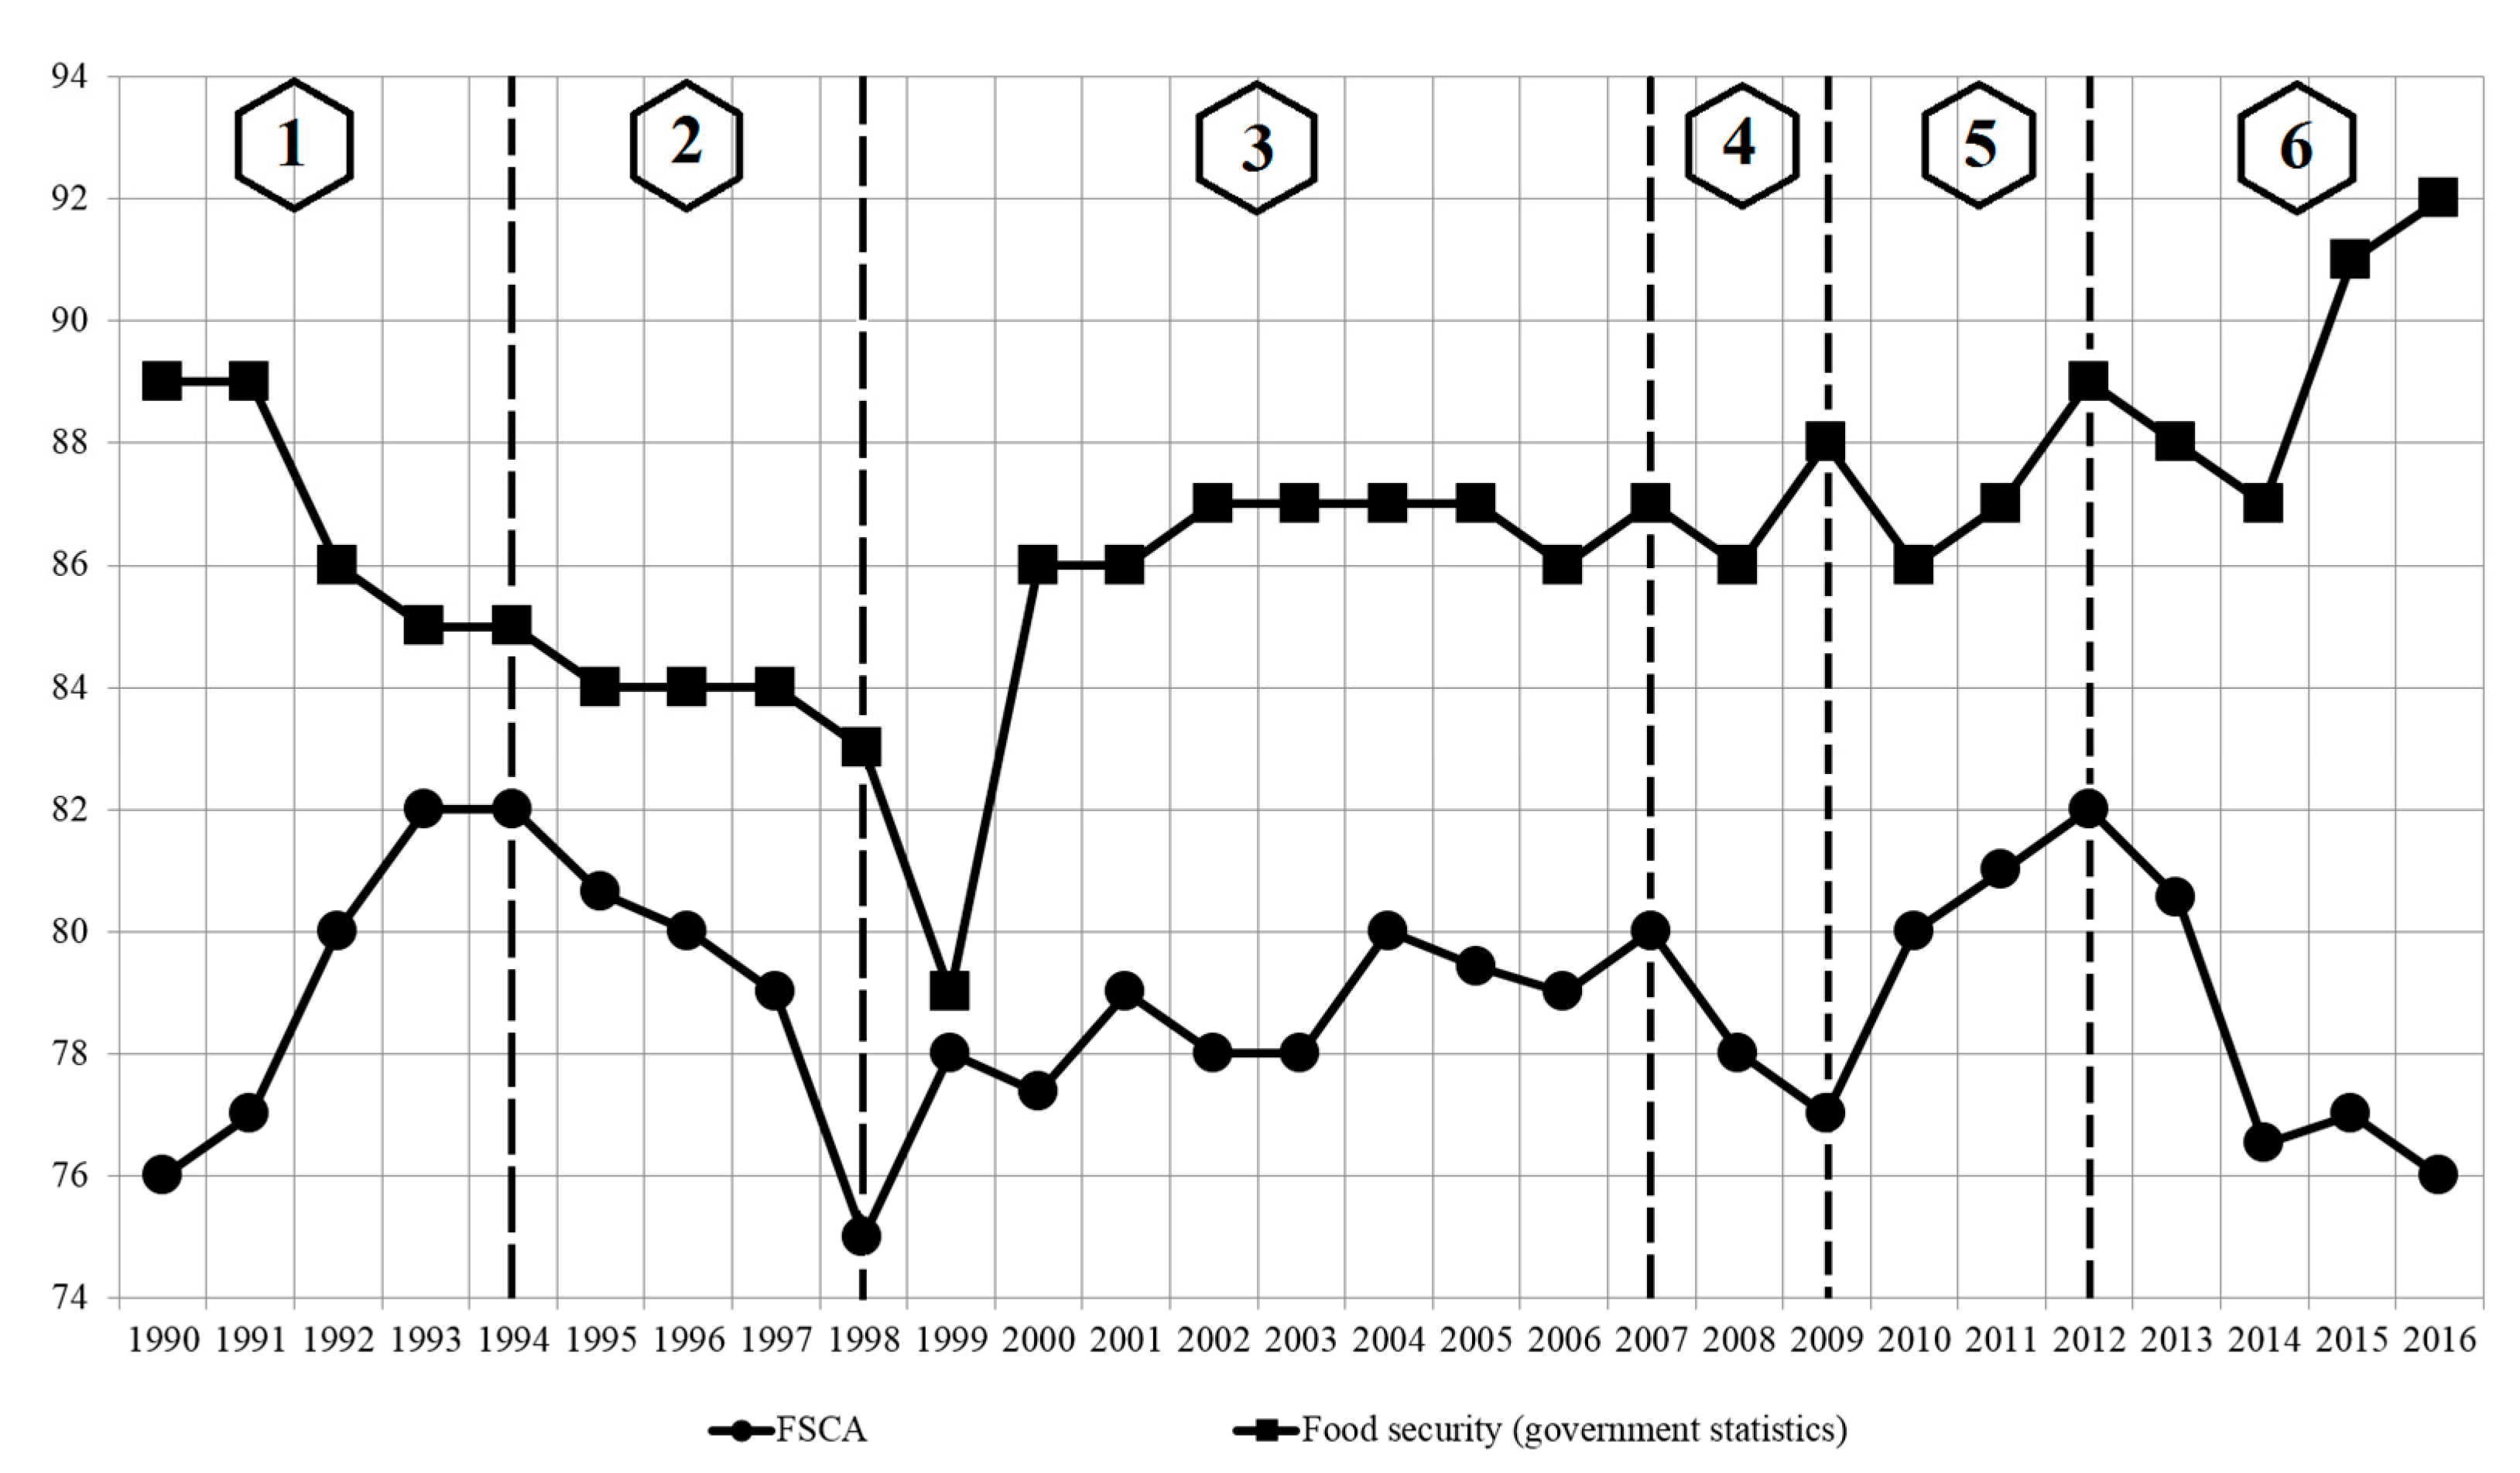
Having implemented the Formula (2) to the domestic food market of Russia, the author recorded the gap between the consumption-based food self-sufficiency and the statistics on food security published by the Government of Russia (Figure 1). The persistence of the gap is consistent with the APFs defined by Serova and Shick [40].
The crumbling of the planned economy and rapid market liberalization in the agricultural sector shaped Russian agricultural policy between 1991 and 1994. In that period, the government relied on trade policy to guarantee sufficient supplies by subsidizing imports and restricting exports. Food security declined, while the FSCA rose to 82% in 1994. Between 1994 and 1998, the focus on the liberalization of agricultural markets was replaced by inward-looking and protectionist policies, which caused a sharp fall of the FCSA. As the economic situation in Russia stabilized amid growing oil prices in the early 2000s, people increased the consumption of relatively more expensive and high quality imported foodstuffs. In 2007–2008, the government reinforced an orientation toward import substitution with the adoption of the Food Security Doctrine, setting self-sufficiency targets for the main food products consumed in Russia. As Serova and Shick published their work in 2007, they were not able to consider the periods beyond. During 2009–2012, Russia again liberalized its agricultural policies in view of the expected accession to the WTO, but after 2013, the country returned to heavy protectionism amid the economic downturn and Western sanctions, and introduced a food import ban in 2014. Those policy frameworks are considered as APF 5 and APF 6, respectively.
Based on the agricultural and trade policy frameworks, the FSCA increases when the policy is focused on the liberalization of the agricultural market (Figure 1: APFs 1, 3, and 5), while trade restrictions and protectionism reduce the sustainability of food supply and food self-sufficiency (Figure 1: APFs 2, 4, and 6). In the case of Russia, in the conditions of the revolving periods of liberalization and protectionism, it is important to understand any changes that may have occurred in the food consumption pattern and to observe any nutritional implications of these changes, with a particular focus on the supply of the minimum amounts of staple foods required for healthy human life.
Countries of the world use various criteria of adequate nutrition different from those established by the WHO, as in the case of Russia (Table 3).
Measurement of food security is therefore influenced by the recommendations of the regulatory bodies and food policies of the government. In Russia, threshold levels of food security are set for grain (95%), sugar (80%), vegetable oil (80%), meat and meat products in meat equivalent (85%), milk and dairy products in milk equivalent (90%), fish and fish products (80%), and potatoes (95%). The Federal State Statistics Service of the Russian Federation reports that approximately 76–79% of the domestic consumption is met by domestic production [44]. However, the calculation of Russia’s rational food security levels conducted based on the WHO standards of adequate food consumption shows the gap between the level of actual consumption and the recommended level of rational food security (RFS) (Table 4).
In Table 4, the cells in gray color are those where RFS < FSCA < 100%, which means that the respective agricultural commodities have a low level of rational food security below the actual consumption. Russia’s domestic markets of grain, fish, potato, eggs, and vegetable oil are cases of high food self-sufficiency, while the markets of fruit, vegetables, meat, and dairy are examples of critical dependency on import deliveries and below the WHO standards of adequate nutrition (Table 5).
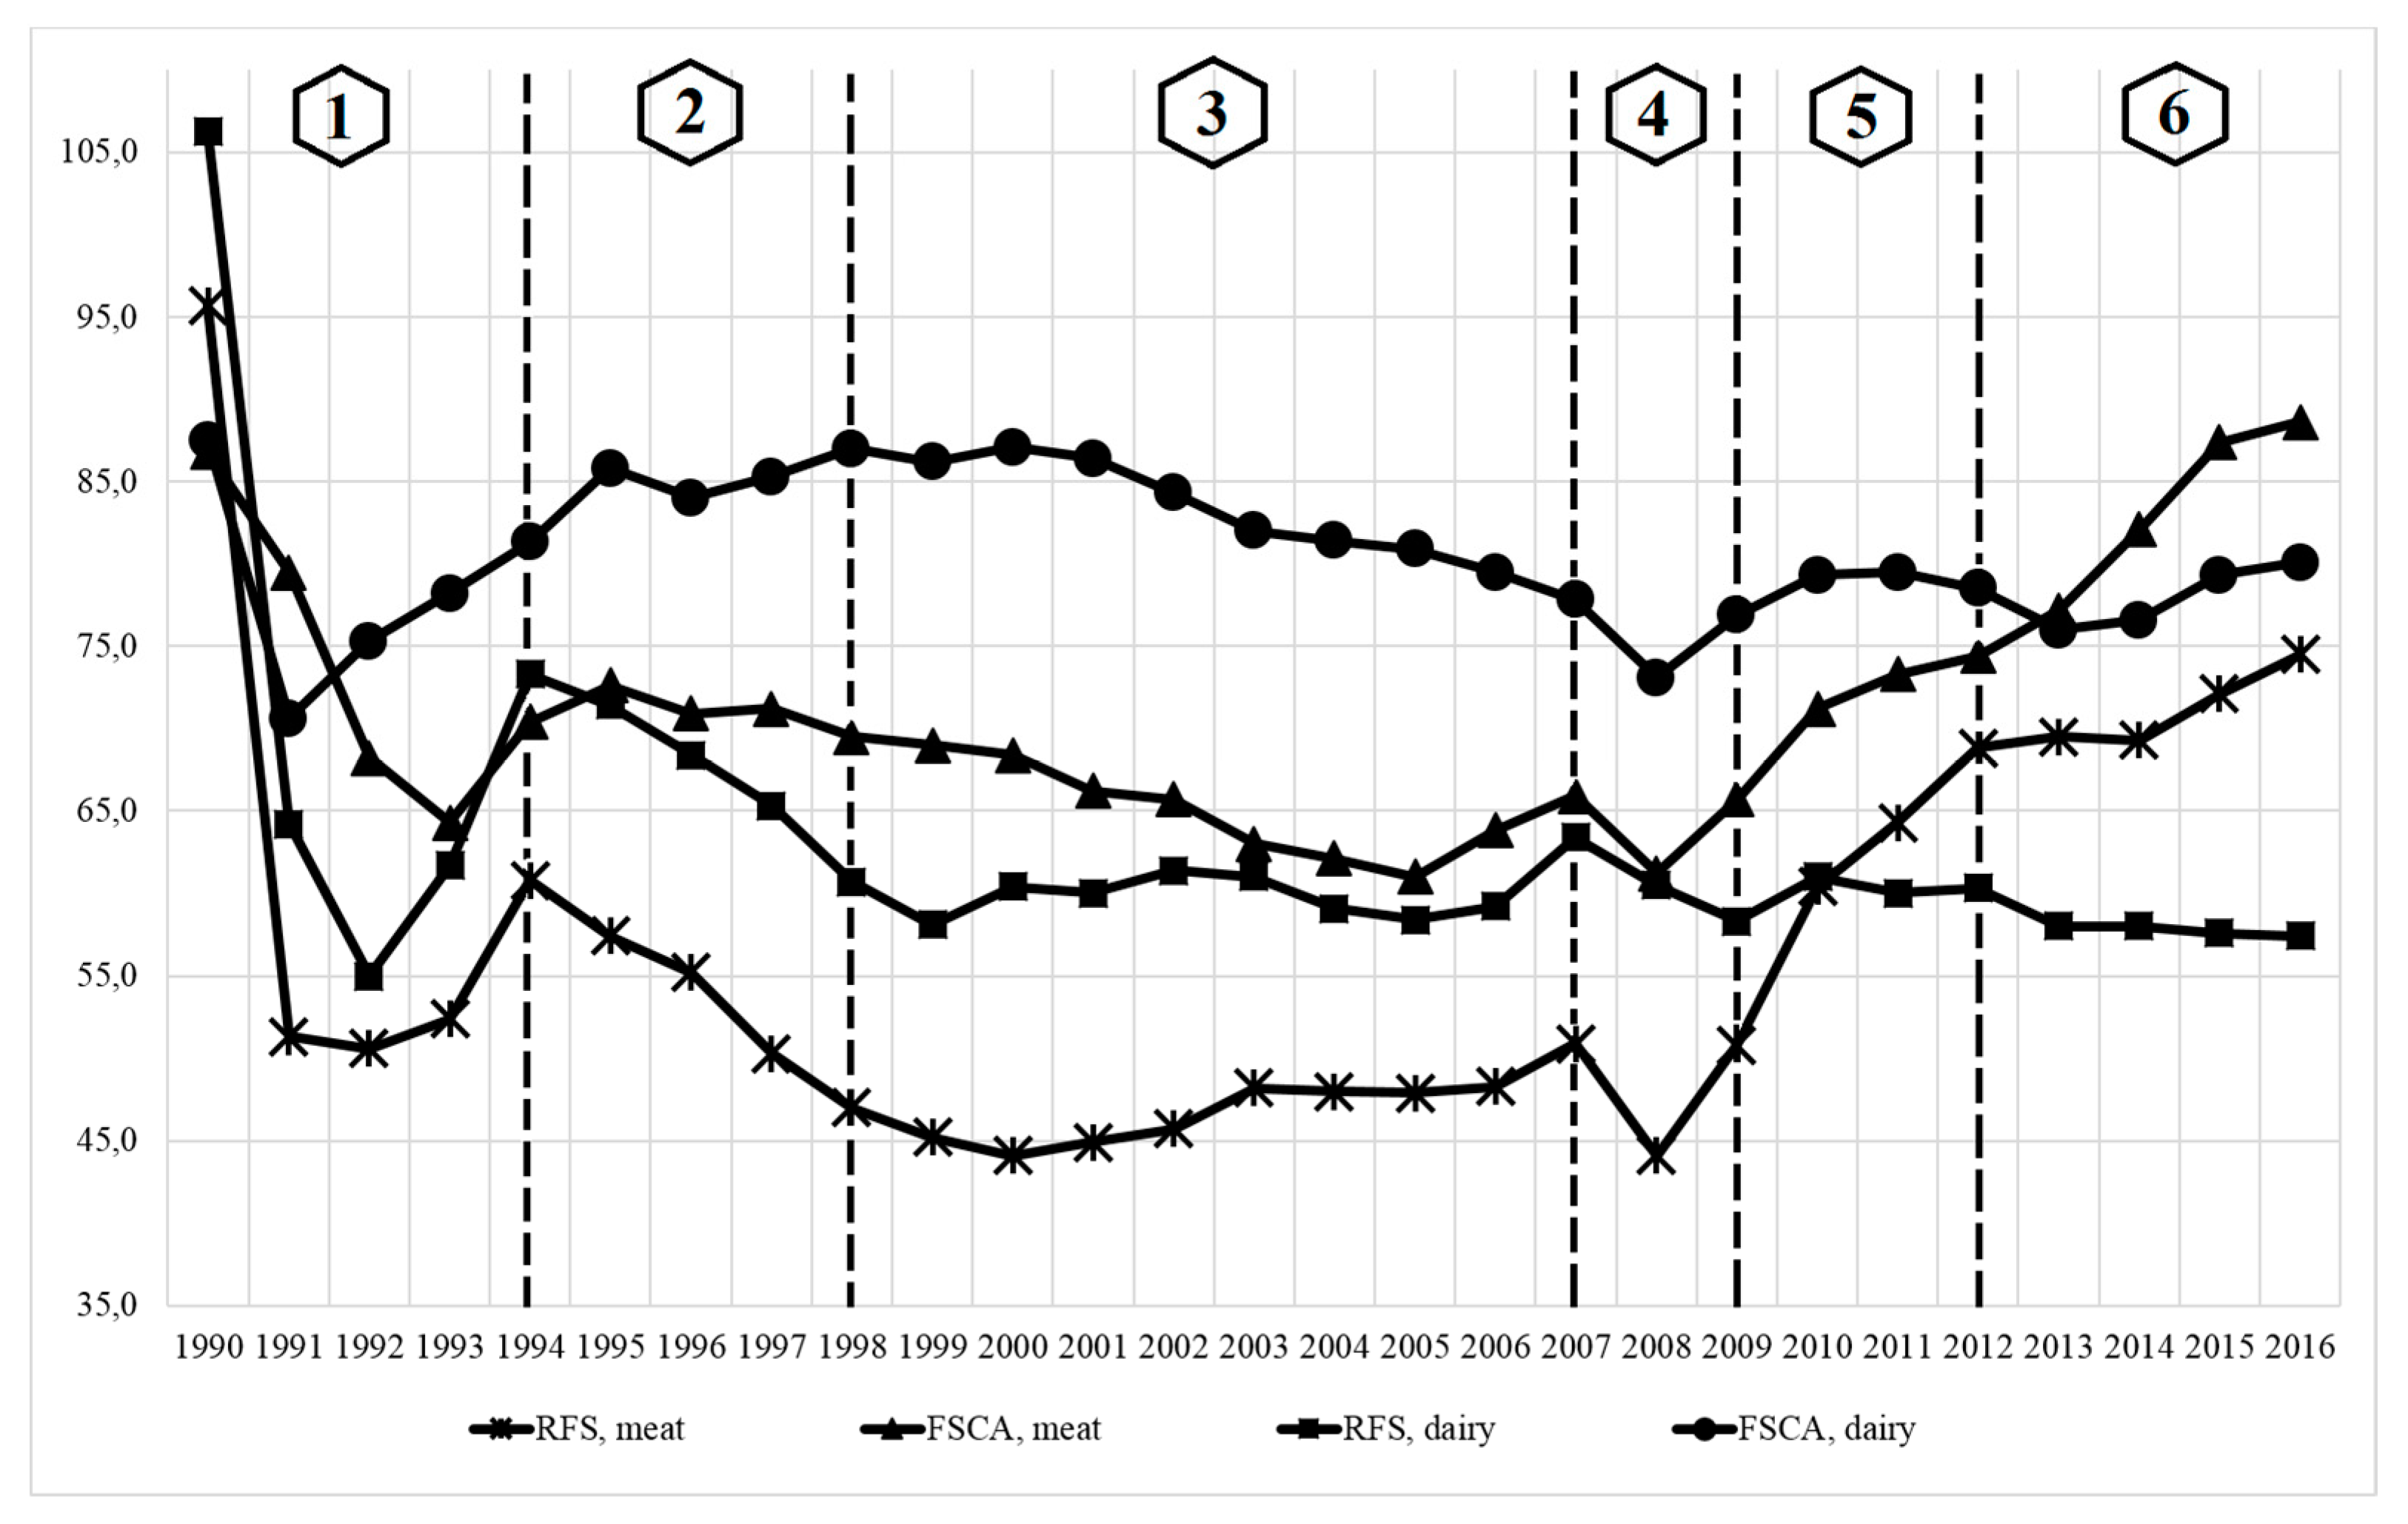
Among those staple foods with low rational food security, the actual consumption levels of meat and dairy products have been well below the WHO recommendation since the mid-1990s. In 2016, the deficit of domestically-produced meat and meat products in domestic consumption was not 11.4% (FSCA), but 25.5% (RFS), for milk and dairy products it was 19.9% and 42.6%, respectively (Figure 2). Moreover, while the Russian statistics reported the increase of the food security level on meat during 2014–2016 as a result of the import-substitution policy, the personal consumption of meat and meat products (CP) declined by 1.5% in 2016 compared to 2014, and industrial consumption (CI) by 16.1%. The decrease in the consumption of milk and dairy products was even deeper, by 2.1% and 8.2%, respectively [41].
Applying the agricultural and trade policy frameworks to the FSCA–RFS gaps in the meat and dairy product markets, the author observes that during the periods of liberalization the gap decreases, while it grows when the government focuses on protecting the domestic agricultural market from food imports (Table 6).
4. Discussion
Since the 1980s, Russia has been a net importer of food and agricultural commodities. During the 1970s and 1980s, the Soviet Union expanded its livestock sector with the help of state subsidies. The growing demand for feed grain resulted in massive imports [45]. During the transition period of the 1990s, Russia could no longer afford subsidies to livestock and crop producers, which translated into a steep fall of output. Russia’s share in global food imports is growing at a greater rate than its share in world food exports, because the country exports bulk crops (wheat, sunflower seed, etc.), while it imports high-value products (meat, dairy products, fruit and other processed foods).
In 2015, due to the Western sanctions and Russia’s retaliatory ban on food imports, the openness of Russia’s food market to global competition decreased. The share of food imports in the overall domestic output of food and agricultural commodities (Food Import Quota, or FIQ) spiraled down to 44.2% in 2015, the lowest level since 1991 [41]. However, the FIQ average from 1991–2016 was 61.1%, which demonstrated to a high degree Russia’s dependence on food imports. In 2015, imports of food and agricultural commodities to Russia were $24.3 billion, lower by 33.7% in comparison with 2014. In 2016, food imports continued their downward slide ($24.2 billion), but the foreign trade balance remained negative [46]. The Russian government assured that the ban would promote domestic agricultural production, thereby weaning the country off a dependence on food imports [45]. However, during 2014–2016, Russia just refocused on the markets other than the EU and the USA, and increased purchases from non-embargoed countries in Latin America and Asia.
Meat and dairy producers are slow to respond to shift changes in market regulations since their production very much depends on cattle population and productivity. That is why, in periods of protectionist policy, a government’s counting on quick growth of import substitution is rhetoric rather than reality. In Russia, during the APF 6, the production of milk and dairy products has decreased from 31.8 mln. tons in 2012 down to 30.7 mln. tons in 2016, despite the favorable environment created in the domestic market [41]. Increases in productivity are only possible by 15–20% per annum by means of progressive technological processes, i.e., improvement of animal welfare and nutrition [47]. However, amid the economic downturn, there are no preconditions for such technological developments. Even after 2014, when dairy imports to Russia from the Western countries were banned, Russia’s milk production remains one of the most import-dependent among other industries. The decrease in FSCA in 2015–2016 was achieved due to the overall decline in milk and dairy product consumption amid the falling purchasing power of the population.
As the FSCA–RFS gap increases, along with the growth of protectionism, and as long as import substitution does not work efficiently, the domestic market has neither sources of affordable imports nor internal sources of qualitative food supply. Wegren argues that since trade integration is to lead to more food imports, it is unlikely that Russia’s targets for domestic food production can or will be met completely [48]. However, when rational food security is primarily influenced by protectionist measures, including such direct-acting ones as a food import ban, and imports plunge, how can the domestic market become saturated? In fact, it cannot, since consumption levels of staple foods in Russia are below the WHO recommendations. Amid the growth of the FSCA–RFS gap, Russians have been forced to change their dietary patterns. The structure of meat consumption in Russia is under transformation due to the import ban, poor macroeconomic forecasts showing rising inflation, and declining consumer purchasing power. The share of beef in total meat consumption has been continually falling since 1990 (from 50% in 1990 to 20% in 2016 (compared to 34% share of pork and 46% of poultry) [49]. Russian consumers respond to the expensive imports by shifting to less expensive food products and more affordable sources of proteins, primarily poultry meat [47].
According to the Analytical Center at the Government of the Russian Federation, since 2014, the share of food products in the consumer basket in Russia resumed growth and reached 38% [50]. This is much higher than the levels typical of developed countries (10–20%) and even some developing countries (in Brazil, food costs account for 17.8%). Morozova, Glushakova, and Fadeikina discovered that Russian people were redistributing family means in favor of food, reducing the consumption levels at the same time [51]. According to the Public Opinion Foundation poll, 63% of respondents have reconsidered their food consumption behavior since the introduction of the import ban, in particular they have focused on cheaper products (40%), excluded some products from their ration (30%), or reduced food consumption (30%) [49].
Protectionist measures decrease the available variety of foods, leaving shoppers with fewer options at the higher prices. During the period of protectionism, food prices rose, in some cases increasing by more than 70%, as in the APF 6 (Figure 1) [52]. Krivonos confirms that import restrictions have contributed to overall reduced food imports, but also to higher consumer prices and a lower level of consumption in Russia [53]. Due to the import restrictions, Russia is suffering from a critical lack of diversity in its food selection [52].
Along with the decrease in consumption, there is a trend towards counterfeit products, such as fake cheese, appearing on the market. The quality of domestically-produced dairy products has been falling: 60% of dairy products in Russia are of poor quality, unsafe or falsified [54]. The food embargo and the devaluation of the ruble have driven up the price of milk fat and the cost of processing. In response, dairy processors routinely add starch, chalk, and soap to their milk [54]. In 2014–2016, Russia substantially increased imports of palm oil as a substitute for milk fat, making the country one of the top importers of this edible oil in the world. Imports of palm oil increased by 37% and cheese output increased by 33% in 2015 compared to 2014, as the country’s milk production declined by 2%. In 2016, Russian Federal Service for Veterinary and Phytosanitary Surveillance concluded that 78% of all cheese produced in Russia is compromised, with some samples containing no milk fat at all [50].
According to Shagaida and Uzun, it makes no sense to raise the degree of food self-sufficiency still further because people care about the availability of food, not its origin [31]. According to Wegren, achieving food self-sufficiency in Russia is a political issue, which is not stipulated by any objective economic reason [48]. Russia uses food as an instrument of foreign policy thus achieving national security through food self-sufficiency [24]. Shagaida and Uzun also point to the precise political role of the trade in food in Russia [31].
Based on the government statistics, the record high level of food security was achieved in 2016, when the level of food expenses was the lowest since 2007 [31]. There is a paradox: the food self-sufficiency as a technical parameter of the market increases, while the food security of the population, in terms of consumption, decreases. Technically, the level of food self-sufficiency is growing as food products of foreign origin are pushed out of Russia’s food market in conditions of economic recession, ruble depreciation, and rising prices of imports. It is burgeoning poverty, not the competitiveness of domestic producers, the quality of their products, or the food embargo that is behind the increasing level of food self-sufficiency.
Under a protectionist agricultural and trade framework, a sustainability of food supply is hardly possible without an increase in domestic production. While retaining protectionist measures in the form of the import ban, high interest rates, and low state support in the longer term, Russian agricultural production will suffer from the reduction in investment and, accordingly, in production. The desire of the Russian government for food protectionism was that by restricting imports of those products that Russia had become dependent on, the country would start to become a stronger domestic producer of agricultural goods, thus diminishing the need for heavy reliance on imports. However, there are no preconditions for market capacity growth—people have not increased their consumption of domestically-produced food staples, as the Russian government expected, but rather switched to cheaper products and decreased consumption. Due to the trade restrictions, the nutritional habits of Russian consumers changed from high-fat animal products to starches. While imports decreased due to the protectionist policies, domestic food producers are not able to substantially increase output to meet the demand promptly. As the Russian government tries to revitalize the agricultural sector by increasing protection and support, food producers still struggle with the limited availability of loans, the shortage of a sufficient workforce, a lack of foreign investment, and the uncertainty of the macroeconomic environment. Given the situation of revolving approaches to foreign trade policies, where protectionism is replaced by liberalization and the other way around, food producers are rather apprehensive about investing in the expansion of production facilities.
5. Conclusions
Providing the population with food in sufficient quantity and variety is a challenge, which includes a range of issues of food production, the dependence on imports, the export orientation of the food market, and the solvency and dietary patterns of the population. The purpose of this paper was to assess to what extent the food consumption patterns of the population changed during the economic transformation that took place in Russia in the period from 1990 to 2016, with a special focus on six agricultural and trade policy frameworks of successive liberalization and protectionism. The study has attempted to provide an analysis of the association between food self-sufficiency and food security in the case of Russia, introduced the concept of rational food security, and assessed the effects of Russia’s foreign trade policies on food self-sufficiency and security and consumption patterns.
The calculations demonstrate that the consumption approach to assessing food self-sufficiency underestimates the insecurity level for the major staple foods by not accounting for nutrition factors. The Russian Food Security Doctrine treats achieving food security as increasing domestic food production to the level of food self-sufficiency. The problem with such an approach is that food security is achieved by minimizing foreign imports more so than ensuring access to sufficient food. The food security criteria may be met in a technical way (the production–import ratio), but not in a qualitative one (adequate access to food). It is important when considering food security that a sustainable pattern of food consumption is achieved, ensuring a sufficient supply of staples and micronutrient-rich foods [55].
This paper addresses this shortcoming by proposing an index defining food security as a combination of food availability on the domestic market through domestic production, and economic access to sufficient amounts of foodstuffs in accordance with the WHO standards of adequate food consumption and healthy life. The study demonstrates that existing food security indexes fail to capture all dimensions of food security, particularly, the relationship between changing foreign trade frameworks and food consumption patterns. The RFS index captures the effects of foreign trade on food security by differentiating consumption of domestically produced and imported food, linking food security with agricultural and foreign trade frameworks, and avoiding variations of the calorie intake approach. In the case of Russia, calculations made with the implementation of the RFS index to ten staple foods reveal gaps between the levels of food self-sufficiency and rational food security. The gaps grow in the periods of higher domestic food market protection, while the liberalization of the agricultural and foreign trade framework spurs the increase of rational food security. Higher tariffs raise the rate of both domestically-sourced and imported food and fuel food inflation. The results of this study provide evidence that protectionist measures reduce food availability and quality of food products and consequently threaten the sustainability of food supply and food security of the country.
Acknowledgments
The paper was supported by Harbin Engineering University, China (research project HEUCFJ170901) by the provision of funds to cover the costs to publish in open access.
Conflicts of Interest
The author declares no conflict of interest.
References
- Margulis, M.E. The Forgotten History of Food Security in Multilateral Trade Negotiations. World Trade Rev. 2017, 16, 25–57. [Google Scholar] [CrossRef]
- Valdés, A.; Foster, W. Net Food-Importing Developing Countries: Who They Are, and Policy Options for Global Price Volatility; International Centre for Trade and Sustainable Development: Geneva, Switzerland, 2012. [Google Scholar]
- Smutka, L.; Spicka, J.; Ishchukova, N.; Selby, R. Agrarian Import Ban and Its Impact on Russian and European Union Agrarian Trade Performance. Agric. Econ. 2016, 62, 493–506. [Google Scholar]
- Food and Agriculture Organisation of the United Nations. Implications of Economic Policy for Food Security: A Training Manual. Available online: http://www. fao.org/docrep/004/x3936e/x3936e03.htm (accessed on 1 October 2017).
- Clapp, J. Food Self-Sufficiency and International Trade: A False Dichotomy? Food and Agriculture Organisation of the United Nations: Rome, Italy, 2015. [Google Scholar]
- Ritson, C. Self-Sufficiency and Food Security; Centre for Agricultural Strategy, University of Reading: Reading, UK, 1980. [Google Scholar]
- Luan, Y.; Cui, X.; Ferrat, M. Historical Trends of Food Self-Sufficiency in Africa. Food Secur. 2013, 5, 393–405. [Google Scholar] [CrossRef]
- Meskhia, I.E. Food Security Problems in Post-Soviet Georgia. Ann. Agric. Sci. 2016, 14, 46–51. [Google Scholar] [CrossRef]
- Food and Agriculture Organization of the United Nations. Food, Nutrition, and Agriculture; Food and Agriculture Organization of the United Nations: Rome, Italy, 1992. [Google Scholar]
- Anderson, S.A. Core Indicators of Nutritional State for Difficult-to-Sample Populations. J. Nutr. 1990, 120, 1557–1600. [Google Scholar]
- Lee, R. Food Security and Food Sovereignty; Centre for Rural Economy, the University of Newcastle Upon Tyne: Newcastle Upon Tyne, UK, 2007. [Google Scholar]
- Lawrence, G.; McMichael, P. The Question of Food Security. Int. J. Sociol. Agric. Food 2012, 19, 135–142. [Google Scholar]
- Thow, A.M.; Hawkes, C. The Implications of Trade Liberalization for Diet and Health: A Case Study from Central America. Glob. Health 2009, 28, 5. [Google Scholar] [CrossRef] [PubMed]
- Dorosh, P.A. Trade, Food Aid and Food Security: Evolving Rice and Wheat Markets. Econ. Political Wkly. 2004, 39, 4033–4042. [Google Scholar]
- Warr, P. Food Security vs. Food Self-Sufficiency: The Indonesian Case; The Australian National University: Canberra, Australia, 2011. [Google Scholar]
- Socha, T.; Zahaf, M.; Chambers, L.; Abraham, R.; Fiddler, T. Food Security in a Northern First Nations Community: An Exploratory Study on Food Availability and Accessibility. J. Aborig. Health 2012, 8, 5–14. [Google Scholar]
- Samaratunga, P.A. Multiple Facets of Food (in) Security in Sri Lanka: An Input to Food Policy. In Policy Options to Achieve Food Security in South Asia; Mittal, S., Sethi, D., Eds.; Foundation Books: New Delhi, India, 2011; pp. 51–76. [Google Scholar]
- Power, E.M. Determinants of Healthy Eating Among Low-Income Canadians. Can. J. Public Health 2005, 96 (Suppl. 3), 537–542. [Google Scholar]
- Sonnino, R.; Faus, A.M.; Maggio, A. Sustainable Food Security: An Emerging Research and Policy Agenda. Int. J. Sociol. Agric. Food 2014, 21, 173–188. [Google Scholar]
- Kalugina, Z. Agricultural Policy in Russia: Global Challenges and the Viability of Rural Communities. Int. J. Sociol. Agric. Food 2014, 21, 115–131. [Google Scholar]
- Erokhin, V.; Ivolga, A.; Heijman, W. Trade Liberalization and State Support of Agriculture: Effects for Developing Countries. Agric. Econ. 2014, 60, 524–537. [Google Scholar]
- Spoor, M.; Mamonova, N.; Visser, O.; Nikulin, A. Food Security in a Sovereign State and “Quiet Food Sovereignty” of an Insecure Population: The Case of Post-Soviet Russia. In Proceedings of the International Conference “Food Sovereignty: A Critical Dialogue”, New Haven, CT, USA, 14–15 September 2013; Yale University: New Haven, CT, USA, 2013. [Google Scholar]
- Lunze, K.; Yurasova, E.; Idrisov, B.; Gnatienko, N.; Migliorini, L. Food Security and Nutrition in the Russian Federation—A Health Policy Analysis. Glob. Health Action 2015, 8, 10. [Google Scholar] [CrossRef] [PubMed]
- Wegren, S.K.; Nikulin, A.M.; Trotsuk, I. The Russian Variant of Food Security. Probl. Post-Communism 2016. [Google Scholar] [CrossRef]
- Vassilieva, Y.; Smith, M.E. Russia: Doctrine of Food Security 2008. Available online: https://apps.fas.usda.gov/gainfiles/200811/146306496.pdf (accessed on 4 June 2017).
- Pangaribowo, E.H.; Gerber, N.; Torero, M. Food and Nutrition Security Indicators: A Review; Center for Development Research, University of Bonn: Bonn, Germany, 2013. [Google Scholar]
- Masset, E. A Review of Hunger Indices and Methods to Monitor Country Commitment to Fighting Hunger. Food Policy 2011, 36, 102–108. [Google Scholar] [CrossRef]
- Arias, J. What Would Be the Best Predictors of Food Security Index? Available online: https://www.researchgate.net/post/What_would_be_the_best_predictors_of_food_security_index (accessed on 2 June 2017).
- Benuzeh, M.; Yiheyis, Z. Has Trade Liberalisation Improved Food Availability in Developing Countries? An Empirical Analysis. J. Econ. Dev. 2014, 39, 63–78. [Google Scholar]
- Herath, H.M.S.P. Has Trade Liberalization Improved Food Security? A Comparative Study on China and Sri Lanka. Eur. J. Bus. Manag. 2014, 18, 62–67. [Google Scholar]
- Shagaida, N.; Uzun, V. Food Security in Russia: Monitoring, Trends and Threats; Russian Presidential Academy of National Economy and Public Administration: Moscow, Russia, 2015. [Google Scholar]
- De Haen, H.; Klasen, S.; Qaim, M. What Do We Really Know? Metrics for Food Insecurity and Undernutrition. Food Policy 2011, 36, 760–769. [Google Scholar] [CrossRef]
- Mahadevan, R.; Hoang, V. Is There a Link Between Poverty and Food Security? Soc. Indic. Res. 2016. [Google Scholar] [CrossRef]
- Kuwornu, J.K.M.; Suleyman, D.M.; Amegashie, D.P.K. Analysis of Food Security Status of Farming Households in the Forest Belt of the Central Region of Ghana. Russ. J. Agric. Socio-Econ. Sci. 2013, 13, 26–42. [Google Scholar]
- Strauss, J.; Thomas, D. Health, Nutrition and Economic Development. J. Econ. Lit. 1998, 36, 766–817. [Google Scholar]
- Srinivasan, T.N. Undernutrition: Concepts, Measurements and Policy Implications. Nutrition and Poverty; Clarendon Press: Oxford, UK, 1992. [Google Scholar]
- Soon, J.M.; Tee, E.S. Changing Trends in Dietary Pattern and Implications to Food and Nutrition Security in Association of Southeast Asian Nations (ASEAN). Int. J. Nutr. Food Sci. 2014, 4, 259–269. [Google Scholar] [CrossRef]
- Erokhin, V. Factors Influencing Food Markets in Developing Countries: An Approach to Assess Sustainability of the Food Supply in Russia. Sustainability 2017, 9, 1313. [Google Scholar] [CrossRef]
- Tokgoz, S.; Zhang, W.; Msangi, S.; Bhandary, P. Biofuels and the Future of Foods: Competition and Complementarities. Agriculture 2012, 2, 414–435. [Google Scholar] [CrossRef]
- Serova, E.; Shick, O. Global Agrarian Policy; State University—Higher School of Economics: Moscow, Russia, 2007. [Google Scholar]
- Federal Service of State Statistics of the Russian Federation. Official Statistics. Available online: http://www.gks.ru/wps/wcm/connect/rosstat_main/rosstat/ru/statistics/accounts/ (accessed on 3 October 2017).
- Kovalev, M.; Chernetskaya, M.; Shiray, O. Analysis of Food Security in the Republic of Belarus and other Countries of the World. Bull. Assoc. Belarus. Banks 2014, 34–35, 8–19. [Google Scholar]
- Ministry of Health of the Russian Federation. Order on Approval of Recommendations on Rational Norms of Consumption of Food Products Complying with Modern Standards of Healthy Nutrition. Available online: https://www.rosminzdrav.ru/news/2016/08/26/3128-prikazom-minzdrava-rossii-utverzhdeny-rekomendatsii-po-ratsionalnym-normam-potrebleniya-pischevyh-produktov (accessed on 6 March 2017).
- United States Department of Agriculture Foreign Agricultural Service. Russian Federation Food Security Doctrine Adopted; USDA Foreign Agricultural Service: Washington, DC, USA, 2010.
- Liefert, W.M.; Liefert, O. Russia’s Economic Crisis and its Agricultural and Food Economy. Choices 2015, 30, 1–6. [Google Scholar]
- United Nations Conference on Trade and Development. Statistics Database. Available online: http://unctad.org/en/Pages/Statistics.aspx (accessed on 3 October 2017).
- United States Department of Agriculture Foreign Agricultural Service. Russian Federation. Livestock and Products Annual; USDA Foreign Agricultural Service: Washington, DC, USA, 2015.
- Wegren, S.K. Return to Putin’s Russia. Past Imperfect, Future Uncertain; Rowman & Littlefield Publishers: Plymouth, UK, 2013. [Google Scholar]
- INTERFAX. Dve Treti Rossiyan Nachali Ekonomit Na Produktakh Pitaniya. Available online: https://news.mail.ru/economics/22486768/?frommail=1 (accessed on 6 March 2017). (In Russian).
- Analytical Center at the Government of the Russian Federation. The Food Embargo: The Results of 2015; Government of the Russian Federation: Moscow, Russia, 2016.
- Моrоzоvа, E.; Glushakova, O.; Fadeikina, N. Food Consumption as an Indicator of the Quality of Life of the Population in Regions. Foods Raw Mater. 2016, 4, 171–180. [Google Scholar] [CrossRef]
- Girard, M. Trade and Transition: Russia’s Agricultural Pitfalls and Prospects for the 21st Century; Honors College, University of Maine: Orono, ME, USA, 2015. [Google Scholar]
- Krivonos, E. Russian Restrictions on Agri-food Imports: Effects on Domestic and World Markets. In Proceedings of the International Conference of Agricultural Economists, Milan, Italy, 9–14 August 2015; University of Milan: Milan, Italy, 2015. [Google Scholar]
- Hobson, P. Russia, Watch What You Eat. Available online: https://themoscowtimes.com/articles/warning-this-is-not-cheese-in-russia-watch-what-you-eat-54689 (accessed on 6 March 2017).
- Kearney, J. Food Consumption Trends and Drivers. Philos. Trans. R. Soc. B 2010, 365, 2793–2807. [Google Scholar] [CrossRef] [PubMed]
Figure 1.
Food security (government statistics) and food self-sufficiency (consumption approach) in Russia in 1990–2016, %. Source: author’s development based on [31,40,41]. Note: 1–6—agricultural policy frameworks, i.e., (1) rapid market liberalization; (2) inward-looking and protectionist policies; (3) stabilization of economic situation and increase in consumption; (4) orientation towards import substitution; (5) liberalization of market policies and accession to the World Trade Organization (WTO); (6) economic downturn, sanctions, and introduction of food import ban.

Figure 2.
FSCAs and RFSs of meat and dairy products in Russia in 1990–2016, %. Source: author’s development. Note: 1–6—agricultural policy frameworks, i.e., (1) rapid market liberalization; (2) inward-looking and protectionist policies; (3) stabilization of economic situation and increase in consumption; (4) orientation towards import substitution; (5) liberalization of market policies and accession to the WTO; (6) economic downturn, sanctions, and introduction of food import ban.


Table 1.
Levels of a rational food security on an RFS to FSCA basis.
| Groups of Agricultural Commodities | Levels of Rational Food Security | RFS-FSCA Relationships |
|---|---|---|
| Group 1 | High | RFS > FSCA, and RFS > 100% |
| Group 2 | Average | RFS > FSCA, and RFS < 100% |
| Group 3 | Low | RFS < FSCA, and RFS < 100% |
Source: author’s development.
Table 2.
FSCAs of the selected staple foods on the Russia’s market in 1990–2016, percentage.
| Year | Grain | Sugar | Vegetable Oil | Meat and Meat Products | Milk and Dairy Products | Fish | Potato | Vegetables | Fruit and Berries | Eggs |
|---|---|---|---|---|---|---|---|---|---|---|
| 1990 | 91.3 | 66.1 | 96.8 | 86.8 | 87.5 | 78.9 | 96.4 | 79.1 | 52.0 | 98.3 |
| 1995 | 97.0 | 44.9 | 96.0 | 72.6 | 85.8 | 75.4 | 99.8 | 89.0 | 52.0 | 99.7 |
| 2000 | 95.4 | 48.0 | 95.8 | 68.4 | 87.1 | 69.9 | 98.0 | 82.4 | 49.9 | 96.7 |
| 2005 | 98.8 | 49.6 | 96.2 | 61.0 | 80.9 | 68.1 | 98.0 | 74.7 | 35.4 | 97.6 |
| 2010 | 99.7 | 50.1 | 96.3 | 71.2 | 79.3 | 72.9 | 95.8 | 80.4 | 24.4 | 97.8 |
| 2011 | 99.5 | 63.8 | 96.9 | 73.3 | 79.5 | 72.8 | 94.4 | 81.4 | 25.7 | 97.2 |
| 2012 | 99.1 | 89.1 | 99.6 | 74.4 | 78.5 | 72.1 | 97.4 | 84.0 | 25.5 | 96.9 |
| 2013 | 98.9 | 87.7 | 99.5 | 77.2 | 76.0 | 71.7 | 97.3 | 84.1 | 29.1 | 97.1 |
| 2014 | 99.4 | 89.9 | 99.6 | 82.1 | 76.6 | 72.5 | 96.4 | 83.9 | 35.6 | 97.1 |
| 2015 | 99.5 | 90.5 | 99.6 | 87.4 | 79.3 | 83.4 | 96.9 | 85.7 | 34.4 | 97.1 |
| 2016 | 99.5 | 90.7 | 99.5 | 88.6 | 80.1 | 81.6 | 97.5 | 87.4 | 35.6 | 97.2 |
Source: author’s development based on [41].
Table 3.
Recommended consumption patterns and actual per capita consumption of the selected staple foods in Russia in 1990–2016, kg/year.
Table 3.
Recommended consumption patterns and actual per capita consumption of the selected staple foods in Russia in 1990–2016, kg/year.
| Product Group | WHO | Ministry of Health of the Russian Federation | Actual Annual Average per Capita Consumption | ||||||||||
|---|---|---|---|---|---|---|---|---|---|---|---|---|---|
| 1990 | 1995 | 2000 | 2005 | 2010 | 2011 | 2012 | 2013 | 2014 | 2015 | 2016 | |||
| Breadstuffs and macaroni products | 120.5 | 96.0 | 120.0 | 122.0 | 117.0 | 121.0 | 120.0 | 119.0 | 119.0 | 118.0 | 118.0 | 118.0 | 118.0 |
| Sugar | 36.5 | 24.0 | 47.0 | 32.0 | 35.0 | 38.0 | 39.0 | 40.0 | 40.0 | 40.0 | 40.0 | 39.0 | 39.0 |
| Vegetable oil | 13.1 | 12.0 | 10.2 | 7.5 | 9.9 | 12.1 | 13.4 | 13.5 | 13.7 | 13.7 | 13.8 | 13.6 | 13.7 |
| Meat and meat products, in meat equivalent | 70.1 | 73.0 | 75.0 | 55.0 | 45.0 | 55.0 | 69.0 | 71.0 | 74.0 | 75.0 | 74.0 | 73.0 | 74.0 |
| Milk and dairy products, in milk equivalent | 359.9 | 325.0 | 387.0 | 254.0 | 215.0 | 234.0 | 247.0 | 246.0 | 249.0 | 248.0 | 244.0 | 239.0 | 236.0 |
| Fish and fish products | 8.4 | 22.0 | 21.4 | 17.2 | 16.6 | 19.0 | 21.6 | 23.0 | 24.8 | 24.8 | 22.8 | 19.8 | 19.5 |
| Potato | 96.7 | 90.0 | 106.0 | 124.0 | 109.0 | 109.0 | 104.0 | 110.0 | 111.0 | 111.0 | 111.0 | 112.0 | 113.0 |
| Vegetables | 140.3 | 140.0 | 89.0 | 76.0 | 79.0 | 87.0 | 101.0 | 106.0 | 109.0 | 109.0 | 111.0 | 111.0 | 112.0 |
| Fruit and berries | 80.3 | 100.0 | 35.0 | 29.0 | 32.0 | 46.0 | 58.0 | 60.0 | 61.0 | 64.0 | 64.0 | 61.0 | 62.0 |
| Eggs, pieces | 243 | 260 | 297 | 216 | 229 | 250 | 269 | 271 | 276 | 269 | 269 | 269 | 273 |
Table 4.
RFS–FSCA relationship for the selected staple foods in Russia in 1990–2016.
| Measure | 1990 | 1995 | 2000 | 2005 | 2010 | 2011 | 2012 | 2013 | 2014 | 2015 | 2016 |
|---|---|---|---|---|---|---|---|---|---|---|---|
| Breadstuffs and Macaroni Products | |||||||||||
| RFS, % | 608.5 | 461.1 | 330.7 | 372.8 | 371.7 | 393.2 | 366.8 | 365.4 | 384.6 | 388.0 | 414.7 |
| FSCA, % | 91.3 | 97.0 | 95.4 | 98.8 | 99.7 | 99.5 | 99.1 | 98.9 | 99.4 | 99.5 | 99.5 |
| (RFS–FSCA), pct * | +517.2 | +364.1 | +235.3 | +274.0 | +272.0 | +293.7 | +267.7 | +266.5 | +285.2 | +288.5 | +315.2 |
| Sugar | |||||||||||
| RFS, % | 42.8 | 25.9 | 55.1 | 55.3 | 61.2 | 80.4 | 96.9 | 94.8 | 95.6 | 94.2 | 95.6 |
| FSCA, % | 66.1 | 44.9 | 48.0 | 49.6 | 50.1 | 63.8 | 89.1 | 87.7 | 89.9 | 90.5 | 90.7 |
| (RFS–FSCA), pct * | −23.3 | −19.0 | +7.1 | +5.7 | +11.1 | +16.6 | +7.8 | +7.1 | +5.7 | +3.7 | +4.9 |
| Vegetable Oil | |||||||||||
| RFS, % | 64.2 | 49.5 | 76.1 | 97.6 | 110.7 | 127.4 | 130.6 | 142.8 | 180.7 | 212.3 | 219.0 |
| FSCA, % | 96.8 | 96.0 | 95.8 | 96.2 | 96.3 | 96.9 | 99.6 | 99.5 | 99.6 | 99.6 | 99.5 |
| (RFS–FSCA), pct * | −32.6 | −46.5 | −19.7 | +1.4 | +14.4 | +30.5 | +31.0 | +43.3 | +81.1 | +112.7 | +119.5 |
| Meat and Meat Products, in Meat Equivalent | |||||||||||
| RFS, % | 95.7 | 57.4 | 44.1 | 47.9 | 60.4 | 64.3 | 68.8 | 69.5 | 69.3 | 72.1 | 74.5 |
| FSCA, % | 86.8 | 72.6 | 68.4 | 61.0 | 71.2 | 73.3 | 74.4 | 77.2 | 82.1 | 87.4 | 88.6 |
| (RFS–FSCA), pct * | +8.9 | −15.2 | −24.3 | −13.1 | −10.8 | −9.0 | −5.6 | −7.7 | −12.8 | −15.3 | −14.1 |
| Milk and Dairy Products, in Milk Equivalent | |||||||||||
| RFS, % | 106.3 | 71.4 | 60.4 | 58.4 | 61.0 | 60.0 | 60.3 | 58.0 | 58.0 | 57.6 | 57.4 |
| FSCA, % | 87.5 | 85.8 | 87.1 | 80.9 | 79.3 | 79.5 | 78.5 | 76.0 | 76.6 | 79.3 | 80.1 |
| (RFS–FSCA), pct * | +18.8 | −14.4 | −26.7 | −22.5 | −18.3 | −19.5 | −18.2 | −18.0 | −18.6 | −21.7 | −22.7 |
| Fish and Fish Products | |||||||||||
| RFS, % | 151.0 | 117.7 | 133.5 | 133.3 | 139.8 | 149.6 | 160.4 | 154.6 | 151.2 | 186.4 | 188.9 |
| FSCA, % | 78.9 | 75.4 | 69.9 | 68.1 | 72.9 | 72.8 | 72.1 | 71.7 | 72.5 | 83.4 | 81.6 |
| (RFS–FSCA), pct * | +72.1 | +42.3 | +63.6 | +65.2 | +66.9 | +76.8 | +88.3 | +82.9 | +78.7 | +103.0 | +107.3 |
| Potato | |||||||||||
| RFS, % | 201.7 | 250.3 | 198.9 | 189.5 | 184.1 | 187.6 | 201.2 | 199.3 | 201.9 | 203.2 | 203.9 |
| FSCA, % | 96.4 | 99.8 | 98.0 | 98.0 | 95.8 | 94.4 | 97.4 | 97.3 | 96.4 | 96.9 | 97.5 |
| (RFS–FSCA), pct * | +105.3 | +150.5 | +100.9 | +91.5 | +88.3 | +93.2 | +103.8 | +102.0 | +105.5 | +106.3 | +106.4 |
| Vegetables | |||||||||||
| RFS, % | 53.1 | 53.1 | 51.7 | 51.4 | 81.9 | 83.9 | 85.1 | 85.0 | 85.5 | 91.4 | 93.2 |
| FSCA, % | 79.1 | 89.0 | 82.4 | 74.7 | 80.4 | 81.4 | 84.0 | 84.1 | 83.9 | 85.7 | 87.4 |
| (RFS–FSCA), pct * | −26.0 | −35.9 | −30.7 | −23.3 | +1.5 | +2.5 | +1.1 | +0.9 | +1.6 | +5.7 | +5.8 |
| Fruit and Berries | |||||||||||
| RFS, % | 23.0 | 21.2 | 22.4 | 21.9 | 24.3 | 25.4 | 26.3 | 30.9 | 39.8 | 40.9 | 40.0 |
| FSCA, % | 52.0 | 52.0 | 49.9 | 35.4 | 24.4 | 25.7 | 25.5 | 29.1 | 35.6 | 34.4 | 35.6 |
| (RFS–FSCA), pct * | −29.0 | −30.8 | −27.5 | −13.5 | −0.1 | −0.3 | +0.8 | +1.8 | +4.2 | +6.5 | +4.4 |
| Eggs | |||||||||||
| RFS, % | 131.6 | 93.9 | 95.0 | 104.9 | 116.1 | 117.0 | 119.3 | 117.3 | 119.1 | 118.2 | 120.4 |
| FSCA, % | 98.3 | 99.7 | 96.7 | 97.6 | 97.8 | 97.2 | 96.9 | 97.1 | 97.1 | 97.1 | 97.2 |
| (RFS–FSCA), pct * | +33.3 | −5.8 | −1.7 | +7.3 | +18.3 | +19.8 | +22.4 | +20.2 | +22.0 | +21.1 | +23.2 |
* Percentage points. Source: author’s development.
Table 5.
Grouping of the selected staple foods according to the level of rational food security.
| Groups | RFS Level | Commodities |
|---|---|---|
| Group 1 | High | Breadstuffs and macaroni products |
| Fish and fish products | ||
| Potato | ||
| Eggs | ||
| Vegetable oil | ||
| Group 2 | Average | Sugar |
| Group 3 | Low | Meat and meat products |
| Milk and dairy products | ||
| Fruit and berries | ||
| Vegetables |
Source: author’s development.
Table 6.
FSCA–RFS gaps in various agricultural and trade policy frameworks, percentage points.
| Periods | Meat and Meat Products | Milk and Dairy Products | ||||
|---|---|---|---|---|---|---|
| Beginning of the Period | End of the Period | Period Balance | Beginning of the Period | End of the Period | Period Balance | |
| 1: 1991–1994 | 28.2 | 9.6 | −18.6 | 6.4 | 6.0 | −0.4 |
| 2: 1995–1998 | 15.2 | 22.5 | +7.3 | 14.4 | 26.3 | +11.9 |
| 3: 1999–2006 | 23.8 | 15.5 | −8.3 | 28.1 | 20.3 | −7.8 |
| 4: 2007–2008 | 15.0 | 17.2 | +2.2 | 14.4 | 14.6 | +0.2 |
| 5: 2009–2012 | 14.9 | 5.6 | −9.3 | 18.6 | 18.2 | −0.4 |
| 6: 2013–2016 | 7.7 | 14.1 | +6.4 | 18.0 | 22.7 | +4.7 |
Source: author’s development.
© 2017 by the author. Licensee MDPI, Basel, Switzerland. This article is an open access article distributed under the terms and conditions of the Creative Commons Attribution (CC BY) license (http://creativecommons.org/licenses/by/4.0/).
Share and Cite
MDPI and ACS Style
Erokhin, V. Self-Sufficiency versus Security: How Trade Protectionism Challenges the Sustainability of the Food Supply in Russia. Sustainability 2017, 9, 1939. https://doi.org/10.3390/su9111939
AMA Style
Erokhin V. Self-Sufficiency versus Security: How Trade Protectionism Challenges the Sustainability of the Food Supply in Russia. Sustainability. 2017; 9(11):1939. https://doi.org/10.3390/su9111939
Chicago/Turabian StyleErokhin, Vasilii. 2017. "Self-Sufficiency versus Security: How Trade Protectionism Challenges the Sustainability of the Food Supply in Russia" Sustainability 9, no. 11: 1939. https://doi.org/10.3390/su9111939
Note that from the first issue of 2016, this journal uses article numbers instead of page numbers. See further details here.